 Ivan Azarov
 Gabriel Helmlinger
 Yuri Kosinsky
 Kirill Peskov
95% of researchers rate our articles as excellent or good
Learn more about the work of our research integrity team to safeguard the quality of each article we publish.
Find out more
ORIGINAL RESEARCH article
Front. Appl. Math. Stat. , 26 October 2022
Sec. Mathematical Biology
Volume 8 - 2022 | https://doi.org/10.3389/fams.2022.993581
Anti CTLA-4 therapy is aimed at blocking the Cytotoxic T-lymphocyte antigen-4 (CTLA-4), a key cancer immunity cycle checkpoint. The mechanism of action of CTLA-4 may be described as a dynamic competition for the B7 ligand which, subsequently, interferes with the CD28-B7 costimulatory pathway. Anti CTLA-4 blockade enhances the process of cognate T cell activation and leads to a broadening of the T cell repertoire. In the present work, we used an agent-based modeling (ABM) platform of T cell immune response development, to explore hypothetical modes of anti CTLA-4 action. The model features a selected number of activated T cell clones, calculated based on combined random and chemotactically-driven encounters with antigen-presenting dendritic cells (DCs) and a distribution of individual T cell affinities to the antigen of interest. The proposed model can be used as a quantitative tool to explore various hypotheses on T cell immunity regulation and validate these against experimental data. A comprehensive ABM model analysis of immune response dynamic simulations revealed several putative anti CTLA-4 mechanisms of action, including: (i) an increase in the probability of primary activation of lymphocytes; (ii) T cell activation enhancement via a prolongation of short contacts with dendritic cells; and (iii) an increase in the maximum level of activation signal (or saturation), accumulated through a series of short contacts with DCs. The modeling work further demonstrates that it is only when considering jointly these various modes of anti CTLA-4 effects on the T cell immune response dynamics that a biologically meaningful increase in both the production of activated cells and the expansion of the T cell repertoire is observed. These model-based results are overall consistent with the collective biological knowledge on the functional role of CTLA-4. Furthermore, the ABM presented here may allow to interrogate various mechanistic scenarios underlying adverse events mediated by anti CTLA-4 pharmacologic therapies.
Cytotoxic T-lymphocyte antigen-4 (CTLA-4) expressed on the surface of activated T cells is a critical immune checkpoint, given its role in the early-stage T cell response development. A dynamic competition for B7 ligands expressed on the surface of antigen-presenting cells (APCs) occurs, between CD28 co-stimulatory and CTLA-4 inhibitory molecules. CTLA-4 exhibits a 20-fold higher affinity for the B7 ligand vs. CD28, resulting in a decrease in T cell activation [1, 2]. The critical role of this immune checkpoint molecule in maintaining self-tolerance and protecting the body from autoimmune reactions has been demonstrated experimentally in CTLA-4 knockout mice, an animal model which exhibits fatal autoimmune disease at 3–4 weeks of age [3, 4].
CTLA-4 may thus affect multiple effector functions in immune cells. For example, based on in vitro migration tests and in vivo two-photon laser-scanning microscopy, Schneider et al. showed that CTLA-4 increases T cell motility by blocking the formation of the immunological synapse between a T cell and an antigen-presenting cell (APC), which subsequently resulted in reduced cytokine production and T cell proliferation. The role of CTLA-4 as a gatekeeper of conjugation and stable immune synapses formation has been demonstrated [5]. In addition, CTLA-4 engagement has been reported to block the activation of transcription factors such as NF-κB, NF-AT, and AP-1, as well as Ca2+ mobilization and PLC-γ1 phosphorylation in activated T cells in vitro [6]. Studies using T cells derived from CTLA-4-deficient mice revealed that CTLA-4 also controls the expression of a negative intercellular adaptor protein, Cbl-b, critical to the threshold for T cell activation [7]. Additionally, CTLA-4 engagement inhibits IL-4-dependent signaling and activation of STAT6, leading to a tight control over Th2 cell differentiation [8]. Another mechanism underlying CTLA-4-mediated T cell suppression may involve its ability to influence the cell cycle, e.g., via cell cycle arrest in the G1 phase [9].
In addition to its direct effects on T cell activation, CTLA-4 may also attenuate the ability of APCs to activate T cells. For example, Qureshi et al. further revealed a mechanism of CTLA-4 action via decreased B7 molecule density on the surface of APCs, through trans-endocytosis [10]. High CTLA-4 expression on Tregs and B7 (CD80/86) ligation by CTLA-4 enhanced indoleamine 2,3-dioxygenase (IDO) activity of DCs and monocytes [11]. IDO is an immuno-modulatory enzyme involved in tryptophan catabolism. Upon inflammation, IDO production may reduce T cell proliferation and promote T cell anergy. IDO expression by plasmatic DCs (pDC) in a lymph node (LN) at steady-state is dependent on MHCII-restricted Ag-specific interactions with Treg. Treg CTLA-4 molecules binding to cell-surface expressed costimulatory molecules promote IDO production by pDCs through IFN-γ or IFN-α/β signaling. As a result, a mutual activation of Treg and DC may occur, leading to an increase in the suppressive properties of the system. CTLA-4-binding also promotes IDO production at tumor sites. Across all pDC populations in tumor-draining LNs, IDO has been associated with differentiating and suppressive functions [11–13]. Thus, natural Tregs may critically require CTLA-4 to suppress immune responses, by affecting the potency of DCs to activate other T cells [14].
With such pleiotropic effects at molecular and cellular levels, it can be expected that CTLA-4 plays a pivotal role as a master regulator within the cancer immunity cycle [15]. This view has been exploited clinically in immuno-oncology, with the recent successes of several anti CTLA-4 therapies, which have resulted in improved survival in patients with metastatic cancers [16]. Phenotypically, Robert et al. showed an expansion of unique TCR Vβ CDR3 sequences in T cells in blood, following the administration of the anti CTLA-4 antibody tremelimumab in patients with metastatic melanoma, demonstrating an enhancement of T cell diversity [17]. However, while increases in the number of unique productive sequences and absolute lymphocyte counts were observed, there was no expansion of tumor antigen specific clones [17]. Conversely, Kvistborg et al. demonstrated that treatment with the anti CTLA-4 ipilimumab resulted in a broadening of melanoma-specific CD8+ T cells repertoire, with tumor recognition potential [18]. It has also been shown that ipilimumab treatment in patients with metastatic castrate-resistant prostate cancer resulted in further diversification of the T cell repertoire, potentially causing a higher incidence of immune-mediated adverse effects (imAEs) [19]. Similar trends have been observed in patients with advanced melanoma [20] and metastatic pancreatic cancer [21]. In particular, a majority of patients who exhibited TCR diversification with both low baseline clonality and a higher number of expanded clones also experienced significantly longer survival times [21].
Despite the growing and continued accumulation of clinical data, there are still knowledge gaps in the mechanistic understanding of CTLA-4 action [22]. For example, it is not fully understood which of the aforementioned anti CTLA-4-dependent effects would drive clinical anti-tumor response and related imAEs [23]. In this modeling study, we explored a number of hypotheses on anti CTLA-4 modes of action, using a previously developed agent-based modeling platform [24]. Specifically, we quantitatively explored how the duration and dynamics of T cell-to-DC contacts in a lymph node may affect T cell repertoire diversification and the related intensity of the immune response, along with key parameters which may control these processes.
The present work is based on a previously presented agent-based modeling (ABM) framework that describes the development of an immune response in the context of lymph nodes (LN) [24]. Briefly, this two-dimensional spatial ABM considers the collective behavior of two agent types — T cells and antigen-presenting DCs — within the LN T zone. The simulation space represents a portion of the LN T zone as a lattice of 100 × 100 patches, resulting in an effective physical surface area of 500 × 500 μm2 (or 5 × 5 μm2 per patch). In past simulation scenarios, 2,000 naïve T cells were randomly placed in the domain, along with eight antigen-bearing DCs which were placed randomly in eight fixed positions, with the assumption that antigen-presenting DCs have limited motility in the LN T zone. The T cell number-to-DC number ratio (8:2,000) in the model was chosen to reflect physiological values [25]. Each 5 × 5 μm2 patch was set to contain, at most, one T cell. DCs are typically larger than T cells; thus, it was assumed that a given DC would cover for a space of 5 patches, with DCs thereby forming cross patterns in the lattice. All details of the model are presented graphically in Figure 1. These initial conditions, in the given geometric design, would allow each DC to interact with up to 11 neighboring T cells simultaneously [24].
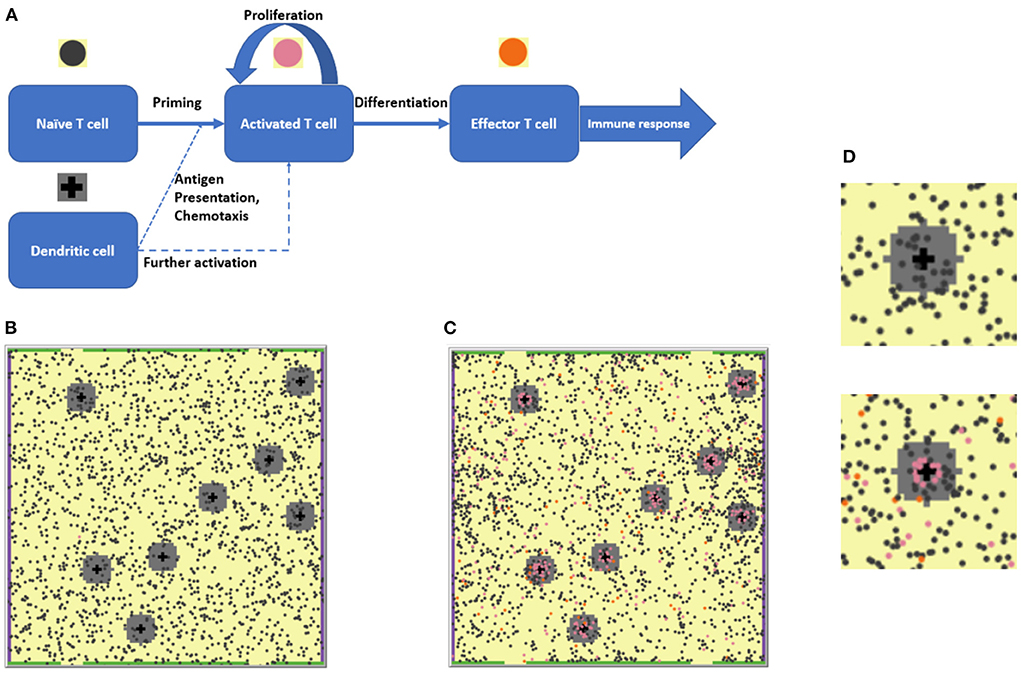
Figure 1. (A) The agent-based modeling (ABM) framework: Schematic of states and processes of the two main agents, T cells and dendritic cells (DCs) represented in the model. (B) 2D ABM model simulation snapshot at the beginning of a simulation: 2,000 naïve T cells (dark gray circles) are present. (C) Snapshot of that particular simulation on Day 28: A number of naïve and activated T cells (pink circles) proliferated and differentiated into effector T cells (orange circles). (D) Enlarged fragments of snapshots (B,C), with the upper left DC seen in (B,C) surrounded by a chemokine cloud and T cells at various stages of activation. The upper panel corresponds to the simulation start, the lower panel corresponds to the 28th simulation day.
The work used the following time scale: one time step (tick) in the NetLogo software (see section Software packages) would correspond to 30 s of the simulated biological system. All parameters describing T cell movement were taken from the previously published work [24].
The 2D ABM model was specifically designed to efficiently reproduce experimentally observed T cell motility characteristics. In a 2D model framework, it is not possible to consider the spatial network of reticular fibroblasts, which T cells may mobilize to “glide over.” Also, it is not possible to link the physical density of T cells in the LN T zone with the 2D density in the ABM model. The number of T cells was chosen empirically to avoid “traffic jams” in the 2D model space while, at the same time, maintain realistic motility characteristics of T cells.
Periodic boundary conditions were applied to the left- and right-hand sides of the computational domain: if a T cell were to leave the domain through one side, it would be allowed to immediately re-appear from the other side of the domain, moving in the same direction. In contrast, T cells were not allowed to randomly go through the top and bottom boundaries of the computational domain. These boundaries, instead, contained “open patches,” functionally corresponding to medullary sinuses (MS) and efferent lymphatics in a LN. Accordingly, if a T cell were to leave the computational domain through an MS patch at either the top or bottom side, a new T cell would be allowed to enter the computational domain, from a random position within the modeled LN. These settings thus allowed to maintain an overall constant T cell density in the system under study. In the model, we implemented 32 open patches, as MS-like escape structures for T cells. An optimal total number of open patches was estimated in the previously published article [24]. Using this MS size, experimental mean transit times of T cells through the T zone were correctly reproduced. Importantly, new T cells appearing in the simulation space (to compensate for those having left through MS-like open patches) were introduced with a random affinity number and only if the current count of total T cells in the T zone remained below 2,000.
A key modification in the present work, as compared to the previously published ABM framework, is the computational implementation of a continuous distribution of TCR affinities to specific antigen presented on the surface of DCs. Thus, instead of a Bernoulli type distribution that corresponds to either cognate or non-cognate lymphocytes generated in the computational domain, we used a Gamma type distribution. Accordingly, the affinity of a newly appearing lymphocyte may range from 0 to 1, where a value of “0” captures a completely non-cognate lymphocyte and a value of “1” defines a T cell with a very high TCR affinity to the presented antigen. The affinity of a newly appearing lymphocyte is randomly generated so that, overall, TCR affinities of all T cell clones are distributed according to an exponential law, with a single parameter E[Aff] acting as the mean TCR affinity over all T cells in the LN. A forced cutoff value of “1” (maximal cognate affinity) was applied to simulated affinities larger than one.
The resulting probability density function can thus be expressed as Equation 1:
where 𝔼[Aff] effectively represents the distribution mean value.
An exponential distribution was used to obtain a reasonable balance between cognate (high TCR affinities) and non-cognate (low TCR affinities) T cell clones. The proposed model modification is in good agreement with immunology basics, as it allows for a description of the physiological distribution of TCR affinities for multiple naïve T cell clones, whereby lymphocytes with highly specific TCRs constitute a minority.
For simplification, only single specific antigens were considered in the model. Thus, the phenomenon of cross-reactivity, i.e., the ability of T cells to recognize more than one antigen structure was not considered.
According to our previously published work, T cell motion may switch from a random walk mode to a more directed chemokine concentration gradient motion toward the DC [24]. In order to account for chemotaxis strength, a specific parameter representing the probability of performing a directed step (instead of a random step) toward the nearest DC center was introduced. A probability of 1/3 for a directed step was used in all simulations, as used in our previous modeling work [24].
We assumed that the probability of T cell priming, Pprime, depends on its TCR affinity to the antigen, and used a Hill equation (Equation 2) to describe this dependence:
where Aff is the affinity of a T cell receptor to the antigen presented on a DC; n is the Hill coefficient; Kprime is an arbitrary constant of priming (affinity corresponding to a priming probability of 0.5). There is no experimental information to precisely estimate n and Kprime; we thus set n = 5 and Kprime = 0.2 as default values. Model sensitivity to key parameters was evaluated in simulation exercises using a simple “one-at-a-time approach,” which does not allow to explore the entire parameter space but gives an idea of each parameter contribution.
A naive T cell, which should have been primed according to Equation 2, was set to form a first stable contact with a DC for ~24 h. The duration of contact for each T cell was modeled as a random value generated from a normal distribution, with a mean of 24 h and a variance of 2 h; a T cell may become activated only upon completion of such a contact.
Short contacts may further occur between DCs and T cells that have already been activated; these short contacts result in an incremental activation and subsequent divisions. Similarly to the model by Bogle et al. [25, 26], we assumed that the TCR activation signal could be accumulated over time during serial contacts with antigen-presenting DCs. When, during a short contact, the T cell activation level (S) exceeds such a key parameter as activation level threshold Sthr, the T cell may initiate the cell division process.
We described the duration of short contacts using Equation 3, a formula which has been adapted from previously published ABM work [26]:
where Aff is the TCR affinity to the antigen presented on the DC; n is the Hill coefficient. Kprolif represents the affinity of T cells with a short contact duration corresponding to the half of the maximal duration Tmax. Tmax, in turn, is independent of the affinity of a particular clone and is distributed according to a lognormal law (μ = 20 min, σ2 = 10), to avoid a complex relationship between affinity and duration of short contacts.
As long as a contact between a T cell and a DC is maintained, and upon each additional DC encounter, an activation signal keeps building up. To account for this mechanistic behavior, the activation level of a T cell, S(t), was set to start increasing to a certain saturation level along a sigmoid curve and according to a logistic equation as described by Equation 4:
where S0 is the T cell activation level at the beginning of the cognate contact; α controls the saturation level of the activation signal—its value is directly related to the activation level threshold; β is the time to reach that activation level threshold. During a short contact and while the activation signal builds up, only a small percentage of T cells would reach activation status; to this end, we set default values for α and β of, respectively, 2.0 and 0.02 min−1. The value of β was chosen to be sufficiently small, to prevent the maximal T cell activation level (S0 + α) to be reached within the duration of a single short contact. This allowed to model the hypothetical dependence between short contact duration and the activation level dynamics.
For activated T cells situated outside any DC contact zone, the activation level was set to decrease according to an exponential law, as described by Equation 5, a formula taken from previously published ABM work [25]:
where λ is a half-life period of 8 h and S0 is the activation level at the start of activation level decay.
Figure 2 illustrates typical model-simulated T cell activation level S(t) dynamics. The T cell activation level threshold value, Sthr, is a critical model parameter, as it ultimately affects the proliferation intensity of activated T cells. For the simulations presented here, we selected a value of Sthr = 2.0, close to the average S(t) value for all activated T cells represented in the computational domain.
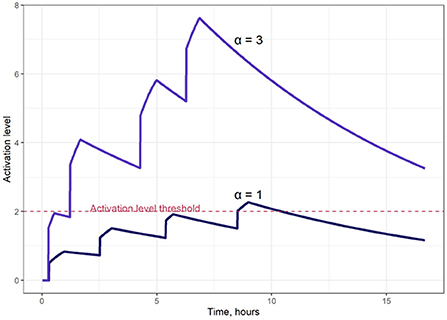
Figure 2. Examples of T cell activation dynamics, for two different saturation levels of the activation signal (parameter α in Equation 4); α = 1 (lower curve); α = 3 (upper curve).
Two factors appeared to limit the proliferation of activated T cells: (i) the minimal time between T cell divisions (random value generated from a normal distribution with a mean of 8 h and a variance of 1.25 h, for each newly formed T cell)—this time was set between successive T cell divisions as the minimal time interval between two divisions; and (ii) the maximal number of activated T cell divisions allowed (uniformly distributed, random value from 2 to 18 divisions, with an average of 10 divisions).
Once a T cell reached effector status, it was no longer allowed to divide further and was eliminated from the computational domain within 24 h. Also, to avoid a supra-physiologic increase in overall T cell density (due to multiple T cell divisions), the following rule was added to the agent-based model: “if the total number of T cells exceeds the pre-set equilibrium value of 2000, then no new T cells would be allowed to enter the domain.”
Given our modeling objective to better understand potential CTLA-4-dependent effects, we sought to quantitatively assess the number and distribution of activated T cells in a lymph node. To this end, we investigated the following outcome measures:
• Dynamics of activated T cells and numbers of effector T cells in the computational domain – in simulations of up to Day 28;
• The cumulative outflux of activated and effector T cells – we considered this measure as a characteristic outcome of the adaptive immune response intensity;
• Mean affinity values of activated T cells and T cell effectors leaving the LN compartment through medullary sinuses over the 28 days of simulation, along with a calculated distribution of affinities. These characteristics may quantitatively illustrate CTLA-4 effects on the TCR repertoire diversity and expansion.
Calculations of prediction intervals (90% PI) for each of the model outcomes were performed via 50 independent ABM simulations, using identical model parameter values, yet different randomly generated initial T cell and DC positions within the computational domain.
Based on the proposed ABM agents and rules, two subsets of model parameters may be delineated: (i) those parameters associated with T cell activation dynamics; and (ii) those parameters related to the influence of TCR affinity on T cell priming and expansion. Parameters within each subset were measured using consistent units and drove similar biological processes.
The first subset of parameters relates to the level of T cell activation, which increases during contacts with DCs. It includes the threshold activation level, Sthr, and the saturation value of the activation level during one contact, α. Here, we fixed Sthr = 2 and varied α to account for CTLA-4 blocking, e.g., “1” for control immunosuppressive conditions and “3” for anti CTLA-4 blocking effect. These parameter values agree with experimental observations showing that anti CTLA-4 blockade does not alter the settings for intercellular interactions (Sthr), but rather makes the TCR activation signal stronger [27].
The second set of parameters includes the T cell mean affinity, 𝔼[Aff], and the half-maximal effective affinity (similar to an EC50 value), with effects on the primary activation, Kprime, and the duration of short contacts, Kprolif. Here we fixed 𝔼[Aff] = 0.02, since there was no literature-based evidence of an increase in affinity across activated cells and/or effector cells; only an expansion of the clonal repertoire has been reported [17, 18]. Therefore, Kprime and Kprolif values were varied to mimic CTLA-4 blockade; i.e., higher Kprime and Kprolif values of 0.02 meant higher required affinities for activation and corresponded to control conditions, while lower Kprime and Kprolif values of 0.01 were used to model anti CTLA-4 therapy.
All scripts and program modules were written using NetLogo, an agent-based programming language [28]. Calculations were carried out within the NetLogo 6.1.1 computational tool. Data processing and visualization of simulation results were performed in the R 3.5.1 statistical language using the tidyverse 1.2.1 set of packages, which includes ggplot2 3.3.2 and dplyr 0.8.3. All calculations were performed on a desktop computer with an Intel Core i9-9980XE CPU (18 cores, 3.00 GHz each with 2 logical threads). We used one thread per one ABM run. An average CPU time of ~50 mins per ABM simulation was estimated. Additional details on model development and analyses, such as the setting of parameter values, results of explorations of the model parameter space, as well as NetLogo 6.1.1 model scripts are provided in the Supplementary material. The NetLogo 6.1.1 model code, as well as the R scripts representing the plot production have also been uploaded to an open-source repository and are available under: https://github.com/Potamophylax/ABM_anti-CTLA-4/.
Based on the currently available experimental data, we investigated three primary hypotheses of CTLA-4-dependent modes of action in a LN: (I) an increase in the probability of priming [18, 21]; (II) an increase in the duration of short contacts [17]; and (III) an increase in the magnitude of the activation signal during short contacts [27]. As a fourth hypothesis, we also investigated outcomes for combinations of these mechanisms. To test the hypothesis (I), CTLA-4 was allowed to modulate the value of the Kprime parameter in Equation 2, which links the TCR affinity to the probability of priming. To test hypothesis (II), CTLA-4 was allowed to regulate T-cell proliferation by modulating the Kprolif parameter in Equation 3, which links the TCR affinity to the duration of short contact. To test hypothesis (III), CTLA-4 was allowed to regulate the α parameter in Equation 4, which modulates the activation signal accumulation during the short-contacts phase of T cell proliferation. We then also explored all possible combinations of these three CTLA-4 mechanisms of action. Corresponding numerical experiments were performed using the proposed 2D ABM framework. All graphs representing activated T cell dynamics (Figures 3A, 4A, 5A, 6A) are based on measurements from 50 simulations of 28 days each. Lines represent median values; shaded areas represent 90% PI. The comparative T cell affinity distributions (Figures 3B, 4B, 5B, 6B) were built based on LN T cell production during long steady-state periods – 280 days of simulation. TCR affinity distributions of activated T cells represent the TCR repertoire diversity in control and anti CTLA-4 blocking therapy conditions.
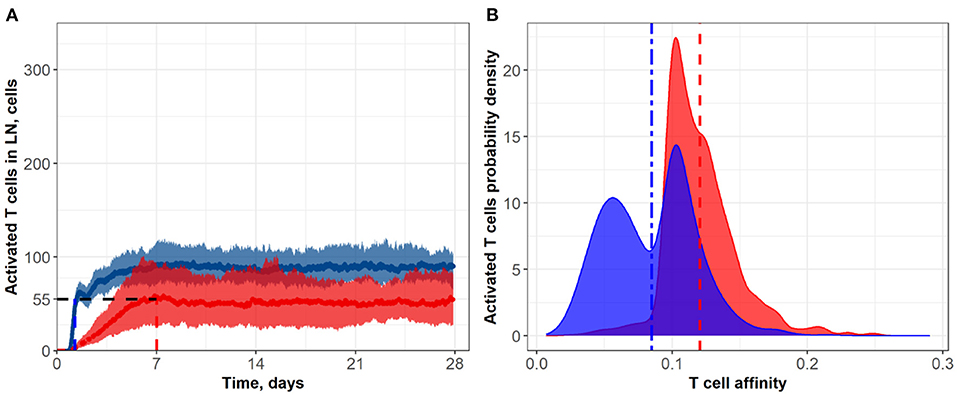
Figure 3. (A) Population dynamics of activated T cells in the LN T zone during immune response initiation: Control conditions (red) and after administration of an anti CTLA-4 blocking antibody (blue). (B) Affinity distributions of activated T cells: Dotted vertical lines represent mean affinities for control and anti CTLA-4 conditions. Scenarios used different affinities corresponding to a 50% priming probability Kprime: 0.1 (blue; anti CTLA-4 blocking antibody) and 0.2 (red; control). Corresponding data files are available at the free repository GitHub at: https://github.com/Potamophylax/ABM_anti-CTLA-4/tree/main/Numerical%20Results/Hypothesis%20I.
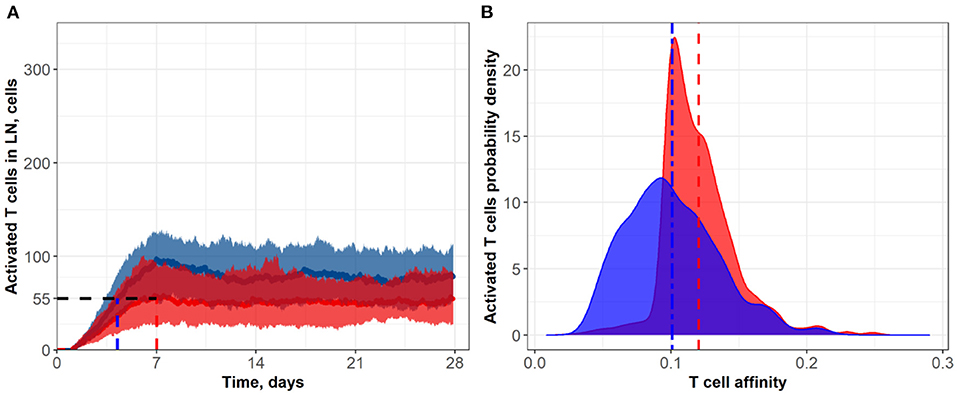
Figure 4. (A) Population dynamics of activated T cells in the LN T zone during immune response initiation: Control conditions (red) and after administration of an anti CTLA-4-blocking antibody (blue). (B) Affinity distributions of activated T cells: Dotted vertical lines represent mean affinities for control and anti CTLA-4 conditions. Simulations were run under scenarios with different affinities that corresponded to a semi-maximal duration of short contacts, Kprolif: 0.1 (blue; anti CTLA-4 conditions) and 0.2 (red; control). Corresponding data files are available at the free repository GitHub at: https://github.com/Potamophylax/ABM_anti-CTLA-4/tree/main/Numerical%20Results/Hypothesis%20II.
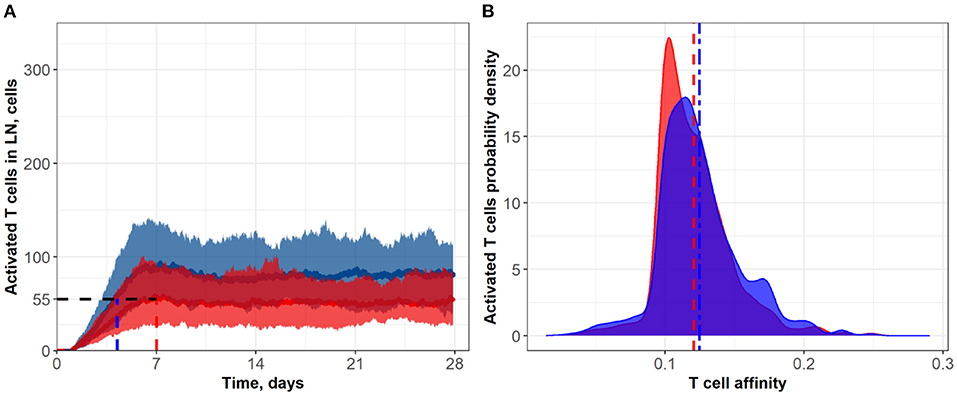
Figure 5. (A) Population dynamics of activated T cells in the LN T zone during immune response initiation: Control conditions (red) and after administration of an anti CTLA-4 blocking antibody (blue). (B) Affinity distributions of activated T cells: Dotted vertical lines represent mean affinities for control and anti CTLA-4 conditions. Simulations were run under scenarios with different values for the activation signal amplitude: α = 3 (blue; anti CTLA-4 conditions) and α = 1 (red; control). Corresponding data files are available at the free repository GitHub at: https://github.com/Potamophylax/ABM_anti-CTLA-4/tree/main/Numerical%20Results/Hypothesis%20III.
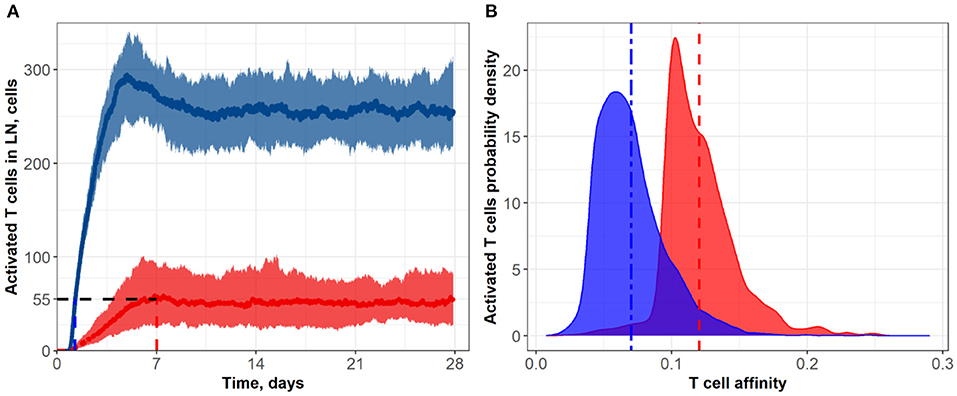
Figure 6. (A) Population dynamics of activated T cells in the LN T zone during immune response initiation: Control conditions (red) and after administration of an anti CTLA-4-blocking antibody (blue). (B) Affinity distributions of activated T cells: Dotted vertical lines represent mean affinities for control and anti CTLA-4 conditions. Values used for simulations: α = 3, Kprime = 0.1, Kprolif = 0.1 (blue; anti CTLA-4 conditions); and α = 1, Kprime = 0.2, Kprolif = 0.2 (red; control conditions). Corresponding data files are available at the free repository GitHub at: https://github.com/Potamophylax/ABM_anti-CTLA-4/tree/main/Numerical%20Results/Hypothesis%20IV.
In a first set of ABM numerical experiments, we investigated the effect of CTLA-4 inhibition on the probability of T cell priming. Here, we assumed that the administration of an anti CTLA-4 blocking antibody would cause a two-fold decrease in Kprime, as compared to control conditions. As shown in Figure 3, the model-based application of a CTLA-4 inhibitory effect led to a ~two-fold increase in the steady-state level of activated T cells in the system. In addition, an increase in the priming probability caused by the anti CTLA-4 action significantly boosted the rate of activated T cells accumulation. The CTLA-4 blockade also led to a faster (1.25 vs. 7 days) attainment of a steady state in the immune activation level, potentially caused by an accelerated T cell proliferation (Figure 3A). As shown in Figure 3B, the corresponding mean affinities of activated T cell distributions were 0.120 and 0.085 for control and CTLA-4 inhibition scenarios, respectively.
It is noteworthy that a change in the priming probability resulted in a bimodal affinity distribution of activated T cells (Figure 3B). This can be explained by the fact that the balance between the number of T cells with a certain affinity in the computational domain and the affinities of semi-maximal priming probability and semi-maximal duration of short contacts, Kprime and Kprolif values, are important. In the described system, two local maxima appear. Presumably, the first distribution density peak may be associated with the primary activation of low-affinity cells, due to low requirements on Kprime. The second peak may be the result of primary activation and further slow proliferation of higher affinity clones, which represent a minority of cells. If we remove the difference between Kprime and Kprolif, the two affinity density peaks coalesce. A similar behavior with two peaks was observed when considering the action of anti CTLA-4 on the two model parameters: Kprime and α (see Supplementary Figure S2).
In a second set of numerical experiments, we considered an anti CTLA-4 action during the proliferation stage of T cells and its effect on the duration of short contacts between activated T cells and DCs. A decrease in Kprolif and, consequently, an increase in the number of sufficiently long contacts for incremental activation of clones with low TCR affinity led to an increase in the steady-state level of activated T cells in the system. Figure 4 shows the effect of a two-fold decrease in Kprolif from a control value of 0.2, as caused by CTLA-4 inhibition. Interestingly, under this simulation scenario, the dynamics of the immune response activation appear to be significantly slower compared to the case where anti CTLA-4 affects the T cell priming probability. The number of activated T cells thus reaches a plateau around Day 14, under anti CTLA-4 conditions, vs. Day 7 under control conditions. Under anti CTLA-4 conditions, the steady-state value fluctuates around 80 T cells. In this second scenario of CTLA-4 blockade, the TCR affinity distribution has broadened: corresponding standard deviations were 0.034 vs. 0.026 (see Table 1). Also, this scenario resulted in a moderate decrease in the mean of TCR affinity distributions (0.10 vs. 0.12; see Figure 4B). Therefore, an increase in the duration of short contacts for activated T cells, with further cell division and proliferation, led to a spreading of affinity distribution, with sub-populations of cells of lower affinities in the computational domain, as compared to control conditions (no CLTA-4 inhibition).
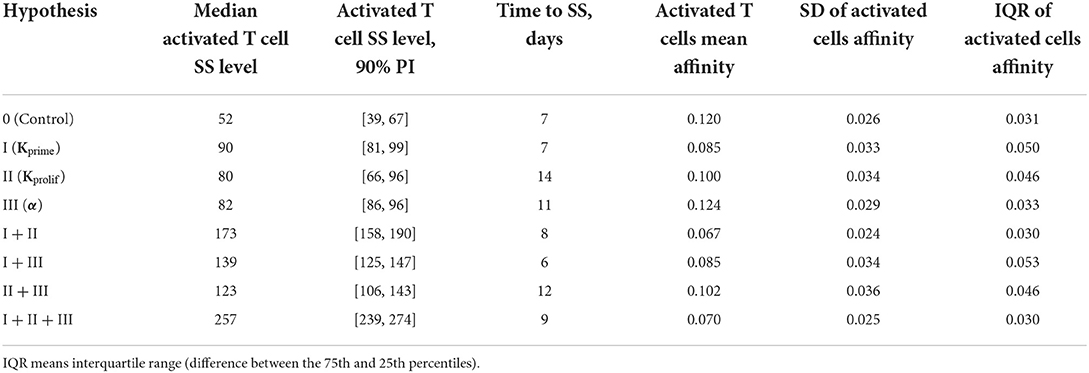
Table 1. Comparison of various anti CTLA-4 mechanism-of-action hypotheses and their possible combinations, in terms of activated T cell steady-state levels in LN and affinity distributions of activated lymphocytes leaving the lymph nodes.
In a third set of in silico experiments, we explored effects following modulation of the maximal signal level, α, which can be reached during a single contact between an activated lymphocyte and an APC. In these experiments, α was assumed to be affected by CTLA-4 inhibition. The higher the saturation level in a single short contact, the lower the number of short contacts required to reach the threshold level, Sthr, and the more intensive the activation of T cell clones in the system. We tested values for α of 1 and 3 for control and CTLA-4 inhibition scenarios, respectively (Figure 5). Similarly to the second set of numerical experiments, slow dynamics in immune activation were observed under treatment. The number of activated T cells reached a plateau at ~Day 11 (anti CTLA-4 conditions) vs. ~Day 7 (control). Immune response activation led to a 1.5-fold increase in the level of activated T cells (see Figure 5A). This third hypothesized mechanism of action of CTLA-4 inhibition exhibited the smallest and a nearly non-significant effect on the final distribution of activated T cell affinities (see Figure 5B); mean affinities of activated T cells were 0.120 and 0.124 for, respectively, control and anti CTLA-4 conditions (Figure 5B).
In a fourth set of numerical experiments, we explored the effects of combining all three hypothesized mechanisms of action of an anti CTLA-4 blocking antibody, namely: (I) an increase in the probability of priming; (II) an increase in the duration of short contacts; and (III) an increase in the magnitude of the activation signal during short contacts. As shown in Figure 6 and Table 1, the combined effects of all three mechanisms exceeded the sum of the effects at steady-state regime incurred via each mechanism taken separately, which allows us to declare the independence of these mechanisms and dissect out additive vs. synergistic effects based on these multiple mechanisms. Under CTLA-4 inhibition conditions, a nearly five-fold increase in activated T cells and an accelerated proliferation of activated T cells was reached: the number of activated T cells—as observed in the control group—was reached within 1.25 days (see Figure 6A). Under this fourth scenario testing anti CTLA-4 mechanisms of action in combination, a clear effect on the final distributions of activated T cell affinities was observed, during development of the immune response. For activated T cells, mean affinities were 0.12 (control) vs. 0.07 (CTLA-4 inhibition conditions) (Figure 6B). According to this fourth scenario, the immune response development may thus result in a significant shift in T cell affinities, away from the antigen of interest, yet with a corresponding increase in T cell numbers.
A compelling observation was also made, when comparing the numerical testing of single vs. combination hypotheses. In single hypothesis scenarios, the density distributions plots for control vs. CTLA-4 inhibition conditions overlapped significantly; when combining hypotheses, these distributions overlapped only slightly (Figure 6B). One explanation may be that most of the rare high-affinity T cells simply lose most of their “advantage” in search for contacts with DCs, under conditions of combined mechanism-of-action hypotheses. The main source of de novo added T cell clones (vs. control) to participating in the immune response build-out would be low affinity T cell clones. If so, the proportion of high-affinity clones would decrease against an increase in low-affinity clones which will have gained the opportunity to proliferate.
Simulation results and graphs for the single and pairwise testing of anti CTLA-4 mechanistic hypotheses (via testing of various parameter combinations) are given in the Supplementary materials to this paper. A tabular comparison of all tested anti CTLA-4 mechanistic hypotheses and their combinations is presented here in Table 1.
To compare the effects of various anti CTLA-4 mechanistic hypotheses, we used Equation 6 to describe the effect of anti CTLA-4 blocking therapy:
where Effhyp represents the effect of blocking therapy according to one of the enunciated hypotheses, NTChyp is the median value of activated T cell numbers at steady-state (with anti CTLA-4 inhibition according to one of the hypotheses), and NTCControl is that same median value under control (no anti CTLA-4) conditions.
To consider potential synergistic effects (ΔEffhyp) when simulating two or three mechanistic hypotheses in combinations, we used Equation 7 to describe the “effect differential” between the total effect of a given hypothesis (Effhyp) and the sum of the effects which would have resulted from the elementary mechanistic hypotheses taken separately (Effhypi):
where Effhyp is calculated according to Equation 6.
As shown in Table 2, of the three individual anti CTLA-4 mechanism-of-action hypotheses, it is the increase in the priming probability which had the greatest effect on the level of activated lymphocytes: EffI = 38. A super-additive effect was observed and was greatest when considering a combination of mechanisms (I + II), namely, the simultaneous action of anti CTLA-4 inhibition on Kprime and on the duration of short contacts (Kprolif): EffI+II = 55. When the three hypothesized anti CTLA-4 inhibition mechanisms were considered jointly, this super-additive effect became even greater with EffI+II+III = 109.
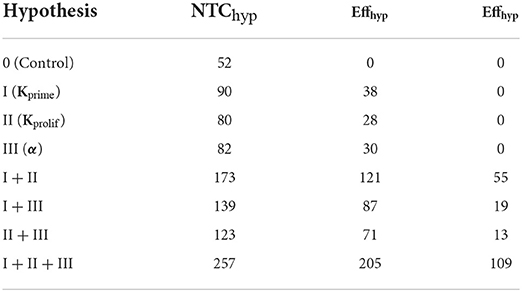
Table 2. Calculated effects of anti CTLA-4 inhibition for the various mechanistic hypotheses, as estimated using Equations 6, 7 (for combinations of hypotheses).
Anti CTLA-4 inhibition reduced the mean affinity of activated T cells, if implemented through mechanisms I and II. On the contrary, an increase in the amplitude of the activation signal α (mechanism III) slightly increased the mean affinity. Combinations of mechanisms (I + II) and (I + II + III) thus reduced the mean affinity by the greatest extent (by nearly 45%), as shown in Table 1.
However, it is interesting to note that anti CTLA-4 inhibition did not have a clear effect on the spread of the activated T cell affinity distribution (Table 1). Hypothesized mechanisms (I + II) and (I + II + III) resulted in a narrowing of the affinity distributions by 7 and 3%, as compared to immunosuppressive control conditions. All other hypothesized mechanisms led to a more pronounced spread of the affinity distribution. The greatest spread was obtained for a combination of mechanisms (I + III) and (II + III)—to up to 71%.
In this modeling study, we updated a previously developed ABM framework [24] and used the extended model to better characterize functional consequences under various mechanisms of action underlying anti CTLA-4 inhibition. We focused here on anti CTLA-4 modulation of T cell-to-DC interactions in a LN and the subsequent development of T cell immune response. Using multi-agent model simulations, we revealed emergent system behavior characteristics which may arise from multiple and specific cell-cell interactions.
Several laboratories have explored and reported anti CTLA-4 inhibition dynamics, with their subsequent effects, at a molecular level. Jansson et al. [29] developed a framework for the quantitative analysis of costimulatory complex formation, considering B7-ligand binding with CTLA-4 and CD28 receptor molecules, respectively, within the immunological synapse. The effects of antibody mediation on the complex formation at synapse level were modeled by Ganesan et al. [30]; the authors analyzed the effects of adding anti CTLA-4 antibodies, on the immunological balance between co-stimulatory interactions (formed by CD28 and B7 ligands) and co-inhibitory interactions (formed by CTLA-4 and B7 ligands) at the synapse, using a free diffusion model. In parallel, the current ABM work uses molecular level representations and translates these into meso-level effects within tissues and organs.
Spatial multi-agent ABM describing immune checkpoint inhibitors (ICI) and their functional consequences have been used previously. Gong et al. [31] examined the effects of immunotherapy using a stochastic approach. However, this earlier study was devoted to the action of anti PD(L)-1 therapies. Also, the main compartment considered by these authors was the tumor tissue itself, while we focused here on the LN T zone as the main site for immune response initiation and CTLA-4 dependent effects. Additionally, agent-based modeling might not represent the most appropriate modeling approach when describing highly densely packed tissues such as solid tumors, where newly dividing cells are in close proximity to each other, thereby limiting spatial effects mediated by, e.g., cellular migration [24].
Similar limitations may apply to the modeling work presented by Kather et al. [32]; despite the abundance of anti-cancer therapy types considered by the authors, they did not consider direct effects of anti CTLA-4 inhibition, since their work was focused on the in silico reproduction of tumor structures, rather than systemic effects on immune T cell response initiation.
A complex systems pharmacology model based on differential equations has been presented by Wang et al. [33]. This mechanistic, 4-compartment systems model considered central, peripheral, tumor-draining LN, and tumor compartments. The main quantitative output of this modeling effort was the prediction of tumor tissue growth dynamics (tumor diameter) under anti CTLA-4, anti PD-L1 mono-therapies and their combinations; the work also aimed at revealing potential biomarkers linking treatment outcome predictions to specific patient characteristics. The model was able to describe T effector dynamics in the tumor-draining LN compartment, although it ignored CTLA-4-dependent effects on T cell repertoire diversity and expansion, which are crucial for capturing anti CTLA-4 mechanism(s) of action [17, 18].
Butner et al. presented an even larger-scale immune-oncology systems model of ICI therapies (including anti CTLA-4), which relies on survival data and tumor size data derived from CT scans, to potentially identify biomarkers linking patient characteristics to response to immunotherapy [34]. The model was retrospectively applied and calibrated on patient survival data. However, such a model cannot take into consideration stochastic processes at the micro-scale level of immune activation, unlike the ABM framework presented here, an approach more suited to describe complex adaptive systems and more applicable given its sensitivity to initial conditions—conditions which may allow for specific naïve T cells to play an important role in the overall immune response, even when initially present in low and stochastic abundances [35].
Using the presented ABM framework, we systematically assessed, via simulations, a set of mechanisms potentially driving anti CTLA-4 inhibition in the stimulation of an immune response. T cell affinity distributions with higher mean values clearly enhanced the density of activated clones in the computational domain. However, using values of 𝔼[Aff] > 0.1 may not be immunologically relevant (unrealistically high number of naïve T cells with high affinity to a particular specific antigen) and yield misleading simulation results. We thus considered a more plausible mechanism of action: since CTLA-4 surface suppression is induced right after initial TCR stimulation during the contact of a DC with a naive T cell [36], we specifically hypothesized the following mechanisms of action, to be tested via ABM simulations: (I) an increase in T cell priming probability; (II) an increase in the duration of short DC-to-T cell contacts, for the same TCR affinity values; (III) an increase in the saturation level of the cumulative activation signal; and combinations of these various mechanisms, which may be applied and tested simultaneously within the model.
Of all three hypothesized individual mechanisms, it is mechanism (I) above, an increase in the priming probability (i.e., a decrease in Kprime) which resulted in the highest level of T cell activation. Mechanisms (I + II), i.e., the simultaneous actions of anti CTLA-4 inhibition on Kprime and on the duration of short contacts (Kprolif), resulted in the highest super-additive effect in terms of T cell activation, when considering any two of the mechanistic hypotheses in combination. When all three mechanisms (I + II + III) were considered jointly, the highest synergistic effect on T cell activation was observed, clearly indicative of the importance of multi-level anti CTLA-4-dependent actions. Another important observation based on these numerical simulations is that anti CTLA-4 blockade significantly reduced (by nearly 45%) the mean affinity of activated T cells, only when considering combinations of mechanisms (I + II) and (I + II + III). In summary, the present ABM study showed that only a combination of anti CTLA-4 inhibition mechanisms, acting jointly (i.e., effects on the priming probability and on the motility of activated T cells) may possibly lead to the immune cellular behavior and ‘signature' observed in ICI clinical studies, i.e., simultaneous increases in the number of activated T cells [37–39] and in the respective TCR repertoire diversity [19–21, 40, 41]. Therefore, these simulations also support the hypothesis that ICI therapies may rescue the ability of antigen-dependent migration arrest and stabilize complexes of DC and activated T cells [23]. Such simulation results are also fully consistent with effects observed in both in vitro and in vivo studies [5, 42].
A better understanding of effects linked to various anti CTLA-4 mechanisms of action may have important implications in the development of anti-cancer immunotherapies. In particular, it has been shown that anti CTLA-4 blockade correlates with a significant increase in immune-mediated adverse events (imAEs), which may cause tolerability issues and, in severe cases, treatment discontinuation [43]. It has also been shown that the incidence rate of imAEs is dependent on the dose and exposure of anti CTLA-4 therapies [44]; furthermore, this dependence may be significantly amplified when combining anti CTLA-4 with anti PD-(L)1 therapies [45]. Such tolerability issues limit the clinical use of anti CTLA-4 plus anti PD-(L)1 combinations still today [22, 46]. While the exact mechanisms causing the CTLA-4-dependent autoimmune adverse effects have not yet been fully uncovered [47], one of the key factors identified relates to the accumulation of autoreactive cytotoxic cells caused by the broadening of the TCR repertoire following anti CTLA-4 blockade [19, 41]. There are clinically promising strategies to overcome tolerability issues and uncouple these from beneficial anti-tumor effects, e.g., by limiting the number of anti CTLA-4 treatment cycles [48] or via intratumoral or subcutaneous administration of CTLA-4 blocking antibodies [49, 50]. The ABM simulation framework presented here may provide rational mechanistic grounds to interrogate and support alternative treatment scenarios and schedules envisaged in the clinic. We propose that the integration of agent-based models and quantitative systems pharmacology models (QSP) may describe the entire chain of interactions and developments between malignant tumors and the immune system ab initio, starting with the primary activation of specific single T lymphocytes. The QSP model, based on mechanistic differential equations would, in turn, allow for the testing of different dosing regimens and the quantitative evaluation of the effects of T cells on the tumor.
Several limitations to the presented ABM may be considered. From a biological and immunological complexity perspective, several simplifications needed to be made, to implement the considered mechanistic scenarios while maintaining model tractability. In particular, T cells do display hybrid properties; for example, they may exist as mixed CD4+/CD8+ phenotypes. We deliberately did not distinguish between, e.g., T helper and cytotoxic T killer phenotypes and did not focus on secondary interactions whereby CD4+ T helpers would influence the activation of other immune cells. Also, interactions between DCs and T cells are mediated by many additional factors which have not been considered here and would significantly increase the complexity of an immune response initiation. Another obvious limitation is that we did not account for pharmacokinetic and dose-exposure vs. response features of an anti CTLA-4 therapy, with pharmacodynamic nuances that could be achieved based on various anti CTLA-4 antibody dosing regimens, as shown in previously published agent-based and systems pharmacology modeling work [51]. Instead, we used a constant, “uniform” inhibition of CTLA-4, to reveal fundamental emerging properties of the system, in the initiation and development of an immune response under specific conditions described in this ABM framework. Another limitation of the present model is that it can describe, realistically, only the potential increase in the number of activated clones and the subsequent achievement of steady-state values of activated T cell numbers, and not the subsequent decrease in T cell numbers. The elimination of specific antigens presented on DCs, as a complex physiological process that requires further careful study, remained outside the scope of this work. The main scope of the present study was the effect of anti CTLA-4 on T cell immune response initiation and magnitude, and on activated T cell TCR affinity distribution.
These limitations being considered, the insights gained via such an agent-based model may nevertheless provide further mechanistic input to deterministic quantitative systems pharmacology models (as “prior information” to set up biological details within the model structure) previously validated based on experimental data [45]. More granular, micro-scale multi-agent ABM may be combined with a deterministic systems model to formulate a hybrid mechanistic modeling framework, whereby the spatial behavior, immune development and T cell response dynamics may be described with sufficient mechanistic details [32].
Further developments of the current model may certainly be foreseen, to gain further quantitative insights and with increased mechanistic granularity. For example, additional immuno-suppressive cell types such as Treg may be implemented in the model, to capture potential anti-tumor effects caused by the antibody-dependent cell cytotoxic depletion of Tregs [52, 53]. The present ABM approach is sufficiently flexible to include separate types of mobile immune agents, to further characterize the complex behavior of the immune response. Tregs in particular may be implemented; these cells exhibit an increased membrane expression of CTLA-4 molecules and are capable of interfering with the T cell activation process, during interactions with APCs in the LN.
Also, the model may be expanded to introduce other types of immuno-modulatory inhibitors and activators, such as pharmacological agents which would affect the adaptive immune tolerance process through an inhibition of the PD-1/PD-L1 regulatory axis. To take into account PD-L1 effects, it will be necessary to augment the present model by implementing a second compartment representing tumor tissue or another tissue of interest. Anti PD-1/PD-L1 effects have been considered and implemented recently, in several ABM publications. To reproduce the blocking (e.g., using a monoclonal antibody) of PD-L1 at the surface of tumor cells—thereby inhibiting PD-L1 binding to PD-1 on effector T cell and thus limiting T cell exhaustion, Gong et al. [31] altered parameter values that govern T-cell suppression. Upon immunotherapy initiation, these authors reduced the probability of a cytotoxic T cell being suppressed by a PD-L1+ tumor cell. Kather et al. [32] included the effect of anti PD-(L)1 immunotherapy by re-invigorating exhausted lymphocytes and increasing their resistance in response to suppression by macrophages. To incorporate PD-1/PD-L1 checkpoints within the model, Storey and Jackson [54] applied an additional multiplier on the probabilities capturing (i) the innate immune-mediated activation of adaptive immune cells and (ii) tumor cell-mediated T cell proliferation, by a factor which represents the suppression of T cell activation and proliferation via the PD-1/PD-L1 checkpoint. Ruiz-Martinez et al. [55] introduced PD-1-dependent T cell exhaustion as a separate state of CD8+ cells. Once these get exhausted, their cytotoxic capability toward tumor cells would get suppressed.
The datasets presented in this study can be found in online repositories. The names of the repository/repositories and accession number(s) can be found below: https://github.com/Potamophylax/ABM_anti-CTLA-4/tree/main/Numerical%20Results/.
Conceptualization, methodology, and writing, review and editing: YK, KP, GH, and IA. Investigation and writing, original draft: IA, KP, and YK. Visualization: IA. Supervision: KP, YK, and GH. All authors contributed to the article and approved the submitted version.
This work was financed by the Ministry of Science and Higher Education of the Russian Federation within the framework of state support for the creation and development of world-class research centers, Digital Biodesign and Personalized Healthcare, Grant No. 075-15-2020-926.
We are most grateful to Uri Wilensky (Northwestern University) for providing access to NetLogo 6.1.1. We thank Gennady Bocharov, the Institute of Numerical Mathematics, the Russian Academy of Sciences for valuable discussions on various aspects reflected in this work. We also thank all our colleagues at M&S Decisions and the MID3 Research Center at Sechenov University for their continuous support and peer-review discussions.
Authors IA, YK, and KP are employees of M&S Decisions, LLC. Authors YK and KP are shareholders of M&S Decisions, LLC. Author GH is an employee of Biorchestra US, Inc.
All claims expressed in this article are solely those of the authors and do not necessarily represent those of their affiliated organizations, or those of the publisher, the editors and the reviewers. Any product that may be evaluated in this article, or claim that may be made by its manufacturer, is not guaranteed or endorsed by the publisher.
The Supplementary Material for this article can be found online at: https://www.frontiersin.org/articles/10.3389/fams.2022.993581/full#supplementary-material
1. Krummel MF, Allison JP. CD28 and CTLA-4 have opposing effects on the response of T cells to stimulation. J Exp Med. (1995) 182:459–65. doi: 10.1084/jem.182.2.459
2. Walker LS, Sansom DM. Confusing signals: recent progress in CTLA-4 biology. Trends Immunol. (2015) 36:63–70. doi: 10.1016/j.it.2014.12.001
3. Waterhouse P, Penninger JM, Timms E, Wakeham A, Shahinian A, Lee KP, et al. Lymphoproliferative disorders with early lethality in mice deficient in Ctla-4. Science. (1995) 270:985–8. doi: 10.1126/science.270.5238.985
4. Tivol EA, Borriello F, Schweitzer AN, Lynch WP, Bluestone JA, Sharpe AH, et al. Loss of CTLA-4 leads to massive lymphoproliferation and fatal multiorgan tissue destruction, revealing a critical negative regulatory role of CTLA-4. Immunity. (1995) 3:541–7. doi: 10.1016/1074-7613(95)90125-6
5. Schneider H, Downey J, Smith A, Zinselmeyer BH, Rush C, Brewer JM, et al. Reversal of the TCR stop signal by CTLA-4. Science. (2006) 313:1972–5. doi: 10.1126/science.1131078
6. Fraser JH, Rincon M, McCoy KD, et al. CTLA-4 ligation attenuates AP-1, NFAT and NFkappaB activity in activated T cells. Eur J Immunol. (1999) 29:838–484. doi: 10.1002/(SICI)1521-4141(199903)29:03<838::AID-IMMU838>3.0.CO
7. Li D, Gál I, Vermes C, Alegre ML, Chong AS, Chen L, et al. Cutting edge: Cbl-b: one of the key molecules tuning CD28- and CTLA-4-mediated T cell costimulation. J Immunol. (2004) 173:7135–9. doi: 10.4049/jimmunol.173.12.7135
8. Nasta F, Ubaldi V, Pace L, Doria G, Pioli C. Cytotoxic T-lymphocyte antigen-4 inhibits GATA-3 but not T-bet mRNA expression during T helper cell differentiation. Immunology. (2006) 117:358–67. doi: 10.1111/j.1365-2567.2005.02309.x
9. Greenwald RJ, Oosterwegel MA, van der Woude D, Kubal A, Mandelbrot DA, Boussiotis VA, et al. CTLA-4 regulates cell cycle progression during a primary immune response. Eur J Immunol. (2002) 32:366–73. doi: 10.1002/1521-4141(200202)32:2<366::AID-IMMU366>3.0.CO;2-5
10. Qureshi OS, Zheng Y, Nakamura K, Attridge K, Manzotti C, Schmidt EM, et al. Trans-endocytosis of CD80 and CD86: a molecular basis for the cell-extrinsic function of CTLA-4. Science. (2011) 332:600–3. doi: 10.1126/science.1202947
11. Miwa N, Hayakawa S, Miyazaki S, Myojo S, Sasaki Y, Sakai M, et al. IDO expression on decidual and peripheral blood dendritic cells and monocytes/macrophages after treatment with CTLA-4 or interferon-gamma increase in normal pregnancy but decrease in spontaneous abortion. Mol Hum Reprod. (2005) 11:865–70. doi: 10.1093/molehr/gah246
12. Grohmann U, Orabona C, Fallarino F, Vacca C, Calcinaro F, Falorni A, et al. CTLA-4-Ig regulates tryptophan catabolism in vivo. Nat Immunol. (2002) 3:1097–101. doi: 10.1038/ni846
13. Lippens C, Duraes FV, Dubrot J, Brighouse D, Lacroix M, Irla M, et al. IDO-orchestrated crosstalk between pDCs and Tregs inhibits autoimmunity. J Autoimmun. (2016) 75:39–49. doi: 10.1016/j.jaut.2016.07.004
14. Wing K, Onishi Y, Prieto-Martin P, Yamaguchi T, Miyara M, Fehervari Z, et al. CTLA-4 control over Foxp3+ regulatory T cell function. Science. (2008) 322:271–5. doi: 10.1126/science.1160062
15. Chen DS, Mellman I. Oncology meets immunology: the cancer-immunity cycle. Immunity. (2013) 39:1–10. doi: 10.1016/j.immuni.2013.07.012
16. Hodi FS, O'Day SJ, McDermott DF, Weber RW, Sosman JA, Haanen JB, et al. Improved survival with ipilimumab in patients with metastatic melanoma. New Engl J Med. (2010) 363:711–23. doi: 10.1056/NEJMoa1003466
17. Robert L, Tsoi J, Wang X, Emerson R, Homet B, Chodon T, et al. CTLA-4 blockade broadens the peripheral T-cell receptor repertoire. Clinical Cancer Res. (2014) 20:2424–32. doi: 10.1158/1078-0432.CCR-13-2648
18. Kvistborg P, Philips D, Kelderman S, Hageman L, Ottensmeier C, Joseph-Pietras D, et al. Anti-CTLA-4 therapy broadens the melanoma-reactive CD8+ T cell response. Sci Transl Med. (2014) 6:254ra.128. doi: 10.1126/scitranslmed.3008918
19. Oh DY, Cham J, Zhang L, Fong G, Kwek SS, Klinger M, et al. Immune toxicities elicted by CTLA-4 blockade in cancer patients are associated with early diversification of the T-cell repertoire. Cancer Res. (2017) 77:1322–30. doi: 10.1158/0008-5472.CAN-16-2324
20. Arakawa A, Vollmer S, Tietze J, Galinski A, Heppt MV, Bürdek M, et al. Clonality of CD4+ blood T cells predicts longer survival with CTLA-4 or PD-1 checkpoint inhibition in advanced melanoma. Front. Immunol. (2019) 10:1336. doi: 10.3389/fimmu.2019.01336
21. Hopkins AC, Yarchoan M, Durham JN, Yusko EC, Rytlewski JA, Robins HS, et al. T cell receptor repertoire features associated with survival in immunotherapy-treated pancreatic ductal adenocarcinoma. JCI Insight. (2018) 3:122092. doi: 10.1172/jci.insight.122092
22. Willsmore ZN, Coumbe BG, Crescioli S, Reci S, Gupta A, Harris RJ, et al. Combined anti-PD-1 and anti-CTLA-4 checkpoint blockade: treatment of melanoma and immune mechanisms of action. Eur J Immunol. (2021) 51:544–56. doi: 10.1002/eji.202048747
23. Kanda Y, Okazaki T, Katakai T. Motility dynamics of T cells in tumor-draining lymph nodes: a rational indicator of antitumor response and immune checkpoint blockade. Cancers. (2021) 13:4616. doi: 10.3390/cancers13184616
24. Azarov I, Peskov K, Helmlinger G, Kosinsky Y. Role of T cell-to-dendritic cell chemoattraction in T cell priming initiation in the lymph node: an agent-based modeling study. Front Immunol. (2019) 10:1289. doi: 10.3389/fimmu.2019.01289
25. Bogle G, Dunbar PR. Agent-based simulation of T-cell activation and proliferation within a lymph node. Immunol Cell Biol. (2010) 88:172–9. doi: 10.1038/icb.2009.78
26. Moreau HD, Bogle G, Bousso P. A virtual lymph node model to dissect the requirements for T-cell activation by synapses and kinapses. Immunol Cell Biol. (2016) 94:680–8. doi: 10.1038/icb.2016.36
27. Brunner-Weinzierl MC, Rudd CE. CTLA-4 and PD-1 control of T-cell motility and migration: implications for tumor immunotherapy. Front Immunol. (2018) 9:2737. doi: 10.3389/fimmu.2018.02737
28. Wilensky U. NetLogo. Center for Connected Learning and Computer-Based Modeling. Evanston, IL: Northwestern University. (1999).
29. Jansson A, Barnes E, Klenerman P, Harlén M, Sørensen P, Davis SJ, et al. A theoretical framework for quantitative analysis of the molecular basis of costimulation. J Immunol. (2005) 175:1575–85. doi: 10.4049/jimmunol.175.3.1575
30. Ganesan A, Arulraj T, Choulli T, Barakat KH. A mathematical modelling tool for unravelling the antibody-mediated effects on CTLA-4 interactions. BMC Med Inform Decis Mak. (2018) 18:1–17. doi: 10.1186/s12911-018-0606-x
31. Gong C, Milberg O, Wang B, Vicini P, Narwal R, Roskos L, et al. A computational multiscale agent-based model for simulating spatio-temporal tumour immune response to PD1 and PDL1 inhibition. J R Soc Interface. (2017) 14:20170320. doi: 10.1098/rsif.2017.0320
32. Kather JN, Charoentong P, Suarez-Carmona M, Herpel E, Klupp F, Ulrich A, et al. High-throughput screening of combinatorial immunotherapies with patient-specific in silico models of metastatic colorectal cancer. Cancer Res. (2018) 78:5155–63. doi: 10.1158/0008-5472.CAN-18-1126
33. Wang H, Milberg O, Bartelink IH, Vicini P, Wang B, Narwal R, et al. In silico simulation of a clinical trial with anti-CTLA-4 and anti-PD-L1 immunotherapies in metastatic breast cancer using a systems pharmacology model. R Soc Open Sci. (2019) 6:190366. doi: 10.1098/rsos.190366
34. Butner JD, Elganainy D, Wang CX, Wang Z, Chen SH, Esnaola NF, et al. Mathematical prediction of clinical outcomes in advanced cancer patients treated with checkpoint inhibitor immunotherapy. Sci Adv. (2020) 6:eaay6298. doi: 10.1126/sciadv.aay6298
35. Page SE. On incentives and updating in agent based models. Comput Econ. (1997) 10:67–87. doi: 10.1023/A:1008625524072
36. Walunas TL, Lenschow DJ, Bakker CY, Linsley PS, Freeman GJ, Green JM, et al. CTLA-4 can function as a negative regulator of T cell activation. Immunity. (1994) 1:405–13. doi: 10.1016/1074-7613(94)90071-X
37. Liakou CI, Kamat A, Tang DN, Chen H, Sun J, Troncoso P, et al. CTLA-4 blockade increases IFNγ-producing CD4+ ICOShi cells to shift the ratio of effector to regulatory T cells in cancer patients. Proc Nat Acad Sci USA. (2008) 105:14987–92. doi: 10.1073/pnas.0806075105
38. Chen H, Liakou CI, Kamat A, Pettaway C, Ward JF, Tang DN, et al. Anti-CTLA-4 therapy results in higher CD4+ ICOShi T cell frequency and IFN-γ levels in both nonmalignant and malignant prostate tissues. Proc Nat Acad Sci USA. (2009) 106:2729–34. doi: 10.1073/pnas.0813175106
39. Pedicord VA, Montalvo W, Leiner IM, Allison JP. Single dose of anti-CTLA-4 enhances CD8+ T-cell memory formation, function, and maintenance. Proc Nat Acad Sci USA. (2011) 108:266–71. doi: 10.1073/pnas.1016791108
40. Cha E, Klinger M, Hou Y, Cummings C, Ribas A, Faham M, et al. Improved survival with T cell clonotype stability after anti-CTLA-4 treatment in cancer patients. Sci Transl Med. (2014) 6:238ra.70. doi: 10.1126/scitranslmed.3008211
41. Subudhi SK, Aparicio A, Gao J, Zurita AJ, Araujo JC, Logothetis CJ, et al. Clonal expansion of CD8 T cells in the systemic circulation precedes development of ipilimumab-induced toxicities. Proc Nat Acad Sci USA. (2016) 113:11919–24. doi: 10.1073/pnas.1611421113
42. Schneider H, Smith X, Liu H, Bismuth G, Rudd CE. CTLA-4 disrupts ZAP70 microcluster formation with reduced T cell/APC dwell times and calcium mobilization. Eur J Immunol. (2008) 38:40–7. doi: 10.1002/eji.200737423
43. Michot JM, Bigenwald C, Champiat S, Collins M, Carbonnel F, Postel-Vinay S, et al. Immune-related adverse events with immune checkpoint blockade: a comprehensive review. Eur J Cancer. (2016) 54:139–48. doi: 10.1016/j.ejca.2015.11.016
44. Feng Y, Roy A, Masson E, Chen TT, Humphrey R, Weber JS, et al. Exposure-response relationships of the efficacy and safety of ipilimumab in patients with advanced melanoma. Clin Cancer Res. (2013) 19:3977–86. doi: 10.1158/1078-0432.CCR-12-3243
45. Helmlinger G, Azarov I, Kosinsky Y, Voronova V, Chu L, Mosely S, et al. Linking tumor microenvironment properties in murine syngeneic tumors with resistance to immune checkpoint inhibitors: insights from a quantitative systems approach. Cancer Res. (2019) 79(13_Supplement):1082. doi: 10.1158/1538-7445.AM2019-1082
46. Ozer M, George A, Goksu SY, George TJ, Sahin I. The role of immune checkpoint blockade in the hepatocellular carcinoma: a review of clinical trials. Front Oncol. (2021) 11:801379–801379. doi: 10.3389/fonc.2021.801379
47. Zubiri L, Molina GE, Mooradian MJ, Cohen J, Durbin SM, Petrillo L, et al. Effect of a multidisciplinary Severe Immunotherapy Complications Service on outcomes for patients receiving immune checkpoint inhibitor therapy for cancer. J Immunother Cancer. (2021) 9:2886. doi: 10.1136/jitc-2021-002886
48. Kelley RK, Sangro B, Harris W, Ikeda M, Okusaka T, Kang YK, et al. Safety, efficacy, and pharmacodynamics of tremelimumab plus durvalumab for patients with unresectable hepatocellular carcinoma: randomized expansion of a phase I/II study. J Clin Oncol. (2021) 39:2991–3001. doi: 10.1200/JCO.20.03555
49. Fransen MF, Van Der Sluis TC, Ossendorp F, Arens R, Melief CJ. Controlled local delivery of CTLA-4 blocking antibody induces CD8+ T-cell-dependent tumor eradication and decreases risk of toxic side effects. Clin Cancer Res. (2013) 19:5381–9. doi: 10.1158/1078-0432.CCR-12-0781
50. Francis DM, Manspeaker MP, Schudel A, Sestito LF, O'Melia MJ, Kissick HT, et al. Blockade of immune checkpoints in lymph nodes through locoregional delivery augments cancer immunotherapy. Sci Transl Med. (2020) 12:aay3575. doi: 10.1126/scitranslmed.aay3575
51. Milberg O, Gong C, Jafarnejad M, Bartelink IH, Wang B, Vicini P, et al. A QSP model for predicting clinical responses to monotherapy, combination and sequential therapy following CTLA-4, PD-1, and PD-L1 checkpoint blockade. Sci Rep. (2019) 9:1–17. doi: 10.1038/s41598-019-47802-4
52. Ingram JR, Blomberg OS, Rashidian M, Ali L, Garforth S, Fedorov E, et al. Anti-CTLA-4 therapy requires an Fc domain for efficacy. Proc Natl Acad Sci USA. (2018) 115:3912–7. doi: 10.1073/pnas.1801524115
53. Vargas FA, Furness AJ, Litchfield K, Joshi K, Rosenthal R, Ghorani E, et al. Fc effector function contributes to the activity of human anti-CTLA-4 antibodies. Cancer Cell. (2018) 33:649–63. doi: 10.1016/j.ccell.2018.02.010
54. Storey KM, Jackson TL. An agent-based model of combination oncolytic viral therapy and anti-PD-1 immunotherapy reveals the importance of spatial location when treating glioblastoma. Cancers. (2021) 13:5314. doi: 10.3390/cancers13215314
Keywords: T cells, dendritic cells, lymph node (LN), cytotoxic T-lymphocyte antigen-4 (CTLA-4), agent-based modeling (ABM), immune response, immune checkpoint inhibition (ICI)
Citation: Azarov I, Helmlinger G, Kosinsky Y and Peskov K (2022) Elaborating on anti CTLA-4 mechanisms of action using an agent-based modeling approach. Front. Appl. Math. Stat. 8:993581. doi: 10.3389/fams.2022.993581
Received: 13 July 2022; Accepted: 07 October 2022;
Published: 26 October 2022.
Edited by:
Vitaly Volpert, UMR5208 Institut Camille Jordan (ICJ), FranceReviewed by:
Filippo Castiglione, National Research Council (CNR), ItalyCopyright © 2022 Azarov, Helmlinger, Kosinsky and Peskov. This is an open-access article distributed under the terms of the Creative Commons Attribution License (CC BY). The use, distribution or reproduction in other forums is permitted, provided the original author(s) and the copyright owner(s) are credited and that the original publication in this journal is cited, in accordance with accepted academic practice. No use, distribution or reproduction is permitted which does not comply with these terms.
*Correspondence: Ivan Azarov, SXZhbi5hemFyb3ZAbXNkZWNpc2lvbnMucnU=
Disclaimer: All claims expressed in this article are solely those of the authors and do not necessarily represent those of their affiliated organizations, or those of the publisher, the editors and the reviewers. Any product that may be evaluated in this article or claim that may be made by its manufacturer is not guaranteed or endorsed by the publisher.
Research integrity at Frontiers
Learn more about the work of our research integrity team to safeguard the quality of each article we publish.