 Fatuh Inayaturohmat
 Nursanti Anggriani
 Asep K. Supriatna
- 1Master of Mathematics Study Program, Department of Mathematics, Faculty of Mathematics and Natural Sciences, Universitas Padjadjaran, Sumedang, Indonesia
- 2Department of Mathematics, Faculty of Mathematics and Natural Sciences, Universitas Padjadjaran, Sumedang, Indonesia
In this research, we developed a coinfection model of tuberculosis and COVID-19 with the effect of isolation and treatment. We obtained two equilibria, namely, disease-free equilibrium and endemic equilibrium. Disease-free equilibrium is a state in which no infection of tuberculosis and COVID-19 occurs. Endemic equilibrium is a state in which there occurs not only the infection of tuberculosis and COVID-19 but also the coinfection of tuberculosis and COVID-19. We assumed that the parameters follow the uniform distribution, and then, we took 1,000 samples of each parameter using Latin hypercube sampling (LHS). Next, the samples were sorted by ranking. Finally, we used the partial rank correlation coefficient (PRCC) to find the correlation between the parameters with compartments. We analyzed the PRCC for three compartments, namely, individuals infected with COVID-19, individuals infected with tuberculosis, and individuals coinfected with COVID-19 and tuberculosis. The most sensitive parameters are the recovery rate and the infection rate of each COVID-19 and tuberculosis. We performed the optimal control in the form of prevention for COVID-19 and tuberculosis. The numerical simulation shows that these controls effectively reduce the infected population. We also concluded that the effect of isolation has an immediate impact on reducing the number of COVID-19 infections, while the effect of treatment has an impact that tends to take a longer time.
Introduction
A healthy and prosperous life is one of the things agreed upon by countries in the world, including Indonesia. Efforts to promote healthy living and support welfare for all ages are listed in the third point of the Sustainable Development Goals (SDGs). These goals include several other things, including reducing the ratio of deaths from the disease to <70 per 100,000 live births, developing treatments, and defining the AIDS, tuberculosis, and malaria epidemics [1].
Tuberculosis (TB) is one of the most deadly infectious diseases globally. Even individuals under treatment for tuberculosis are still infectious for some time (different for each individual), especially when the bacteria are still active [2]. Globally, more than 4,100 people die daily from TB, and almost 28,000 people are infected with this preventable and curable disease. Global efforts to fight TB have saved about 66 million lives since 2000. However, the COVID-19 pandemic has reversed years of progress made in the fight to end TB. For the first time in a decade, TB deaths increased in 2020. Globally, TB incidence decreased by about 2% annually in 2015–2020 with a cumulative 11%. Due to the COVID-19 pandemic, nearly 9.9 million people were infected, and nearly 1.5 million people died from TB in 2020 [3]. In 2021, there were 443,235 tuberculosis cases in Indonesia. Until 2 June 2022, 155,822 cases of tuberculosis were confirmed [4].
COVID-19 is a disease that spreads very quickly, causing a pandemic and becoming a global health problem. The pandemic has had a major impact on other sectors, especially the socioeconomic sector [5]. Based on the Worldometer, as of 30 April 2022, there were 512,466,045 positive cases of COVID-19 in the world, with 6,257,512 deaths. Indonesia is ranked 18th in the world and 7th in Asia with 6,046,467 total positive cases of COVID-19 [6].
Based on these data, efforts are needed to reduce transmission and prevent the spread of tuberculosis and COVID-19. Mathematics has an essential role in modeling the epidemic phenomenon of the disease, one of which is by using a deterministic model of the spread of the disease. The study of the COVID-19 model with waning immunity has undergone various developments. Models with symptomatic and asymptomatic infected populations show that, in determining the beginning time of the massive vaccination strategy, the vaccine efficacy level is a deciding factor, whereas the natural immunity period is for the latter [7]. Vaccination and treatment are very effective in suppressing the spread of COVID-19 [8, 9]. In addition, isolation and vaccination are effective strategies for reducing the infection [10]. The effort to control the multiple COVID-19 strains is the demand for more restrictive measures [11]. The SEIR model with vaccination and pre-symptomatic populations shows that the waning of vaccine-induced immunity significantly impacts the disease spreading [12]. Contact tracing, national-scale social restriction, wearing face masks, and case detection and treatment are the most effective scenarios to control the spreading of COVID-19 in Indonesia [13]. The optimal control of the SEIR model in Nigeria can be effective if the optimal control implemented is capable of sustaining the basic reproduction number to below unity [14]. COVID-19 reinfection scenario with the SIR model in Malaysia shows that transmission dynamics could emerge due to the waning of immunity, even when the reinfection force is relatively low [15]. The model of COVID-19 with infection through goods contaminated with SARS-CoV-2 suggests that the public should be aware [16]. The COVID-19 model with a healthcare population shows the importance of the protection of healthcare workers [17]. In the COVID-19 model with an educated population and contaminated surface objects, in the absence of a vaccine, countries need to detect and isolate at least 30% of the asymptomatic individuals while treating at least 50% of symptomatic individuals to control COVID-19 [18]. The SEIR model with isolation and hospitalization shows that the enhanced government, individual-level interventions, and the intensity of media coverage could substantially suppress the transmission of COVID-19 cases in Ghana [19]. A researcher has started to develop the coinfection model for tuberculosis in the Middle East [20].
Researchers also constructed a COVID-19 model with the effect of comorbidity on the population [21] and also the effect of home care with non-pharmaceutical interventions and sick vaccinations [22]. It was reported that the authors [23] developed a model with a partial comorbid population, while the other authors [24] examined a comorbid and isolated COVID-19 model. Some researchers did their research on the model of tuberculosis and HIV coinfection with optimal control and sensitivity analysis [25], the model of tuberculosis and HIV coinfection with the effect of treatment [26], the model of tuberculosis and HIV coinfection with treatment interventions [27], the effect of HIV immunity on treatment control [28], the model of tuberculosis and HIV coinfection with the effect of saturated care [29], the effect of reinfection on the model of tuberculosis and HIV coinfection [30], the relationship between tuberculosis and HIV and diabetes using a fractional differential equation model [31], the drug resistance from viruses that cause tuberculosis due to non-treatment [32], and the development of prevention strategies of spread in an AIDS-influenced model of tuberculosis [33].
The total number of infections and deaths by tuberculosis has increased due to COVID-19 [3]. Tuberculosis and COVID-19 can infect a human at the same time. Therefore, few researchers developed models of coinfection from tuberculosis and COVID-19. The model forecasts the dynamics of COVID-19 and tuberculosis in Delhi, India [34]. In the differential fractional equation for tuberculosis and COVID-19 coinfection using the Atangana-Baleanu derivative, the result is that reducing COVID-19 infection by tuberculosis-infected individuals can reduce the spread of infection and coinfection in the population [35]. By taking into account the reported and unreported cases in the model of tuberculosis and COVID-19 coinfection, it was determined that the best control used to reduce the spread of tuberculosis and COVID-19 in the population is to focus on preventing COVID-19 at a minimum cost [36]. The result of this study is that reducing infection contacts can reduce the spread of tuberculosis and COVID-19 coinfection [37].
Based on the description above, the authors are interested in developing a mathematical model on the coinfection of tuberculosis and COVID-19 with the effect of isolation and treatment. Isolation is an effective strategy to reduce the spreading of COVID-19 besides vaccination because there is no specific cure yet for COVID-19 [10]. On the other hand, treatment for individuals infected with tuberculosis is an effective strategy to reduce the spreading of tuberculosis because it can reduce the risk of transmitting tuberculosis from the infected individuals [26–28]. Dynamic analysis is used to study and analyze the behavior and dynamics of the spread of tuberculosis and COVID-19. The numerical simulations are used to support the results obtained.
Materials and methods
We developed a mathematical model by dividing the human population into seven compartments: susceptible individuals (S), individuals infected with COVID-19 (IC), individuals infected with tuberculosis (IT), individuals coinfected with COVID-19 and tuberculosis (ITC), individuals isolated with COVID-19 infection (Q), individuals under tuberculosis treatment (T), and recovered individuals (R).
The model has the following assumptions:
i. Individuals infected with tuberculosis can get infected with COVID-19 and vice versa.
ii. Individuals coinfected with tuberculosis and COVID-19 can transmit either tuberculosis or COVID-19.
iii. Coinfected individuals can recover from either COVID-19 or tuberculosis and the mixed infection at the same time.
iv. There are two different infection rates, namely, the infection rate of tuberculosis (γT) and the infection rate of COVID-19 (γC). Infection rates for singly infected and coinfected individuals are assumed to be the same.
v. Isolated individuals cannot transmit COVID-19, but individuals under tuberculosis treatment can transmit tuberculosis.
vi. The recovery rates for individuals infected with tuberculosis, infected with COVID-19, coinfected with tuberculosis and COVID-19, isolated because of the COVID-19 infection, and under tuberculosis treatment are different.
vii. Coinfected individuals have a higher death rate than singly infected individuals.
Human populations are recruited into susceptible individuals with the recruitment rate A. The authors assumed that natural death is the same for all compartments with the natural death rate μ. Susceptible individuals decrease due to the tuberculosis infection following effective contact with either singly or coinfected individuals at the rate:
Susceptible individuals also decrease due to the COVID-19 infection after effective contact with either singly or coinfected individuals at the rate:
The transmission diagram of the model can be seen in Figure 1. The system of the differential equation for the tuberculosis and COVID-19 coinfection model with the effect of isolation and treatment based on the assumptions and the above-given description is as follows:
The description of the compartments and the values of parameters are provided in Tables 1, 2, respectively. Despite the unavailability of data to apply to this study, the various assumed parameters used in our model have demonstrated a behavior of the spread of tuberculosis. Some of these values are taken from previous studies as indicated in Table 2, and some of these values which are not available are assumed within plausible ranges.
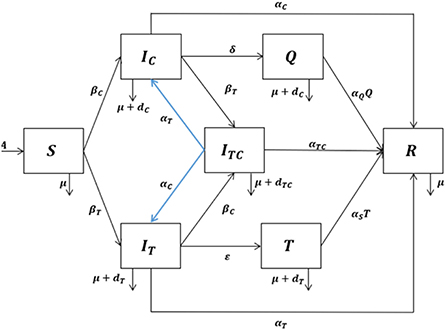
Figure 1. Transmission diagram.
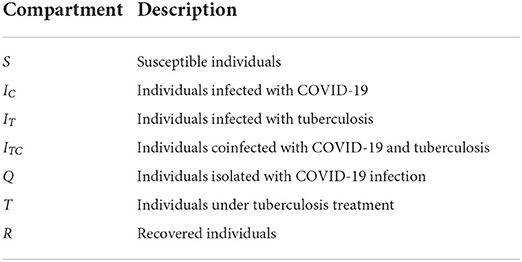
Table 1. Description of the compartments.
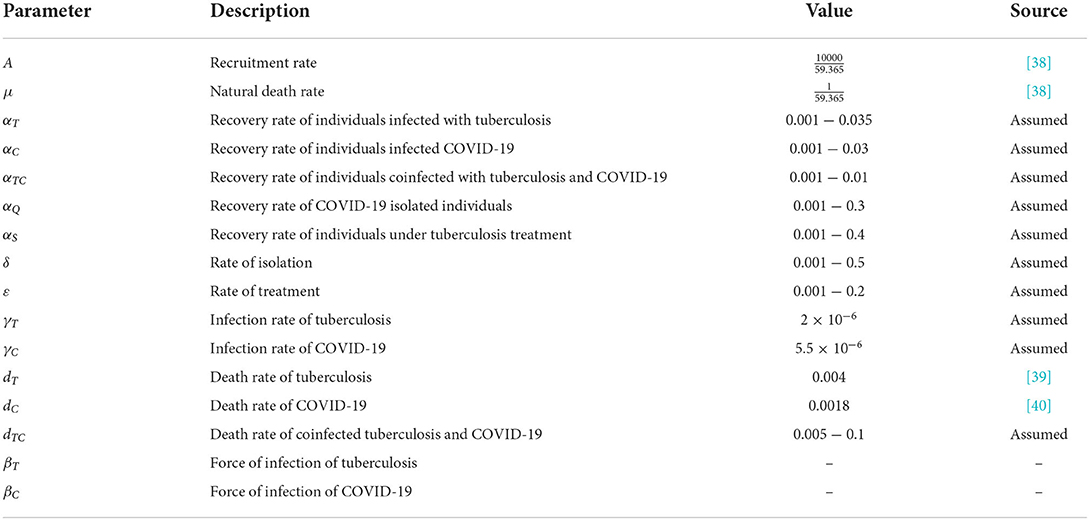
Table 2. Description and value of the parameters.
Result and discussion
We analyzed the local stability of the equilibrium. Then, the basic reproduction number is generated from the disease-free equilibrium using the next-generation matrix method. Next, the global sensitivity analysis of the model is conducted to find the most sensitive parameter of the model and how significant the parameter change affects the model. In this research, we used the Latin hypercube sampling (LHS) to take samples and then the partial rank correlation coefficient (PRCC) to find the partial correlation between the parameters and the compartments. The most sensitive parameter will be controlled with the optimal control. Finally, we analyzed the dynamics of the population using the numerical simulation with and without control.
Dynamical analysis
Setting all the differential equations from the model (1) equaling zero and then solving for all compartments, we obtained two equilibria of the model, namely, disease-free equilibrium (E0) and endemic equilibrium (E*).
Disease-free equilibrium:
Endemic equilibrium:
where
The basic reproduction number (ℜ0) is the expected number of secondary cases produced by a typical infected individual during its entire period of infectiousness [41, 42]. When ℜ0 < 1, the disease will disappear from the population. Otherwise, when ℜ0 > 1, the disease will remain or spread in the population.
Let x = (IC, IT, ITC, T), then the model can be written as follows:
where (X) = −(X) − +(X). (X) is the rate of appearance of new infections in compartments, +(X) is the rate of transfer of individuals into the compartment, and −(X) is the rate of transfer of individuals out of the compartment.
Substituting the disease-free equilibrium in the Jacobian matrix of (X) and (X), we obtained the following equation:
Hence, the next-generation matrix is as follows:
where
The basic reproduction number is the spectral radius of FV−1:
with
The basic reproduction number ℜ0C and ℜ0T represent the number of infection cases produced by one infectious COVID-19 case and by one infectious tuberculosis case, respectively. The basic reproduction number of the coinfection model (1) is given in Equation (4).
We analyzed the local stability of each equilibrium through its eigenvalues [43]. The eigenvalues are obtained from the Jacobian matrix, which has been substituted with each equilibrium. The Jacobian matrix of model (1) can be seen below:
Substituting the disease-free equilibrium in Equation (7), we obtained the following characteristic polynomial:
From Equation (8), we obtained the following equation:
It is clear that λ1, λ2, λ3, λ4 < 0. For λ5, we obtained the following equation:
Then, λi with i = 6, 7 will be negative if kj > 0 with j = 0, 1, 2. We numerically analyzed the coefficient values because the characteristic polynomial 0(λ) coefficients are complex. The result of numerical analysis is for kj with j = 0, 1, 2 (Appendix 1).
Since λi with i = 1, 2, 3, …, 7 is negative, it can be concluded that the disease-free equilibrium is locally asymptotically stable when ℜ0 < 1.
By analyzing the stability of the endemic equilibrium by substituting the endemic equilibrium in Equation (7), we obtained the following characteristic polynomial:
λi with i = 1, 2, 3, …, 7 will be negative if mj > 0 with j = 0, 1, 2, …, 7. We numerically analyzed the coefficient values because the characteristic polynomial *(λ) coefficients are complex. The result of numerical analysis is mj with j = 0, 1, 2, …, 7 (Appendix 2).
Since λi with i = 1, 2, 3, …, 7 is negative, it can be concluded that the endemic equilibrium is locally asymptotically stable when ℜ0 > 1.
Partial rank correlation coefficient
We performed a global sensitivity analysis of the model by using the combination of LHS and PRCC. The purpose of the global sensitivity analysis is to find the most sensitive parameter to the model. LHS divides the range of the sample and so we took samples from each partition evenly. PRCC gives a partial correlation of each parameter to the model. The correlation is from −1 to 1. If the correlation is negative, then it indicates that, when the parameter decreases, the compartment also decreases; otherwise, the correlation is positive [44]. We assumed that the parameters follow the uniform distribution [U(0, 1)], and then, we took 1,000 samples using LHS. Next, the samples were sorted by ranking. Finally, we used PRCC to find the correlation between the parameters with compartments. In this research, we analyzed the PRCC for three compartments, namely, individuals infected with COVID-19 (IC), individuals infected with tuberculosis (IT), and individuals coinfected with COVID-19 and tuberculosis (ITC). The result of the global sensitivity analysis for all parameters of the infected population is illustrated in Figures 2–4.
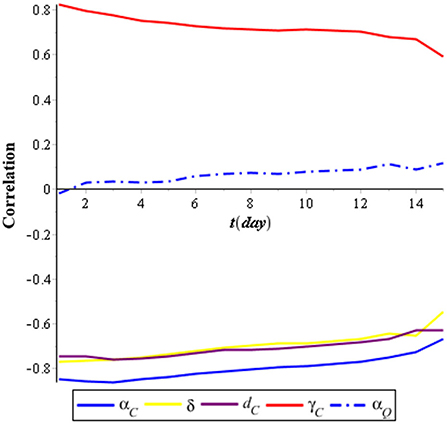
Figure 2. PRCC of individuals infected with COVID-19 (IC).
Figure 2 shows that the most sensitive parameters of the individuals infected with COVID-19 (IC) are the recovery rate of individuals infected with COVID-19 (αC), which has a negative correlation, and the infection rate of COVID-19 (γC), which has a positive correlation. Meanwhile, the isolation rate also has a high negative correlation with the individuals infected with COVID-19 (IC). It means that the effort to isolate individuals infected with COVID-19 (IC) can suppress the spreading of COVID-19.
Figure 3 shows that the most sensitive parameters of the individuals infected with tuberculosis (IT) are the recovery rate of individuals infected with tuberculosis (αT), which has a negative correlation, and the infection rate of tuberculosis (γT), which has a positive correlation. Meanwhile, the treatment rate also has a negative correlation with the individuals infected with tuberculosis (IT). It means that the effort to treat individuals infected with tuberculosis (IT) can suppress the spreading of tuberculosis.
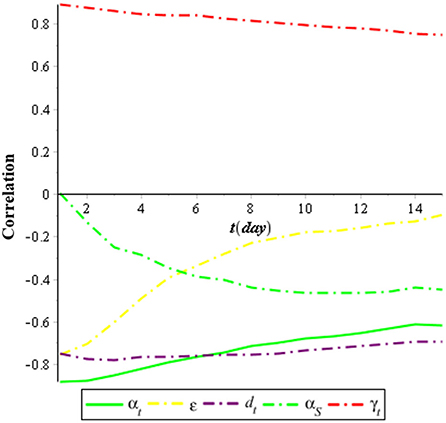
Figure 3. PRCC of individuals infected with tuberculosis (IT).
Meanwhile, Figure 4 shows that the most sensitive parameters to individuals coinfected with COVID-19 and tuberculosis (ITC) are αC, αT, and αTC, which has a negative correlation, and γC and γT, which has a positive correlation. It means that to minimize the case of coinfection of COVID-19 and tuberculosis, we need a combination of interventions for COVID-19 and tuberculosis.
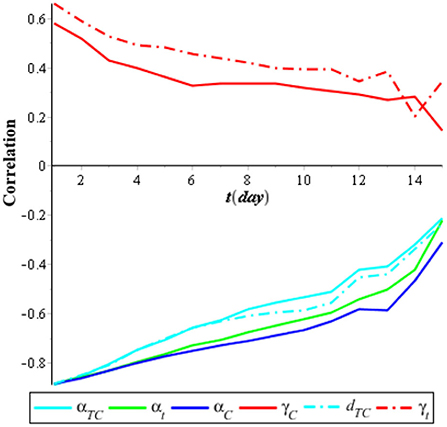
Figure 4. PRCC of individuals coinfected with COVID-19 and tuberculosis (ITC).
Optimal control
The aim of the optimal control is to reduce the spreading of COVID-19 and tuberculosis. In this research, we used prevention control for COVID-19 and tuberculosis, i.e., the use of masks and hand sanitizer. There are two controls in the model. The COVID-19 prevention control u(t) is to minimize the individuals infected with COVID-19 (IC). The tuberculosis prevention control v(t) is to minimize the individuals infected with tuberculosis (IT). The objective function is given by the following equation:
where 0 ≤ u(t) ≤ 1, 0 ≤ v(t) ≤ 1, 0 ≤ t ≤ tf
where S(t) ≥ 0, IC(t) ≥ 0, IT(t) ≥ 0, ITC(t) ≥ 0, Q(t) ≥ 0, T(t) ≥ 0, R(t) ≥ 0.
C1 represents the positive constant weight that balance off the individuals infected with COVID-19 to COVID-19 and C2 represents the positive constant weight that balance off the individuals infected with tuberculosis to tuberculosis. W1 and W2 are the constant weights of the prevention control for COVID-19 and tuberculosis. and represent the costs of the prevention control for COVID-19 and tuberculosis. We used a quadratic control function because the positive balancing cost factors transfer the integral into monetary quantity over a finite period of time [see Tchoumi et al. [45] and the references therein].
The Hamiltonian function for the optimal control model is given by the following equation:
with λi for i = 1, 2, …, 7 is the adjoint variable of S(t), IC(t), IT(t), ITC(t), Q(t), T(t), R(t).
The co-state equation of the optimal control model is given by the following equation:
According to Lenhart and Workman [46], the optimal condition of the optimal control for 0 ≤ t ≤ tf is given as follows:
since 0 ≤ u(t) ≤ 1 and 0 ≤ v(t) ≤ 1, we obtained the optimal control as follows:
Numerical simulation
The aim of the numerical simulation is to observe the dynamics of the population graphically. The numerical simulation used the compartment's initial values, {S(0), IC(0), IT(0), ITC(0), Q(0), T(0), R(0)} = {100000, 10, 10, 10, 10, 10, 10}, and parameter values from Table 2. We performed the numerical simulations for the models with and without control.
Dynamics of the population
First, we performed the numerical simulation without control. The result of the numerical simulation is presented in Figures 5, 6.
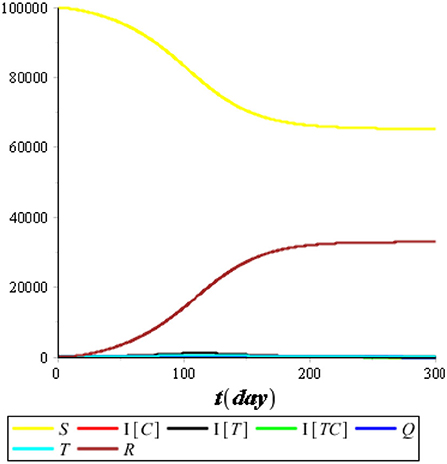
Figure 5. The dynamics of all populations.
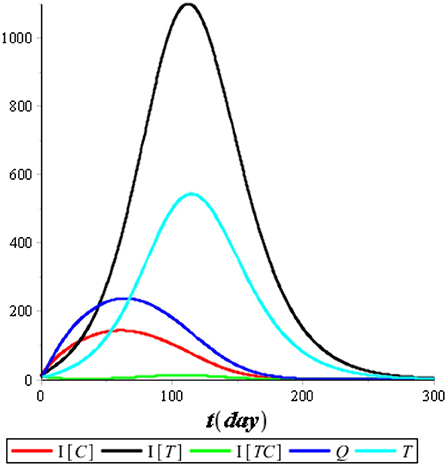
Figure 6. The dynamics of the population without susceptible (S) and recovered (R).
Figure 5 illustrates that the recovered population (R) improved considerably compared with the other compartments, so we omitted it from the simulation. Figure 6 illustrates that the most infected individuals are the individuals infected with tuberculosis (IT), while the individuals infected with COVID-19 (IC) and the individuals coinfected with COVID-19 and tuberculosis (ITC) are not significant. We conclude that isolation has an immediate impact on reducing the number of COVID-19 infections, while treatment has an impact that tends to take a long time of up to 120 days or more. It happens because people who are undergoing treatment can still transmit tuberculosis as long as the bacteria in their bodies are still active.
Optimal control
We performed the numerical simulation using optimal control (u*(t), v*(t)). The result of the numerical simulation is illustrated in Figures 7, 8, while the optimal control is illustrated in Figure 9.
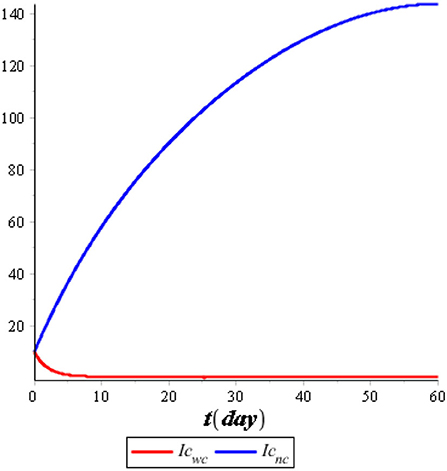
Figure 7. The COVID-19-infected individuals with control (Icwc) and no control (Icnc).
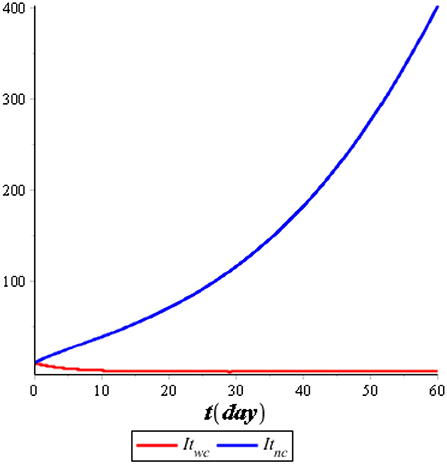
Figure 8. The tuberculosis-infected individuals with control (Itwc) and no control (Itnc).
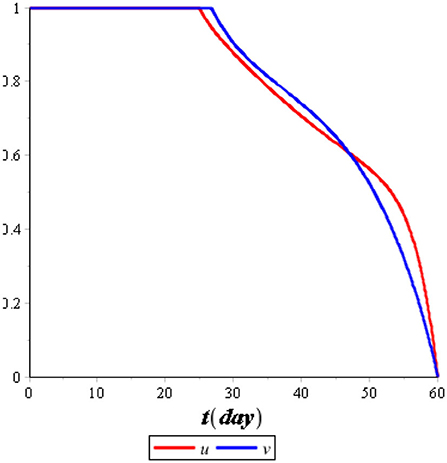
Figure 9. Optimal control u* and v*.
Figure 7 illustrates the comparison of the dynamics of IC with control u*(t) and no control. Also, Figure 8 illustrates the comparison of the dynamics of IT with control v*(t) and no control. Both controls are effective in reducing the spreading of COVID-19 and tuberculosis. It means that the prevention control for COVID-19 and tuberculosis is a recommended solution compared with no control for the population. Figure 9 illustrates the most effective control in 60 days. Therefore, we need to use 100% of the prevention control in the first 30 days, which can then be relaxed for the next 30 days.
Conclusion
In this research, we presented a coinfection model of tuberculosis and COVID-19 with the effect of isolation and treatment. The coinfection model has two basic reproduction numbers, namely, the basic reproduction number for COVID-19 and the basic reproduction number for tuberculosis. The disease-free equilibrium is locally asymptotically stable when ℜ0 < 1. Otherwise, the endemic equilibrium is locally asymptotically stable when ℜ0 > 1. Global sensitivity analysis was performed using the combination of LHS and PRCC. We analyzed the PRCC for three compartments, namely, individuals infected with COVID-19 (IC), individuals infected with tuberculosis (IT), and individuals coinfected with COVID-19 and tuberculosis (ITC). The most sensitive parameters to the model are the recovery rate of individuals infected with COVID-19 (αC), the infection rate of COVID-19 (γC), the recovery rate of individuals infected with tuberculosis (αT), the infection rate of tuberculosis (γT), and the recovery rate of individuals coinfected with tuberculosis and COVID-19 (αTC). We performed the optimal control in the form of prevention for COVID-19 and tuberculosis. The numerical simulation shows that these controls effectively reduce the infected population. The effect of isolation has an immediate impact on reducing the number of COVID-19 infections, while the effect of treatment has an impact that tends to take a longer time.
Data availability statement
The original contributions presented in the study are included in the article/supplementary material, further inquiries can be directed to the corresponding author/s.
Author contributions
FI, NA, and AS: study design, conceptualization, and methodology. NA and AS: validation, investigation, and supervision. NA: project administration and funding acquisition. FI: model formulation, software, writing, model analysis, simulation, and visualization. All authors have read and agreed to the published version of the manuscript.
Funding
This research is funded by Universitas Padjadjaran through Beasiswa Unggulan Pascasarjana Padjadjaran (BUPP) with contract number 2203/UN6.3.1/PT.00/2022.
Acknowledgments
The authors thank the Universitas Padjadjaran for supporting this research. The authors also thank the reviewers for the valuable review of this article.
Conflict of interest
The authors declare that the research was conducted in the absence of any commercial or financial relationships that could be construed as a potential conflict of interest.
Publisher's note
All claims expressed in this article are solely those of the authors and do not necessarily represent those of their affiliated organizations, or those of the publisher, the editors and the reviewers. Any product that may be evaluated in this article, or claim that may be made by its manufacturer, is not guaranteed or endorsed by the publisher.
References
1. United Nations. Transforming Our World: The 2030 Agenda for Sustainable Development. https://www.google.com/search?q=San+Francisco&stick=H4sIAAAAAAAAAOPgE-LQz9U3MC8xM1UCs1LMcgq0VLOTrfTzi9IT8zKrEksy8_NQOFZp-aV5Kakpi1h5gxPzFNyKEvOSM4uT83ewMu5iZ-JgAAC4aH05VQAAAA&sa=X&ved=2ahUKEwjQ4sui_Yv5AhXiEGIAHbItDfMQmxMoAXoFCI4BEAM San Francisco, CA: United Nations (2015).
2. Riley RL, Mills CC, O'Grady F. Sultan Lu, Wittstadt S, Shuvpuri DN. Infectiousness of air from a tuberculosis ward. Am Rev Respir Dis. (1961) 85:511–25.
3. World Health Organization. World Tuberculosis Day 2022. Available at: https://www.who.int/campaigns/world-tb-day/2022 (accessed April 30, 2022).
4. Ministry of Health, Indonesia. Tuberculosis Library Indonesia. Available at: https://tbindonesia.or.id/pustaka-tbc/dashboard-tb/ (accessed June 24, 2022).
5. Prawoto N, Purnomo EP, Zahra AA. The impacts of Covid-19 pandemic on socio-economic mobility in Indonesia. Int J Econ Bus Admin. (2020) 8:57–71. doi: 10.35808/ijeba/486
6. Worldometers. Reported Cases and Deaths by Country or Territory. Available at: https://www.worldometers.info/coronavirus/#countries (accessed April 30, 2022).
7. Zegarra MAA, Infante SD, Carrasco DB, Liceaga DO. COVID-19 optimal vaccination policies: A modeling study on efficacy, natural and vaccine-induced immunity responses. Math Biosci. (2021) 337:108614. doi: 10.1016/j.mbs.2021.108614
8. Diagne ML, Rwezaura H, Tchoumi SY, Tchuenche JM. A Mathematical Model of COVID-19 with Vaccination and Treatment. Comput Math Methods Med. (2021) 2021:250129. doi: 10.1155/2021/1250129
9. Inayaturohmat F, Anggriani N, Supriatna AK. Optimal control and sensitivity analysis of COVID-19 transmission model with the presence of waning immunity in West Java, Indonesia. Commun Math Biol Neurosci. (2022) 2022:19. doi: 10.28919/cmbn/7124
10. Inayaturohmat F, Zikkah RN, Supriatna AK, Anggriani N. Mathematical model of COVID-19 transmission in the presence of waning immunity. J Phys Conf Ser. (2021) 1722:012038. doi: 10.1088/1742-6596/1722/1/012038
11. Arruda EF, Das SS, Dias CM, Pastore DH. Modelling and optimal control of multi strain epidemics, with application to COVID-19. PLoS ONE. (2021) 16:0257512. doi: 10.1371/journal.pone.0257512
12. Rabiu M, Iyaniwura SA. Assessing the potential impact of immunity waning on the dynamics of COVID-19 in South Africa: an endemic model of COVID-19. Nonlinear Dyn. (2022) 109:203–23. doi: 10.1007/s11071-022-07225-9
13. Sasmita NR, Ikhwan M, Susyanto S, Chongsuvivatwong V. Optimal control on a mathematical model to pattern the progression of coronavirus disease 2019 (COVID-19) in Indonesia. Global Health Res Policy. (2020) 5:38. doi: 10.1186/s41256-020-00163-2
14. Abioye AI, Peter OJ, Ogunseye HA, Oguntolu FA, Oshinubi K, Ibrahim AA, et al. Mathematical model of COVID-19 in Nigeria with optimal control. Results Phys. (2021) 28:104598. doi: 10.1016/j.rinp.2021.104598
15. Salman AM, Ahmed I, Mohd MH, Jamiluddin MS, Dheyab, MA. Scenario analysis of COVID-19 transmission dynamics in Malaysia with the possibility of reinfection and limited medical resources scenarios. Comput Biol Med. (2021) 133:104372. doi: 10.1016/j.compbiomed.2021.104372
16. Zamir M, Nadeem F, Alqudah MA, Abdeljawad T. Future implications of COVID-19 through Mathematical modelling. Results Phys. (2022) 33:105097. doi: 10.1016/j.rinp.2021.105097
17. Masandawa L, Mirau SS, Mbalawata IS. Mathematical modeling of COVID-19 transmission dynamics between healthcare workers and community. Results Phys. (2021) 29:104731. doi: 10.1016/j.rinp.2021.104731
18. Kassa SM, Njagarah JBH, Terefe YA. Analysis of the mitigation strategies for COVID-19: From mathematical modelling perspective. Chaos Solitons Fractals. (2020) 138:109968. doi: 10.1016/j.chaos.2020.109968
19. Dwomoh D, Iddi S, Adu B, Aheto JM, Sedzro KM, Fobil J, et al. Mathematical modeling of COVID-19 infection dynamics in Ghana: Impact evaluation of integrated government and individual level interventions. Infect Dis Modell. (2021) 6:381–97. doi: 10.1016/j.idm.2021.01.008
20. Fatima B, Zaman G. Co-infection of Middle Eastern respiratory syndrome coronavirus and pulmonary tuberculosis. Chaos Solitons Fractals. (2020) 140:110205. doi: 10.1016/j.chaos.2020.110205
21. Das P, Nadim SS, Das S, Das P. Dynamics of COVID-19 transmission with comorbidity: a data driven modelling based approach. Nonlinear Dyn. (2021) 106:1197–211. doi: 10.1007/s11071-021-06324-3
22. Das P, Upadhyay RK, Misra AK, Rihan FA, Das P, Ghosh D. Mathematical model of COVID-19 with comorbidity and controlling using non-pharmaceutical interventions and vaccination. Nonlinear Dyn. (2021) 106:1213–27. doi: 10.1007/s11071-021-06517-w
23. Ssebuliba J, Nakakawa JN, Ssematimba A, Mugisha JYT. Mathematical modelling of COVID-19 transmission dynamics in a partially comorbid community. Partial Diff Equations Appl Math. (2022) 5:100212. doi: 10.1016/j.padiff.2021.100212
24. Omame A, Sene N, Nometa I, Nwakanma CI, Nwafor EU, Iheonu N, et al. Analysis of COVID-19 and comorbidity co-infection model with optimal control. Optimal Control Appl Methods. (2021) 42:1568–90. doi: 10.1002/oca.2748
25. Agusto FB, Adekunle AI. Optimal control of a two-strain tuberculosis-HIV/AIDS co-infection model. Biosystems. (2014) 119:20–44. doi: 10.1016/j.biosystems.2014.03.006
26. Magombedze G, Garira W, Mwenje E. Modeling the TB/HIV-1 Co-infection and the effects of its treatment. Int J Math Demogr. (2010) 17:12–64. doi: 10.1080/08898480903467241
27. Fatmawati, TH. An Optimal treatment control of TB-HIV coinfection. Int J Math Math Sci. (2016) 2016:8261208. doi: 10.1155/2016/8261208
28. Fatmawati TH. Optimal control of HIV resistance and tuberculosis co-infection using treatment intervention. Asian Pacific J Trop Dis. (2017) 7:366–73. doi: 10.12980/apjtd.7.2017D6-400
29. Majumder M, Tiwari PK, Pal S. Impact of saturated treatments on HIV-TB dual epidemic as a consequence of COVID-19: optimal control with awareness and treatment. Nonlinear Dyn. (2022) 109:143–76. doi: 10.1007/s11071-022-07395-6
30. Tanvi A, Aggarwal R, Raj YA. A fractional order HIV-TB co-infection model in the presence of exogenous reinfection and recurrent TB. Nonlinear Dyn. (2021) 104:4701–25. doi: 10.1007/s11071-021-06518-9
31. Moya EMD, Pietrus A, Oliva SM. Mathematical model with fractional order derivatives for Tuberculosis taking into account its relationship with HIV/AIDS and diabetes. Jambura J Biomath. (2021) 2:80–95. doi: 10.34312/jjbm.v2i2.11553
32. Pinto CMA, Carvalho ARM. The HIV/TB coinfection severity in the presence of TB multi-drug resistant strains. Ecol Complex. (2017) 32:1–20. doi: 10.1016/j.ecocom.2017.08.001
33. Tahir M, Shah SIA, Zaman G. Prevention strategy for superinfection mathematical model tuberculosis and HIV associated with AIDS. Cogent Math Stat. (2019) 6:1637166. doi: 10.1080/25742558.2019.1637166
34. Marimutu Y, Nagappa B, Sharma N, Basu S, Chopra KK. COVID-19 and tuberculosis: A mathematical model based forecasting in Delhi, India. Indian J Tuberculosis. (2020) 67:177–81. doi: 10.1016/j.ijtb.2020.05.006
35. Omame A, Abbas M, Onyenegecha CP. A fractional-order model for COVID-19 and tuberculosis co-infection using Atangana–Baleanu derivative. Chaos Solitons Fractals. (2021) 153:111486. doi: 10.1016/j.chaos.2021.111486
36. Goudiaby MS, Gning LD, Diagne ML, Dia BM, Rwezaura H, Tchuenche JM. Optimal control analysis of a COVID-19 and tuberculosis co-dynamics model. Inform Med Unlocked. (2022) 28:100849. doi: 10.1016/j.imu.2022.100849
37. Mekonen KG, Balcha SF, Obsu LL, Hassen A. Mathematical modeling and analysis of TB and COVID-19 coinfection. J Appl Math. (2022) 2022:2449710. doi: 10.1155/2022/2449710
38. Agusto, FB. Optimal isolation control strategies and cost-effectiveness analysis of a two-strain avian influenza model. Biosystems. (2013) 113:155–64. doi: 10.1016/j.biosystems.2013.06.004
39. Aissata AB, Mamadou L, Diagne ML, Mbaye I, Seydi O. A mathematical model for the impact of public health education campaign for tuberculosis. Far East J Appl Math. (2018) 100:97–138. doi: 10.17654/AM100020097
40. Nicholas JI, Adrian ER. Estimating SARS-CoV-2 infections from deaths, confirmed cases, tests, and random surveys. Proc Natl Acad Sci (PNAS). (2021) 118:2103272118. doi: 10.1073/pnas.2103272118
41. Diekmann O, Heesterbeek JAP, Metz JAJ. On the definition and the computation of the basic reproduction ratio R0 in models for infectious disease in heterogeneous populations. J Math Biol. (1990) 28:365–82.
42. Driessche PV, Watmough J. Reproduction numbers and sub-threshold endemic equilibria for compartmental models of disease transmission. Math Biosci. (2002) 180:29–48. doi: 10.1016/S0025-5564(02)00108-6
43. Boyce WE, DiPrima RC. Elementary Differential Equations and Boundary Value Problems. 9th ed. New York, NY: John Wiley & Sons, Inc (2009).
44. Marino S, Hogue IB, Ray CJ. A Methodology for performing global uncertainty and sensitivity analysis in systems biology. J Theor Biol. (2008) 254:178–96. doi: 10.1016/j.jtbi.2008.04.011
45. Tchoumi SY, Diagne ML, Rwezaura H. Malaria and COVID-19 co-dynamics: A mathematical model and optimal control. Appl Math Model. (2021) 99:294–327. doi: 10.1016/j.apm.2021.06.016
46. Lenhart S, Workman JT. Optimal Control Applied to Biological Models. Boca Raton: Chapman and Hall/CRC (2007).
Appendix 1
Coefficient values of the characteristic polynomial 0(λ):
Appendix 2
Coefficient values of the characteristic polynomial *(λ):
Keywords: mathematical model, tuberculosis, COVID-19, coinfection, isolation, treatment, PRCC, optimal control
Citation: Inayaturohmat F, Anggriani N and Supriatna AK (2022) A mathematical model of tuberculosis and COVID-19 coinfection with the effect of isolation and treatment. Front. Appl. Math. Stat. 8:958081. doi: 10.3389/fams.2022.958081
Received: 31 May 2022; Accepted: 05 July 2022;
Published: 24 August 2022.
Edited by:
Mohd Hafiz Mohd, Universiti Sains Malaysia (USM), MalaysiaReviewed by:
Amirah Azmi, Universiti Sains Malaysia (USM), MalaysiaSyaza Latif, MARA University of Technology, Malaysia
Copyright © 2022 Inayaturohmat, Anggriani and Supriatna. This is an open-access article distributed under the terms of the Creative Commons Attribution License (CC BY). The use, distribution or reproduction in other forums is permitted, provided the original author(s) and the copyright owner(s) are credited and that the original publication in this journal is cited, in accordance with accepted academic practice. No use, distribution or reproduction is permitted which does not comply with these terms.
*Correspondence: Nursanti Anggriani, bnVyc2FudGkuYW5nZ3JpYW5pQHVucGFkLmFjLmlk