 Fabio Augusto Scalet Medina*
 Herbert Kimura
- Department of Management, University of Brasília – UNB, Brasília, Brazil
The main objective of the present study was to determine whether the COVID-19 pandemic impacted the frequency and severity of financial institutions' operational losses. We selected four types of operational-risk events and, applying linear regression, concluded that the pandemic impacted the severity of operational losses. In terms of the frequency of operational losses, we observed no statistically significant difference between pre- and postpandemic losses; however, regarding the severity of losses, we observed an increase in the postpandemic period for the aggregate data, and when analyzing the types of operational-risk events individually, we observed that the frequency of some events increased and others decreased after the pandemic, necessitating a detailed investigation into the reasons for the increase or decrease in the severity of losses.
Introduction
In the banking segment, the risk is associated with the possibility of financial losses. After the publication of the Basel Accords and the consequent increased regulation of the sector, risk management gained importance, and several procedures, mechanisms, and models for measuring and controlling risks have been developed and improved.
The main types of risk to which financial institutions are exposed are credit risk, market risk, and operational risk (OR) [1]. After the 2007–2008 crises, the liquidity risk also received regulatory bodies' attention.
Operational risk is defined as the possibility of losses resulting from external events or failures; deficiency; or inadequacy of internal processes, people, or systems, including the legal risk associated with inadequacy or deficiency in contracts signed by the financial institution (FI), as well as sanctions due to non-compliance with legal provisions and compensation for damages to third parties arising from the institution's activities [2].
The Basel Committee began discussing OR in 2001 with the publication of the document “Operational Risk,” which provides the definition and initial discussions on the topic [3]. This document's publication triggered many studies, such as that of Cruz [4], one of the pioneers to address the use of statistical techniques to measure OR, and Hoffman's [5], which presents an overview of OR management.
In June 2004, the Basel Committee published the New Basel Capital Accord, or Basel II [6], introducing capital measurement requirements for OR by the standardized methods, e.g., Basic Indicator Approach (BIA) and The Standardized Approach (TSA) and the advanced method, e.g., Advanced Measurement Approach (AMA) [7].
More specifically, the Loss Distribution Approach (LDA) is the most used methodology in AMA for measuring the economic capital of OR. LDA is a parametric technique that consists of separately estimating a distribution for the frequency (amount of occurrence) of operational losses and distribution of the severity (monetary value) of losses and combining these two distributions to obtain the aggregate distribution of losses [8].
Commonly used discrete probability distributions to represent the frequency of operational losses are the Poisson and the Negative Binomial distributions. The Lognormal, Exponential, Weibull, and Gamma are the most commonly used continuous probability distribution to represent the severity of losses [9–11].
After obtaining the aggregate distribution of losses, economic capital, also known as Value at Risk (VaR), is defined at the 99.9% percentile of this distribution [12].
Regarding the statistical techniques used to measure loss distributions and consequently obtain the operational VaR, the studies by Shevchenko [12], Dalla Valle and Giudici [13], and Giudici and Bilotta [14] propose the use of the Bayesian statistical approach, whereas the study by Fantazzini et al. [15] suggests the use of copula distributions to model high dimensional operational risks in a more flexible way, since classical approaches treat operational loss distributions for different factors as perfectly dependent, overestimating the VaR.
To simplify the risk measurement mechanism and seek greater comparability and sensitivity to the regulatory capital of operational risk of banks [16], the Basel Committee on Banking Supervision, represented by the Working Group of Operational Risk (WGOR), developed a new regulatory capital model. It was initially called Standardized Measurement Approach (SMA) and later simplified to Standardized Approach (SA), incorporated into the Basel III framework.
The SA method differs from other standardized methods in terms of exposure to operational risk and the probability of risk materialization. The model first appears with the Basle committee on banking supervision [16], bringing a new proxy for exposure to operational risk—the Business Indicator (BI), replacing the Gross Income used in the BIA and TSA methods.
After public consultation and discussion between banks and regulatory bodies on the new model, operational risk guidelines were revisited. Adjustments were made to the operational risk exposure indicator and coefficients (probabilities of risk). The current model was published in the final Basel III standards, released by the BCBS in December 2017 [2].
Considering the Basel III framework, Mignola et al. [17] analyzed the behavior of the SMA methodology under real and hypothetical conditions and concluded that the new methodology is retrograde in terms of the ability to measure risks and fails to create a link between OR management actions and the performance of capital requirements. The authors analyzed the study banks of the same size and operational loss profile that discover a similar operational vulnerability. One of these banks decides to invest heavily in improvements (controls and resources), while the second bank decides to do absolutely nothing. According to the SMA methodology, the two banks will continue with a similar capital requirement for many years. However, through the AMA methodology, the first bank can demonstrate that its risk profile has been reduced through internal estimates.
Migueis [18] reports that the AMA is complex and does not allow comparability, and the SMA lacks sensitivity to risk and is unlikely to be adequately conservative. For these reasons, the author proposes the adoption of the Forward-looking and Incentive-compatible approach (FIA), an operational risk capital framework that balances appropriate conservatism, robustness, risk sensitivity, comparability, stability, simplicity, and utility for risk management and the advancement of quantification.
According to Basle Committee on Banking Supervision [19], a new version of the document OPE25-Standardized Approach, which contains the capital requirements for Operational Risk with the new methodology will be effective as of 1 January 2023.
Operational risk is highly relevant due to the large amounts of effective losses and capital allocated to financial institutions. In terms of significant losses, we have the classic case of OR associated with the collapse of Banco Barings in 1995, which, due to failures in internal controls, resulted in losses of USD 1.3 billion [20]. Other known cases of OR events were unauthorized operations that led to the losses of €850 million at AIB in 2002 and €1.5 billion at UBS in 2011 [21].
In terms of capital required for exposure to OR, Sands et al. [22] reported that, on average, 15.6% of the risk-weighted assets (RWA) of the institutions that make up the global systematically important banks (GSIB) refer to OR, the second most relevant risk, behind credit risk.
Given the topic's relevance for the banking segment, we focused on OR. Specifically, we associated OR with the COVID-19 pandemic, which is considered the biggest international public health emergency in decades and has had several effects on society. The measures several countries adopted to contain the virus include social distancing, closing schools, restricting the opening of commerce, banning public events, and adopting remote work in various sectors of the economy [23]. Given these new behavioral contexts and work situations, we investigated whether OR events underwent significant changes.
Regarding analyses of the pandemic's impact, Kaushik and Guleria [24] examined governments' adoption of lockdowns to reduce infection rates and the incorporation of companies into the telework regime. In this context, OR events related to inappropriate practices may be associated with customers. Products and services may have changed and given the very intense use of technologies for remote work, system failures may have increased.
According to Xiong et al. [25], the COVID-19 pandemic has resulted in risks to mental health worldwide, with increased rates of anxiety, depression, posttraumatic stress disorder, psychological distress, and general stress in the population in eight countries, whose risk factors associated with mental distress during the COVID-19 pandemic include being female, belonging to a younger age group (≤40 years), the presence of chronic/psychiatric illnesses, unemployment, student status, and frequent exposure to social media/news about COVID-19. Such effects of the pandemic on the population can lead to increased losses related to internal fraud or the failure of processes.
In addition to changes in the way of working and the population's mental health, 20 analyzed the cybersecurity problems that occurred during the COVID-19 pandemic and emphasized the correlation between the pandemic and the increase in cyberattacks targeting vulnerable sectors. They found that the growth of anxiety and fear due to the pandemic increased cyberattacks' success rate and that cyber security, in relation to work from home, increased the possibility of phishing and ransomware attacks. Note that this study is directly related to the OR classification “failures in systems, processes, or information technology infrastructure.”
On the COVID-19 pandemic's impact on the financial stock market, Zhang et al. [26] reported that markets have seen a dramatic movement and that global financial market risks have increased substantially due to pandemic-related uncertainties, making them highly volatile and unpredictable. The authors also pointed out that individual stock market reactions are related to the severity of the outbreak in each country. An employee who is stressed about having lost a considerable amount of money in the stock market may be more exposed to operational risk.
Demirgüç-Kunt et al. [27] examined the impact of financial sector policy announcements on bank actions worldwide during the onset of the COVID-19 crisis. The authors reported that liquidity support, customer/borrower assistance programs, and monetary easing moderated the crisis's adverse impact, but these policies' impacts varied considerably across banks and countries. On the other hand, the authors argued that countercyclical prudential measures led to negative abnormal returns in bank shares, suggesting that markets price the negative risks associated with these policies.
In view of the mentioned impacts, we noted that the pandemic may have influenced the frequency and severity of financial institutions' operational losses, making this a relevant topic to be studied and raising questions, such as “Did the pandemic affect financial institutions' operational losses?” and “Which events were the most affected?”
Therefore, we aimed to verify whether the COVID-19 pandemic affected a financial institution's operational losses and which OR events had the greatest impact.
Materials and methods
The data used in this research refer to real information from a nationwide Brazilian Commercial bank, which is among the top three in terms of a number of customers and its portfolio is made up of housing loans, commercial and agribusiness credit products, aimed at retail and small and medium-sized companies. The operational losses data that occurred from 03/2019 to 12/2019 and from 03/2020 to 12/2020 to reflect the beginning of the pandemic. We selected OR events related to four types, as shown in Table 1:
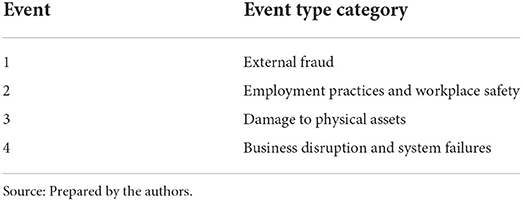
Table 1. Event type category (level 1) of selected events.
It is worth mentioning that, for reasons of confidentiality, we will not provide a detailed description of the selected OR events. Another important point to highlight is that we multiplied the losses by a constant, also guaranteeing the confidentiality of information on the scale of losses.
The variables contained in the Operational Loss Database are (a) the date of occurrence of the loss, (b) the unit responsible for the loss, (c) the classification of the OR event, and (d) the loss amount.
Descriptive statistics of the variables were obtained, as well as non-parametric tests of median comparison, to verify whether there was a difference between pre- and postpandemic periods.
Linear regression was also used to verify if operational losses from 03/2019 to 12/2019 are statistically different from the losses from 03/2020 to 12/2020. To do so, we applied the regression without intercept, and if the angular coefficient was statistically different from 1, we concluded that there is a difference between operational losses before and after the COVID-19 pandemic.
To increase the sample size of the severity variable, we decided to apply the bootstrap resampling technique. Therefore, we obtained 50 samples for each monthly observation for each year and type of event, increasing the number of observations of each event from 20 to 1,000, with 500 in 2019 and 500 in 2020. We ordered this sample of 500 observations in each year to form pairs and apply linear regression.
It is noteworthy that we did not apply the bootstrap technique for the frequency because this variable refers to the number of occurrences in a month, there being no more than one value for this variable in each month.
After a descriptive analysis of the data, we decided to use the logarithmic transformation for data to reduce variability [28]. That said, the models developed were:
βi = parameter of Log(Severity2019) for event type i;
εi = model error term for event type i;
i = event type.
β = parameter of Log(Frequency2019);
ε = model error term.
Results
Initially, a descriptive analysis of the original data was performed, measuring statistical measures of position and dispersion. Table 2 below presents the descriptive statistics of the monthly frequency of the complete base by year.
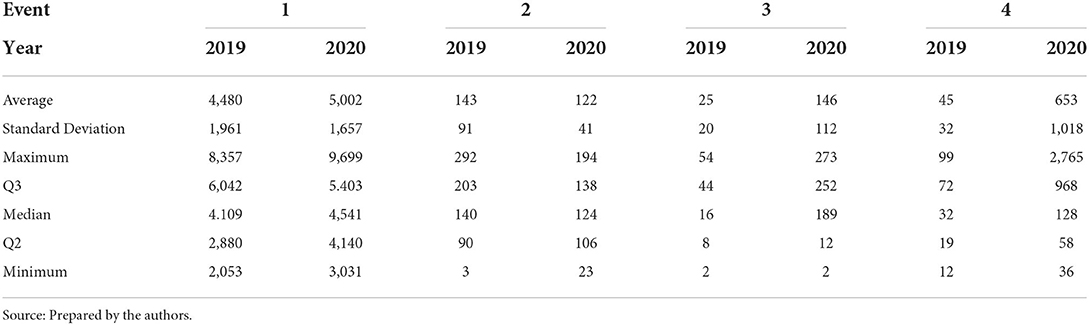
Table 2. Monthly frequency statistics, by event and year.
Events 2, 3, and 4, which respectively refer to employment practices and workplace safety, damage to physical assets, business disruption, and system failures, have a low average monthly frequency compared with event 1, the latter being related to external fraud.
In absolute terms, we noted that the frequency of events 1, 3, and 4 increased from 2019 to 2020, with event 2 showing a reduction in the same period.
Table 3 below presents the descriptive statistics of the average monthly severity of the complete base by year and event 3, which refers to damage to physical assets the institution owns or uses, has the highest average monthly severity, followed by events 2, 4, and 1.
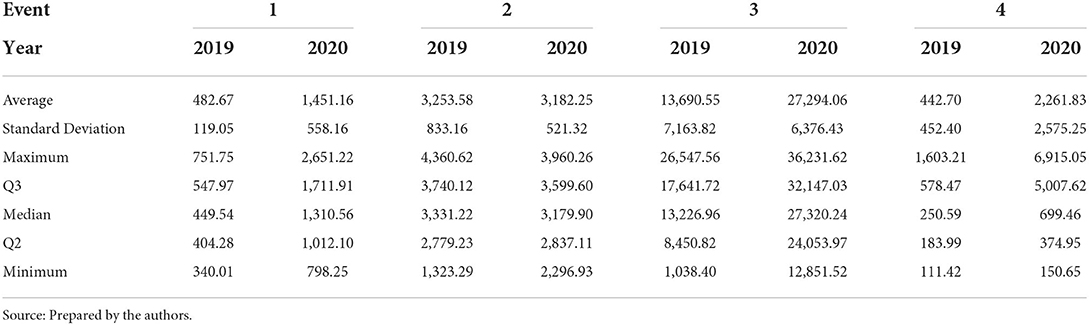
Table 3. Average monthly severity statistics (in R$), by event and year.
In absolute terms, we noted that the average monthly severity of losses in 2020 of events 1, 3, and 4 increased from 2019, with only event 2, which refers to employment practices and workplace safety, presenting a slight reduction in the analyzed period.
After performing the descriptive analysis, the next step was to verify the existence of evidence of changes in the frequency and severity series before and after the COVID-19 pandemic and, to test this hypothesis, the following non-parametric tests were applied: Wilcoxon signed-rank test for frequency, as it is a discrete variable and the sign test for severity, as it is a continuous variable. The data used have 10 pairs for frequency and 10 for severity, as shown in the example contained in Table 4:
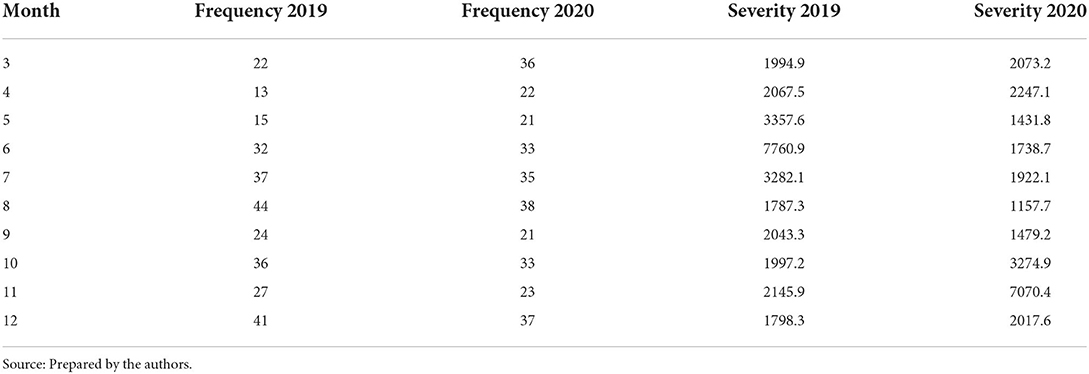
Table 4. Example of a table used for non-parametric tests.
The results obtained are shown in Table 5:
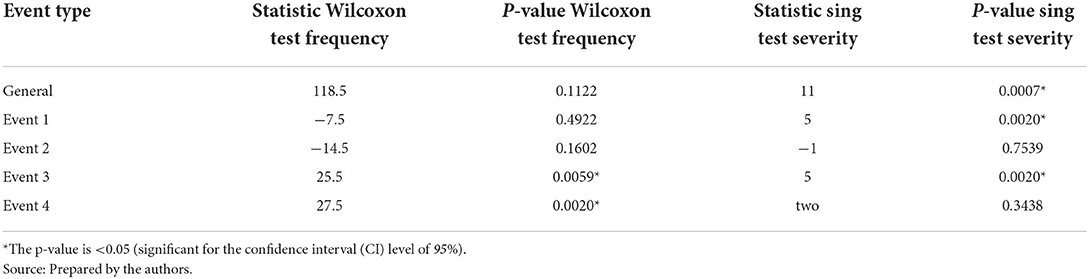
Table 5. Results of non-parametric tests for Monthly Frequency and Average Monthly Severity.
It is noted that the tests were significant for the general Severity data, for the Frequency of Events 3 and 4, and for the Severity of Events 1 and 3. In these cases, we reject the null hypothesis of equality of medians for the two populations.
The next stage of the study consisted of the application of linear regression. For the frequency of losses, a single model was developed, using the total database, containing the 4 selected events, without performing a bootstrap, since the monthly frequency is measured by counting events where each event is equivalent to 1.
For the severity of losses, five models were developed, using the database obtained through Bootstrap. In the first, we explored a general model using aggregated data of the 4 selected operational risk events. In the other four regression models, we analyzed the severity for each type of event individually.
Table 6 below presents the results of the regression models.
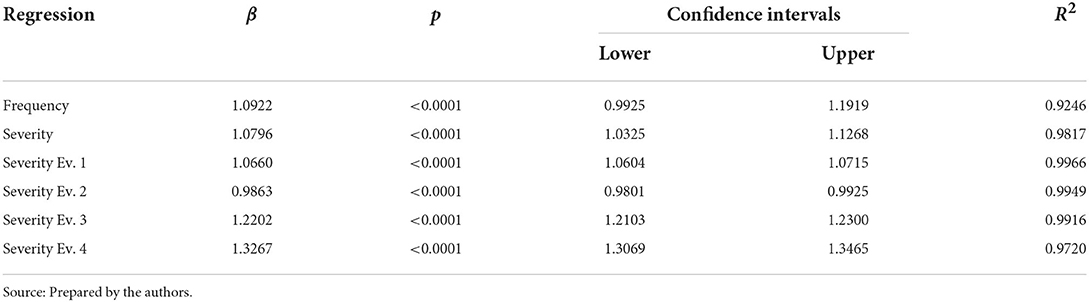
Table 6. Frequency and severity models.
The resulting models can be expressed by equations as follow.
Analyzing the p-value of the estimated parameters β, it is noted that all coefficients were statistically significant, rejecting the null hypothesis that these coefficients are zero.
Taking into account the confidence intervals (CIs), all coefficients except the one for the frequency, do not cover the value 1, suggesting that there is a difference between the losses before and after the pandemic.
Regarding frequency and severity of losses, using the total database and application of logarithmic transformation, an increase was observed in 2020 compared with the same period in 2019; however, when checking the severity of the event types individually, we found that some events showed a reduction and others an increase.
Events 1, 3, and 4 showed an increase in severity from 2019 to 2020, with event 2 showing a reduction in the same period.
The events that showed an increase in severity after the pandemic are related to external fraud, damage to physical assets, and failures in systems. The events that showed a reduction refers to aspects of labor legislation and safety in the workplace.
The event that showed the greatest increase in severity in the post-pandemic period was event 4 (β = 1.32), which is related to systems failure, whose motivators may be related to greater customer access due to the closing of face-to-face service points, corroborating Pranggono and Arabo's [29] study regarding the correlation between the pandemic and the increase in cyberattacks.
Event 3 presented the second highest increase (β = 1.22) after the beginning of the pandemic and refers to the damage to physical assets the institution owned or uses. A possible explanation for this increase is that the population, when faced with bank branches closed by the government-imposed lockdown, increased the intensity of acts of vandalism and depredation of the units.
Event 1, related to external fraud, showed a slight increase (β = 1.06) after the beginning of the pandemic. Pranggono and Arabo [29] reported that the growth in anxiety and fear in the population due to the pandemic increased the success rate of cyberattacks, which may be one of the explanations for the result obtained. Another cause to be studied is the possible relationship with the increase in unemployment, which can lead to an increase in the severity of illicit acts for income generation.
Event 2, related to aspects of labor legislation and safety in the workplace, showed a slight decrease in the postpandemic period (β = 0.98). The government-imposed lockdown, the consequent stoppage of face-to-face activities, and migration from work to home offices may be related to this result.
Discussion
The main objective of this study was to verify whether the COVID-19 pandemic affected a Brazilian financial institution's operational losses. The results indicate that there is a difference between the severity of operational losses in the pre- and postpandemic periods for all selected OR events.
The results can help the financial institution create people strategies, specifically processes that can be performed from home offices, thus reducing costs for the institution.
The results can also help identify weaknesses in the processes that contribute to the occurrence of OR losses, helping the institution's internal controls area prepare action plans to mitigate and correct these weaknesses.
We discussed some causes for the difference between pre- and postpandemic severities in the previous section, and we summarize them below:
• Event 1, related to external fraud, showed a slight increase. One possible explanation might be the increase in anxiety and fear in the population due to the pandemic, as 20 discussed. Other possible explanations are fraudsters' increasing success rate and the increase in unemployment, which may lead to an increase in the severity of illicit acts to generate income.
• Event 2, related to aspects of labor legislation and safety in the workplace, showed a slight decrease in the postpandemic period, possibly due to the interruption of face-to-face activities and employees' migration to home offices.
• Event 4, related to systems failure, showed an increase after the beginning of the pandemic, which may be related to greater access to systems via online customer service due to the closing of face-to-face service points. This finding corroborates Pranggono and Arabo's [29] study regarding the correlation between the pandemic and the increase in cyberattacks.
• Event 3, related to damage to physical assets the institution owns or uses, may have increased due to the possible revolt of the population when facing bank branches closed by the lockdown, increasing vandalism and depredation of the units.
It is important to note that we focused only on comparing specific data on the frequency and severity of losses without taking into account other variables that may affect the relationship between the pandemic and OR. For example, we did not take into account changes in operational volumes, economic activity, customer behavior, employees, external fraud attempts, etc., which researchers may address in further studies.
In future work, researchers may try to identify the possible causes for the differences identified in this study. Other studies could explore predictive models to estimate the severity of operational losses using explanatory variables related to the discussions above to validate the hypotheses presented. After developing the predictive models, researchers could elaborate scenarios with the model's explanatory variables to obtain the stressed estimates, thus conducting stress tests.
Data availability statement
The datasets presented in this article are not readily available because the data is confidential. Requests to access the datasets should be directed to the corresponding author.
Author contributions
This study is part of the doctoral thesis in finance by student FM, supervised by HK. All authors contributed to the article and approved the submitted version.
Conflict of interest
The authors declare that the research was conducted in the absence of any commercial or financial relationships that could be construed as a potential conflict of interest.
Publisher's note
All claims expressed in this article are solely those of the authors and do not necessarily represent those of their affiliated organizations, or those of the publisher, the editors and the reviewers. Any product that may be evaluated in this article, or claim that may be made by its manufacturer, is not guaranteed or endorsed by the publisher.
References
1. Dutta K, Perry J. A Tale of Tails: An Empirical Analysis of Loss Distribution Models for Estimating Operational. Risk Capital, Working Paper, Federal Reserve Bank of Boston. (2006) doi: 10.2139/ssrn.918880
2. Basle Committee on Banking Supervision BCBS. Basel III: Finalising Post-Crisis Reforms. Bank for International Settlements. (2017). Available online at: https://www.bis.org/bcbs/publ/d424.htm (accessed April 10, 2022).
3. Basle Committee on Banking Supervision (BCBS). Operational Risk - Supporting Document to the New Basel Capital Accord. Bank for International Settlements (2001). Available online at: http://www.bis.org/publ/bcbsca07.pdf (accessed April 10, 2022).
4. Cruz MG. Modeling, Measuring and Hedging Operational Risk. New York, NY: John Wiley and Sons (2002).
5. Hoffman DG. Managing Operational Risk: 20 Firmwide Best Practice Strategies Vol. 109. New York, NY: John Wiley and Sons (2002).
6. Basle Committee on Banking Supervision (BCBS). International Convergence of Capital Measurement Capital Standards: A Revised Framework. Bank for International Settlements. (2004). Available online at: http://www.bis.org/publ/bcbs107.htm (accessed April 10, 2022).
7. Chernobai A, Yildirim Y. The dynamics of operational loss clustering. J Bank Finance. (2008) 32:2655–66. doi: 10.1016/j.jbankfin.2008.06.001
8. Chapelle A, Crama Y, Hübner G, Peters JP. Practical methods for measuring and managing operational risk in the financial sector: a clinical study. J Bank Finance. (2008) 32:1049–61. doi: 10.1016/j.jbankfin.2007.09.017
9. Moscadelli M. The Modelling of Operational Risk: Experience With the Analysis of the Data Collected by the Basel Committee. Technical Report, Bank of Italy (2004). doi: 10.2139/ssrn.557214
10. Panjer HH. Operational Risk: Modeling Analytics, Vol. 620. Hoboken, NJ: John Wiley and Sons (2006). doi: 10.1002/0470051310
11. Klugman SA, Panjer HH, Willmot GE. Loss Models: From Data to Decisions (Vol. 715). Hoboken, NJ: John Wiley and Sons (2012). doi: 10.1002/9781118787106
12. Shevchenko PV. Modelling Operational Risk Using Bayesian Inference. Berlin; Heidelberg: Springer-Verlag (2011).
13. Dalla Valle L, Giudici P. A Bayesian approach to estimate the marginal loss distributions in operational risk management. Comput Stat Data Anal. (2008) 52:3107–27. doi: 10.1016/j.csda.2007.09.025
14. Giudici P, Bilotta A. Modelling operational losses: a Bayesian approach. Qual Reliability Eng Int. (2004) 20:407–17. doi: 10.1002/qre.655
15. Fantazzini D, Dalla Valle L, Giudici P. Copulae and operational risks. Int J Risk Assess Manag. (2008) 9:238–57. doi: 10.1504/IJRAM.2008.019743
16. Basle Committee on Banking Supervision (BCBS). Operational Risk - Revisions to the Simpler Approaches. Bank for International Settlements (2014). Available online at: https://www.bis.org/publ/bcbs291.htm (accessed April 10, 2022).
17. Mignola G, Ugoccioni R, Cope E. Comments on the basel committee on banking supervision proposal for a new standardized approach for operational risk. J Oper Risk. (2016) 11:51–69. doi: 10.21314/JOP.2016.184
18. Migueis M. Forward-looking and incentive-compatible operational risk capital framework. J Oper Risk. (2018) 13:1–15. doi: 10.21314/JOP.2018.219
19. Basle Committee on Banking Supervision (BCBS). Calculation of RWA for Operational Risk. Bank for International Settlements (2019). Available online at: https://www.bis.org/basel_framework/standard/OPE.htm (accessed April 10, 2022).
20. McNulty JE, Akhigbe A. What do a bank's legal expenses reveal about its internal controls and operational risk? J Financ Stability. (2017) 30:181–91. doi: 10.1016/j.jfs.2016.10.001
21. Sturm P. Operational and reputational risk in the European banking industry: the market reaction to operational risk events. J Econ Behav Organ. (2013) 85:191–206. doi: 10.1016/j.jebo.2012.04.005
22. Sands P, Liao G, Ma Y. Rethinking operational risk capital requirements. J Financ Regul. (2018) 4:1–34. doi: 10.1093/jfr/fjx009
23. Bastos SB, Cajueiro DO. Modeling and forecasting the early evolution of the COVID-19 pandemic in Brazil. Sci Rep. (2020) 10:19457. doi: 10.1038/s41598-020-76257-1
24. Kaushik M, Guleria N. The impact of pandemic COVID-19 in workplace. Eur J Bus Manag. (2020) 12:10. doi: 10.7176/EJBM/12-15-02
25. Xiong J, Lipsitz O, Nasri F, Lui LM, Gill H, Phan L, et al. Impact of COVID-19 pandemic on mental health in the general population: a systematic review. J Affect Disord. (2020) 277:55–64. doi: 10.1016/j.jad.2020.08.001
26. Zhang D, Hu M, Ji Q. Financial markets under the global pandemic of COVID-19. Finance Res Lett. (2020) 36:101528. doi: 10.1016/j.frl.2020.101528
27. Demirgüç-Kunt A, Pedraza A, Ruiz-Ortega C. Banking sector performance during the covid-19 crisis. J Bank Finance. (2021) 133:106305. doi: 10.1016/j.jbankfin.2021.106305
28. Curran-Everett D. Explorations in statistics: the log transformation. Adv Physiol Educ. (2018) 42:343–7. doi: 10.1152/advan.00018.2018
Keywords: operational risk, financial institution, operational losses, COVID-19 pandemic, risk management
Citation: Medina FAS and Kimura H (2022) Impacts of the COVID-19 pandemic on operational losses. Front. Appl. Math. Stat. 8:940102. doi: 10.3389/fams.2022.940102
Received: 09 May 2022; Accepted: 01 July 2022;
Published: 15 August 2022.
Edited by:
Marina Resta, University of Genoa, ItalyReviewed by:
Dragos Bozdog, Stevens Institute of Technology, United StatesPaolo Giudici, University of Pavia, Italy
Copyright © 2022 Medina and Kimura. This is an open-access article distributed under the terms of the Creative Commons Attribution License (CC BY). The use, distribution or reproduction in other forums is permitted, provided the original author(s) and the copyright owner(s) are credited and that the original publication in this journal is cited, in accordance with accepted academic practice. No use, distribution or reproduction is permitted which does not comply with these terms.
*Correspondence: Fabio Augusto Scalet Medina, ZmFiaW9hc20xQHlhaG9vLmNvbS5icg==