 Wirdatul Aini
 Kamal Khairudin Sukandar
 Nuning Nuraini
 Dewi Handayani
- 1Mathematics Department, Faculty of Mathematics and Natural Sciences, Institut Teknologi Bandung, Bandung, Indonesia
- 2Center of Mathematical Modeling and Simulation, Institut Teknologi Bandung, Bandung, Indonesia
Consideration of human mobility is essential for understanding the behavior of COVID-19 spread, especially when millions of people travel across borders around Eid al-Fitr. This study aims to grasp the effect of mass exodus between regions on active cases of COVID-19 through a mathematical perspective. We constructed a multiregional SIQRD (susceptible–infected–quarantined–recovered–death) model that accommodates the direct transfer of people from one region to others. The mobility rate was estimated using the proposed Dawson-like function, which requires data from an origin–destination matrix. Assuming that only susceptible, inapparently infected, and recovered individuals travel around Eid al-Fitr, the rendered model well-depicted the actual data at that time, giving either a significant spike or decline in the number of active cases due to the mass exodus. Most agglomerated regions such as Jakarta and Depok City experienced a fall in active case numbers, both in actual data and in the simulated model. However, most rural areas experienced the opposite, such as Bandung District and Cimahi City. This study confirmed that most travelers journeyed from big cities to the rural regions, and it scientifically demonstrated that mass mobility affects COVID-19 transmission between areas.
Introduction
The COVID-19 pandemic at the beginning of 2020 echoed across all countries. That high-spreader virus has led leaders in almost all countries to apply similar policies: restricting people's movement except for grocery shopping. This policy is expected to reduce human-to-human interactions, leading to the decline of COVID-19 case numbers [1]. This restriction lasted for most of 2020, even though some relaxation had occurred in some countries. In India, the government eased the lockdown after a significant decline in COVID-19 cases, allowing more people to be mobile. A surge in COVID-19 cases was identified after the first relaxation, which was believed to be a direct implication of the relaxation [2].
The Centers for Disease Control and Prevention (CDC) has been consistently providing recommendations regarding restrictions on the movement of people to suppress the spread of the virus in the population since March 8th, 2021 [3]. These restrictions on movement are based on several factors: the number of COVID-19 cases in the community, exposure during travel, the level of crowding in a place, and so on. It is clear that the higher the number of COVID-19 cases in a community and the more crowded a place is, the greater the chance of being exposed to the virus. This provides a strong rationale for restricting movement to suppress the spread of infection.
In line with what the CDC recommends, movement restrictions have also been implemented in several provinces of Indonesia with high numbers of COVID-19 cases. For example, Jakarta employs PSBB (large-scale social restrictions), which limits the movement of Jakarta residents through restrictions on schools and workplaces, cessation of religious activities in places of worship, restrictions on activities in public places or facilities, restrictions on sociocultural activities, and on transportation activities. By the end of 2020, the PSBB had been implemented 12 times in Jakarta [4]. By the end of February 2021, the macro and micro PPKM (enforcement of community activity restrictions) was implemented to respond to a significant increase in cases in Jakarta, reaching more than 3,000 new cases per day [5]. In general, PPKM is similar to PSBB but applies to the Java and Bali regions.
Ahead of Eid al-Fitr 1442 Hijri, a mass exodus (a trip to one's hometown) is unavoidable, which will lead millions of people to leave on their odysseys [6]. Even though there was a significant drop in the number of travelers in 2020, it was expected that the number would rebound in 2021 [7]. The mass mobility was believed to trigger more infections since the inapparently infected could travel across borders. As shown earlier in China, the human mobility due to Chinese New Year did result in variations in disease incidence between cities. Cities that were closer to the epidemic center and with a higher population in urban areas faced higher risks of disease incidence [8].
In this study, a multiregional mathematical model that accommodates the mobility of people between regions was constructed. The model was a generalized SIQRD model that split the population into five groups: susceptible, infected, quarantined, recovered, and deaths. The additional parameters representing the time-dependent mobility rate from one region to another were depicted by the modified Dawson function. Such parameters were estimated by means of the proposed algorithm requiring data from an origin–destination matrix. The numerical simulations of the constructed model depicted how the mobility rate between regions could affect the surge or decline in the number of COVID-19 cases.
Context
Mudik: Indonesia's Annual Mass Exodus
Mudik or Balik Kampung are common terms used by Indonesian people to represent migrants or migrant workers returning to their hometowns or villages before significant holidays, such as Lebaran (Eid al-Fitr) or Chinese New Year [9]. The primary motivation of this tradition is to visit family, especially parents. Further, many of them return to their homes to attend a rare opportunity: a gathering of members of their extended families who are seldomly seen and are typically scattered in other cities, other provinces, or even overseas. Mudik Eid al-Fitr or similar traditions can also be found in other Muslim-majority countries, such as Egypt and Bangladesh [10].
The average number of total travelers in such exoduses in Indonesia, especially during Eid al-Fitr, is ~30 million [11]. Even though the travel related to the mudik homecoming before Lebaran takes place in most Indonesian urban centers, the emphasis is on the nation's largest urban agglomeration Greater Jakarta, as millions of Jakartans exit the city by various means of transportation, overwhelming train stations and airports, and also clogging highways. Annually, the number of travelers during the exodus shows a constant pattern: gradually increasing from 2 weeks prior to the holy day and reaching its spike 2 days before it. The reversed mobility pattern is also shown days after the holiday, representing the return of migrants from their destination [12].
Every year, the total number of Eid al-Fitr homecomings has shown a significant increase except in 2020 [13], as the number of travelers dropped to almost zero, given the global pandemic. However, based on the survey data obtained by Angkutan Lebaran Research Group, the expected number of travelers on the 2021 Eid al-Fitr mudik will have increased and thus could have increased the chance of infection from COVID-19 due to the increasing rate of person-to-person interactions. Even worse, Jakarta was projected to contain more than 50% of the total recorded cases in Indonesia by April 2021; consequently, the mudik exodus would result in more virus spreaders traveling. The combination of the Delta variant with human mobility and an uncontrollable situation results in an environment suitable for the spread and mutation of viruses [14].
One of the favorite provinces as a mudik destination is West Java [15], a neighboring province situated southeast of Jakarta. As the home of 48.6 million inhabitants, West Java comprises 27 cities/districts, having had more than 30 thousand active cases by April 2021 [16], far below the cases recorded in the capital city of Jakarta. Every year, the exodus can move more than 20% of the total population of Jakarta into West Java, entering various cities and districts [17]. The mass movement of people from Red Zone Jakarta to West Java is believed to affect the spread of COVID-19 recorded in regions of West Java.
Available Datasets
The Public Health Office of West Java provided the data for COVID-19 spread for each city/district, which comprises three time-series datasets: the number of active cases, recovered, and individuals deceased due to COVID-19 infections [16]. The data interval ranged from early March 2020 until October 2021. In this case study, for May 2021, only the data until the time of the mass exodus for Eid al-Fitr on May 13th, 2021 were considered as representing the spread. The data used to estimate the parameters in model (1) will be explained further in the next section.
Further, the survey of the mudik preferences of Indonesian citizens was provided. In brief, the survey collected the preferences of the citizens as to whether they were going to conduct mudik or not. If yes, the origin and destination regions were recorded [18]. The number of participants in this survey was ~62,000, and was distributed mostly to Java citizens. The survey data were intended to estimate the origin–destination matrix for the Eid al-Fitr 2021 exodus. The origin–destination matrix is a two-dimensional matrix that contains information about the magnitude of the movement between locations (zones) within a certain area [19].
Mathematical Modeling
Generic SIQRD Model
The compartment-approach model is based on the generic model first introduced by Kermack [20], but was modified by accommodating vaccination, quarantine, and reinfection aspects. Thousands of papers related to the model involving several aspects on the spread of COVID-19 have been published. Several papers using data from Indonesia, i.e., discussing a simple model using data on the city of Jakarta at the beginning of the pandemic using the Richard curve [21, 22], the SIR model [23], the super-spreading problem with Batam–Depok data [24], PSBB in Jakarta [25], scenarios of vaccine implementation in Indonesia [26], and how the model is applied to policymakers [27]. The term SIQRD stands for susceptible, infected, quarantined, recovered, and deceased, classifying people into five groups. The detailed information for each compartment is given in Table 1.
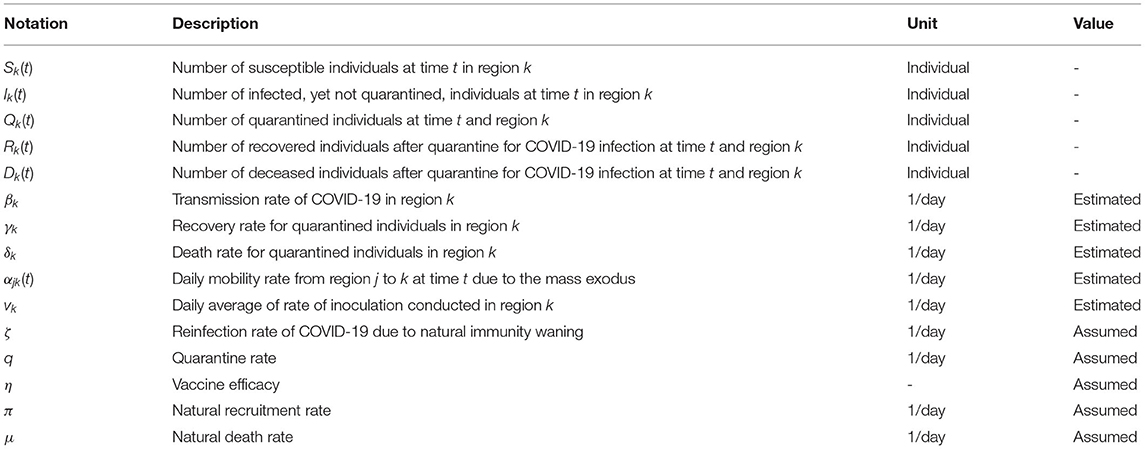
TABLE 1. Descriptions of variables and parameters in the {SIQRD}k model.
Susceptible individuals might have become infected after having had contact with infected individuals, which resulted in a portion of them being moved to compartment I. The addition of compartment E that represents exposed, or carrier, individuals is common to acquire the latency period of diseases [28, 29]. Another approach is to simply use the delay term to accommodate the incubation delay period [30]. However, this study focuses on the quarantine effect and hence drops the latency effect but adds the quarantine compartment. The quarantine rate governs how many of the infected individuals are to be quarantined (hospitalization or self-isolation) and hence, lessens the chance of infecting others. Also, vaccine inoculation is simply accommodated by allowing people from the S compartment to move directly to the R compartment after developing viral immunity. This modification reduces the number of susceptible individuals, depending on the vaccine rate and efficacy, which conforms to the primary goal of the vaccination program [31]. In addition, considering the temporary immunity developed after being inoculated or infected by the disease [32], the modification also covers the cases in which recovered/vaccinated individuals are reinfected by the virus, allowing people in R to move back to S, which can be seen in Figure 1.
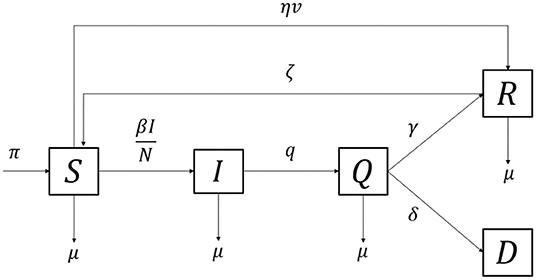
Figure 1. Flow chart of SIQRD model with vaccination and reinfection aspects.
The mathematical system of the SIQRD model is given by:
where , which represents the number of living individuals over time. The population size is assumed to remain constant over time and, hence, by adjusting π = μ. The detailed study of the model is provided in Supplementary Materials.
Multiregional SIQRD Model With Mobility Aspect
The multiregional SIQRD, denoted by {SIQRD}k, is a generalization of the generic model by simply adding subscript k to each compartment, meaning that the observation of every state dynamic in m regions simultaneously is allowed. The concept of model stratification is commonly used in the analysis of disease spread in relation to region-related observation.
To capture the effect of mass human mobility on the spread of the virus, the multiregional model accommodates the transfer of individuals from one region to another during the exodus. Several strict assumptions should hold to reduce the complexity: only susceptible, inapparently infected, and immune individuals can cross borders. Infected individuals who develop symptoms are banned amid border checks. In contrast, inapparently infected individuals are assumed to travel and pass the border checks easily. The assumption of human mobility considered in this model is that holy days can drive millions of people to travel from one region to another. However, daily mobility is neglected due to its insignificant figure relative to that on holy days. This exodus usually extends no longer than a month, and the travelers are expected to return to their original locations. The infection record is registered in the current place, regardless of the patient's domicile.
It is undeniable that the travel process, including the type of accommodation, plays a significant role in increasing the chance of infections. However, adding this aspect to the model would have increased the complexity and, hence, was not considered. Nevertheless, allowing the human transfer from one region to another is still prospective on capturing the effect of the exodus without taking its travel process into account.
Mathematically, the multiregional SIQRD model, which accommodates interregional mobility, is given by system (2). The multiregional model generalizes the generic one but adds index k and human mobility features.
The population size of each region is not conserved due to the mass mobility from one region to another. However, the sum of all populations in all observed regions remains constant by assuming that no other regions are involved. The initial conditions for variables Q, R, and D are known from the data, yet those for I are estimated.
According to Table 1, it is clear that some parameters were assumed to depend on regions, meaning their values represented specific occurrences in each region. The transmission, recovery, and death rates of COVID-19 depended on the provided data and, hence, are written with a subscript. The least-square method was used to estimate these parameters by the input of the provided data. Practically, β, γ, δ, and I0 were chosen so that the rendered model would be close to the actual data. However, other parameters were considered to be more general and, hence, were assumed to be uniform for each region.
However, the mobility rate αjk indicates the proportion of people traveling from one region to another during Eid al-Fitr. This term was not only assumed to be a region-specific parameter but was also assumed to vary each time, meaning mass mobility would occur occasionally and, hence, have its dynamic. To be depicted by system (2), the term αjk affects only the three variables: Sk, Ik, and Rk. The additional term represents the number of susceptible individuals who enter region k from the rest of the regions. However, the term depicts the number of susceptible individuals who leave region k to other regions. Therefore, subtracting the two results in the net change in the susceptible number in the region due to mass exodus. It is noted that the population size in each region may not be conserved, but the sum in all observed regions remains constant each time.
Method of Estimating the Mobility Rate
According to the constructed model, the mobility aspect is accommodated by parameter αjk, representing the daily proportion of people traveling between region j and region k. Notice that this parameter is time-dependent and can be either positive or negative. Practically, when αjk is positive, it represents the condition under which a proportion of people travel from region j to region k. The greater this value is, the greater the number of people traveling during the mudik occasion. On the other hand, a negative value of αjk represents travel back from region k to region j.
In addition to the quantity aspect, the general behavior of αjk is adjusted to align with the real phenomena: increasing toward Eid al-Fitr and peaking right before the holy day, followed by the people's return in a similar pattern but in reverse. The dynamics are expected to have a significant value near the holy day but almost zero at other times. By the given assumption, the Dawson integral function represents the daily proportion of the population in a specific region traveling during the exodus.
Based on [33], the general form of the Dawson integral function is given as follows:
Figure 2A depicts the basic graph of the Dawson integral function equipped with the preferred general behavior: positively increasing and reaching its peak toward the holy day, which represents the mass exodus, and then, followed with the reverse pattern in negative values, the return. Moreover, during the holy day, it is assumed that there is no mobility recorded. However, this function has fixed peaks and amplitude as well as thick tails. In order to align with the expected behavior of the mobility rate, the modified Dawson integral function is proposed by adding four additional parameters: C1, C2, t0, and t1.
where represents a magnitude adjuster and D(t) is the Dawson integral function. With the given modification, several features of the dynamics can be altered:
1. Adjustment of the amplitude: the generic function is multiplied with C1 so that the amplitude will be as high as C1;
2. Adjustment of the peaks' locations, which is accommodated by adding C2. On the generic Dawson function, the locations of the peaks are fixed, and thus adding the parameter C2 will adjust the positions of both peaks of the mobility rate;
3. Adjustment of the date of the holy day is accommodated by adding the parameter t0. According to the modified Dawson function, it is clear that when t = t0, the rate of mobility will be zero. This is relevant due to the assumption that there is no mobility on the day of Eid al-Fitr;
4. Adding the parameter t1 affects the initial time of the mobility. This adjustment is based on the fact that the generic Dawson function has a thick tail as the time reaches −∞ and ∞. Thus, adding the parameter t1 to the model can adjust the time at which the mobility is first identified.
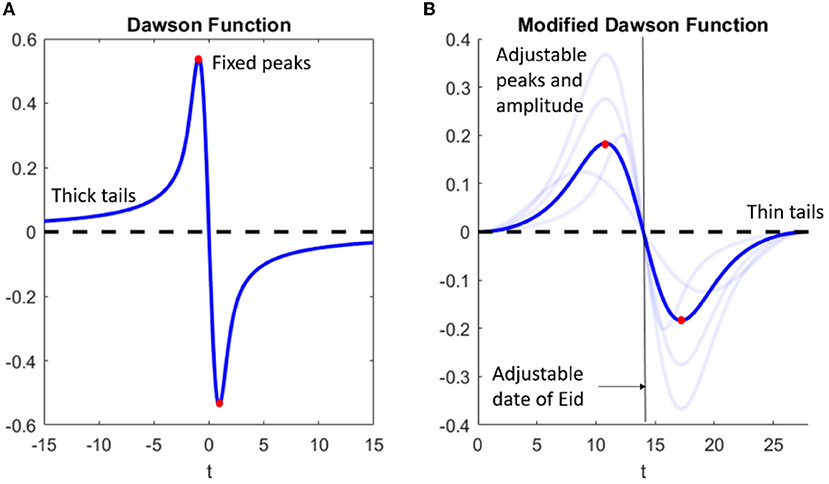
Figure 2. Comparison of the generic Dawson Integral function (A) with its modification (B).
Figure 2 compares the general behavior of the generic Dawson function with the modified one. Note that the modification yields the flexibility of several features. As depicted in Figure 2B, both peaks can be adjusted for location and amplitude, allowing for easier adjustment to follow the region-specific phenomena. Otherwise, both tails are already thin, meaning that mobility is considered to happen only near the holy day.
The complexity is now in estimating all of the additional parameters. Parameter t0 indicates the occurrence of the holy day, which is determined based on the initial data provided. Since the data were available from March 27th, 2020, then t0 is assumed to be t0 = 407, indicating that Eid al-Fitr 2021 will be held 407 days from the first simulation. Otherwise, t1 represents the first day near the holiday when people start to travel. Assuming that people start to travel for Eid al-Fitr 14 days before the holy day, t1 = 14.
On determining the value of C2, Figure 3 gives insights on how the function changes when the value of C2 is altered. By adjusting the rest of the parameters to be fixed, the change in C2 significantly affects the location of both peaks. Increasing the value of C2 does shift the location of the peaks toward the holy day, and vice versa. This fact indicates that the greater the value, the closer the peak of the mobility is to the holy day. According to [34], it is commonplace for most Indonesians to start to travel 2 days before the holy day, resulting in the mobility peak near this time and packing the roads with extended traffic jams. With the given information, the value of C2 is determined by forcing the peaks to occur 2 days prior to and after the holy day.
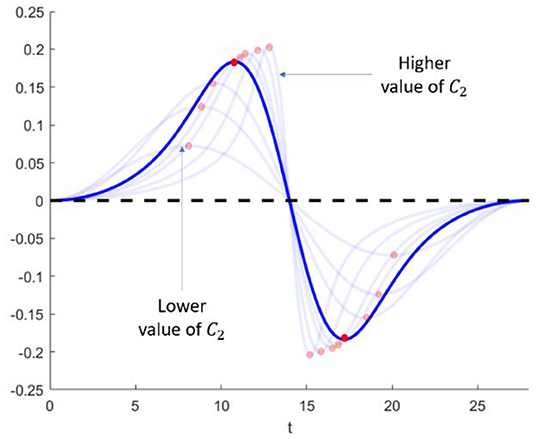
Figure 3. The effect of C2 change on the location of both peaks.
Lastly, parameter C1 is obtained from the provided dataset since it governs how many people participate in the travel. The data used in the estimation comprise the origin–destination (OD) matrix, which was obtained from the phone survey [18]. Note that the elements in the OD matrix represent the proportion of the population traveling due to the holy day. This quantity is a single value and is not associated with the daily mobility. The mobility rate αjk, however, depicts the same thing but is time dependent. Henceforth, integrating αjk of time in the range of [t0−t1, t0] yields exactly the same representation as that of the elements of the OD matrix, i.e., the proportion of a specific region's population traveling from region j to region k. When provided with the information for the other three parameters, C1 can be obtained by forcing the to be close to the mjk data. The detailed information for estimating C1 is given in Algorithm 1.

Algorithm 1 : Estimating C1 given the information from the OD matrix and three additional parameters.
Intuitively, Algorithm 1 decomposes the single-value data into time-dependent dynamics of mobility rate but conserves their total. For instance, the information from m12 is decomposed into α12(t), which has the feature of the modified Dawson integral function but the total still conforms to m12. Figure 4 shows the visual interpretation of decomposing the mjk data into time-dependent αjk(t).
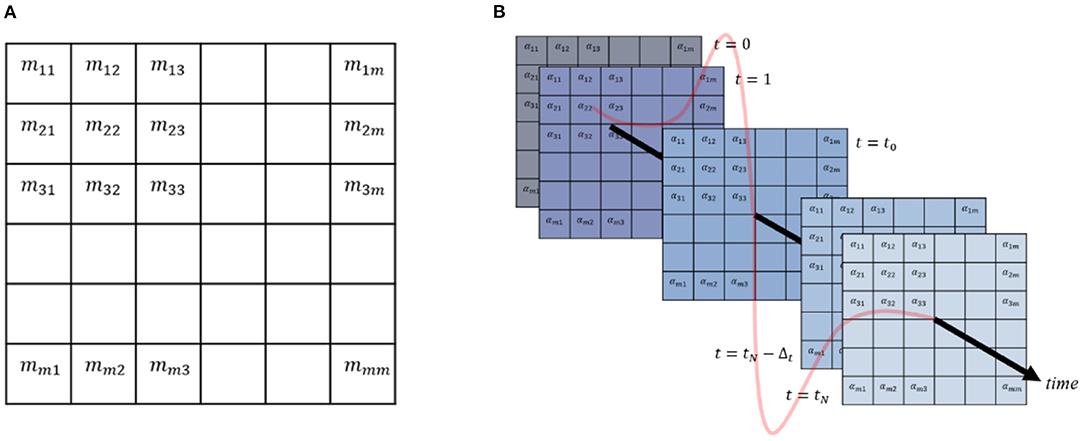
Figure 4. Applying Algorithm 1 to transform the OD matrix data into the time-dependent mobility rates: (A) Origin-Destination matrix; (B) time-dependent mobility rates.
Results
This section provides information related to the estimation of all parameters and the constructed model's simulation on understanding the effect of the mass mobility on the recorded active cases. According to Table 1, there are parameters that are assumed to be constant and independent of regions. Those mentioned parameters are reinfection rate, quarantine rate, vaccine efficacy, and the natural death and birth rates. Those parameters should be first identified by utilizing the existing findings to run the simulations.
According to Goldberg et al. [32], individuals who have recovered after being infected can be reinfected by the virus after 1–2 years, even though no further research has been concluded. The quarantine rate is qualified as the unobservable parameters and, hence, will be assumed to follow the assumption introduced in [35]. The efficacy of vaccines depends on the vaccine brand being delivered. Since Sinovac is being administered to most Indonesians, the vaccine efficacy is assumed to be as high as 57% [36]. The natural death and birth rates are equal and follow the values introduced in [35] to maintain the constant population size.
Parameter Estimation
Given the data on active cases, cumulative recovery, and deaths for all observed regions of Jabodetabek (Jakarta, Bogor, Depok, Tangerang, and Bekasi) and Jabaraya (Jakarta and Bandung Raya), and assuming that the rate of transmission, recovery, and death due to COVID-19 are constant, the single-value estimated parameters are given in Table 2.
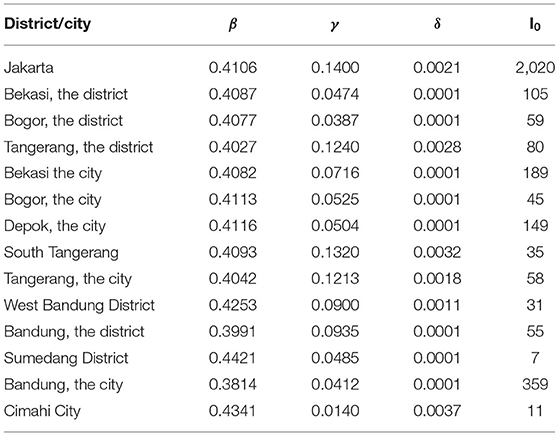
TABLE 2. Estimated rate of transmission, recovery, and deaths due to COVID-19 in Jabodetabek and Jabaraya (district/city scale).
Estimated Mobility Rate
According to the phone survey conducted nationally by [18], the results were dominated by respondents from West Java (33.80%), Jakarta (30.95%), Banten (13.07%), Central Java (8.26%), East Java (6.41%), and Yogyakarta (1.61%), and the rest were from other provinces in Indonesia. The survey provided information on how many people in the sample intended to travel during Eid al-Fitr. Assuming that the sample represented the population, the estimation of the OD matrix could be obtained, as shown in Tables 3, 4.
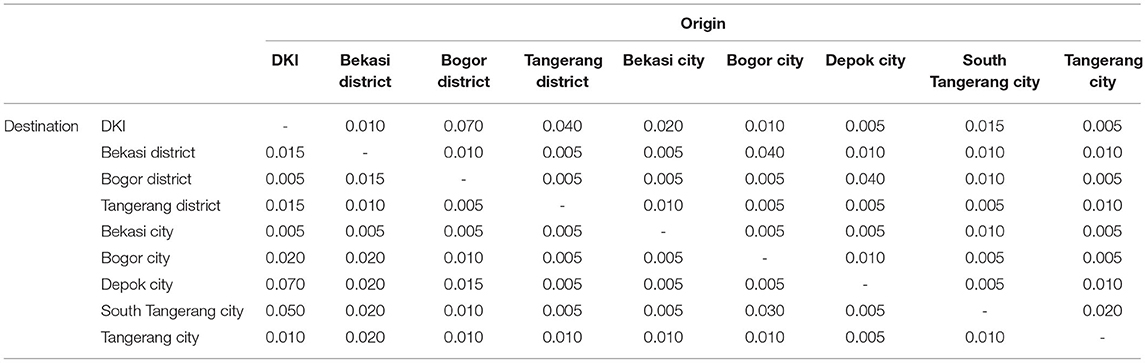
TABLE 3. Estimated OD matrix in Jabodetabek (district/city scale).
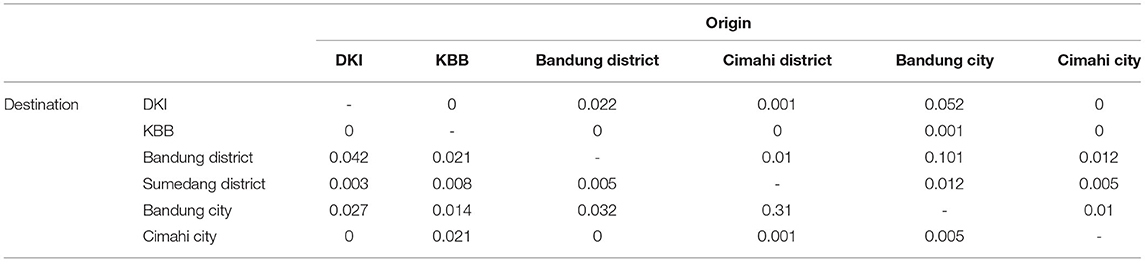
TABLE 4. Estimated OD matrix in Jabaraya (district/city scale).
The values originating from Jakarta to West Java were the highest, which means that most of the mobility depicted from the survey was from Jakarta to West Java. However, some elements were estimated as zeros. This is a direct implication of the values coming from the phone survey, which was limited to the recorded sample.
By implementing Algorithm 1, the time-dependent mobility rate having modified-Dawson-like behavior can be obtained. For visualization, this parameter is shown in Figure 5, representing the mobility rate from Jakarta to Depok City. As expected, the effect of mobility started 14 days before the holy day and vanished 14 days later. In the time interval between the 14 days prior to the holy day and the holy day itself, the mobility rate was positive, depicting the travel from Jakarta to Depok City. However, after the holy day, the rate of transmission was negative, representing the return of those who traveled.
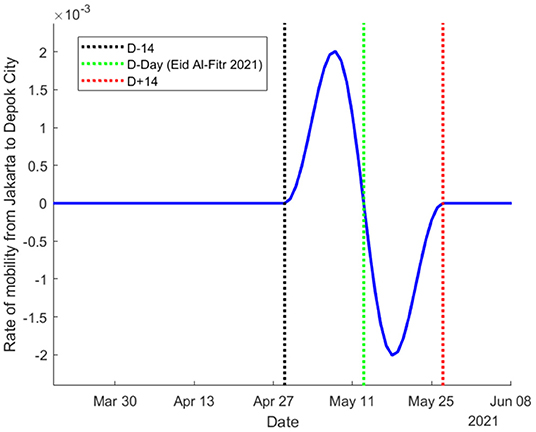
Figure 5. The estimated dynamics of mobility rate from Jakarta to Depok City, ranging from mid of March until late June 2021.
Project Active Cases With Mobility Aspect
In the previous section, the constant parameters representing the rate of transmission, recovery, and deaths were obtained from the existing data. The obtained parameters were utilized to evaluate the short-term and long-term projected numbers of active cases of COVID-19. The short-term projection was demonstrated in two scenarios: no exodus or with exodus. Henceforth, the direct effect of mass mobility on the dynamic of active cases can be analyzed.
In Jabodetabek, Figure 6 demonstrates the projected number of active cases in nine cities/districts. That being said, the estimated β, γ, and δ are assumed to be constant, and hence, the model is not able to capture the fluctuating historical data. However, the analysis mainly focused on the projections that occurred 14 days before and after the Eid.
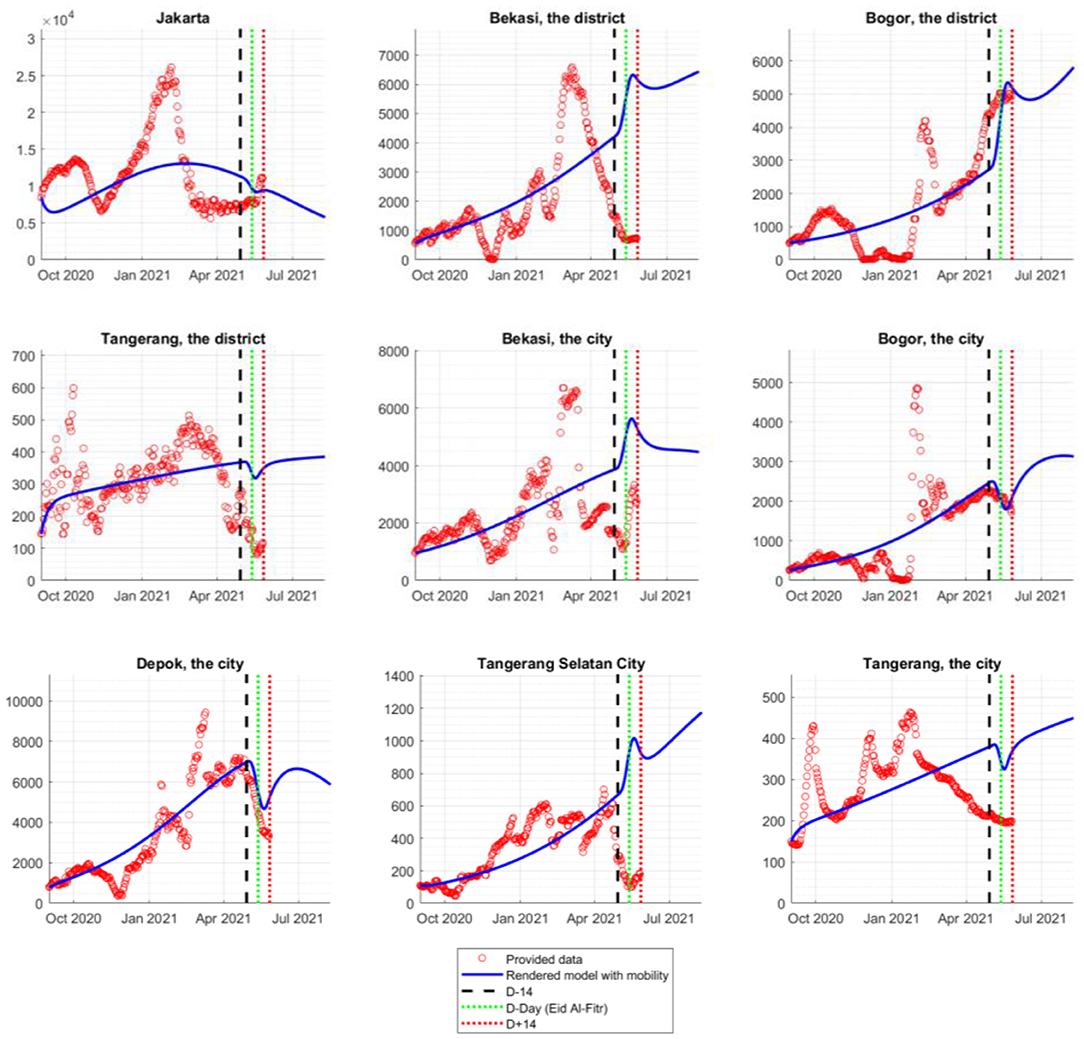
Figure 6. Comparison of the actual data and the rendered model in Jabodetabek during the mass exodus of 2021.
In the observed interval, the consideration of the mass mobility directly affected the dynamics of the active cases, which can be seen in the interval bracketed by the black and red dashed lines. The four regions, namely Bekasi District, Bogor District, Bekasi City, and Tangerang Selatan City, experienced a significant surge of COVID-19 cases during the mass exodus, while the rest experienced a decline. Specifically, in Depok City, Bogor District, and Bogor City, the rendered model represented the actual data during the mass exodus. In other regions, even though the model seemed to overestimate the actual data, the general trend of the actual data could be depicted in the model, except for Bekasi District, Tangerang District, and Tangerang City.
Figure 7 depicts the simulations given for the regions of Jabaraya. Overall, the rendered model could predict how the active cases would spike or decline once the OD matrix data were provided. The results for Sumedang District and Cimahi City do underestimate the actual data, but the general behavior is well-captured by the data.
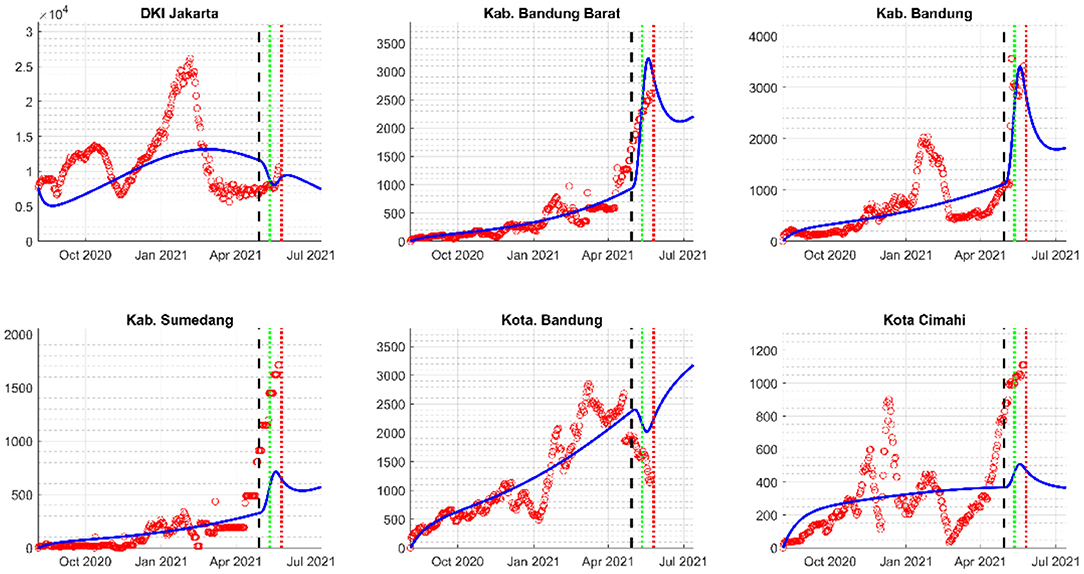
Figure 7. Comparison of the actual data and the rendered model in Jabaraya during the mass exodus of 2021.
Additionally, most of the big or agglomerated cities in the observed regions experienced a decline in the number of active cases, e.g., Jakarta, Bogor City, Tangerang City, and Bandung City. This result confirms that most travelers journeyed from the big city to the more rural areas. On the other hand, other regions experienced a spike representing the significant influx of susceptible individuals to those regions. Regions with higher spikes tended to be the rural areas, which provide recreation, e.g., Bandung District and Cimahi City, meaning that people not only visited families and relatives during the holiday but also visited some recreational places [37]. This is a reasonable reason for government to bring a travel ban aimed at stemming the Mudik [38].
Conclusion
This study produced a method of estimating the movement of people by representing mobility in the form of a function. The calculation provided a reasonably good result compared with the actual data. We used a deterministic model; therefore, in general, the simulation result was the average of the possible occurrences of the given data. The results of this study are considered in formulating policies related to mobility restrictions, especially in urban areas that still have the potential to produce a higher number of cases if the spread cannot be controlled. While currently the number of COVID-19 cases in Indonesia is relatively low, the potential for the spread of this disease is still very high, especially with the discovery of new variants. A relaxation that has been massive enough to control the spread and public awareness to enforce health protocols have also begun to decrease. Therefore, one of the efforts that has contributed to helping prevent the spread of COVID-19 is the policy of regulating community mobility, especially in the Java Island area and around the capital city in particular.
Data Availability Statement
Publicly available datasets were analyzed in this study. This data can be found here: https://docs.google.com/spreadsheets/d/1Lhv1tsion5IUHzyOXs93QrqiIuYYkHKimFOgVRfpChI/edit#gid=682277249.
Author Contributions
NN and KKS: conceptualization and methodology. KKS and WA: software and writing—original draft preparation. NN, DH, and WA: validation, investigation, and supervision. KKS: formal analysis and visualization. NN, DH, and KKS: resources. NN and DH: data curation. NN, KKS, DH, and WA: writing—review and editing. NN: project administration and funding acquisition. All authors contributed to the article and approved the submitted version.
Funding
This research was partly funded by Ministry of Transportation R&D 2021 and PMDSU with research grant: 120Q/IT1.C02/TA.00/2021.
Conflict of Interest
The authors declare that the research was conducted in the absence of any commercial or financial relationships that could be construed as a potential conflict of interest.
Publisher's Note
All claims expressed in this article are solely those of the authors and do not necessarily represent those of their affiliated organizations, or those of the publisher, the editors and the reviewers. Any product that may be evaluated in this article, or claim that may be made by its manufacturer, is not guaranteed or endorsed by the publisher.
Acknowledgments
The authors thank Nunuj Nurdjanah, S.Si., M.T., from Litbang Jalan dan Perkeretaapian Indonesia.
Supplementary Material
The Supplementary Material for this article can be found online at: https://www.frontiersin.org/articles/10.3389/fams.2022.912150/full#supplementary-material
References
1. Oraby T, Tyshenko M, Maldonado J, Vatcheva K, Elsaadany S, Alali W, et al. Modeling the effect of lockdown timing as a COVID-19 control measure in countries with differing social contacts. Sci Rep. (2021) 3354:886. doi: 10.1101/2020.11.14.20231886
2. Han E Lessons Lessons learnt from easing COVID-19 restrictions: an analysis of countries and regions in Asia Pacific and Europe. Lancet. (2020) 396:1525–34. doi: 10.1016/S0140-6736(20)32007-9
4. Adibrata R, Iskandar N. Anies Extends Jakarta PSBB, June Becomes Transition Period, beritajakarta. BeritaJakarta, Jakarta (2020).
5. Afifa L. Jakarta Records Over 3,000 New COVID-19 Cases for Four Consecutive Days. New York, NY: Tempo Co. (2021).
7. Muhammad HH. Researchers: Travelers in Mudik 2021. Will Significantly Increase (in Bahasa Indonesia). Manila, Philippines: Republika (2021).
8. Mun X, Yeh AG-O, Xhang X. The Interplay of Spatial Spread of COVID-19 and Human Mobility in the Urban System of China During the Chinese New Year. Environment and Planning B: Urban Analytics and City Science, Thousand Oaks, CA: SAGE Journals (2020).
9. Syofyan D. Lebaran and Local Pride in the Annual Mudik Custom. Jakarta, Indonesia: The Jakarta Post (2105).
10. Yinglun S. Millions in Bangladesh on the Move as Eid Exodus Begins Amid Beefed up Security. Beijing, China: XINHUANET (2021).
11. Anggraini AD. Number of Eid Exodus in Indonesia Continues to Increase (in Bahasa Indonesia). Indonesia: Indonesiabaik (2018).
12. Tulus TA. Efektivitas Aplikasi Garut Intan Pada Pemberian Informasi Arus Mudik Dan Arus Balik Di Kawasan Hukum Polres Garut (in Bahasa Indonesia). Indon J Police Stud. (2020) 4. Available online at: https://journal.akademikepolisian.com/index.php/ijps/article/view/511
13. Andaka D. Dampak Pelarangan Mudik Akibat Pandemik COVID-19 terhadap Bisnis Angkutan Udara di Indonesia (in Bahasa Indonesia). J Civil Eng Plann. (2021) 1:116–29.
14. Oka T. The effect of human mobility restrictions on the COVID-19 transmission network in China, PLoS ONE. (2021) 16:e0254403. doi: 10.1371/journal.pone.0254403
15. Veruswati M. Correlation between Local Eid-al-Fitr Homecoming (Mudik) with coronavirus disease-19 during ramadhan season amidst large-scale social distancing in Indonesia. Maced J Med Sci. (2021) 8:570–3. doi: 10.3889/oamjms.2020.5369
16. kawal COVID. Kawal Informasi Seputar COVID-19 secara tepat dan akurat. (in Bahasa Indonesia). Indonesia: KawalCOVID19.id (2021).
17. Firman T. Demographic and spatial patterns of Indonesia's recent urbanisation. Popul Space Place. (2004) 10:42–34. doi: 10.1002/psp.339
18. Kemenhub. Laporan Antara: Penelitian Penyelenggara Angkutan Lebaran tahun 2021. Jakarta, Indonesia: Ministry of Transportation (2021).
19. Basri H, Jatmika B, Arifi Z, Sundari S, Barkah B. Measurement of accessibility index using gravity model based on GIS in Sukabumi District, in 2018. In: International Conference on Computing, Engineering, Design (ICCED) (Bangkok, Thailand) (2018).
20. Kermack W. A Contribution to the Mathematical Theory of Epidemics. London, UK: The Royal Society Publishing (1927).
21. Nuraini NK, Sukandar AM. Modeling simulation of COVID-19 in Indonesia based on early endemic data. Commun Biomath Scie. (2020) 3:1–8. doi: 10.5614/cbms.2020.3.1.1
22. Darti I, Suryanto A, Panigoro HS. Susanto H. Forecasting COVID-19 epidemic in Spain and Italy using A generalized richards model with quantified uncertainty. Commun Biomath Sci. (2020) 3:90–100. doi: 10.5614/cbms.2020.3.2.1
23. Soewono E. On the analysis of covid-19 transmission in Wuhan, diamond princess and Jakarta-cluster. Commun Biomath Sci. (2020) 3:9–18. doi: 10.5614/cbms.2020.3.1.2
24. Hasan A, Susanto H, Kasim M, Nuraini N, Lestari B, Triany D, et al. Superspreading in early transmissions of COVID-19 in Indonesia. Sci Rep. (2020) 10:22386. doi: 10.1101/2020.06.28.20142133
25. Hasan A, Nasution Y, Susanto H, Putri E, Tjahjono V, Puspita D, et al. Modeling COVID-19 transmissions and evaluation of large-scale social restriction in Jakarta, Indonesia. medRxiv. (2020). doi: 10.1101/2020.10.30.20222984
26. Fuady A, Nuraini N, Sukandar KK, Lestari BW. Targeted vaccine allocation could increase the COVID-19 vaccine benefits amidst its lack of availability: a mathematical modeling in Indonesia. Vaccines. (2021) 9:462. doi: 10.3390/vaccines9050462
27. Hasan A, Putri E, Susanto H, Nuraini N. Data-driven modeling and forecasting of COVID-19 outbreak for public policy making. ISA Trans. (2021) 124. doi: 10.1016/j.isatra.2021.01.028
28. Hattaf K, Mohsen AA, Harraq J, Achtaih N. Modeling the dynamics of COVID-19 with carrier effect and environmental contamination. World Sci. (2021) 12:483. doi: 10.1142/S1793962321500483
29. Jaouimaa FZ, Dempsey D, Van Osch S, Kinsella S, Burke K, Wyse J, et al. An age-structured SEIR model for COVID-19 incidence in Dublin, Ireland with framework for evaluating health intervention cost. PLoS ONE. (2021) 16:e0260632. doi: 10.1371/journal.pone.0260632
30. Liu L. A delayed SIR model with general. Adv Diff Eq. (2015) 329:1–11. doi: 10.1186/s13662-015-0619-z
31. Swan DA, Bracis C, Janes H, Moore M, Matrajt L, Reeves DB, et al. COVID-19 vaccines that reduce symptoms but do not block infection need higher coverage and faster rollout to achieve population impact. Sci Rep. (2021) 11:15531. doi: 10.1038/s41598-021-94719-y
32. Goldberg Y, Mandel M, Bar-On Bar-On YM, Bodenheimer O, Freedman L, Haas EJ, et al. Waning immunity after the BNT162b2 Vaccine in Israel. N Engl J Med. (2021) 385:e85. doi: 10.1056/NEJMoa2114228
33. Temme N. Error Fucntions, Dawson's and Fresnel Integrals. Cambridge: Cambridge University Press (2010).
34. Rosana FCR. Kemenhub Prediksi Puncak Arus Balik Lebaran pada Sabtu dan Minggu. New York, NY: TEMPO (2021).
35. Nuraini N, Sukandar KK, Hadisoemarto P, Susanto H, Hasan AI, Sumarti N. Mathematical models for assessing vaccination scenarios in several provinces in Indonesia, J Infect Dis Model. (2021) 6:1236–58. doi: 10.1016/j.idm.2021.09.002
37. Perdana R. Warga Kota Bandung Boleh Mudik ke Kabupaten dan Cimahi, tapi Tidak ke Jatinangor (in Bahasa Indonesia). Bandung, Indonesia: Pikiran Rakyat. (2021).
38. Yuniar RW. Indonesia risks India-style Covid-19 surge as millions skirt Eid ul-Fitr travel ban. Coronav Pandemic. (2021). Available online at: https://www.scmp.com/week-asia/health-environment/article/3132706/indonesia-risks-india-style-covid-19-surge-millions
Keywords: COVID-19, mobility aspect, Eid al-Fitr, SIQRD model, OD matrix, Dawson integral function
Citation: Aini W, Sukandar KK, Nuraini N and Handayani D (2022) The Impact of Mass Exodus on the Resurgence of COVID-19 Cases: Case Study of Regions in Indonesia. Front. Appl. Math. Stat. 8:912150. doi: 10.3389/fams.2022.912150
Received: 04 April 2022; Accepted: 16 May 2022;
Published: 03 June 2022.
Edited by:
Joel M. Addawe, University of the Philippines Baguio, PhilippinesReviewed by:
Khalid Hattaf, Centre Régional des Métiers de l'Education et de la Formation (CRMEF), MoroccoHaitao Song, Shanxi University, China
Copyright © 2022 Aini, Sukandar, Nuraini and Handayani. This is an open-access article distributed under the terms of the Creative Commons Attribution License (CC BY). The use, distribution or reproduction in other forums is permitted, provided the original author(s) and the copyright owner(s) are credited and that the original publication in this journal is cited, in accordance with accepted academic practice. No use, distribution or reproduction is permitted which does not comply with these terms.
*Correspondence: Kamal Khairudin Sukandar, a2FtYWxraGFpcnVkaW5Ac3R1ZGVudHMuaXRiLmFjLmlk