 Rojhun O. Macalinao
 Jcob C. Malaguit
 Destiny S. Lutero
- Institute of Mathematical Sciences and Physics, College of Arts and Sciences, University of the Philippines Los Baños, Los Baños, Philippines
Onsite classes in the Philippines have been prohibited since March 2020 due to the SARS-CoV-2 which causes the COVID-19. This forced millions of learners to adapt with new modes of instruction that may not be optimal for their learning. In this study, we implemented an agent-based model in Netlogo that followed common classroom layouts to assess the effects of human interactions to virus transmission. Results show that the highest value of cumulative proportion of infected individuals inside the classroom (CPI) is achieved when the total allowable seating capacity in the classroom is increased from 25 to 50%. Also, varying transmission rates between 5 and 20% does not pose any significant effect on CPI. Furthermore, in three of the four seating arrangements, allowing in-class mobility and class rotations can pose significant increases in CPI averaging from 40 to 70%. Results also showed that factors including maximum number of students and number of initially infected individuals, significantly affect the likelihood of infection apart from the seating arrangement itself. To minimize the risk of transmission inside the classroom setup considered, it is vital to control these factors by adhering to mitigation efforts such as increased testing and symptoms checking, limiting the maximum number of students, and redefining breaks and class rotations.
Introduction
COVID-19, a respiratory infection caused by the Coronavirus SARS-CoV-2, was classified as a pandemic worldwide by the World Health Organization (WHO) in March 2020. SARS-CoV-2 causes respiratory infections transmitted through droplets and contact with an infected person [1]. According to WHO, droplet transmission from an infected person displaying symptoms is possible within a 1 m radius. The virus can also be transmitted through the immediate environment by means of objects that are in close proximity or used by an infected person [1, 2]. Due to the virus being airborne, it is more likely to be passed onto others while in a closed space as per the United States Center for Disease Control citing that “people release respiratory fluids during exhalation, breathing, speaking, singing, etc. in the form of droplets of different sizes carrying viral loads and therefore transmission.”
Because of the nature of transmission, the number of people at a specific location will directly affect the risk of infection. Schools, being a place where people tend to accumulate and thus a hotspot and ground for disease spread, were forced to shut down amid the growing threats of the pandemic. Ever since the start of localized lockdowns in the second week of March in 2020, the Philippine government has issued temporary closure of academic institutions. It affected close to 24 million Filipino students according to the Department of Education, forcing students to adjust to the demands of the current mode of instructions i.e., modular and distance learning [3]. Difficulty then emerged since a significant portion of Filipino people lack access to reliable internet connection [4]. While the closure of schools is a preventive measure to control spread, it is seen to have detrimental effects on students' learning [5].
The effect of school closure in the transmission of COVID-19 is still a crucial issue. So far, no strong data has been found to correlate the increase in COVID-19 cases and the reopening of schools. In Spain, its second wave of infection started weeks before the reopening of the school year in September of 2020. The study of Catala et al. [6] found out that 87% of all the positive cases among students and school staff did not cause secondary infections. While some figures show that cases were steadily increasing in some regions, some actually maintained and kept the numbers low and flat. Similar findings were also consistent to other countries such as Thailand where schools are reopened when the cases are still relatively low. Vietnam, Japan, and Korea saw a short rise in cases, then fell again [7]. While some other countries such as the United Kingdom and the United States saw a steady upward trend on their epidemic curves, this is mostly ascribed to the lack or lapses on disease mitigation efforts and non-compliance to minimum health standards such as wearing of masks [7].
Lee et al. [8] pointed out that children less than 10 years old are less likely to develop symptoms and transmit it to adults or schoolmates. The reports from Viner et al. [9] indicated that the incidence of infection is more common in high school than in middle school and elementary which recorded some infection but on a relatively lower level. Kaushall and Das [10] recommends the reopening of elementary schools citing that children under the age of 10 are less likely to contract asymptomatic diseases yet they have the hardest time to adjust to online learning.
It is imperative that the schools be gradually opened and as safely as possible to minimize losses for the students. The paper of Raitzer et al. [11] indicated that the risk of future reopening of face-to-face classes can be minimized or controlled by targeting movement restrictions, redefining classroom dynamics, and strategic opening of schools in areas with relatively low infection incidence and community transmission. The mathematical model provided by Zhang et al. [12] suggests that school closures alone does little to no effect on the already existing social and community transmission dynamics.
Performing experiments to understand infectious diseases like COVID-19 is difficult and costly. Mathematical modeling can be used as a tool to observe and describe the spread of a disease in a bid to formulate measures to control, if not eradicate, the disease [13]. Agent-based Modeling (ABM) is a type of modeling that can be used to model complex systems by issuing simple rules to control the behavior of the agents [14]. The purpose of these rules is to properly simulate the movement of an agent or actor within a specific environment. This type of modeling can be particularly useful in simulating the dynamics of diseases, especially those that require transmission characterization based on person-to-person interactions [15] like COVID-19. Another way to study the dynamics is through equation-based modeling like in Hattaf et al. [16, 17]. It makes use of either ordinary differential equations or partial differential equations if space and time is considered in the study. In spatiotemporal researches like this one, agent-based modeling is the simpler approach than using partial differential equations.
There are numerous studies that use ABM in disease transmission. Cuevas et al. [14] performed an experimental study to evaluate the COVID-19 transmission risks inside facilities using agent-based modeling [14]. In this study, the author explored the use of agent-based modeling to analyze the spatiotemporal risk of contracting COVID-19 in closed facilities. The formulated model highlights two important parameters – the infection probability and the factor of mobility inside the facility. In a case scenario of the model simulation, with only an infected individual, the entire susceptible population can be infected after 100 iterations [14]. In another study, Zhang et al. [18] used agent-based modeling to explore the transmission of COVID-19 from a real-world scenario of classroom dispersion. In this study, the authors used a Radio Frequency Identification (RFID) system to monitor the real-time movements of pre-school students and their teachers in three classrooms. Now, these classrooms are situated in a large urban center in the United States. The study highlights the preventive part of a decreased allowable classroom capacity and the vaccination of the teachers. In the case study, a reduction of about 50% in the total allowable individuals in the classroom is associated with about a 13.1% decrease in the number of total COVID-19 positives [18]. Kerr et al. [19] used ABM to simulate the dynamics of infection given different social networks, including that in schools [19]. Moreover, Woodhouse et al. [20] created an ABM that projects infection patterns within primary school classrooms. They used random networks together with structured expert judgment to define the classroom interaction. The effectiveness of mitigation strategies in their model are defined according to the effectiveness at supressing infection outbreaks and limiting pupil absence [20]. Lastly, Larsen [21] also used ABM to simulate the transmission of infection given the availability of vaccines, and the effects of non-pharmaceutical interventions such as mask wearing and routinary testing [21]. All these ABM models do not underscore the importance of differences in classroom layout and whether it has an effect in the infection or not.
Understanding the characteristics of COVID-19 will be vital to minimize its effects on people's health and in turn in a country's economy. It will provide a middle ground in controlling the spread of the disease while giving back the foregone opportunities to the learners. While still in the absence of pharmaceutical interventions [22] for school-aged children, mathematical modeling will be helpful in understanding the dynamics of infection transmission. Virus transmission models will be useful toward that goal. In this paper, an agent-based model was developed to determine the dynamics of COVID-19 transmission given different classroom layouts. The arrangements that were considered are: (1) two-block layout; (2) single seat apart layout; (3) pairwise layout; and (4) double horseshoe layout. In this paper, we also aimed to revisit the current mitigation efforts in the Philippines to assess whether or not these are sufficient measures to control the spread inside a classroom.
Mathematical Model
In this approach, we aim to simulate the interactions within a typical classroom in order to make predictions on the spread of the disease. Netlogo was used to carry out the processes of a usual classroom setting, emphasizing the spread based on student-to-student and student-to-teacher interactions. Netlogo is a multi-agent programmable environment which can be used to directly mimic a natural or social phenomenon [23]. This programming software allows its users to establish connections between the micro-level behavior of agents that results in the macro-level patterns based on their interactions.
Classroom Layout
In this study, we developed a model to assess the effects of common classroom layouts in the spread of COVID-19. We represented a classroom as a network (called a class graph), comprising two types of nodes: (1) seat nodes, wherein students and teachers are placed initially, and (2) aisle nodes, wherein students and teachers alike can move to access another seat node. Every node is connected by undirected links and assumed to occupy a 0.5 meter by 0.5 m (0.5 × 0.5 m) space, hence, a circular space with 1 m radius centered at a seat node will contain at most four other seat nodes horizontally and vertically. The seat nodes were connected by undirected links horizontally to allow movement from a seat to another seat on the same row or to the aisle. The aisle nodes were connected horizontally and vertically allowing movements in between rows.
The four common types of classroom layouts that we considered in the model are: (1) two-block layout; (2) one-seat apart layout; (3) a pairwise layout; and (4) a double horseshoe layout. The standard size of 7 by 9 m of a classroom in the Philippines [24] is adapted in this study.
For the Two-Block Layout (Figure 1A), a dual block arrangement, each block having five columns and five rows of seating capacity, divided by an aisle will be used to represent student seats. Hence, the first arrangement will contain at most 50 seat nodes for students. Each successive row is separated by a 1 by 7 m equivalent of aisle nodes.
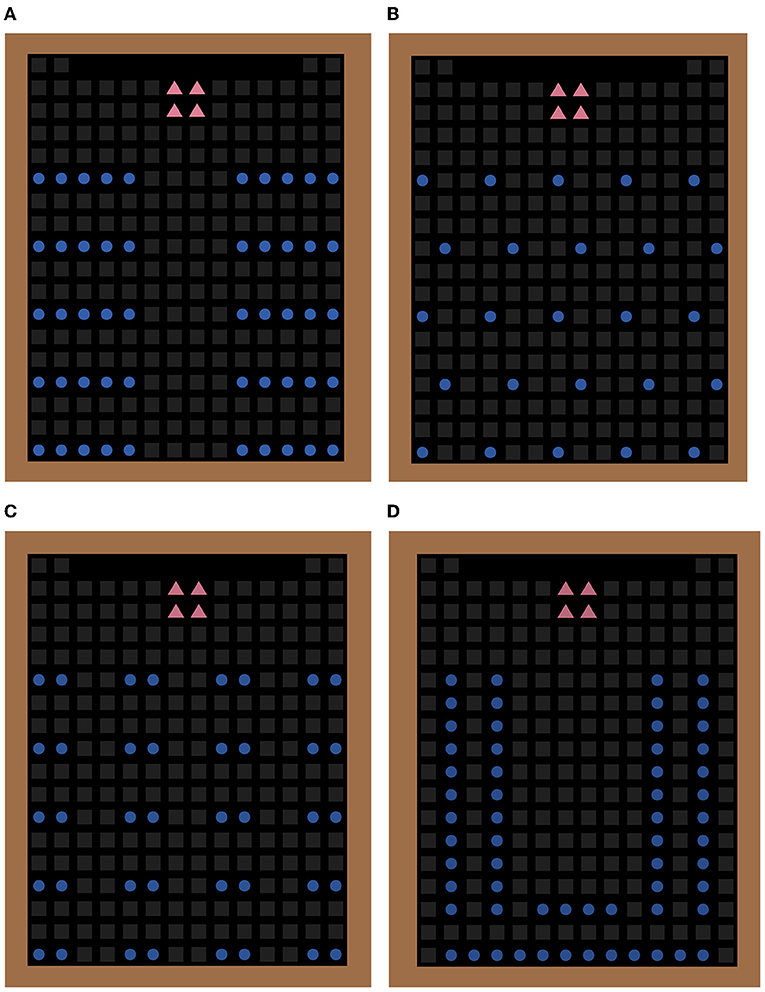
Figure 1. Figure representations of: (A) Two-Block Layout, (B) One-Seat Apart Layout, (C) Pairwise Layout, and (D) Double Horseshoe Layout. Each blue circular node represents a seat node that can be occupied by a student while the gray square nodes indicate aisle nodes. The four pink triangular nodes indicate the area occupied by the teacher.
For the One-Seat Apart Layout (Figure 1B), a 5 × 5 seating capacity is used. Each successive column of seats is divided by a 1 m equivalent of aisle nodes. Hence, a maximum of 25 students can be seated simultaneously on this arrangement. For the purpose of creating a more symmetric layout, we opted that the even-numbered rows be placed 1 m down and 0.5 m to the right of the preceding row.
For the Pairwise Layout (Figure 1C), 20 pairs of student seating capacity, equivalent to a 40 total available student seats were used. Each pair is lined up horizontally. Every successive pair was also separated by a 1 m equivalent of aisle nodes. Hence, a pair is bounded by at most 10 aisle nodes.
For the Double Horseshoe Layout (Figure 1D), two sets of double U seating arrangements were used. The outermost U has 34 seats while the inner U has 26 seats. Hence, the total number of seating capacity for this layout is 60.
The four class graphs represent simple classroom arrangements. Each classroom layout is equivalent to 52 nodes frontal hallway with the addition of two nodes connecting to each of the two doorsteps and a 1 by 1 m space in front designated as the teacher's seat.
Student and Teacher Mobility
The students and teachers will be assigned their own unique seats at the start of the simulation. To avoid unwanted infection, which will be defined as infections happening outside a classroom, it will be assumed that an individual will only be susceptible or infective upon entry to one of the classrooms. Upon assumption of seats, each individual will now either be infected or susceptible to the infection.
In this model, it is assumed that an individual carrying the infection will be infectious and will cause others to be infected. Otherwise, the individual will remain susceptible. Furthermore, it is assumed that infection is not possible upon exposure to objects or locations previously used or passed by an infective person.
To differentiate the effects of each classroom layout, within-class mobility (CM), defined as the movement or interaction of students inside a classroom, will be controlled because allowing such will completely negate the purpose. The allowance of CM, however, will be a good measure to provide comparison between a layout to itself. For this paper, we only considered a True or False scenario of class mobility. For every unit of time t, each student will be instructed to move and interact with other students should CM be allowed.
For the system allowing class rotation (CR), which is a movement from a room to another room with the same seating arrangement, after every specific number of runs, 10 students will be allowed to change classrooms. On a system where migration is allowed, three identical rooms were used. Migration is aimed to mimic change of classroom assignments after every class period specifically for college students.
The Virus Transmission Model
Since transmission by objects and surfaces in the immediate environment will be neglected, the movement and seating arrangement will mainly drive the transmission of infection. It will be assumed that infection is possible upon interactions, though subjected to a specific rate γ, called the transmission rate. Due to the COVID-19 being airborne, an infected person is assumed to be infective within a 1 meter radius, equivalent to two seat node radius. This figure, however, will most likely need to be changed should pertinent studies reveal the COVID-19's true radial capacity. Furthermore, it will be assumed that the classrooms are open spaces with proper ventilation, hence, the viral particles will not linger in the classroom and contamination due to the environment is not permitted.
Parameter Values
Since the maximum number of seating capacities of the four layouts are different, we will vary the number of susceptible individuals n, as a proportion of an arrangement's full capacity. For this paper, we specifically consider the following cases (n = 25, 50, 75, 100%) of the total seating capacity. This is to ensure that the number of susceptible individuals alone will not be the reason why a specific arrangement will produce the greatest proportion of infected individuals (CPI). The initial number of infected individuals i, is computed as ⌊βn⌋ where β is the current positivity rate. On the case where migration is permitted, each room will have a number of initially infected individuals equivalent to ⌊βn⌋. Hence, the system of three rooms will have a total of initially infected individuals equal to 3⌊βn⌋. In this paper, we will also vary the value of i from 1 to 3 to establish an observation on how it will affect the CPI.
To compute the number of initially infected individuals, we adapt the current cumulative positive rate of the Philippines, standing at 10.3%, as per the Department of Health COVID-19 Tracker. Hence, for a maximum number of 50 students per room, the number of initially infected individuals is computed as i = ⌊50(10.3%)⌋ = ⌊5.15⌋ = 5.
Due to the limited data, the estimation of transmission rate, γ will be very difficult. Zhang et al. [12] defined the transmission rate as the ratio of the number of infected individuals in one close contact event over the total number of people present on that event. In their study, it is hypothesized that the rate drops as the scale of events increases in a non-linear fashion. According to their study, the median transmission rate is 0.13. For this study, we will vary the transmission rate to γ = 0.05, 0.10, and 0.20 to assess its effect on CPI. Table 1 summarizes the parameter values.
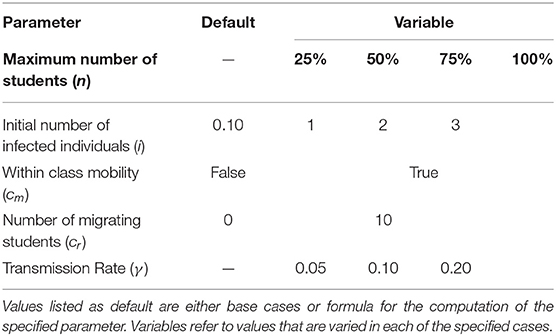
Table 1. The parameter values used in the agent-based model.
Results and Discussion
The data used in this paper are the result of the simulations of the agent-based model using Netlogo. In this section, we discuss how to use the model and the metrics we can get from it with its corresponding interpretations. To provide a comparison between the four seating arrangements, we vary the maximum number of students (n) from 25 to 100% with an increment of 25% to determine how it will affect the value of the cumulative proportion of infected individuals (CPI). Aside from n, we also vary the value of initially infected individuals (i) from 1 to 3. Also, to apply the current case of positivity rate in the Philippines, we also consider the case when i is 10% of the present population. Transmission rates γ also varies from 5 to 20%. Since the first goal is to draw out comparisons among the seating arrangements, within-class mobility and class rotations has both been set to zero. Hence, a total of 48 cases were considered toward the first goal. We perform 30 simulations for each case to draw out the data for the CPI. Due to the prohibition of movement among students, a single run for some of the cases will not terminate in itself despite the lack of new positive infections. We thus see fit to limit the number of run time to a maximum of 160 ticks per case. This unit of time, however, cannot be interpreted as a real unit of time since the rate of transmission used is mainly based from the cumulative positivity rate in the Philippines, and not an estimation of probability of infection upon contact nor from the time of exposure. The result of the simulations for all the cases with the corresponding recorded metrics were listed in the succeeding tables.
Varying the Number of Initially Infected Individuals
Notice from Table 2 how the mean CPI increases as the number of initially infected individuals (i) increases from 1 to 3. The value of CPIs for all seating arrangements are larger at i= 10% than when i = 1. This is mainly because the 10% of the total sitting capacity for the four seating arrangements is always >1. In the case of seating arrangement A, the value of CPI increases by about 51% as i increases from 1 to 2. The percent increase, however, decreases as i increases from 2 to 3. On the case of seating arrangement B, the value of CPI grows by about 76% as i increases to two. Seat of arrangement C records an increase in CPI by about 32% when i varies from 1 to 2 while seating arrangement D has the least increase of 13% among the four arrangements. While the value of CPI is maximum at the Seat of arrangement D, it is seen that a computation for the average rate of change will also show that Seat of arrangement A is the most susceptible to further spread as the number of initially infected individuals increases.
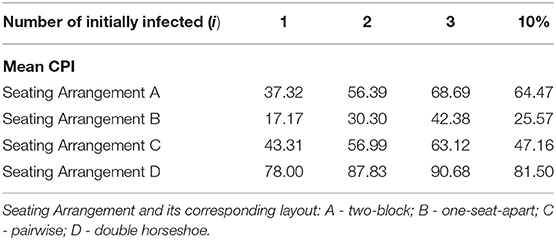
Table 2. CPI for the four seating arrangements with transmission rate γ = 0.05.
Tables 3, 4 show the same observations when γ is at 0.10 and 0.20. It can be further observed that the increase in γ from 0.05 to 0.10 slightly shifts the values of CPI for the four seating arrangements by at most three units. When γ increases from 0.10 to 0.20, the shift in values is at most eight units. The values of CPI for the four arrangements when (γ = 0.05) has a p-value of 0.9932 and hence, considered approximately normal with a mean 55.68, median 56.69 and a standard deviation of 22.36 (Kolmogorov-Smirnov TfN). Similarly, when (γ = 0.10), the p-value is 0.9896 and is approximately normal with a mean of 57.16, median of 56.62 and a standard deviation of 23.14. Meanwhile, when (γ = 0.20), the p-value is about 0.9270, which shows normality, with a mean of 55.21, median of 56.43, and a standard deviation 23.07. A one-way ANOVA testing between the three groups depending on γ shows a p-value of 0.9687 which indicates that there is no significant difference between the three groups. Therefore, it can be inferred that the effect of change of varying transmission rate (γ) from 0.05 to 0.20 is less significant than the effect of initially infected individuals (i) on the CPI.
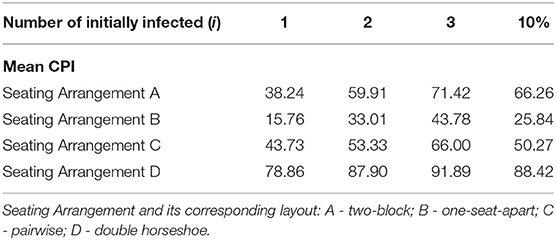
Table 3. CPI for the four seating arrangements with transmission rate γ = 0.10.

Table 4. CPI for the four seating arrangements with transmission rate γ = 0.20.
Since the number of initially infected students is in direct proportion with the case incidence in the communities, increased testing and symptoms checking can largely affect the virus transmission inside school premises.
Varying the Maximum Number of Students
The table below shows the effect of varying the number of students (n) on the cumulative proportion of infected individuals for each sitting arrangement.
Table 5 shows that an increasing number of susceptible individuals for the Two Block Layout, Pairwise Layout, and the Double Horseshoe Layout will most likely result into a substantial increase in CPI. Furthermore, it is worth noting that the highest percent of increase in CPI among the seating arrangements A, C, and D happens as (n) increases from a 25 to 50% of the total sitting capacity. Hence, for these types of layouts, doubling the number of students to half of the sitting capacity will be most detrimental to the spread of the disease. Note that for Seat of arrangement B, the higher the value of (i), the lesser the value of CPI. Despite this, however, the number of positive cases on seating arrangement B still increases as (n) increases but at a much smaller rate as compared to the rest. The table also shows that the number of susceptible individuals varies inversely with the runtimes.
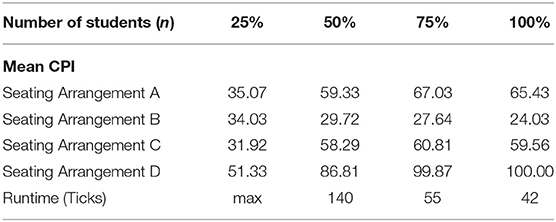
Table 5. CPI with varying number of students for the four seating arrangements, given a transmission rate of 0.05 and initially infected individuals at 0.1.
Notice how the number of ticks decreases as (n) becomes larger. When (n) is at 0.25, the number of ticks attain the designated maximum value, indicating that the spread here is slow. Increasing (n) to 0.50 will result in a faster spread since ticks stand at 140. Beyond this value of (n), notice how the number of ticks significantly decreased to 55. At this rate, the value of CPI for the seating arrangement D almost reaches its maximum. Since the runtimes is interpreted as a measure of time at which a layout achieves the maximum CPI, the results show that increasing the value of (n) beyond 50% will most likely result in a dangerously faster spread. Similar phenomena can be observed upon varying the value of the transmission rate (γ) up to 0.20.
Allowing Class Mobility and Class Rotations
Tables 6, 7 show a summary of the effects of allowing within-class mobility and class rotations on the value of CPI. Since it has been shown previously that varying the transmission rate on the interval [0.05, 0.20] does not pose any significant effect on CPI, we only considered a default case where γ is at 0.10 along with the number of initially infected individuals at 0.10.
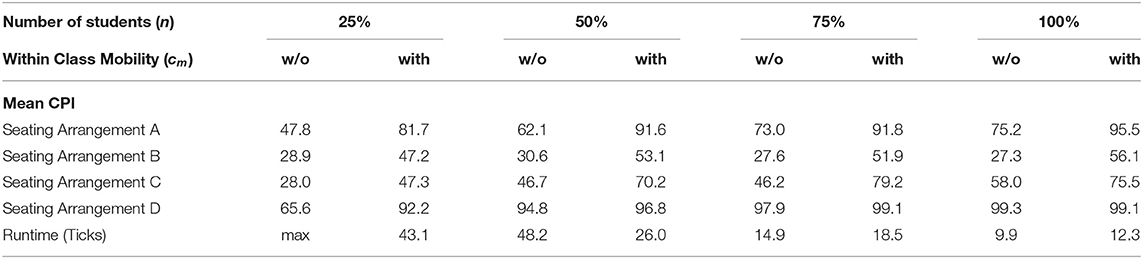
Table 6. List of CPI and the number of runtimes for the four seating arrangements A, B, C, and D with the transmission rate of 0.10, the number of initially infected individuals at 0.10, varying number of students and within-class mobility.

Table 7. List of CPI and the number of runtimes for the four seating arrangements A, B, C, and D with the transmission rate of 0.10, the number of initially infected individuals at 0.10, varying number of students and allowing class rotations.
Table 6 shows that allowing a within-class mobility has a direct relation with the increase in CPI. When the classrooms are 25% full, within-class mobility significantly increases the CPI for all the seating arrangements with a 71% increase for Seat of arrangement A, 63% increase in Seat of arrangement B, 69% increase for Seat of arrangement C, and 41% increase for Seat of arrangement D. Notice also that the runtime decreased significantly to 43 from the designated maximum value when within-class mobility is permitted. Similar observations can be made for arrangements A, B, and C, as the number of students (n) increases. However, for D, note that when (n) grows beyond 0.25, the percent increase in CPI is no longer significant regardless of class mobility. This is mainly because at 0.25, Seat D already records a 94.8 CPI despite the lack of class mobility. Overall, within-class mobility is a significant factor on the spread of COVID-19. Its effect on the CPI for all the seating arrangements considered is predominantly significant. Hence, in the current situation of case incidence in the Philippines, regardless of Seating arrangements used, when class mobility is pervasive, the likelihood of infection is also high. Since the number of breaks (may it be a bathroom break, food break, etc.) are factors affecting within-class mobility, and thus interaction among students, is shown to be in direct proportion to the increase of CPI, it is imperative that these factors be carefully considered and minimized.
Another potentially significant factor to the increase of CPI is class rotations. Class rotation is defined as the movement of a student originating from one classroom to another classroom, of the same type. Its effect on mean CPI and runtime is summarized on the following table below.
Table 7 shows that the allowance of like within-class mobility, class rotations can significantly affect the CPI regardless of the seating arrangement. Notice that when the number of susceptible individuals is half full of the entire seating capacity, Seat of arrangement A records an increase of 42.13% on its CPI while Seats of arrangement B and C have 76.97 and 49.29% increase, respectively. While the increase of 5.43% in Seat of arrangement D may have been perceived insignificant, (one-tailed ANOVA with p-value 0.053), this may be heavily attributed to the fact that on the Double Horseshoe arrangement, given the default transmission rate of 0.10, number of initially infected individuals at 0.10, and number of susceptible at 50%, the CPI is already nearing its maximum at 94.8. The percent increase on CPI for the four seating arrangements, however, diminishes as the value of (n) increases. Like within-class mobility, allowing class rotation also substantially lowers the value of the runtime when (n) is at 50%. The decrease in runtime can be interpreted as a faster spread. Notice however, that when (n) increases beyond 50%, the number of ticks slightly increases when class rotation is permitted. Due to its direct effect on CPI, the likelihood of further infection can thus be prevented by controlling class rotations.
Limitations
The model used in this study comes with several limitations. To determine the true occurrence of spread in a school setting, it is not sufficient to just look at the dynamics of the infection inside the walls of a classroom. Student to student interactions can also happen inside libraries, cafeterias, and other common school grounds. Also, the assumption that only the radial distance from an infected individual causes the spread does not fully uncover the true dynamics of the disease. We also did not incorporate in the model the possibility that the infection is non-linearly related with the exposure time [25] details that infectious dosage may be represented by a logistic function. In our simulations, we only considered exposure once the students have settled to their respective seats, and disregarded their arrival rate and the likelihood that students may take random paths from the entrance to their seats. Transmission rate can also be modified to be the probability of infection upon exposure or contact with other individuals. Lastly, the results presented here are products of simulations from synthetically created data, hence, may vary from other simulations or observations from actual data.
Conclusion
We presented a virus transmission model for the SARS-CoV-2 which causes the COVID-19 in a classroom setting through agent-based modeling of student-to-student interactions. We applied the model to four different synthetically created seating arrangements i.e., Double-Block, One-Seat-Apart, Pairwise, and Double Horseshoe layout, which are common to Philippine classrooms. Through simulations, we were able to show that several factors, including maximum number of students, varying number of initially infected individuals, allowance of within-class mobility and class rotations, significantly affect the likelihood of infection apart from the different seating arrangement itself. Therefore, to minimize the occurrence of substantial spread on school opening, it is imperative that these factors be carefully reconsidered and proper mitigation factors such as limiting the number of students, increased testing and symptoms checking while redefining class breaks and rotations, be put in place. Moreover, it is also worth suggesting the continued vaccination of students and use of non-pharmaceutical measures such as wearing of face masks, frequent hand washing, and physical distancing to further mitigate the spread of the disease as seen in the variation of transmission rates.
Data Availability Statement
The raw data supporting the conclusions of this article will be made available by the authors, without undue reservation.
Author Contributions
RM and JM conceptualized the presented topic and developed the theory for the simulations. RM performed the simulations and statistical tests for the study. RM also finished the manuscript while DL edited and supplied further comments for the work. All authors contributed in the results and discussion of the final manuscript.
Conflict of Interest
The authors declare that the research was conducted in the absence of any commercial or financial relationships that could be construed as a potential conflict of interest.
Publisher's Note
All claims expressed in this article are solely those of the authors and do not necessarily represent those of their affiliated organizations, or those of the publisher, the editors and the reviewers. Any product that may be evaluated in this article, or claim that may be made by its manufacturer, is not guaranteed or endorsed by the publisher.
References
1. Hu B, Guo H, Zhou P, Shi ZL. Characteristics of SARS-CoV-2 and COVID-19. Nat Rev Microbiol.(2021) 19:141–54. doi: 10.1038/s41579-020-00459-7
2. Ong SWX, Tan YK, Chia PY, Lee TH, Ng OT, Wong MSY, et al. Air, surface environmental, and personal protective equipment contamination by Severe Acute Respiratory Syndrome Coronavirus 2 (SARS-CoV-2) from a symptomatic patient. JAMA. (2020) 323:1610–2. doi: 10.1001/jama.2020.3227
3. Magsombol B. Why ph Schools Remain Closed a Year Into the Pandemic. Rappler. (2021). Available online at: https://www.rappler.com/newsbreak/in-depth/why-philippine-schools-remain-closed-year-into-pandemic-2021 (accessed June 12, 2021).
4. Handog M. The Pandemic is Reshaping Education, Here's How the Philippines is Coping. Rappler. (2021). Available online at: https://www.rappler.com/brandrap/tech-and-innovation/coronavirus-reshaping-distance-learning-education-philippines (accessed June 12, 2021).
5. Sheikh A, Sheikh A, Sheikh Z, Dhami S. Reopening schools after the COVID-19 lockdown. J Glob Health. (2020) 10:010376. doi: 10.7189/jogh.10.010376
6. Catala M, Cardona PJ, Prats C, Alonso S, Álvarez-Lacalle E, Marchena M, et al. “Analysis and Prediction of COVID-19 or EU-EFTA-UK and Other Countries”. Universitat Politecnica De Catalunya. (2020). Available online at: https://upcommons.upc.edu/handle/2117/110978 (accessed May 25, 2020).
7. Kamenetz A. Are the Risks of Reopening Schools Exagerated?. National Public Radio. (2020). Available online at: https://www.npr.org/2020/10/21/925794511/were-the-risks-of-reopening-schools-exaggerated (accessed June 12, 2021).
8. Lee B, Hanley JP, Nowak S, Bates JHT, Hébert-Dufresne L. Modeling the impact of school reopening on SARS-CoV-2 transmission using contact structure data. BMC Public Health. (2020) 20:e1713. doi: 10.1186/s12889-020-09799-8
9. Viner R, Russell S, Croker H, Packer J, Stansfield C, Mytton O, et al. School closure and management practices during coronavirus outbreaks. Lancet. (2020) 4:397–404. doi: 10.1016/S2352-4642(20)30095-X
10. Kaushall R, Das LT. Reopening US schools in the era of COVID-19: practical guidance from other nations. Weill Cornell Medicine Population Health Sciences. JAMA Health Forum. (2020) 1:e200789. doi: 10.10001/jamahealthforum.2020.0789
11. Raitzer D, Lavado RF, Rabajante J, Javier X, Garces G, Amoranto G, et al. Cost-Benefit Analysis of Face-to-Face Closure of Schools to Control COVID-19 in the Philippines. ADB Briefs No. 162. (2020). doi: 10.22617/BRF200405-2
12. Zhang L, Zhu J, Wang X, Yang J, Liu XF, Xu XK. Characterizing COVID-19 transmission: incubation period, reproduction rate, and multiple-generation spreading. Front Phys. (2021) 8:e588. doi: 10.3389/fphy.2020.589963
14. Cuevas E. An agent-based model to evaluate the COVID-19 transmission risks in facilities. Comput Biol Med. (2020) 121:10382. doi: 10.1016/j.compbiomed.2020.103827
15. Germann TC, Kadau K, Longini IM Jr, Macken CA. Mitigation strategies for pandemic influenza in the United States. Proc Natl Acad Sci USA. (2006) 103:5935-40. doi: 10.1073/pnas.0601266103
16. Hattaf K, Yousfi N. Dynamics of SARS-CoV-2 infection model with two modes of transmission and immune response. Math Biosci Eng. (2020) 17:5326–40. doi: 10.3934/mbe.2020288
17. Hattaf K, Mohsen AA, Harraq J, Achtaich N. Modeling the dynamics of COVID-19 with carrier effect and environmental contamination. Int J Model Simul Sci Comput. (2021) 12: 150048. doi: 10.1142/S1793962321500483
18. Zhang Y, Tao Y, Shyu ML, Perry LK, Warde PR, Messinger DS, et al. Simulating COVID19 transmission from observed movement: an agent-based model of classroom dispersion. arXiv preprint arXiv:2108.07808. (2021). doi: 10.48550/arXiv.2108.07808
19. Kerr CC, Stuart RM, Mistry D, Abeysuriya RG, Rosenfeld K, Hart GR, et al. Covasim: An agent-based model of COVID-19 dynamics and interventions. PLoS Comput Biol. (2021) 17:e1009149. doi: 10.1371/journal.pcbi.1009149
20. Woodhouse MJ, Aspinall WP, Sparks RSJ, Pollock EB, Relton C. Alternative covid-19 mitigation measures in school classrooms: analysis using an agent-based model of SARS-CoV-2 transmission. medRxiv. (2022). doi: 10.1101/2021.08.30.21262826v4
21. Larsen A. Modeling SARS-CoV2 Spread in a Classroom Setting. Campus Ready. Available online at: https://campusready.ucdavis.edu/predictive-modeling (accessed September 9, 2021).
22. Herdimmunity.ph. Herd Immunity. Available online at: https://herdimmunity.ph/ (accessed June 12, 2021).
23. Tisue S, Wilensky U. NetLogo: A simple environment for modeling complexity. In: Proceedings of the International Conference on Complex Systems. Chicago, IL. (2004). p. 16-21.
24. Department of Education. Submission or Priority Lists of Recipient Schools to be Funded Under CY 2008 DepEd School Building Program. DepEd Order No. 10 s. 2008. (2018). Available online at: https://www.deped.gov.ph/wp-content/uploads/2018/10/DO_s2008_010.pdf (accessed June 12, 2021).
Keywords: agent-based (multi-agent) modeling, classroom modeling, COVID-19 transmission, Philippines, disease modeling
Citation: Macalinao RO, Malaguit JC and Lutero DS (2022) Agent-Based Modeling of COVID-19 Transmission in Philippine Classrooms. Front. Appl. Math. Stat. 8:886082. doi: 10.3389/fams.2022.886082
Received: 28 February 2022; Accepted: 19 May 2022;
Published: 27 June 2022.
Edited by:
Fahad Al Basir, Asansol Girls' College, IndiaReviewed by:
Khalid Hattaf, Centre Régional des Métiers de l'Education et de la Formation, MoroccoM. Osman Gani, Jahangirnagar University, Bangladesh
Copyright © 2022 Macalinao, Malaguit and Lutero. This is an open-access article distributed under the terms of the Creative Commons Attribution License (CC BY). The use, distribution or reproduction in other forums is permitted, provided the original author(s) and the copyright owner(s) are credited and that the original publication in this journal is cited, in accordance with accepted academic practice. No use, distribution or reproduction is permitted which does not comply with these terms.
*Correspondence: Jcob C. Malaguit, amNtYWxhZ3VpdEB1cC5lZHUucGg=; orcid.org/0000-0001-6674-5935