 Musyoka Kinyili
 Justin B. Munyakazi
 Abdulaziz Y. A. Mukhtar
- Department of Mathematics and Applied Mathematics, Faculty of Natural Sciences, University of the Western Cape, Bellville, South Africa
The question of whether to drop or to continue wearing face masks especially after being vaccinated among the public is controversial. This is sourced from the efficacy levels of COVID-19 vaccines developed, approved, and in use. We develop a deterministic mathematical model that factors in a combination of the COVID-19 vaccination program and the wearing of face masks as intervention strategies to curb the spread of the COVID-19 epidemic. We use the model specifically to assess the potential impact of wearing face masks, especially by the vaccinated individuals in combating further contraction of COVID-19 infections. Validation of the model is achieved by performing its goodness of fit to the Republic of South Africa's reported COVID-19 positive cases data using the Maximum Likelihood Estimation algorithm implemented in the fitR package. We first consider a scenario where the uptake of the vaccines and wearing of the face masks, especially by the vaccinated individuals is extremely low. Second, we consider a scenario where the uptake of the vaccines and wearing of the face masks by people who are vaccinated is relatively high. Third, we consider a scenario where the uptake of the vaccines and wearing of the face masks by the vaccinated individuals is on an upward trajectory. Findings from scenario one and scenario two, respectively, indicate a highly surging number of infections and a low recorded number of infections. For scenario three, it shows that the increased extent of wearing of the face masks by the vaccinated individuals at increasing levels of vaccine and face mask average protection results in a highly accelerated decrease in COVID-19 infections. However, wearing face masks alone also results in the reduction of the peak number of infections at increasing levels of face mask efficacy though the infections delay clearing.
1. Introduction
COVID-19 is the most recent to be experienced in humans among the known coronaviruses such as Severe Acute Respiratory Syndrome (SARS) and Middle East Respiratory Syndrome (MERS) [1, 2]. However, COVID-19 caused by Severe Acute Respiratory Syndrome-Corona-Virus-2 (SARS-CoV-2) [2–6] has taken the longest time to clear from the human host. It seems to be the most devastating coronavirus with its severity and rapidly spreading trend. Following its first report in December 2019 at Wuhan, Hubei province in China [5, 7–9], it has been among the greatly challenging global health emergencies in recent history [10, 11], especially with many countries world-wide engaged in battling the epidemic. Most countries have experienced at least three waves of the disease triggered by divergent SARS-CoV-2 variants probably resulting from the mutational characteristic of the virus. Each outbreak of the waves has been witnessed to re-surge the plateau number of infections to the extent of even surpassing the peak number of infections for the previous wave. As of January 27, 2022 (06:26 GMT), the world had recorded 363,305,191 COVID-19 positive cases with 5,646,069 deaths. The Republic of South Africa alone had confirmed 3,594,499 COVID-19 positive cases with 67,019 active cases and 94,651 fatalities [12].
Several non-pharmaceutical measure protocols implemented in most countries globally in the prolific effort to contain the spread of the epidemic have been relatively successful [13]. Among these non-pharmaceutical measures is the use of face masks by the general public. Although there was a lot of controversy on the use of face masks during the early outbreak of the disease, it was very well implemented and has played a key role in protection against contraction of the COVID-19 infections. Face masks have been proved to offer wide protection against both coarser droplets and finer aerosol transmission [2]. Now that COVID-19 has been reported to spread from human to human via fine respiratory droplets, it clearly implies that face masks have played a key role in breaking the chain of transmission for the epidemic.
On the side of the pharmaceutical pathway, over 50 companies commenced thorough scientific investigations in early 2020 to develop vaccines against COVID-19 [11, 14]. The fruits of these rigorous efforts were the discovery of vaccines such as Pfizer-BioNTech, Moderna, Oxford-AstraZeneca, and Johnson and Johnson's Janssen (J&J) vaccine [14, 15] among others. Furthermore, some regulatory bodies such as Europe Medicine Agency (EMA), US Food and Drug Administration (FDA), and UK Medicine and Health Products Regulatory Agency (MHRA) approved these vaccines for emergency use [11, 16]. The Pfizer-BioNTech vaccine was first approved for use in the UK on December 2, 2020, while the Oxford-AstraZeneca and Moderna vaccines were, respectively, approved on December 20, 2020, and January 8, 2021 [14]. J&J vaccine was approved for use by the US Food and Drug Administration and first rolled out on February 18, 2021, in the Republic of South Africa [12].
Pfizer-BioNTech, Oxford-AstraZeneca, and Moderna vaccines are prescribed to be administered in two doses whereas J&J vaccine is a single-dose prescribed administration [11]. Establishment on monitoring of mass vaccination campaigns and clinical trials have shown that Pfizer-BioNTech, Oxford-AstraZeneca, and Moderna vaccines can offer high levels of moderate to severe COVID-19 symptomatic protection when the two shots are administered 2–4 weeks apart [17–20]. However, most countries globally have a great challenge in the delivery of vaccines mainly due to the supply inadequacy and restricted capacity of distribution [11, 15]. The COVID-19 vaccines are being procured by most low- and middle-income countries via the COVAX Advance Market Commitment (AMC) Facility which is a world-wide risk-sharing mechanism for the collaborative procurement of the COVID-19 vaccines [11, 21].
Based on the clinical history regarding the pharmacological action of a wide range of existing vaccines against various diseases, these vaccines have full protection capacity while administered against the targeted disease. The administration of these vaccines demands no further protection action by the patient once administered. However, the COVID-19 vaccines are controversial since, among the so far approved vaccines being used, no single vaccine offers 100% protection against the contraction of the disease. It is clearly evidenced that even when one is vaccinated against COVID-19, there is a possibility of being infected following exposure. Furthermore, most vaccines have a prescription of two-dose administration after some prescribed duration apart. This again gives room for chances of contracting the virus while waiting to receive the second dose and even when there is a delay in availing the second dose. In view of these shortcomings, one natural question arises: Which friendly non-pharmaceutical protocol can be adopted after vaccination? This study attempts to address this question using mathematical modeling.
Mathematical modeling has been widely used by scientists in assessing the impacts of both pharmacological and non-pharmacological strategies in an effort to combat the transmission of the SARS-CoV-2 [1, 22–30]. Particularly, in Sun and Wang [23], mathematical modeling is used to investigate the transmission dynamics of the COVID-19 epidemic. Similarly, more studies are also done in Lukman et al. [31], Wong et al. [22], Sameni [32], Bedi et al. [33], Boukanjime et al. [24], Garba et al. [1], Zhao et al. [34], Gilbert et al. [35], Peirlinck et al. [36], Ishtiaq [6], Salgotra et al. [37], and Amaro et al. [38] on the spread dynamics of COVID-19 using different devised mathematical models. In Eikenberry et al. [2], mathematical modeling is adopted to assess the potential impact of the use of face masks by the general public as a control measure strategy against the COVID-19 epidemic spread. Similar modeling studies addressing the effectiveness of the use of face masks to control the spread of COVID-19 are also done in Yang et al. [39], Li et al. [40], Howard et al. [41], Shen et al. [42], and Stutt et al. [43]. In Garba et al. [1], a compartmental model is employed to study the impacts of social distancing among the public as an intervention strategy to curb the transmission of the COVID-19 pandemic. Modeling studies on the impacts of social distancing besides other containment measure protocols against transmission of SARS-CoV-2 is similarly done in Nyabadza et al. [44], Bastos and Cajueiro [5], Kennedy et al. [25], Lyra et al. [29], and Mason et al. [45]. In Olivares and Staffetti [16], the impact of vaccination, testing against COVID-19 and social distancing is studied using mathematical modeling. In Moore et al. [14], Moghadas et al. [15], Foy et al. [21], Sadarangani et al. [26], Iboi et al. [46], and Gumel et al. [47], similar studies on assessing the potential impacts of vaccination strategy and/or in presence of other containment measures are also done. We note that, among the studies mentioned above, none has considered the aspect of wearing face masks especially after vaccination, hence, it is worthy to bridge this gap.
Therefore, this study seeks to develop a deterministic mathematical model that combines vaccination programs against COVID-19 and the use of face masks as intervention strategies in curbing the spread of the epidemic. The model principally aims to assess the potential impact of wearing face masks, especially on vaccinated individuals.
We organize the rest of the article as follows: In Section 2, we formulate the model. Section 3 presents analytical results of the model covering positivity of solution, biological feasible region, and stability analysis of the infection free equilibrium. In Section 4, we present numerical results and discussion including model calibration, sensitivity analysis, and simulations. Finally, Section 5 gives the conclusion.
2. Model Formulation
On the grounds of the challenges and drawbacks associated with the entire COVID-19 vaccination program (refer to Section 1), we modify the standard SEIR deterministic model to incorporate a combination of vaccination and wearing of face masks as intervention strategies to combat the spread of the COVID-19 epidemic. For this reason, we add a compartment for vaccinated individuals wearing face masks and a compartment for individuals wearing face masks but not vaccinated. Assuming human-to-human transmission, we subdivide the total human population N(t) into seven mutually exclusive classes namely the susceptible class (S(t)), the class of individuals who are vaccinated and wearing face masks (Smv(t)), the class of individuals wearing face masks but not vaccinated (Sm(t)), the latent class (E(t)), the infectious class of individuals who are symptomatic (Is(t)), the infectious class of individuals who are asymptomatic (Ia(t)), and the class of individuals who have recovered from the COVID-19 infections (R(t)). Therefore, the total human population over time t for the proposed model is
We stress that the model factors in the use of face masks, especially by the vaccinated individuals since it is evidenced that the so far developed and approved COVID-19 vaccines being used do not offer 100% protection against the disease. Moreover, most of them are even 2-shots vaccines administered after some duration apart thus allowing chances for contracting the disease while waiting for the second dose. Thus, the main aim of this study is to assess the potential impact of the use of face masks by vaccinated individuals in reducing COVID-19 infections.
The model basically indicates that the susceptible individuals (S(t)) can either progress to the class of individuals who are vaccinated and wearing face masks (Smv(t)), or join the class of individuals who are using (wearing) face masks but not vaccinated (Sm(t)), or progress to the class of individuals who are initially neither vaccinated nor wearing face masks (E(t)). The model assumes that individuals who are neither vaccinated nor wearing face masks are highly prone to the infections and, thus, proceed directly to latency. The latent class E(t) though mainly contains individuals who are initially neither vaccinated nor wearing face masks, individuals who get vaccinated and/or wear face masks over time may join the class following exposure to the disease. The susceptible population either gets vaccinated and wear face masks at the rate of ω, or wear face masks only at the rate of (1 − ω)δ, or progress to latency at the rate of (1 − ω)(1 − δ) following effective contact rate of β with either symptomatic or asymptomatic infectious individuals. Based on the aforementioned challenges associated with the whole vaccination program, the vaccinated individuals wearing face masks can progress to the latent class E(t) at the rate of (1 − α), following exposure to the infection by either symptomatic or asymptomatic infectious individuals. Here, we note that the vaccinated individuals wearing faces masks are less prone to the contraction of the infections due to their boosted immunity and masks' protection effected by the vaccine and mask average protection denoted by α on the model. Similarly, the individuals wearing face masks only (Sm(t)) progress to the latent class at the rate of (1 − σ) following their close contact with either symptomatic or asymptomatic infectious individuals. Notably, these individuals are still protected to some extent against infections due to the masks efficacy of σ. We note that wearing face masks and using face masks means the same in this study.
All the exposed individuals collected in the class of latency E(t), can either progress to the symptomatic class of infectious individuals at the rate of ηρ or the asymptomatic class of infectious individuals at the rate of (1 − ρ)η. These are individuals who have completed the incubation period and shed the virus, thus, causing COVID-19 infections. Since the epidemic has been endemic, we consider a recruitment rate of Γ. Despite the fact that individuals from all the seven classes of the model can die naturally at the rate of μ, the symptomatic and the asymptomatic infectious individuals can die due to COVID-19, respectively, at the rates of εs and εa. Thus, the COVID-19 epidemic induced deaths for the model are given by . The symptomatic and the asymptomatic individuals recover from the disease at the rates of ϕ and ψ, respectively. The recovered individuals are collected in class R(t). Figure 1 illustrates the proposed model. The resultant system of nonlinear ordinary differential equations for the model is
where
defines the force of infections for the model with ξ < 1 denoting the modification parameter since the asymptomatic individuals are assumed to be more infectious than the symptomatic individuals. We describe the other parameters of the model in Table 1.
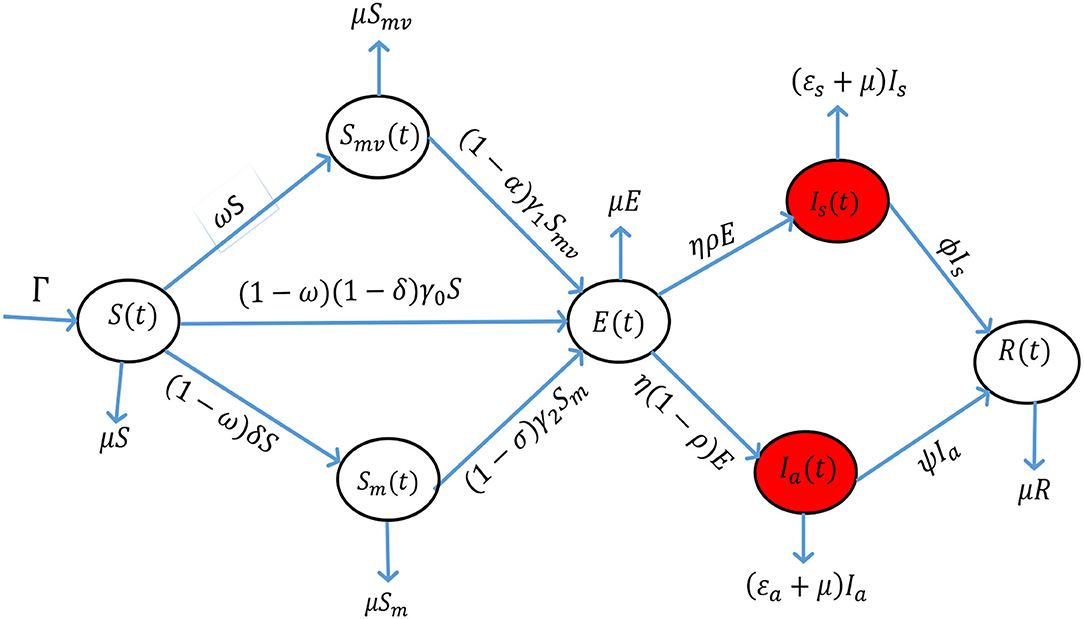
Figure 1. The proposed model incorporating a combination of vaccination against COVID-19 and wearing of face masks.
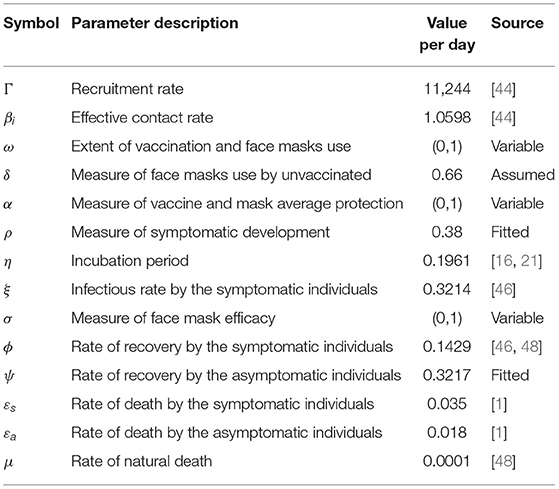
Table 1. Parameter description for the model (Equations 2–8) and their estimated values.
3. Analytical Results
We present some results regarding the epidemiological properties of the proposed model (Equations 2–8).
3.1. Positivity of the Solution
Lemma 3.1:
Let S(0) > 0, Smv(0) > 0, Sm(0) > 0, E(0) > 0, Is(0) > 0, Ia(0) > 0 and R(0) > 0. Then S(t) > 0, Smv(t) > 0, Sm(t) > 0, E(t) > 0, Is(t) > 0, Ia(t) > 0 and R(t) > 0, ∀ t ≥ 0.
Proof
Suppose that the solution of the model (Equations 2–8) is not positive for all t ≥ 0. Then there exist a first time t* > 0 such that
If S(t*) = 0, then ∀ t ∈ (0, t*), S(t) > 0, Smv(t) > 0, Sm(t) > 0, E(t) > 0, Is(t) > 0, Ia(t) > 0 and R(t) > 0, . In contradiction from Equation (2) we have which implies that S(t) > 0 for all t ≥ 0. Arguing similarly, it can be verified that Smv(t) > 0, Sm(t) > 0, E(t) > 0, Is(t) > 0, Ia(t) > 0 and R(t) > 0 for all t ≥ 0.
3.2. Biological Feasible Region
Lemma 3.2:
Let
be a biological feasible region defined for all t ≥ 0. Then, is positively invariant and absorbing with respect to the model (Equations 2–8).
Proof
We compute the time derivative of the total population N(t) in line with Equation (1) along the solution to obtain
Solving Equation (10) by integration and the Gronwall Inequality with N(0) = N0 we get
Employing comparison theorems on ODEs [49], Equation (11) gives
From Equation (12), we see that , ∀t ≥ 0. This shows that N is bounded and, therefore, infers that the biological feasible region is positively invariant and absorbing for all t ≥ 0. Hence, the dynamics of the model (Equations 2–8) can be considered in for all t ≥ 0 [50].
3.3. Infection Free Equilibrium and Stability Analysis
At the instant when no individual is infected in the population of concern, then this situation is referred to as infection-free equilibrium [48, 51]. We find that the proposed model has a unique infection-free equilibrium denoted and defined as
where,
3.3.1. Reproduction Number and Local Stability
We analyze the model's infection-free equilibrium local asymptotic stability by first computing the reproduction number. Since the model incorporates vaccination and the use of face masks as control measure strategies against COVID-19, some proportion of the susceptible population has adopted the measures, and thus, we define the vaccination-mask reproduction number which we denote by . The here is defined as the mean secondary number of infections sourced by one infectious individual when introduced into a susceptible population where a proportion is vaccinated and/or wear face masks. We adopt the next generation operator technique for the computation of the [51]. The Jacobian for secondary infections and transfer of infections for the model (Equation 2–8) are respectively given by
where
and
thus
Hence, the model's reproduction number is
Therefore, the infection-free equilibrium of the proposed model is locally asymptotically stable if
We note that the symptomatic and the asymptomatic individuals account for the new COVID-19 infections, and therefore, we can re-write (Equation 18) as
where
and
3.3.2. Global Stability
We adopt the approach used by Castillo-Chavez et al. [51] to prove the global stability of the model's infection-free equilibrium.
Theorem 3.3.2
Let the model be expressible in the form, , , M(P, 0) = 0, where P denotes the collection of non-disease classes and Q represents the collection of disease classes of the model. The equilibrium point of the model is globally asymptotically stable (g. a. s) if and only if and satisfies the following conditions
C1: , P* is globally asymptotically stable.
C2: , for where and is the region where the model makes biological sense.
Proof
We deduce that and from the model (Equations 2–8). The infection-free equilibrium of the model is as established by Equation (13). The point is g. a. s if , hence
and, therefore, C1 is satisfied. We next check the satisfaction of C2 as
and
Using then,
therefore hence C2 is satisfied. Thus, we conclude that the model's infection-free equilibrium is globally asymptotically stable whenever .
4. Numerical Results and Discussion
4.1. Calibration of the Model
We use the Maximum Likelihood Estimation algorithm implemented in the fitR package for calibrating the model (Equations 2–8). The public data used are the daily COVID-19 positive cases as reported by the government of the Republic of South Africa from June 01, 2020, to September 08, 2020 [12]. The goodness of fit is established in Figure 2.
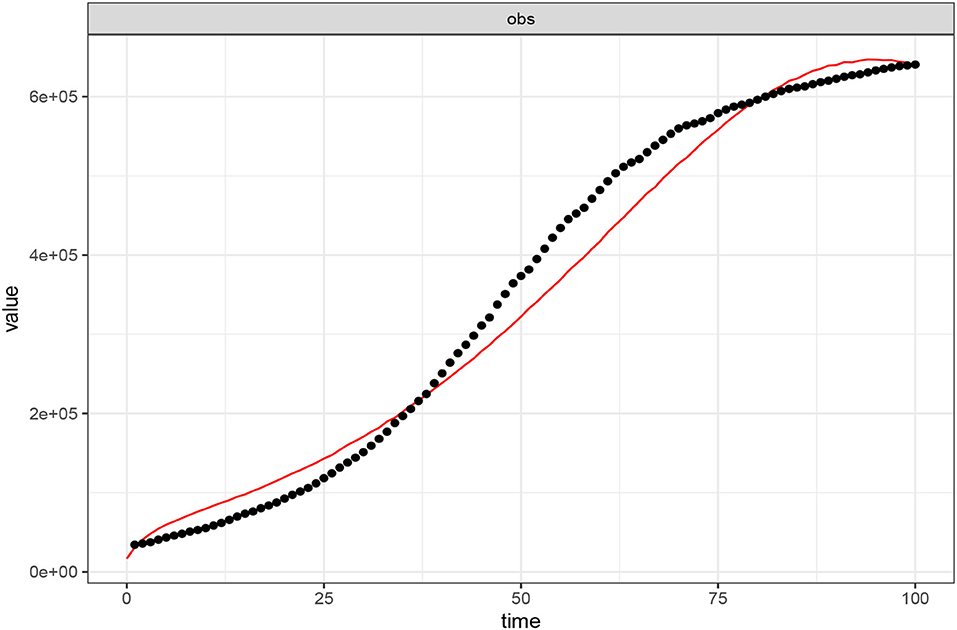
Figure 2. Calibration of the model (Equations 2–8) to COVID-19 positive reported cases (01 June–08 September, 2020) in the Republic of South Africa. The black dotted line shows the reported data while the red-continuous line depicts the model's goodness of fit. Parameter values used are as listed in Table 1 where ω = 0.00001, α = 0.00001, and σ = 0.00001.
4.2. Sensitivity Analysis
We perform the sensitivity analysis for the model graphically using Equation (18) to assess the impacts of the parameters of interest on the vaccination-mask reproduction number . The cardinal parameters of scrutiny for this research are ω for the measure of the extent of vaccination and face mask use, α for the measure of vaccine and face mask average protection, and σ for the measure of face mask efficacy. The vaccine and face mask average protection here refers to the mean value protection against the contraction of the infections brought about by the combination of the vaccine efficacy and face mask efficacy. This aspect only occurs to those people who are vaccinated and still wear face masks. They enjoy double protection in which one is facilitated by the vaccine and the second is facilitated by the face mask. Those people who wear face masks only enjoy the benefit of face masks protection brought about by the face mask efficacy. We define to have a poor extent of vaccination and face mask use, a poor extent of vaccine and face mask average protection, and poor face mask efficacy if each of the parameters approach zero whereas the perfect extent of vaccination and face mask use, the perfect extent of vaccine and face mask average protection, and perfect face mask efficacy are attained when each of the parameters tends to unity, hence, 0 < ω < 1, 0 < α < 1, and 0 < σ < 1. We consider four levels of the extent of vaccine and face mask average protection (α) such that α = 20%, α = 50%, α = 70%, and α = 95%. For the face mask efficacy (σ), we also consider four levels, i.e., σ = 20%, σ = 40%, σ = 60%, and σ = 80%. The impacts assessment is depicted in Figure 3.
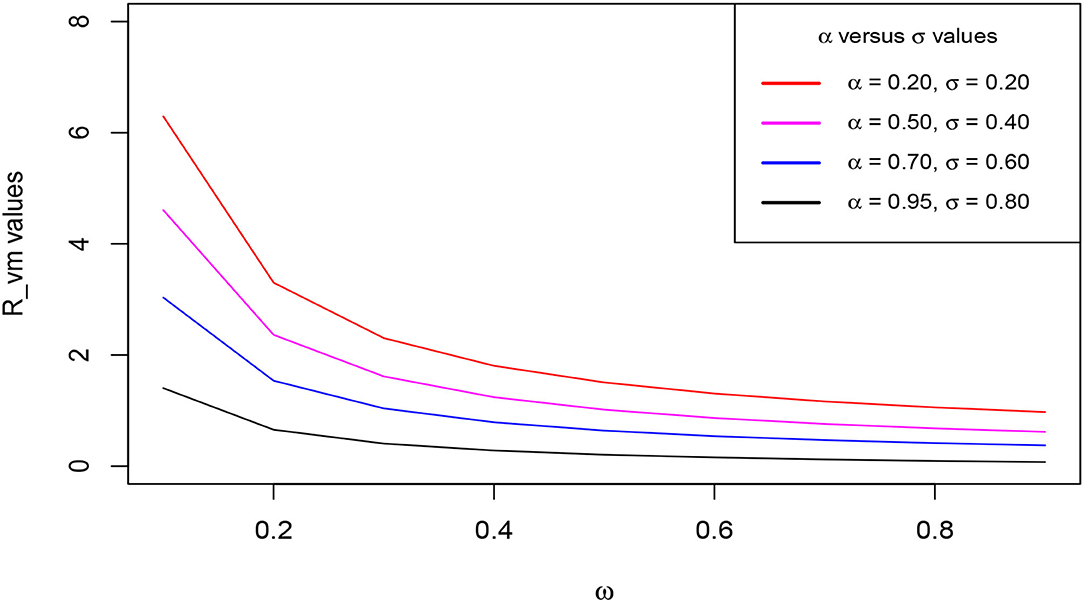
Figure 3. Change of the reproduction number with ω as α and σ increase. Parameter values used are listed in Table 1.
The figure demonstrates the variation of the reproduction number with ω when α and σ are simultaneously endorsed in at increasing levels as aforementioned. We clearly observe that decreases gently with an increase in ω at each level of α and σ. Distinctively, the figure reveals an incredible shift of values tending to less than unity when the α and σ levels are simultaneously increased. We see that increasing levels of α and σ accelerates the reduction in the value of the reproduction number. This distinct observed trend stipulates that increasing the extent of vaccination against COVID-19 simultaneously with the wearing of face masks, highly reduces the value of basic reproduction. This consequentially leads to the speeding up of the stabilization of the infection-free equilibrium, hence, leading to the eradication of the epidemic over a relatively shorter time.
4.3. Simulations
We test for different scenarios with respect to the parameters of interest via numerical simulations using the calibrated model. We concentrate the simulations on the disease classes of the model which include the latent class, the symptomatic, and the asymptomatic infectious classes. The principal purpose of the model (Equations 2–8) was actually to assess the impact of wearing face masks on those individuals who are vaccinated against the COVID-19 epidemic. This is based on the grounds that with the already developed and approved vaccines in use, it is evidenced that no vaccine offers 100% efficacy, and therefore, individuals who are vaccinated have a chance of contracting the infections. Furthermore, some vaccines are prescribed to be administered in 2 doses after some duration apart, and thus, a vaccinated individual can also contract the infections while waiting to receive the second dose. Hence, we carry out simulations varying the aforementioned parameters of interest for this study. The other parameter values used are listed in Table 1.
We first consider a scenario where the uptake of the vaccines and wearing of the face masks especially by the vaccinated individuals is extremely low. Second, we consider a scenario where the uptake of the vaccines and wearing of the face masks by people who are vaccinated is relatively high. Third, we consider a scenario where the uptake of the vaccines and wearing of the face masks by the vaccinated individuals is on an upward trajectory. Under this third scenario, we consider four levels of the extent of vaccine and face mask average protection (α) such that α = 20%, α = 50%, α = 70%, and α = 95% as considered during the sensitivity analysis. For the face mask efficacy (σ), we also consider four level that is, σ = 20%, σ = 40%, σ = 60%, and σ = 80%.
Figures 4A–C, respectively, show the trajectory of the symptomatic, the asymptomatic, and the latent classes of the model (Equations 2–8) when the uptake of the COVID-19 vaccines and wearing of face masks by the vaccinated individuals is extremely low. In this situation, we clearly observe a highly surging number of recorded symptomatic infections, asymptomatic infections, and latent cases as a result. This observation suggests that the absence or low implementation of these control measure strategies would lead to a resurgence in the peak number of COVID-19 infections as well as rising exposure cases. Furthermore, it is observed that the infections take a relatively long time to clear from the human host.
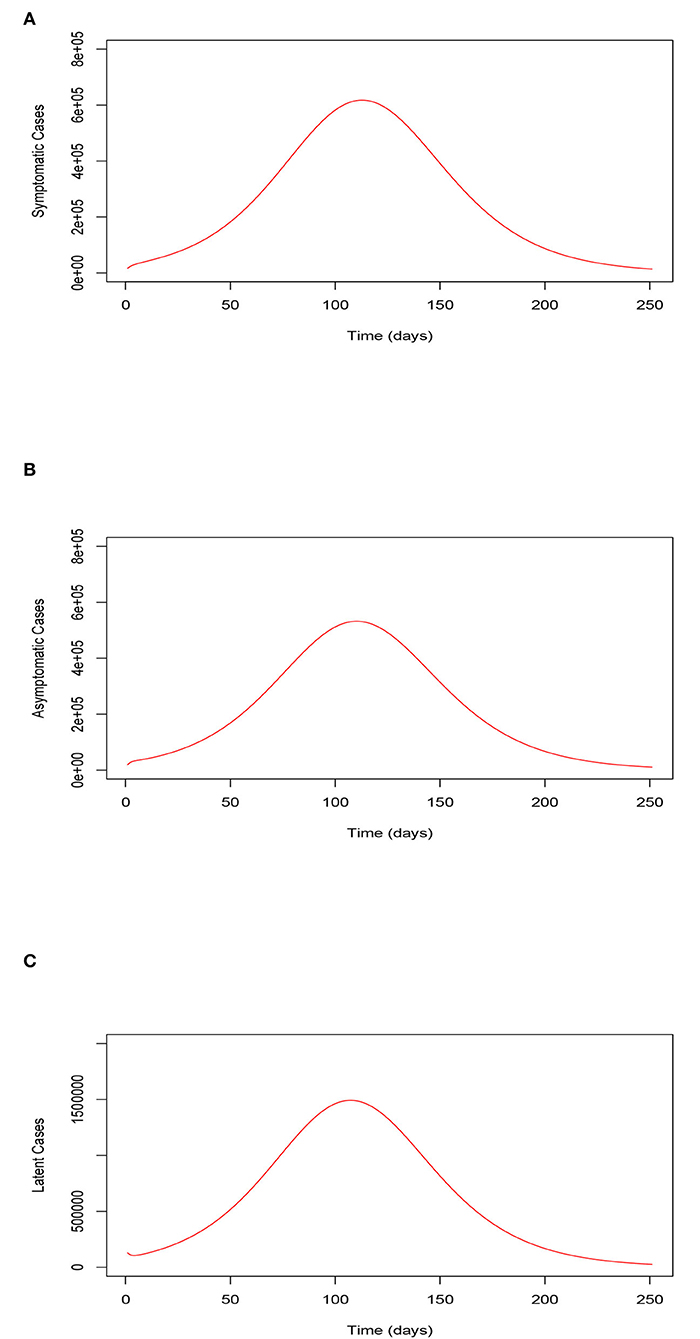
Figure 4. (A) Trajectory of the symptomatic infections for the model (Equations 2–8) when the uptake of the COVID-19 vaccines and the use of face masks by the vaccinated is extremely low. (B) Trajectory of the asymptomatic infections for the model (Equations 2–8) when the uptake of the COVID-19 vaccines and the use of face masks by the vaccinated is extremely low. (C) Trajectory of the latent cases for the model (Equations 2–8) when the uptake of the COVID-19 vaccines and the use of face masks by the vaccinated is extremely low. Trajectory of the symptomatic, asymptomatic, and latent classes of the model (Equations 2–8) when the uptake of the COVID-19 vaccines and the wearing of face masks by the vaccinated is extremely low.
Figures 5A–C, respectively, illustrate the trajectory of the symptomatic, the asymptomatic, and the latent classes of the model (Equations 2–8) when the uptake of the COVID-19 vaccines and wearing of face masks by the vaccinated individuals is relatively high. The Figures show low numbers of recorded symptomatic infections, asymptomatic infections, and latent cases consequentially. These observations stipulate that serious uptake or implementation of these control measure strategies would result in an accelerated reduction in the peak number of COVID-19 infections and reduction in the latent cases. Moreover, we observe that the infections clear within a relatively shorter time span.
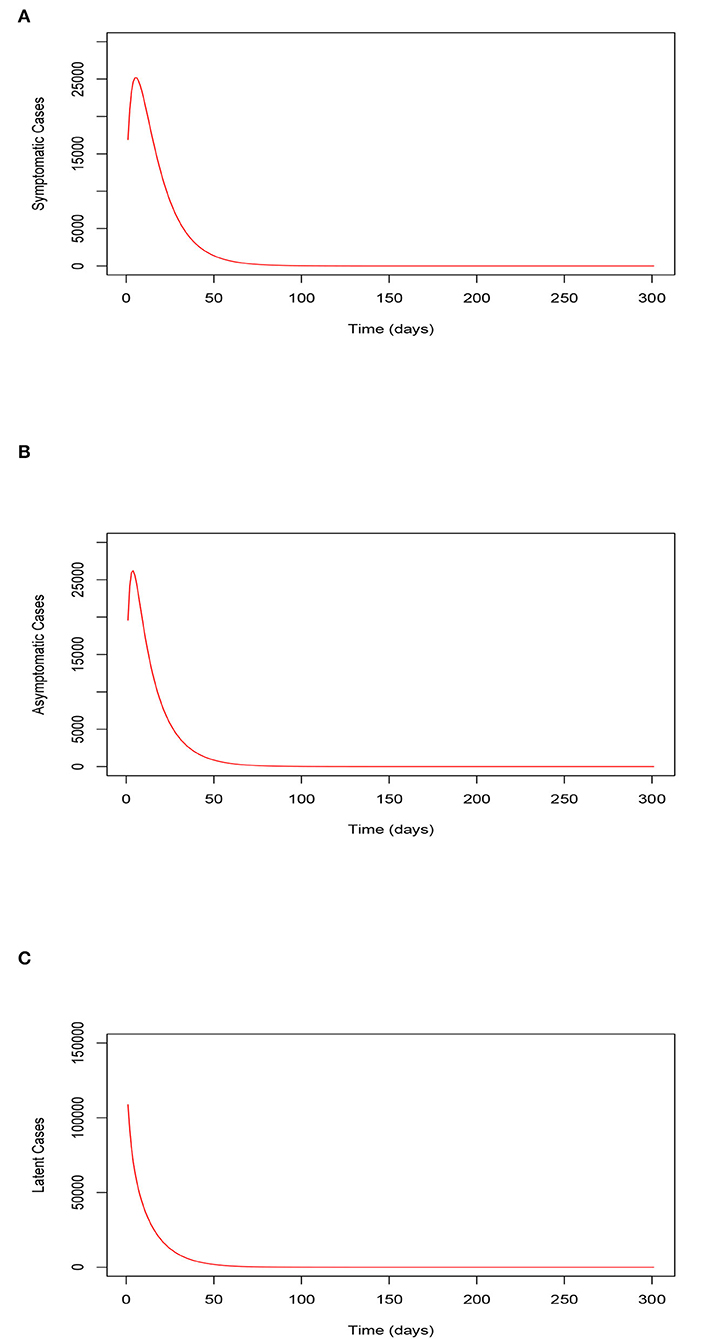
Figure 5. (A) Trajectory of the symptomatic infections for the model (Equations 2–8) when the uptake of the COVID-19 vaccines and the use of face masks by the vaccinated is relatively high (80%). (B) Trajectory of the asymptomatic infections for the model (Equations 2–8) when the uptake of the COVID-19 vaccines and the use of face masks by the vaccinated is relatively high (80%). (C) Trajectory of the latent cases for the model (Equations 2–8) when the uptake of the COVID-19 vaccines and the use of face masks by the vaccinated is relatively high (80%). Trajectory of the symptomatic, asymptomatic, and latent classes of the model (Equations 2–8) when the uptake of the COVID-19 vaccines and the use of face masks by the vaccinated is relatively high (80%).
Figures 6A–D (left-hand-side sub-figures) and Figures 1–4 (right-hand-side sub-figures), respectively, show the trajectory of the symptomatic cases and the asymptomatic cases of the model (Equations 2–8) as ω varies when α = 20%, α = 50%, α = 70%, and α = 95%. We observe that the number of symptomatic infections and the asymptomatic infections reduces as ω increases at each level of α. Remarkably, we see that a concurrent increase in ω and α accelerates the reduction in the number of both symptomatic and asymptomatic infections. In other words, continuous increase in ω at relatively higher levels of α, speed up reduction in the recorded symptomatic and asymptomatic infections. This situation results in a decrease in the cumulative peak number of infections. These observations are explained by the fact that, when more people are vaccinated and continue to wear face masks, their chances of being infected are highly reduced following the combined protection brought about by the vaccine efficacy and the face mask efficacy. Therefore, we infer that serious uptake of the COVID-19 vaccines with the simultaneous wearing of face masks even after vaccination can eradicate the epidemic within a relatively shorter period of time.
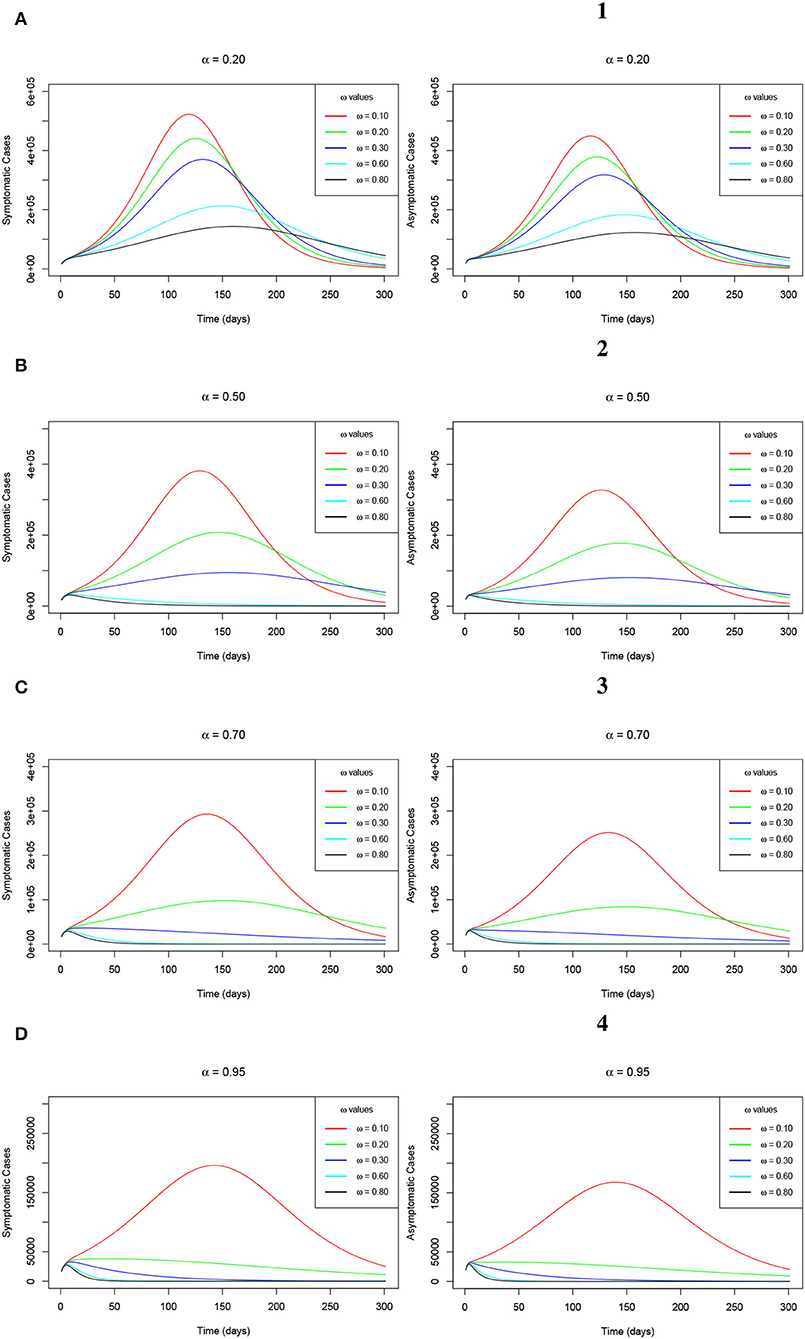
Figure 6. (A–D) Simulations of the model (Equations 2–8) showing the trajectory of the number of symptomatic infections (left-hand-side sub-figures) and the number of asymptomatic infections (right-hand-side sub-figures) as ω varies at changing levels of α.
We note that wearing the face masks by the general public is one of the non-pharmaceutical control measure protocols which was immediately introduced right from the early outbreak of the COVID-19 pandemic. As it is captured in Section 1, it was highly and well implemented hence playing a key role in containing the spread of the pandemic. In reality, wearing face masks has been greatly adhered to by a greater proportion of the population in various countries where the COVID-19 epidemic has been seriously observed. Although this model assumes that about 66% of the Republic of South Africa's population at higher risk of contracting the disease wear face masks, especially in public areas, we consider varying the parameter δ for the measure of wearing of the face masks by unvaccinated individuals. This is done considering four levels of the face masks efficacy denoted by σ such that σ = 20%, σ = 40%, σ = 60%, and σ = 80%. The trajectories of the symptomatic infections and the asymptomatic infections of the model (Equations 2–8) are, respectively, established by the Figures 7A–D (left-hand-side sub-figures) and Figures 1–4 (right-hand-side sub-figures) of Figure 7. The figure shows that as δ increases at each level of σ, the peak number for both the symptomatic and the asymptomatic infections decreases. However, we observe that as δ increases at each level of σ, the infections delay clearing, hence, taking a relatively long time span. This observation implies that the use of the face masks alone may facilitate the clearance of the infections from the human host though within a relatively long time as compared to when vaccination is combined with the wearing of the face masks. The advantage for both cases is that the plateau number of infections keeps on reducing.
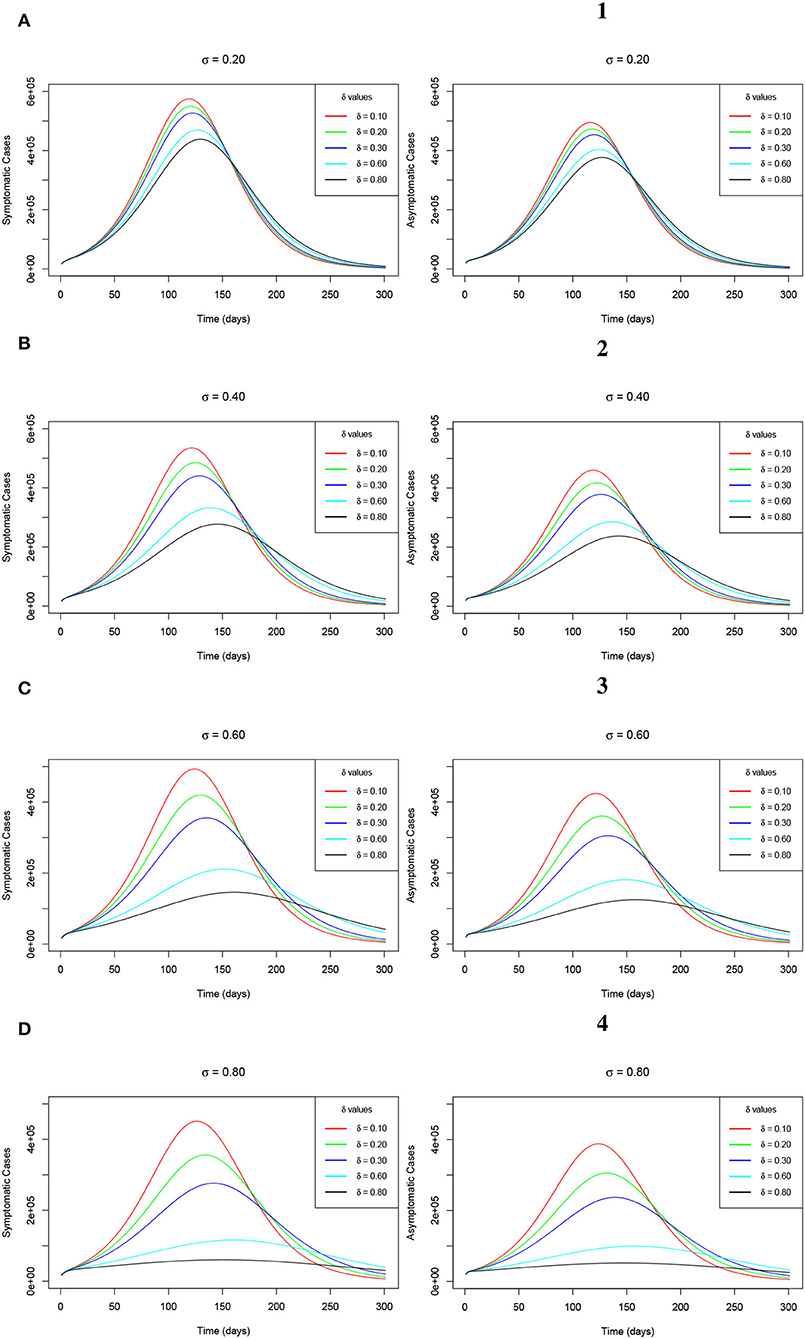
Figure 7. (A–D) Simulations of the model (Equations 2–8) showing the trajectory of the number of symptomatic infections (left-hand-side sub-figures) and the number of asymptomatic infections (right-hand-side sub-figures) as δ varies at changing levels of σ.
Additionally, as a result of a greatly accelerated reduction in the recorded numbers of both the symptomatic and the asymptomatic COVID-19 infections across all the observed levels of α and σ, the plateau number of the latent cases keep on decreasing, respectively as ω and δ increase. This observation is clearly evidenced by Figures 8A–D (left-hand-side sub-figures) and Figures 1–4 (right-hand-side sub-figures), respectively, for varying values of ω at the aforementioned levels of α and for changing values of δ at the earlier stated levels of σ. This trend is completely in order since as much as the peak infections reduce, then the risk of exposure decreases hence triggering low latent cases consequentially.
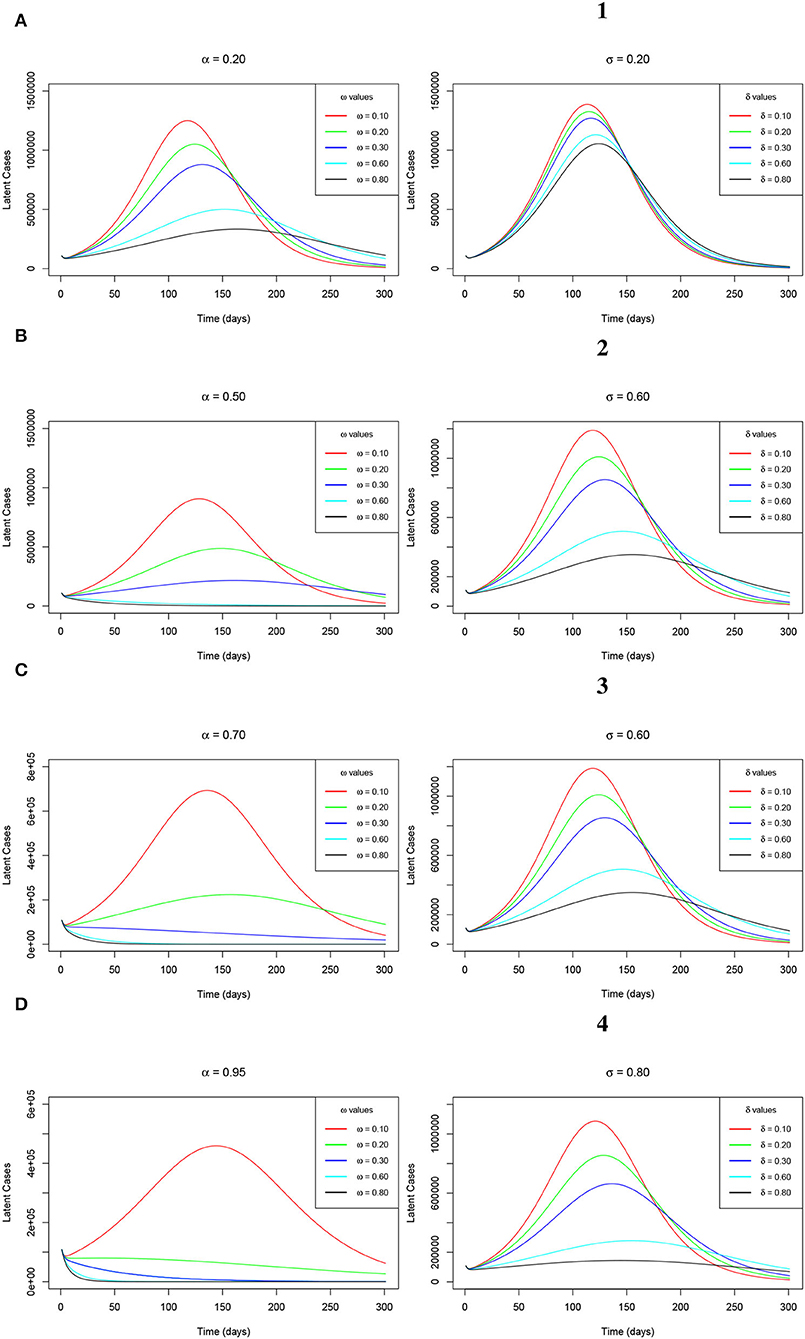
Figure 8. (A–D) Simulations of the model (Equations 2–8) showing the trajectory of the latent cases as ω varies at changing levels of α (left-hand-side sub-figures) and the latent cases as δ varies at changing levels of σ (right-hand-side sub-figures).
5. Conclusion
In this study, we developed a modified SEIR deterministic model which factored in the combination of the COVID-19 vaccination program and the wearing of face masks as intervention strategies to curb the spread of COVID-19 infections. The developed model principally aimed at assessing the potential impact of wearing the face masks, especially by the vaccinated individuals in combating further contraction and spread of COVID-19. This special consideration was made since it was learned that people who are already vaccinated still had a probability of further being infected following their exposure to infectious individuals. This was based on the reasons aforementioned in Section 1.
Analytical results on epidemiological properties of the model ascertained that the model's solution remained positive and bounded within a defined biological feasible region for all non-negative time. We further adopted the Maximum Likelihood Estimation algorithm which was implemented in the fitR package to calibrate the developed model. We used the Republic of South Africa's COVID-19 positive cases reported data from June 01, 2020, to September 08, 2020, in calibrating the model. This important exercise was performed majorly to authenticate the model for use in testing different scenarios. For the sensitivity analysis, we used the expression for the reproduction number to plot the against the ω for the measure of the extent of vaccination and face mask use, while endorsing α for the measure of vaccine and face mask average protection and σ for the measure of face mask efficacy at simultaneously increasing levels. It was found that decreased gently with an increase in ω at each level of α and σ. Uniquely, it was discovered that there was an incredible shift of values tending to less than unity when the α and σ levels were simultaneously increased. Furthermore, increasing the levels of α and σ accelerated the reduction in the value of the reproduction number.
For the numerical simulations, we first considered a scenario where the uptake of the vaccines and wearing of the face masks especially by the vaccinated individuals was extremely low. Second, we considered a scenario where the uptake of the vaccines and wearing of the face masks by people who are vaccinated was relatively high. Third, we considered a scenario where the uptake of the vaccines and wearing of the face masks by the vaccinated individuals was on an upward trajectory. Under the third scenario, we considered four levels of the extent of vaccine and face mask average protection (α) such that α = 20%, α = 50%, α = 70%, and α = 95%. We also considered four levels of the face mask efficacy (σ), such that σ = 20%, σ = 40%, σ = 60%, and σ = 80%.
Results indicated a highly surging number of infections and a low recorded number of infections for scenario one and scenario two, respectively. For the third scenario, it was observed that the increased extent of wearing face masks by the vaccinated individuals at increasing levels of vaccines and face mask average protection resulted in a highly accelerated decrease in COVID-19 infections. This situation triggered the clearance of the COVID-19 infections from the human host within a relatively shorter period of time. Wearing face masks alone also resulted in a reduction in the peak number of infections at increasing levels of face mask efficacy though the infections were delayed to clear. This aspect would make the clearance of the COVID-19 infections take a relatively long span of time. Thus, this study advocates for the continued wearing of face masks even after full vaccination.
Data Availability Statement
The datasets presented in this study can be found in online repositories. The names of the repository/repositories and accession number(s) can be found below: https://www.sacoronavirus.co.za.
Author Contributions
MK, JM, and AM conceptualized the research and developed the model. MK carried out analysis, simulations, and wrote the original draft. JM and AM supervised and proofread the manuscript. All authors contributed to the article and approved the submitted version.
Conflict of Interest
The authors declare that the research was conducted in the absence of any commercial or financial relationships that could be construed as a potential conflict of interest.
Publisher's Note
All claims expressed in this article are solely those of the authors and do not necessarily represent those of their affiliated organizations, or those of the publisher, the editors and the reviewers. Any product that may be evaluated in this article, or claim that may be made by its manufacturer, is not guaranteed or endorsed by the publisher.
Acknowledgments
MK acknowledges the German Academic Exchange Service - DAAD. JM thanks the National Research Foundation of the Republic of South Africa. All authors thank the reviewers for their help to improve the quality of the article via review comments.
References
1. Garba SM, Lubuma JM, Tsanou B. Modeling the transmission dynamics of the COVID-19 Pandemic in South Africa. Math Biosci. (2020) 328:108441. doi: 10.1016/j.mbs.2020.108441
2. Eikenberry SE, Mancuso M, Iboi E, Phan T, Eikenberry K, Kuang Y, et al. To mask or not to mask: modeling the potential for face mask use by the general public to curtail the COVID-19 pandemic. Infect Dis Model. (2020) 5:293–308. doi: 10.1016/j.idm.2020.04.001
3. Mukandavire Z, Nyabadza F, Malunguza NJ, Cuadros DF, Shiri T, Musuka G. Quantifying early COVID-19 outbreak transmission in South Africa and exploring vaccine efficacy scenarios. PLoS ONE. (2020) 15:e0236003. doi: 10.1371/journal.pone.0236003
4. Arashi M, Bekker A, Salehi M, Millard S, Erasmus B, Cronje T, et al. Spatial analysis and prediction of COVID-19 spread in South Africa after lockdown. arXiv preprint arXiv. (2020) 2005:09596.
5. Bastos SB, Cajueiro DO. Modeling and forecasting the early evolution of the Covid-19 pandemic in Brazil. Sci Rep. (2020) 10:1-10. doi: 10.1038/s41598-020-76257-1
6. Ishtiaq A. Dynamics of COVID-19 transmission: compartmental-based mathematical modeling. Life Sci. (2020) 1:5. doi: 10.37185/LnS.1.1.134
7. Mollalo Vahedi B, Rivera KM. GIS-based spatial modeling of COVID-19 incidence rate in the continental United States. Sci Total Environ. (2020) 1:138884. doi: 10.1016/j.scitotenv.2020.138884
8. Atangana I, Araz S. Mathematical model of COVID-19 spread in Turkey and South Africa: theory, methods, and applications. Adv Diff Equat. (2020) 1:1–89. doi: 10.1186/s13662-020-03095-w
9. Góis N, Laureano EE, Santos DD, Sánchez DE, Souza LF, Vieira RD, et al. Lockdown as an intervention measure to mitigate the Spread of COVID-19: a modeling study. Rev Soc Bras Med Trop. (2020) 53:e20200417. doi: 10.1590/0037-8682-0417-2020
10. Makhoul M, Chemaitelly H, Ayoub H, Seedat SL, Abu-Raddad J. Epidemiological differences in the impact of COVID-19 vaccination in the United States and China. Vaccines. (2021) 9:223. doi: 10.3390/vaccines9030223
11. Kinyili M, Munyakazi JB, Mukhtar AYA. Assessing the impact of vaccination on COVID-19 in South Africa using mathematical modeling. Appl Math Inf Sci. (2021) 15:1–16. doi: 10.18576/amis/150604
12. The Republic of South Africa's department of Health online resource and news portal on COVID-19. Available online at: https://www.SAcoronavirus.co.za.
13. Jentsch PC, Anand M, Bauch CT. Prioritising COVID-19 vaccination in changing social and epidemiological landscapes: a mathematical modelling study. Lancet Infect Dis. (2021) 21:1097–106. doi: 10.1101/2020.09.25.20201889
14. Moore S, Hill EM, Tildesley MJ, Dyson L, Keeling MJ. Vaccination and non-pharmaceutical interventions for COVID-19: a mathematical modelling study. Lancet Infect Dis. (2021) 21:793–802. doi: 10.1016/S1473-3099(21)00143-2
15. Moghadas SM, Vilches TN, Zhang K, Nourbakhsh S, Sah P, Fitzpatrick MC, et al. Evaluation of COVID-19 vaccination strategies with a delayed second dose. PLoS Biol. (2021) 19:e3001211. doi: 10.1371/journal.pbio.3001211
16. Olivares A, Staffetti E. Uncertainty quantification of a mathematical model of COVID-19 transmission dynamics with mass vaccination strategy. Chaos Solitons Fractals. (2021) 146:110895. doi: 10.1016/j.chaos.2021.110895
17. Polack FP, Thomas SJ, Kitchin N, Absalon J, Gurtman A, Lockhart S, et al. Bailey Safety and efficacy of the BNT162b2 mRNA Covid-19 vaccine. N Engl J Med. (2020) 383:2603–15. doi: 10.1056/NEJMoa2034577
18. Baden LR, El Sahly HM, Essink B, Kotloff K, Frey S, Novak R, et al. Efficacy and safety of the mRNA-1273 SARS-CoV-2 vaccine. N Engl J Med. (2021) 384:403–16. doi: 10.1056/NEJMoa2035389
19. Voysey M, Clemens SAC, Madhi SA, Weckx LY, Folegatti PM, Aley PK, et al. Safety and efficacy of the ChAdOx1 nCoV-19 vaccine (AZD1222) against SARS-CoV-2: an interim analysis of four randomised controlled trials in Brazil, South Africa, and the UK. Lancet. (2021) 397:99–111. doi: 10.1016/S0140-6736(20)32661-1
20. Dagan N, Barda N, Kepten E, Miron O, Perchik S, Katz MA, et al. BNT162b2 mRNA Covid-19 vaccine in a nationwide mass vaccination setting. N Engl J Med. (2021) 384:1412–23. doi: 10.1056/NEJMoa2101765
21. Foy BH, Wahl B, Mehta K, Shet A, Menon GI, Britto C. Comparing COVID-19 vaccine allocation strategies in India: a mathematical modelling study. Int J Infect Dis. (2021) 103:431–8. doi: 10.1016/j.ijid.2020.12.075
22. Wong GN, Weiner ZJ, Tkachenko AV, Elbanna A, Maslov S, Goldenfeld N. Modeling COVID-19 dynamics in Illinois under nonpharmaceutical interventions. Phys Rev X. (2020) 10:041033. doi: 10.1103/PhysRevX.10.041033
23. Sun T, Wang Y. Modeling COVID-19 epidemic in Heilongjiang province, China. Chaos Solitons Fractals. (2020) 138:109949. doi: 10.1016/j.chaos.2020.109949
24. Boukanjime B, Caraballo T, El Fatini M. El Khalifi M. Dynamics of a stochastic coronavirus (COVID-19) epidemic model with Markovian switching. Chaos Solitons Fractals. (2020) 141:110361. doi: 10.1016/j.chaos.2020.110361
25. Kennedy M, Zambrano GJ, Wang Y, Neto OP. Modeling the effects of intervention strategies on COVID-19 transmission dynamics. J Clin Virol. (2020) 128:104440. doi: 10.1016/j.jcv.2020.104440
26. Sadarangani M, Raya A, Conway B, Iyaniwura JM, Falcao SA, Colijn RC, et al. Importance of COVID-19 vaccine efficacy in older age groups. Vaccine. (2021) 39:2020–3. doi: 10.1016/j.vaccine.2021.03.020
27. Bubar KM, Reinholt K, Kissle SM, Lipsitch M, Cobey S, Grad YH, et al. Model-informed COVID-19 vaccine prioritization strategies by age and serostatus. Science. (2021) 371:916–21. doi: 10.1126/science.abe6959
28. Thompson RN, Hollingsworth TD, Isham V, Arribas-Bel D, Ashby B, Britton T, et al. Key questions for modelling COVID-19 exit strategies. Proc R Soc. (2020) 287:20201405. doi: 10.1098/rspb.2020.1405
29. Lyra W, do Nascimento Jr JD, Belkhiria J, de Almeida L, Chrispim PP, de Andrade I. COVID-19 pandemics modeling with modified determinist SEIR, social distancing, age stratification. The effect of vertical confinement and release in Brazil. PLoS ONE. (2020) 15:e0237627. doi: 10.1371/journal.pone.0237627
30. Libotte GB, Lobato FS, Platt GM, Neto AJ. Determination of an optimal control strategy for vaccine administration in COVID-19 pandemic treatment. Comput Methods Programs Biomed. (2020) 196:105664. doi: 10.1016/j.cmpb.2020.105664
31. Lukman F, Rauf RI, Abiodun O, Oludoun O, Ayinde K, Ogundokun RO. COVID-19 prevalence estimation: four most affected African countries. Infect Dis Model. (2020) 1:827–38. doi: 10.1016/j.idm.2020.10.002
32. Sameni R. Mathematical modeling of epidemic diseases; a case study of the COVID-19 coronavirus. arXiv preprint arXiv. (2020) 11371.
33. Bedi P, Gole P, Gupta N, Jindal V. Projections for COVID-19 spread in India and its worst affected five states using the modified SEIRD and LSTM models. arXiv preprint arXiv. (2020) 06457. doi: 10.1007/s42979-021-00598-5
34. Zhao Z, Li X, Liu F, Zhu G, Ma C, Wang L. Prediction of the COVID-19 spread in African countries and implications for prevention and control: a case study in South Africa, Egypt, Algeria, Nigeria, Senegal and Kenya. Sci Total Environ. (2020) 729:138959. doi: 10.1016/j.scitotenv.2020.138959
35. Gilbert M, Pullano G, Pinotti F, Valdano E, Poletto C, Boëlle FY, et al. Gutierrez Preparedness and vulnerability of African countries against importations of COVID-19: a modelling study. Lancet. (2020) 395:871–7. doi: 10.1016/S0140-6736(20)30411-6
36. Peirlinck M, Linka K, Costabal FS, Kuhl E. Outbreak dynamics of COVID-19 in China and the United States. Biomech Model Mechanobiol. (2020) 19:2179–93. doi: 10.1007/s10237-020-01332-5
37. Salgotra R, Gandomi M, Gandomi AH. Evolutionary modelling of the COVID-19 pandemic in fifteen most affected countries. Chaos Solitons Fractals. (2020) 140:110118. doi: 10.1016/j.chaos.2020.110118
38. Amaro JE, Dudouet J, Orce JN. Global analysis of the COVID-19 pandemic using simple epidemiological models. Appl Math Model. (2020) 90:995–1008. doi: 10.1016/j.apm.2020.10.019
39. Yang Q, Yi C, Vajdi A, Cohnstaedt LW, Wu H, Guo X, et al. Short-term forecasts and long-term mitigation evaluations for the COVID-19 epidemic in Hubei Province, China. Infect Dis Model. (2020) 5:563–74. doi: 10.1016/j.idm.2020.08.001
40. Li T, Liu Y, Li M, Qian X, Dai SY. Mask or no mask for COVID-19: a public health and market study. PLoS ONE. (2020) 15:e0237691. doi: 10.1371/journal.pone.0237691
41. Howard J, Huang A, Li Z, Tufekci Z, Zdimal V, van der Westhuizen HM, et al. An evidence review of face masks against COVID-19. Proc Natl Acad Sci USA. (2021) 118:e2014564118. doi: 10.1073/pnas.2014564118
42. Shen M, Zu J, Fairley CK, Pagán JA, Ferket B, Liu B, et al. Effects of New York's executive order on face mask use on COVID-19 infections and mortality: a modeling study. J Urban Health. (2021) 98:197–204. doi: 10.1101/2020.10.26.20219527
43. Stutt RO, Retkute R, Bradley M, Gilligan CA, Colvin JA. Modelling framework to assess the likely effectiveness of facemasks in combination with ‘lock-down’ in managing the COVID-19 pandemic. Proc R Soc. (2020) 476:20200376. doi: 10.1098/rspa.2020.0376
44. Nyabadza F, Chirove F, Chukwu CW, Visaya MV. Modelling the potential impact of social distancing on the COVID-19 epidemic in South Africa. Comput Math Methods Med. (2020) 2020:5379278. doi: 10.1101/2020.04.21.20074492
45. Mason DM, Kapinaj M, Martínez AP, Stella L. Impact of social distancing to mitigate the spread of COVID-19 in a virtual environment. In: ACM Symposium on Virtual Reality Software and Technology. (2020). p. 1–3.
46. Iboi Ngonghala CN, Gumel AB. Will an imperfect vaccine curtail the COVID-19 pandemic in the US?. Infect Dis Model. (2020) 5:510–24. doi: 10.1016/j.idm.2020.07.006
47. Gumel B, Iboi EA, Ngonghala CN, Ngwa GA. Mathematical assessment of the roles of vaccination and non-pharmaceutical interventions on COVID-19 dynamics: a multigroup modeling approach. medRxiv. (2021) 2020–12. doi: 10.1101/2020.12.11.20247916
48. Kinyili M, Justin Munyakazi B, Abdulaziz A. Mukhtar Y. Mathematical Modeling and Impact Analysis of the use of COVID Alert SA app. AIMS Public Health. (2022) 9:106–28. doi: 10.3934/publichealth.2022009
49. Smith HL, Waltman P. The Theory of the Chemostat: Dynamics of Microbial Competition. Cambridge: Cambridge University Press (1995).
50. Garba SM, Safi MA, Usaini S. Mathematical model for assessing the impact of vaccination and treatment on measles transmission dynamics. Math Methods Appl Sci. (2017) 40:6371–88. doi: 10.1002/mma.4462
Keywords: mathematical modeling, COVID-19 epidemic, deterministic models, pharmacological and non-pharmacological measures, computer-aided simulations
Citation: Kinyili M, Munyakazi JB and Mukhtar AYA (2022) To Use Face Masks or Not After COVID-19 Vaccination? An Impact Analysis Using Mathematical Modeling. Front. Appl. Math. Stat. 8:872284. doi: 10.3389/fams.2022.872284
Received: 09 February 2022; Accepted: 21 March 2022;
Published: 27 April 2022.
Edited by:
Hagos Hailu Gidey, Botswana International University of Science and Technology, BotswanaReviewed by:
Salisu Garba, University of Pretoria, South AfricaSourav Das, National Institute of Technology, Jamshedpur, India
Copyright © 2022 Kinyili, Munyakazi and Mukhtar. This is an open-access article distributed under the terms of the Creative Commons Attribution License (CC BY). The use, distribution or reproduction in other forums is permitted, provided the original author(s) and the copyright owner(s) are credited and that the original publication in this journal is cited, in accordance with accepted academic practice. No use, distribution or reproduction is permitted which does not comply with these terms.
*Correspondence: Musyoka Kinyili, NDEwMDE1MEBteXV3Yy5hYy56YQ==