 Ayaz Akhtar1
 Mohammad Abiad
 Muhammad Aamir
 Muhammad Naeem
95% of researchers rate our articles as excellent or good
Learn more about the work of our research integrity team to safeguard the quality of each article we publish.
Find out more
ORIGINAL RESEARCH article
Front. Appl. Math. Stat. , 21 March 2022
Sec. Mathematical Finance
Volume 8 - 2022 | https://doi.org/10.3389/fams.2022.808489
The Coronavirus disease (COVID-19) most likely began in an animal species and subsequently transmitted to humans in Wuhan, China, a city of 11 million people, on December 29, 2019, when the first case was recorded. The Coronavirus then transmitted from person to person by infected droplets from a sick person's coughing, sneezing, or contaminated hands. Hence, the purpose of the study is to see the impact of the outbreak of COVID-19 daily tests on the Pakistani rupee against the US dollar exchange rate using Vector Autoregressive approach. The data is gathered from February 26, 2020 to March, 2021. This period was selected, because the pandemic expanded, and the first case was observed in Pakistan on Feb 26th 2020. To verify this effect, a Vector Autoregressive Model was developed. A generalized version of the Autoregressive Model is a Vector Autoregressive (VAR) model. As a result of the COVID-19 pandemic, the Pakistani rupee devalued against the US dollar throughout the abovementioned period. When analyzing the Pakistani rupee vs. the US dollar exchange rate using a Vector Autoregressive Model, the values of the lags (1, 4, 6, and 7) of the explanatory variable have a significant impact. Besides, under the VAR model, the IRF (Impulse Response Function) asserted the actual impact of the daily COVID-19 tests, as well as Decomposition of Variance was shown to provide for the daily COVID-19 tests just a small part in understanding the volatility of the Pakistani rupee against the US dollar exchange rate. The Granger Causality suggests that the short-term and long-term changes in the Pakistani rupee against the US dollar exchange rate are caused by daily COVID-19 tests.
The COVID-19 first case was found in December 2019. Chinese officials conducted retrospective examinations at the beginning of December 2019 and found human instances with the start of symptoms. While the most of the first cases were linked to a wholesale food market in Wuhan city, some were not. Either stall owners, business workers, or regular tourists to this field were many of the early patients. COVID-19 positive environmental samples acquired from this market in December 2019 confirms that the Wuhan City market was the source of the outbreak. The sector was shut down on January 1, 2020. COVID-19 was discovered at the beginning of January and was shared with the public on January 12th. The entire genetic sequence of COVID-19 from early human instances, as well as the accumulation of many different diseases distinct from human infections in China and across the world from this point on, show that COVID-19 has a historical background within the bat population. Every available evidence indicates that the virus is a natural animal development and was not created or produced by a virus. Various scientists were able to see the genetic characteristics of SARS-CoV-2 and have found that there is no reason that SARS-CoV-2 is a laboratory construction. Every available COVID-19 proof indicate that SARS-CoV-2 does have a zoonotic origin. But there is usually little direct interaction between humans and bats, many things considering, the transmitting of infection to humans has happened by some other type of species, one that has been required to be taken good care of by humans. This interim zoonotic influence may be a household animal, a feral animal, or a skilled wild beast, that had not yet been recognized. Both the scattered genetic classes of SARS-CoV-2 detected in human cases are approximately the same.
Accordingly, numerous nations have actualized measures, for example, Self-isolation and social distance to avoid more expansion [1]. Therefore, compressing the disease curve, which may prove critical in sustaining clinical coverage for patients really in need of treatment whether it be for COVID-19 or with other severe conditions [2]. The ability to understand the speed at which the disease progresses is important in the fight against the disease outbreak. Evaluating the level of distribution at any arbitrary point in time will help policymakers in general prepare for human health and the preparation for resolving the results of the epidemic [2, 3]. One solution to this is by precise research at an immense scale. Whereas, research strategies for COVID-19 differ across country to country [4] with differing percentages of individuals tested [5], as of 23 April 2020, no country tested more than 13.4 percent of its population, with the average total, affected population is 1.3 percent. In the meantime, anti-body studies, although established beginning on 6 April 2020, were not generally accepted [6–8].
On 26-02-2020, the Pakistan government's Health Ministry confirmed the first case of COVID-19 in Karachi, Sindh Province. The second incidence was confirmed by Pakistan's Department of Health in Islamabad on the same day. Since then, the virus has infected 6,84,691 Pakistanis (up to March 2021), while more than 6,09,659 Persons have been saved. Pakistan is one of the fifth most populous countries (having a population of 212.8 million) throughout the globe, with a highly populated in numerous towns [9]. Taking Pakistan's population dynamics into account, the danger to Pakistan the outbreak of COVID-19 is very severe. Because of societal and cultural conventions, typical social contacts the day is also better than in contrast with Europe or Italy. In Pakistan, it is very common to have a wider family set-up usually residing in cramped environments, favoring the spread of disruptive infection. With 65% under 30 years of age, the Pakistani country does have the youngest population in the world [9]. The spread of the infection may be facilitated by the highly populated level in major cities in Pakistan and wider than normal social groups.
China, the epicenter of COVID-19, is located northeast of Pakistan. New economic deals with China and political-religious ties with Iran have resulted in an influx of infected persons from these two geographically significant reservoirs of the virus. As a first line of defense, Pakistan closed its border with China and imposed strict security measures at the Pakistani-Iranian border [10]. After all, in the initial stages of the pandemic, Pakistan appears to lack the ability to recognize COVID-19 correctly, pressuring it to rely on samples from China, Japan, and the Netherlands. This caused a critical time lag, restricting the government's ability to respond appropriately to the outbreak. Fortunately, the government was able to obtain diagnostic kits from China as well as primers from Japan, permitting them to analyze samples independently [11]. Pakistan also shares a southwest border with Iran, where the number of cases and deaths is rapidly increasing. The climatic conditions of incredibly serious outbreaks in two neighboring countries (China and Iran), combined with the World Health Organization's declaration of COVID-19 as a pandemic, prompted Pakistan's government to take severe, extreme, and rapid measures to prevent the virus from spreading much further across the world [12]. Moreover, in conjunction with civil aviation authorities, the Pakistani government mandated passenger screening before to entry in the zone [13]. In collaboration with the Ministry of Health, the federal government of Pakistan devised a strategy known as “The National Action Plan for The Corona Virus Disease (COVID-19) Pakistan” [12]. The goal of this project was to create policies and a framework to assist provincial governments and states throughout Pakistan in improving strategies and solutions to combat the spread of COVID-19. Using it as a model, provincial governments in Lahore and Karachi (two of Pakistan's major cities) built quarantine stations with the help of Pakistan's military forces [14]. Furthermore, the government has established a recently constructed residential building in Sukkur as a quarantine center with 2,000 beds [15]. Additionally, a quarantine facility in Taftan, near the Pakistani-Iranian border, was built to aid in the identification and quarantining of people returning to Pakistan after visiting Iran [16].
A new quarantine center with 300 beds has been established in Islamabad. Using extraordinary powers, the government also announced the closure of all hotels and designated certain of them as quarantine locations. In addition to these isolation facilities, the government has constructed isolation units in a few hospitals [17].
The Ministry of Health was also ready to provide vital disease-fighting equipment, like face masks, gloves, and protective suits, to paramedics and physicians on the front lines of this pandemic. Hospitals decided to focus on COVID-19 patients and acute crises [11]. The provincial governments established phone lines where individuals may ask inquiries about COVID-19-related healthcare issues. They've utilized this website to advise people to stay at home if they begin to show symptoms of the sickness. Campaigns were launched on social media and conventional networks around the country to raise awareness about correct hand sanitization procedures and the importance of social distance in breaking the transmission cycle. The government distributed alcohol-based sanitizers to people in need, and manufacture of disinfecting walkthrough gates began, with some installed at the entrances of selected food markets [12].
Major problems were identified at each level during all of these attempts. One of the challenges is the irregularity with which immigration rules dealing with the admission of people from borders and airports [13] were implemented owing to a lack of vital security suites and other medical products [1]. COVID-19 spread quickly and consistently throughout the region because to a lack of facilities, insufficient infrastructure, and inconsistent government regulation compliance [15–17]. However, officials planned to move persons infected with COVID-19 to Multan and Faisalabad (two large Pakistani towns), after converting numerous public university dorm rooms in those locations into quarantine facilities [18]. Employees at a hospital staged a protest against working without proper safety equipment [19]. Likewise, quarantine institutions were deemed incapable of separating sick persons from the healthy community. The one-room, one-person rule, as well as a shortage of clean bathrooms and drinking water, were all brazenly disregarded. Five people were said to be housed in a single prison camp [16].
A Cabinet meeting approved a proposal for 900 billion Pakistani rupees ($5.66 billion) in help to low-income groups, including labor, and to strengthen health-care facilities in public hospitals [20]. Despite this, because to the aforementioned hazards and challenges, the COVID-19 epidemic in Pakistan was ineffectively controlled.
The pandemic affect almost all the sectors including economy throughout the world. This study aims to find out the relationship between the COVID-19 and dollar exchange rate for Pakistan in order for governments and public sector institutions to take effective measures to reduce the economic waves of the pandemic, they require to evaluate the circumstance and the measure of complications to decide where support is required.
Follow these basic measures to limit your risks of getting COVID-19, the new coronavirus that causes a disease.
You should do
(i) Stay home and disinfect your home.
(ii) Wash your hands for 20 s.
(iii) Wear a mask.
(iv) Cover nose when sneezing.
(v) Social distancing.
You should avoid
(i) Avoid crowded places.
(ii) Avoid contact with sick people.
(iii) Avoid handshaking.
(iv) Do not touch you face or nose.
(v) Do not travel.
The spreading of COVID-19 to the provinces is projected to have a greater influence on the Pakistani economy. Pakistan, which shares borders with China and Iran, has a high rate of movement, and trade has been threatened by viral infection. Around 7,000 Pakistani pilgrims have returned from Iran to Taftan Quarantine. The return of pilgrims to their communities without border checks has led in the spread of diseases throughout the country. Pakistan's insufficient medical facilities system, with 0.6 beds per 1,000 people and a health budget of less than 0.75 percent of GDP, is blamed of bearing the COVID-19 impact if there is an exponential increase in cases. Furthermore, a lack of expertise and a general lack of awareness leads people to be unconcerned with social distances and hand-cleanness.
Karachi has an incredible population of 14.91 million and is the capital of Sindh Province, a terribly affected region to date, with the most significant amount of confirmed cases of COVID-19 in the country and 87 communal transmission cases. In the coming weeks, a remarkable expansion will restrict the city's health infrastructure from collapsing into turmoil. Eighty percent of the ailments are moderate, according to a late study, with 18.5% needing hospitalization, of which 4.7% would require basic ICU treatment [21]. Ambiguity about the spread of the virus and the degree of total demand could damage the financial market growth in the county, resulting in greater exchange-rate volatility.
“The Pakistani economy is declining, unemployment is growing, and a wide spectrum of businesses are in trouble,” said Zafar Moti, former director of the Karachi Stock Exchange (KSE). This would all have a negative impact on international reserves and, eventually, the currency's value. He said “Capital markets would suffer in the long run as well”.
Pakistan's GDP growth rate was 5.8 percent when Khan came into power in 2018, but it is now 0.98 percent and likely to decrease further. The country's budget is around 10% out of balance, and exports have declined in the previous 2 years.
Despite the extreme economic repercussions of Covid-19, the rupee held firm against the US dollar in 2020. The local currency dropped 3.29 percent against the US dollar between December 31, 2019, and 30th December, 2020.
The Covid-19 began growing on a worldwide scale in early 2020, and it had reached Pakistan by the end of February. The country's external trade production had begun to rise, and over $3 billion had been invested in domestic bonds.
Moreover, the rapid increase and expansion of Covid-19 in February led investors to withdraw their investments in domestic bonds, causing the country's foreign reserves to decrease. The withdrawal of this investment depleted the reserves of the State Bank of Pakistan (SBP), severely influencing the currency rate.
The dollar was worth Rs. 154.55 in February before rising to Rs. 166.5 in March of the same year. COVID-19 had an immediate impact on the field. The bulk of the $3 billion accumulated in local bonds would also leave the country within 3 months.
In June, the dollar hit a high of Rs. 168.20 in the interbank market and about Rs. 170 in the free market. Until September, when it was trading at Rs. 165.85 per rupee, the dollar remained high.
The dollar started losing value against the rupee in October, when it dropped to Rs. 160.35 Since October, the dollar has been very stable, with just minor fluctuations. “Because the exchange rate has remained about the same for the previous 3 months, I expect it to remain at the same price for the next 3 months,” said Malik Bostan, President of the Forex Association of Pakistan.
For the previous 6 months, the current account has been in surplus, which has aided the SBP's foreign reserves while also boosting the exchange rate.
The COVID-19 severely affected the world economy including Pakistan. The authors in [22] studied and collected data from 184 Pakistani micro, small, and medium-sized enterprises (MSMEs) utilizing an online questionnaire method. They found that, most of the enterprises were severely affect due to COVID-19 outbreak. In the same way, the authors in [23] developed the relationship between the COVID-19 cases and its impact on Pakistan economy. Moreover, they find the demand-side shocks and supply-side shocks with COVID-19 on Pakistan economy. The authors concluded in their study that both the factors will affected due to COVID-19 pandemic.
In this study, we developed the model for COVID cases with respect to dollar exchange rate for Pakistan.
The following hypothesis has been proposed as a consequence of the above literature review:
Ho: The COVID-19 daily tests does not affect the Pakistani Rupee against the US Dollar exchange rate.
This section tends to the methodology utilized in this study with regards to data, sample and Research Model. First of all we discuss about the Time Series Model that have been used.
The goal of this study is to see how X (COVID-19) daily testing affects the performance of the Pakistani rupee Y (PKUSD) against the US dollar exchange rate. The Model has the following practical form:
Where yt ,yt−1, yt−2, ... yt−j denotes the Pakistani rupee against the US dollar exchange rate and their lags. Similarly,ct, ct−1, ct−2, … ct−j denotes the number daily COVID-19 tests. Moreover, the coefficients α0, β, δ and ε are intercept term, PKUSD, number of tests and error term, respectively.
Due to the COVID-19 eruption, various organizations and entities have made COVID-19 data for study and testing publicly accessible datasets.
The “Novel Corona Virus 2019 Dataset” includes daily data about:
(i) New COVID-19 confirmed cases
(ii) COVID-19 daily tests
(iii) The Number of deaths
(iv) Recoveries of COVID-19 patients
The study's data was gathered from two different sources. The data for the COVID-19 daily tests pandemic from (Feb 26, 2020 to March, 2021) were obtained from the Official web site of the Pakistan's government “Ministry of National Health Services Regulation and Coordination” and data for the regular closing US-dollar against Pakistani rupee were obtained from the website “Investing.com.” We used R software was used for analysis of this study. Both the data sets are presented in Figures 1 and 2 respectively.
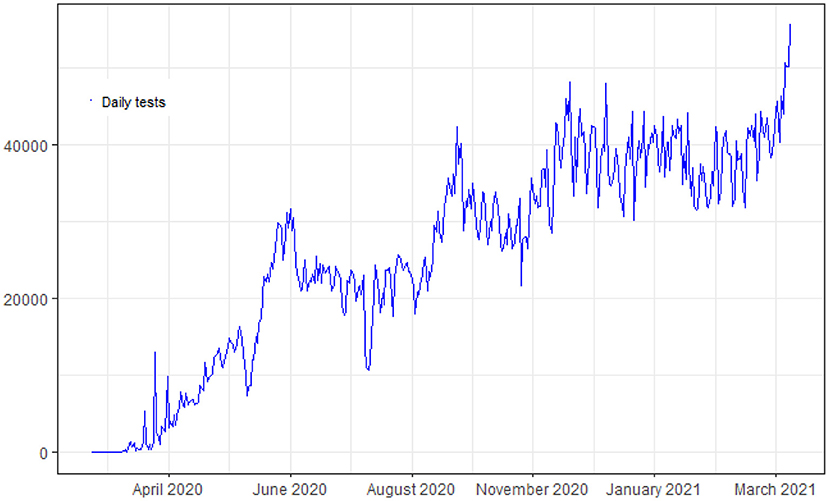
Figure 1. Daily COVID-19 tests from February 2020 to March 2021 in Pakistan.
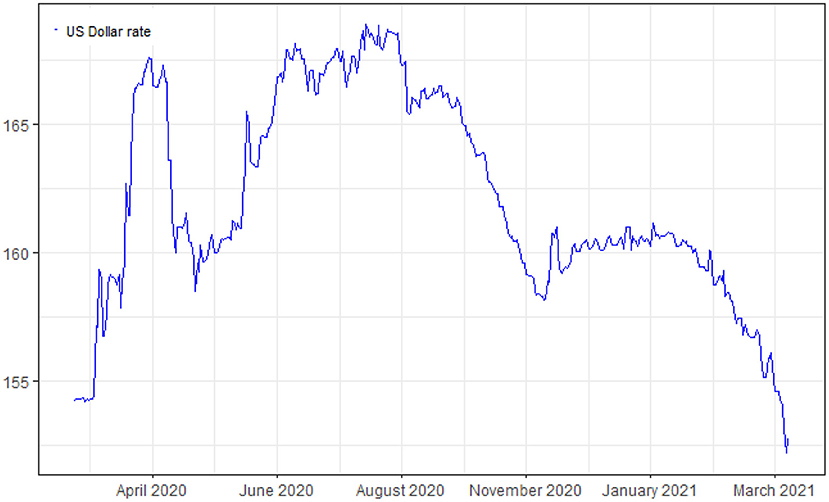
Figure 2. Shows daily US-dollar exchange rate from February 2020 to March 2021 in Pakistan.
To identify shock of the Pakistani rupee market rate caused by COVID-19, a Vector Autoregressive Model was created, following Sims [24] ID technique, in which no arbitrary restriction is imposed on the model, taking into account that there is lacking theoretical and empirical support to consider a causal channel between the Pakistani rupee market rate and COVID-19.
Vector Autoregressive Model is a Mathematical formula used to demonstrate the interaction between various variables as they alter over time. It is a kind of Stochastic Methodology. This model is widely used in economics and natural sciences. Such as the AR model, each component will have a modeling approach in its evolution over time. This equation combines the lagged (past) value of a variable, the lagged values with another variable in the analysis, and the error term. The Vector Autoregressive Models don't require as many details more about forces impacting the vector as the physical models mostly with a simultaneous equation will. Just the earlier knowledge needed would be a set of factors that can be expected to affect someone after some period. The simplified VAR method removes the pre-requisite for linear analysis by evaluating each change in the dependent variable throughout the process with an aspect of p-lagged estimates of the total of the response variables in the research.
VAR Models were presented by the macro econometrician to show the joint dynamics and causal relations among a bunch of macroeconomic factors [24]. VAR Models are helpful for forecasting. Note that a VAR Model is the generalization of a Uni-variate Autoregressive Model. The VAR Model is given below:
Where Zt is a h× 1 vector of the dependent variable, x is a p×1 vector of independent variables, B1, B2, ..........,Bp is h×h Lag coefficient Matrices to be calculated and C is h×p Matrix with Explanatory variables coefficients to be calculated and et is a white-noise invention technique.
VAR is used to model the interrelated time series system and to evaluate the complex influence of random disturbances on the factor system COVID to PKUSD. This study uses a two-variable Vector Autoregressive Model to evaluate the causal interaction between the two variables i.e., number of COVID-19 daily tests (COVID) and the Pakistani Rupee US dollar exchange rate (PKUSD). Then we also introduced IRF (Impulse Response Function), Decomposition of Variance, and GCW test (Granger Causality Wald) test within Vector Autoregressive process amid two dependent factors.
An impulse response function (IRF) of an active device is the output of the IRF as specified in a small input signal termed an impulse in signal processing. In general, the impulse response is the response of any complex system in the light of any external transition. In the two cases described above, the impulse response indicates the system's response as a function of time. In both of these instances, the dynamic configuration and its impulse response could be real components or could be the mathematical framework of the equation.
The Impulse Reaction Work in vector auto-regressive structure has been used to regulate the Usefulness of a 1-time impact on the development of current along with projected dependent vector numbers. Impulse reaction analysis is a critical step in the econometric analysis that uses auto-regressive vector models. Their key goal is to make clear the evolution of the variables of the model in response to a shock in one or more variables. This function makes it easy to discern the distribution of a single stun inside or otherwise a noisy series of equations and thus makes them very useful tools for seeking fiscal plans. This post provides an introduction of the idea and understanding of impulse response functions as they are repeatedly used in the VAR literature and provides codes for their calculation in R.
Decomposition of the variation offers the level of fluctuations in response variables related to their small crises alongside crises of other variables [25–27]. Variance decomposition is extracted from a VAR with parallel residues to facilitate comprehension. Variance decomposition is a procedure used in econometrics and multivariate time series analysis to assist in the evaluation of the vector auto-regression (VAR) model after it has been constructed [21]. This approach displays how much information each variable in the auto-regression model gives to the other variables. It is shown that external shocks to the other components may explain a large portion of the variance breakdown of each element.
The Granger causality test, first discovered in 1969, is a statistical technique for determining if one time series helps forecast the other [28]. To use the term “causality”, as Granger-causality would be best expressed as “causality” as “precedence” [29]. Just like Granger itself said that in 1977, “temporally related” [30]. Instead of checking If Y affects X, Granger's causality tests whether Y predicts X [31].
If it is discovered that a set of t-tests, as well as F-tests on the lagged-values of X (and even the lagged Y-values), indicate significant information of the possible values of Y, the time series X is said to Granger-causes Y. In a stationary time series, the test is conducted with two (or even more) variables at the level values. If the parameters are non-stationary, the evaluation is conducted using a first or higher differences. The amount of lags to be used is chosen based on an information criterion, as the AIC or SIC or ADF test. Each specific lag-value of one of its variables shall remain throughout regression since (1) it becomes essential according to the t-test, all (2), as well as the other lag-values of a variable, shall contribute evenly to the explanatory power of the system according to the F-test. At the same time, the presumption with no Granger is not rejected since there are no lagged values of an independent variable maintained in the regression.
Let us Y and X are stationary at first differences. So we assess the hypothesis whether X is not Granger-causes Y, then we find the necessary lagged-values of Y should be included in the Uni-variate Auto Regression of Y.
Then, the auto-regressive system is extended by totaling the X-lagged values
In the above Equation 4, the variable Yt denote the PKUSD and its lags value to the right hand side of the equation and the independent variables and its lags values, respectively.
Throughout this VAR equation, every lagged value of X that is independently significant in terms of the t-statistics shall be maintained, given that they together attach the predictive regression capacity as per the F-test (Whose Ho: That no predictive capability has been used together by the X's). Mostly in the terminology of the enhanced regression referred to above, p denotes the lowest, and q denotes the greatest lag for which the lagged X values are significant.
Assuming whether X would not be Granger-causes Y is accepted if X's lagged-values do not exist throughout regression. The methods used by Granger [32] and Pasquale and Joseph [33] to assess whether or not X (COVID) affects Y (PKUSD) are to first determine the magnitude of Present Y that should be explained by prior values of Y, and then to evaluate whether adding lagged x values can improve the proficiency of Y is assumed to be Granger-brought about X if X increases with the prediction of Y or commonly More or fewer lags have often grown easier to utilize. The hypothesis is formulated as to the importance of all historical data. Throughout this study, we would use a lag order of 7 which refers to the maximum duration of fair confidence beyond that one variable is used to estimate the other variable [34–36].
We evaluated the non-appearance of Granger causality by analyzing the appropriate VAR conditions below:
Each pair of (X, Y) patterns inside a group. And relevant F-results based on the typical assumption:
Ho: Whether X(COVID) does not affect Y(PKUSD) and that Y doesn't affect X in regression.
In Econometrics, the ADF-test tested the hypothesis i.e., H0 that the root unit present in the results of the time series. The alternate is distinctly based on which type of a test is being used and is often either trend or stationary. It is an improved version of the Augmented Dickey test, with a much larger and more detailed time series structural model. The ADF-test yielded a negative result. When the ADF is considerably negative, the hypothesis Ho: The existence of a unit root with some level of certainty is likely to be rejected [37]. The ADF test evaluates whether or not the variables in the analysis are stationary. Figures 3, 4 shows the first difference of the daily COVID-19 tests and PKUSD dollar exchange rate respectively.
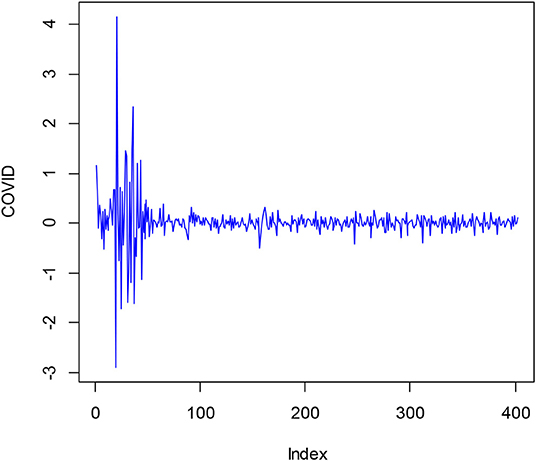
Figure 3. Daily tests data after stationarity.
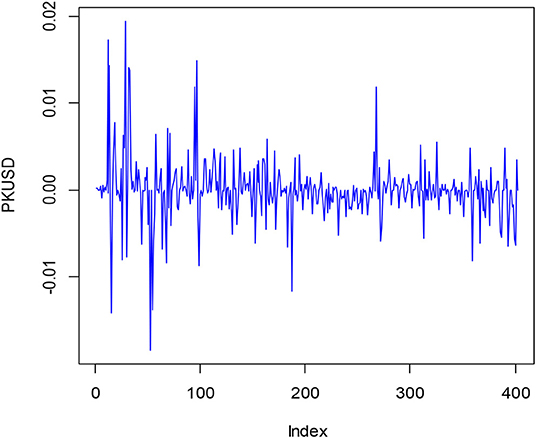
Figure 4. PKUSD data after stationarity.
The VAR model is fitted, and first of all the variables Stationarity is checked by Augmented Dickey Fuller test and shown in Tables 1, 2.
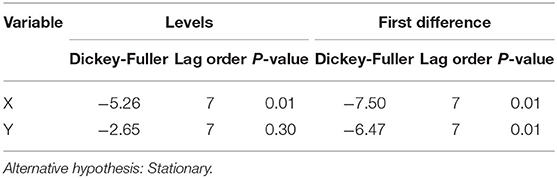
Table 1. Results of the COVID and PKUSD using ADF test.
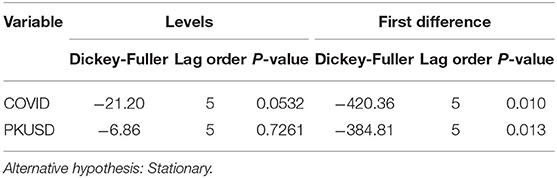
Table 2. Results of the COVID and PKUSD using PP test.
Both the variables X (COVID) and Y (PKUSD) are stationary at the first difference, as the Vector autoregressive model requires stationary data to control the variable as shown in Table 1. At the first difference, the variables have a unit root. The selection criterion for the VAR lag order is shown in Table 3. Moreover, ADF test and PP test gives same ideas for the data stationarity and results output are in the form of Dickey fuller values.
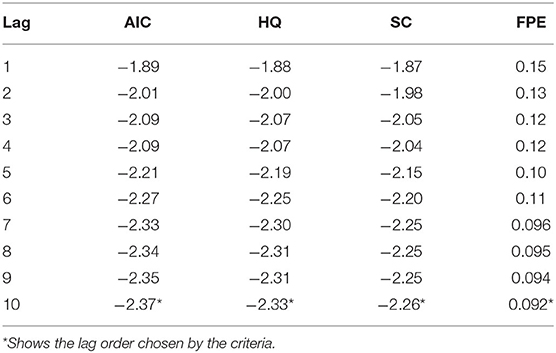
Table 3. Selection criterion for VAR lag order.
In Table 3, Lag Selection Criteria, i.e., AIC, Hannan-Quinn information criterion (HQ), SIC, and Final prediction error (FPE), all criterion suggested taking 10 lags in Vector autoregressive model to be the optimum lag, as well as the polynomial of the AR characteristics roots of inverse shows the reciprocal mode of every root attribute is within the circle. Moreover, as shown in Figure 5 the order of lag 10 is appropriate. However, the ADF test suggested 7 lags PP test suggested 5 lags, respectively.
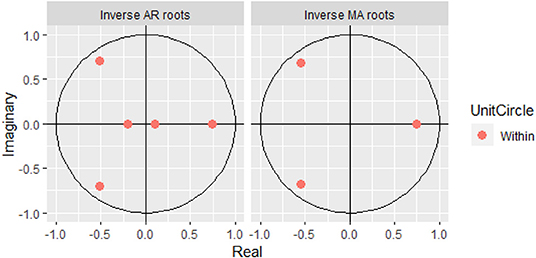
Figure 5. Inverse roots.
The findings of the VAR model can be seen in Table 4. Testing whose latency (COVID-19) is significant in the explanation (PKUSD) is mentioned to in the equation table structure. At the stage where the response variable is Y (PKUSD), X (COVID) lags 1, and 6 is significant at 5% whereas the lags 4 and 7 is significant at 1%. Further, the value of Log-Likelihood function is 1602.694 for the Vector autoregressive model is typically high, furthermore, the AIC = −3145.387 is low, which means the Model's potential is good.
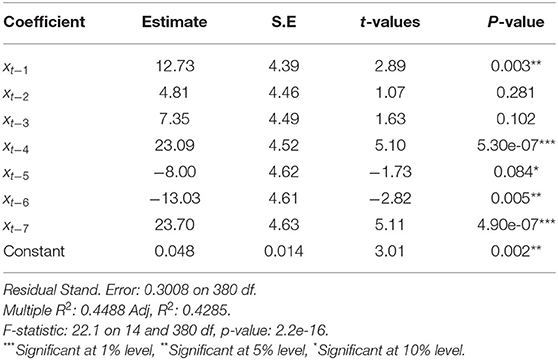
Table 4. VAR model estimates.
The findings of the VAR model can be seen in Table 5. Testing whose latency gold price (g) is significant in the explanation PKUSD (y) is mentioned to in the equation table structure. At the stage where the response variable is PKUSD (y), gt−1 and gt−4 is significant at 0.01 and 5%, respectively.
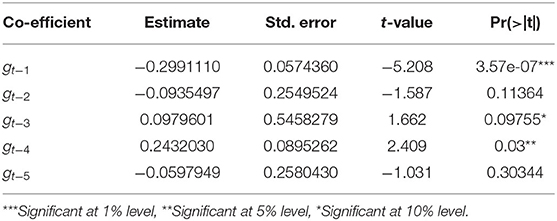
Table 5. VAR Model Estimates for G-price with dollar exchange rate during Non-COVID-19 period.
The findings of the VAR model can be seen in Table 6. G-price is significant in the explanation (PKUSD) is mentioned to in the equation table structure. At the stage where the response variable is PKUSD, gt−2 and gt−3 is significant at 5%. Moreover, covariance and correlation matrices are found in Table 7.
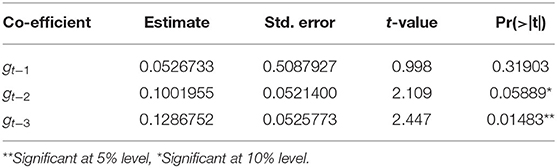
Table 6. VAR Model Estimates for G-price with dollar exchange rate during COVID-19 period.
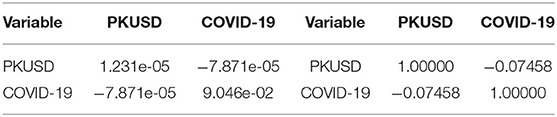
Table 7. (A) Covariance matrix of the residuals, (B) Correlation matrix of residuals.
Figure 6 shows the effects of the IR function in the VAR model. The Impulse Response line is black, while the red lines represent 95 percent coefficient intervals. IRF at all instances in the 95% confidence coefficient range. The responsiveness of the Pakistani rupee to US-dollar to the amount of each day COVID-19 tests can be examined. Figure 6 is the IR function of the Pakistani rupee against the US-dollar to the amount of daily COVID-19 tests. One standard error stunning from the COVID-19 daily tests of the Pakistani Rupee US-dollar immediately have significant impacts, declines between 1 and 3 days in the negative zone and then steadily rises to 4th day in the positive zone and these variations persist until the 10th day means that the graph shows no stability. As a result, variations to the COVID-19 daily tests would have a long-term effect on Pakistan's rupee against the US-dollar.
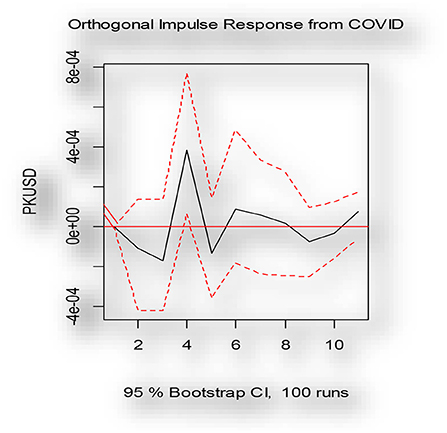
Figure 6. Impulse response function.
The number of daily COVID-19 tests has comparatively influenced Pakistan's rupee against the US-dollar exchange rate. The findings of Variance Decomposition within the VAR context can be observed in Table 8. Consequently, on the first day, the COVID-19 daily tests influence the Pakistan rupee-dollar exchange rate is 0.55 percent. On the 2nd, 3rd, 4th, and 5th days COVID-19 daily tests influenced Pakistan's rupee-dollar exchange rate is 3.12, 3.09, 3.26, and 6.69 percent, respectively. The 6th and 7th day's shocks to the amount of daily COVID-19 tests contribute to 10.99 and 11.82 percent of the variations in Pakistan's rupee-dollar exchange rate, respectively. On the 10th day, the COVID-19 daily tests influence the Pakistan rupee-dollar exchange rate is 17.44 percent. As a result, the Variance Decomposition does not maintain stability as the no of COVID-19 daily tests increases as a result of which the percentage of variations explained in the Pakistan rupee-US dollar exchange rate also increases in the long term.
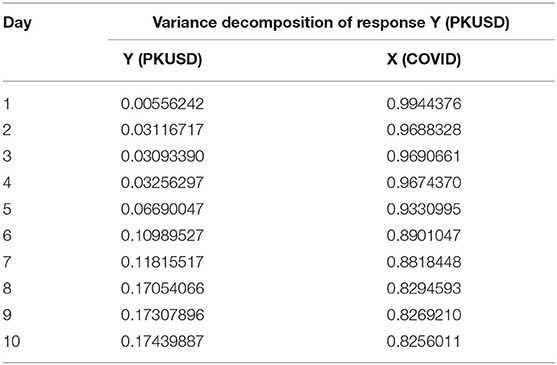
Table 8. Variance decomposition.
Table 9 shows results of the Vector Autoregressive Granger Causality test by using the F test. We already found that when the response variable is the Y (PKUSD), the assumption is rejected at the 1% significance level. It can be inferred that in Pakistan's case, the no of COVID-19 daily tests each day generates shifts in the rate of exchange of the US-dollar. Table 10 shows the summary statistics of the daily COVID-19 tests and PKUSD dollar exchange rate.
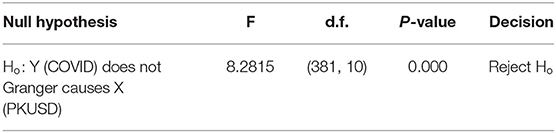
Table 9. VAR granger causality test.
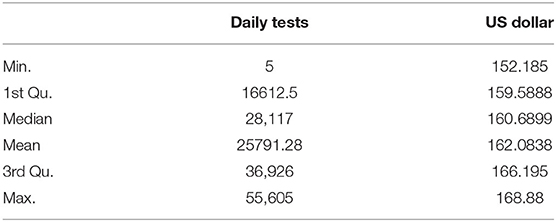
Table 10. Summary statistics of daily tests and PKUSD dollar exchange rate.
The goal of this study is to use a Vector Autoregressive (VAR) technique to investigate the primary influence of the COVID-19 daily test epidemic on the Pakistani rupee against the US dollar exchange rate. Based on the Vector Autoregressive Model, values of the lag of the explanatory variable, to explain the variation within Y (PKUSD) are significant. The Pakistani rupee to US dollar exchange rate has been influenced in the longer run by a shock positive to COVID-19 daily tests. Clearly speaking, a shock of the number of COVID-19 daily tests every day influences the rise and fall of the Impulse receiver (or response variables). We have found apparent evidence of the cause of COVID-19 daily tests to the Pakistani rupee against the US Dollar exchange rate by Granger Causality test and conclude that the COVID-19 daily tests have a significant effect on the US dollar exchange rate against the Pakistani rupee.
The datasets presented in this study can be found in online repositories. The names of the repository/repositories and accession number(s) can be found in the article/supplementary material.
All authors listed have made a substantial, direct, and intellectual contribution to the work and approved it for publication.
The authors declare that the research was conducted in the absence of any commercial or financial relationships that could be construed as a potential conflict of interest.
All claims expressed in this article are solely those of the authors and do not necessarily represent those of their affiliated organizations, or those of the publisher, the editors and the reviewers. Any product that may be evaluated in this article, or claim that may be made by its manufacturer, is not guaranteed or endorsed by the publisher.
1. McCloskey B, Zumla A, Ippolito G, Blumberg L, Arbon P, Cicero A, et al. Mass gathering events and reducing further global spread of COVID-19: a political and public health dilemma. Lancet. (2020) 395:1096. doi: 10.1016/S0140-6736(20)30681-4
2. Preiser W, Van Zyl G, Dramowski A. COVID-19: getting ahead of the epidemic curve by early implementation of social distancing. S Afr Med J. (2020) 110:12876. doi: 10.7196/SAMJ.2020.v110i4.14720
3. Klompas M. Coronavirus Disease 2019 (COVID-19): protecting hospitals from the invisible. Ann Intern Med. (2020) 172:619–20. doi: 10.7326/M20-0751
4. WHO. Laboratory Testing for Corona virus Disease 2019 (COVID-19) in Suspected Human Cases: Interim Guidance. Technical report. Geneva: WHO (2020).
5. Roser M, Ritchie, H, Ortiz-Ospina, E,. Corona virus Disease (COVID-19)-Statistics Research. Our World Data. (2020). Available online at: https://ourworldindata.org/coronavirus (accessed May 04, 2020).
6. Petherick A. Developing antibody tests for SARS-CoV-2. Lancet. (2020) 395:1101–2. doi: 10.1016/S0140-6736(20)30788-1
7. Vogel G. New blood tests for antibodies could show true scale of corona virus pandemic. Science. (2020) 19:956–63. doi: 10.1126/science.abb8028
8. Pang J, Wang MX, Ang IYH, Tan SHX, Lewis RF, Chen JIP, et al. Potential rapid diagnostics, vaccine and therapeutics for 2019 novel coronavirus (2019-nCoV): a systematic review. J Clin Med. (2020) 9:623. doi: 10.3390/jcm9030623
10. Khan Z, Muhammad K, Ahmed A, Rahman H. Coronavirus outbreaks: prevention and management recommendations. Drugs Ther Perspect. (2020) 36:215–17. doi: 10.1007/s40267-020-00717-x
11. Saqlain M, Muddasir M, Ali M, Azhar A, Tahir H, Kamran S, et al. Is Pakistan prepared to tackle the coronavirus epidemic? Drugs Ther Perspect. (2020) 36:213–14. doi: 10.1007/s40267-020-00721-1
12. National Action Plan for Corona Virus Disease (COVID-19) Pakistan. Available online at: https://www.nih.org.pk/wp-content/uploads/2020/03/COVID-19-NAP-V2-13-March-2020.pdf (accessed May 04, 2020).
13. Al Jazeera,. Coronavirus: Travel Restrictions, Border Shutdowns by Country. (2020). Available online at: https://www.aljazeera.com/news/2020/03/coronavirus-travel-restrictions-border-shutdowns-country-200318091505922.html (accessed May 04, 2020).
14. The Nation. 1,200-Bed Quarantine Facility Inaugurated at Karachi Expo Centre. (2020). Available online at: https://nation.com.pk/02-Apr-2020/1-200-bed-quarantine-facility-inaugurated-at-karachi-expo-centre (accessed May 04, 2020).
15. ARY News,. Coronavirus Patients, Suspects Break out of Sukkur Quarantine Facility. (2020). Available online at: https://arynews.tv/en/sukkur-quarantine-facility-coronavirus-suspects/ (accessed April 28, 2020).
16. Al Jazeera,. Pakistan's Spike in Coronavirus Cases Raises Quarantine Concerns. (2020). Available online at: https://www.aljazeera.com/news/2020/03/pakistan-spike-coronavirus-cases-raises-quarantine-concerns-200316090946936.html (accessed May 04, 2020).
17. News. Dealing with Covid-19 in Pakistan. (2020). Available online at: https://www.thenews.com.pk/print/629602-dealing-with-covid-19-in-pakistan (accessed 4 2020).
18. Int News,. 1,270 Corona Suspects Arriving from Iran Shifted to Multan Quarantine Centre. (2020). Available online at: https://www.thenews.com.pk/print/632265-1-270-corona-suspects-arriving-from-iran-shifted-to-multan-quarantine-centre (accessed April 28, 2020).
19. GEO News,. Police Arrest Protesting Doctors Medical Staff in Quetta. (2020). Available online at: https://www.geo.tv/latest/281256-police-arrest-protesting-doctors-and-medical-staff-in-quetta (accessed April 28, 2020).
20. Latif A,. COVID-19: Pakistan Unveils Economic Relief Package. Anadolu Agency (2020). Available online at: https://www.aa.com.tr/en/asia-pacific/covid-19-pakistan-unveils-economic-relief-package/1777961 (accessed April 28, 2020).
21. Pueyo T. Coronavirus: Why you must act now. In: Politicians, Community Leaders and Business Leaders: What Should You Do and When. (2020). Available online at: https://indico.cern.ch/event/897769/contributions/3786083/attachments/2002987/3348175/Coronavirus__Why_You_Must_Act_Now-Tomas_Pueyo-Medium.pdf
22. Shafi M, Liu J, Ren W. Impact of COVID-19 pandemic on micro, small, and medium-sized Enterprises operating in Pakistan. Res Global. (2020) 2:100018. doi: 10.1016/j.resglo.2020.100018
23. Asghar N, Batool M, Farooq F, Rehman H. COVID-19 pandemic and Pakistan economy: a preliminary survey. Rev Econ Dev Stud. (2020) 6:447–59. doi: 10.47067/reads.v6i2.222
26. Campbell JY, Ammer J. What moves the stock and bond markets? A variance decomposition for long–term asset returns. J Finanace. (1993) 48:3–37.
27. Yuliadi I. An analysis of money supply in Indonesia: Vector autoregressive (VAR) approach. J Asian Finance Econ Bus. (2020) 7:241–9. doi: 10.13106/jafeb.2020.vol7.no7.241
28. Lütkepohl H. New Introduction to Multiple Time Series Analysis. Berlin; Heidelberg: Springer (2007).
30. Nelson HL Jr, Granger C. Experience with using the Box-Cox transformation when forecasting economic time series. J Econom. (1979) 10:57–69.
32. Granger CWJ. Investigating causal relations by econometric models and cross-spectral methods. Econometrica. (1969) 37:424–38. doi: 10.2307/1912791
33. Pasquale T, Joseph K. System and Method for Providing Product Offers at a Call Center. U.S. Patent No 20060062375-A1. Washington, DC: U.S. Patent and Trademark Office (2006).
34. Leamer EE. Vector autoregressions for causal inference? Carnegie Rochester Conf Ser Public Policy. (1985) 22:255–904. doi: 10.1016/0167-2231(85)90035-1
37. Aamir M, Shabri A, Ishaq M. Improving forecasting accuracy of crude oil price using decomposition ensemble model with reconstruction of IMFs based on ARIMA model. Mal J Fund Appl Sci. (2018) 14:471–83. Available online at: https://pdfs.semanticscholar.org/fcae/ea60bc285b6b6cce8cf6cda5792d27afd726.pdf?_ga=2.47570340.2054736587.1646121442-364424936.1642743977
Keywords: COVID-19 pandemic, Pakistan rupee-US dollar exchange rate, vector autoregressive approach, Pakistan, economy
Citation: Akhtar A, Abiad M, Mashwani WK, Aamir M, Naeem M and Khan DM (2022) The Implications of COVID-19 Pandemic on Dollar Exchange Rate of Pakistan. Front. Appl. Math. Stat. 8:808489. doi: 10.3389/fams.2022.808489
Received: 03 November 2021; Accepted: 21 January 2022;
Published: 21 March 2022.
Edited by:
Jinjin Li, Shanghai Jiao Tong University, ChinaReviewed by:
Vinodhkumar Obli Rajendran, Indian Veterinary Research Institute (IVRI), IndiaCopyright © 2022 Akhtar, Abiad, Mashwani, Aamir, Naeem and Khan. This is an open-access article distributed under the terms of the Creative Commons Attribution License (CC BY). The use, distribution or reproduction in other forums is permitted, provided the original author(s) and the copyright owner(s) are credited and that the original publication in this journal is cited, in accordance with accepted academic practice. No use, distribution or reproduction is permitted which does not comply with these terms.
*Correspondence: Muhammad Aamir, YWFtaXJraGFuQGF3a3VtLmVkdS5waw==
Disclaimer: All claims expressed in this article are solely those of the authors and do not necessarily represent those of their affiliated organizations, or those of the publisher, the editors and the reviewers. Any product that may be evaluated in this article or claim that may be made by its manufacturer is not guaranteed or endorsed by the publisher.
Research integrity at Frontiers
Learn more about the work of our research integrity team to safeguard the quality of each article we publish.