 Antonio N. Bojanic
- Economics Department, Tulane University, New Orleans, LA, United States
Utilizing a panel data set for OECD and non-OECD countries for the period 1980–2016, I analyze the effects on corruption of interacting different forms of decentralization—fiscal, administrative, political, and overall decentralization—with an indicator of income inequality. The findings demonstrate that fiscal, administrative, and overall decentralization by themselves are not conducive to lowering corruption, but when moderated by the Gini index, corruption levels decrease in all countries. Moreover, as income inequality decreases, the impact of these forms of decentralization in lowering corruption increases, highlighting that decentralization can be an effective tool in combating corruption particularly when income inequality improves. The findings also demonstrate that in non-OECD countries, decentralization is an important tool to fight corruption up to high levels of inequality, proving that decentralization in developing countries is essential even when issues of income distribution have not been fully solved.
1. Introduction
Corruption has been at the forefront of the debate concerning the impact it has on the development of a country. Though some studies argue that under certain conditions corruption can accelerate growth (e.g., [1]), most conclude that it is an impediment and must be defeated to achieve higher levels of development (e.g., [2]). The analysis of the causes and consequences of corruption has a long tradition in the economics literature but does not provide conclusive evidence on either what causes it or on how to fight it.
Decentralization has also been at the front line of the debate regarding its impact on development. During the last decades, there has been a significant trend toward greater decentralization of government activities throughout the developing world1; in developed nations, decentralized structures are ubiquitous. The arguments for decentralization are many: it is a way to bring government closer to the people; it allows subnational governments to attend to the specific demands of each region; it generates greater efficiency through the inter-jurisdictional competition incentivized by the decentralization process, and it helps in improving governance indicators, including by aiding in reducing corruption levels. The arguments against decentralization are also many: particularly in developing nations, subnational governments may not have the institutional capacity to deliver on the provision of public goods and services; the process may generate a race-to-the-bottom dilemma, whereby subnational governments end up with lower revenue and less than optimal regulations in their desire to outperform other jurisdictions, and decentralization might not be a driver for improved governance, nor serve as an instrument to lower corruption levels.
The principal motivation of this study is to understand how corruption may be abated by effective government policy. To that end, the objective is to analyze how corruption is affected by the interaction of decentralization and income inequality. The assumption is that decentralization, along with improvements in income distribution, may help in abating corruption. Though several studies have analyzed how, individually, decentralization and income inequality affect corruption, to my knowledge no previous work analyzes how the interaction between them impacts corruption levels.
A summary of principal findings is this: fiscal decentralization by itself is not conducive to lower corruption, either in developed or developing countries. When fiscal decentralization indicators interact with the Gini index, however, corruption levels in all countries decrease, though the positive impact of decentralization on the expenditure side is stronger than on the revenue side. The findings for administrative decentralization are similar; by itself, it does not seem to be a driver for lower corruption, but when interacted with the Gini index it causes corruption levels to decrease, particularly in developing countries. The empirical findings of political decentralization are mixed. Overall, tying the Gini index to political decentralization seems to have a positive impact on corruption only under certain circumstances.
The rest of the paper is organized as follows: Section two presents a brief review of the literature. Section three analyzes the conceptual framework; Section four introduces the data and its sources; the methodology is described in Section five; Section six presents the empirical results, and Section seven concludes.
2. Literature review
Martinez-Vazquez et al. [4] provide a thorough survey of the impact of fiscal decentralization on a broad range of socioeconomic variables. Shah argues that decentralized fiscal structures are more suitable in developing countries than centralized structures when certain key institutions are working properly [5]. On the specific relationship between decentralization and income inequality, some studies conclude that decentralization lowers inequality. Representative works are Arze del Granado et al. [6], Rodríguez-Pose and Ezcurra [7], Sepulveda and Martinez-Vazquez [8], Tselios et al. [9], and Bojanic and Collins [10]. Others show that inequality worsens with greater decentralization, with Prud'homme [11], Peterson [12], Neyapti [13], and Sacchi and Salotti [14] being a sample of works in this regard.
There is no general agreement concerning the relationship between decentralization and corruption. Some studies—e.g., Weingast [15], Seabright [16], Lockwood [17], Weingast [18], Arikan [19], Fisman and Gatti [20], Ivanyna and Shah [21], Altunbas and Thornton [22], and Pavodano et al. [23]—find that decentralization lowers corruption, while others argue the opposite, including Tanzi [24], Prud'homme [11], Shleifer and Vishny [25], Rodden and Rose-Ackerman [26], Litvack et al. [27], Bardhan and Mookherjee [28], Fan et al. [29], and Nelson [30].
Concerning income inequality and corruption, most of the literature focuses on how the latter affects the former. Since the object here is corruption, the emphasis is on the handful of articles that analyze the impact of income inequality on corruption, including Meltzer and Richard [31], Glaeser et al. [32], Kaufman and Vicente [33], You and Khagram [34], Uslaner and Rothstein [35], Uslaner [36], and Fried et al. [37]. As with the relationship between corruption and other variables, there is no general consensus regarding how income inequality affects corruption, but most of the literature seems to indicate that greater inequality fosters greater corruption.
As the preceding summary of the literature makes clear, the individual impact of decentralization and income inequality on corruption has been tested in a variety of settings and for different cross-sections of countries. The empirical findings in all these studies are not consistent; in some, decentralization—mostly fiscal decentralization—lowers corruption; in others the opposite is true. Likewise, greater income inequality is found to be mostly associated with greater levels of corruption, but some authors find evidence contrary to this finding. The lack of consistency in results indicates that there is much to be learned regarding how decentralization and income inequality affect corruption. An important contribution of this study is to argue that decentralization and inequality should be analyzed together when trying to understand how they affect corruption levels in a country. To my knowledge, no other study accomplishes this, namely, to analyze the impact on corruption of decentralization interacted with income inequality for both developed and developing countries. Though the findings here are not entirely conclusive, they do add another dimension to our understanding of corruption and how it may be confronted by government policies that aim at greater decentralization and more equal societies.
3. Conceptual framework
As argued by several authors (e.g., [18, 38, 39]), not all forms of decentralization are likely to improve welfare. If a decentralization regime fails to allocate sufficient authority—fiscal, administrative, and political—to subnational levels of government; is unable to enforce a common market that allows for factor and product mobility, and does not include hard budget constraints, then decentralization is unlikely to deliver on its promise to decrease corruption and improve other indicators of governance. Below is a summary of the interactions between decentralization and income inequality; decentralization and corruption; inequality and corruption, and the argument made here, that tying decentralization with income redistribution policies might make a decentralization regime more effective in reducing corruption levels.
3.1. Decentralization and income inequality
As laid out by Musgrave [40] and Oates [3, 41, 42], the traditional theory of fiscal federalism describes a general normative framework for the assignment of functions to different layers of government and the appropriate fiscal instruments for carrying out these functions. The theory contends that the central government should have responsibilities over the managing of the macroeconomy and income redistribution policies. Concerning the latter, the argument is that subnational levels of government might not be properly suited to effectively carry out income redistribution policies since the mobility of both low and high-income households will result in decentralization policies that provide too little assistance to the poor—the “race to the bottom” argument. According to this traditional theory, decentralized levels of government should focus on providing public goods whose consumption is limited primarily to their constituents.2
Notwithstanding the precepts of the traditional theory of fiscal federalism, decentralization can indirectly affect income distribution in a variety of ways: through its impact on economic growth, the quality of governance, the degree of institutional development, and the size of government intervention in the economy. The ultimate impact depends on the specific characteristics of each decentralization process. Decentralization may cause income inequality to decrease if it leads to an increase in welfare-enhancing programs that serve the poor and most vulnerable, or, as affirmed in traditional fiscal federalism theory, it may increase it. If one is to believe that participatory local governments are generally better informed about the needs and preferences of the local population than the central government; if monitoring and control of local agents by local communities is easier; if elected local governments are more accountable and responsive to poor people and better at involving the poor in the political process, then decision making at the local level may reduce income inequality. On the other hand, if subnational governments are captured by local elites; interjurisdictional competition leads to a “race to the bottom” paradox, and subnational governments lack the institutional capacity to administer pro-poor programs, decentralization will lead to greater income inequality.
3.2. Decentralization and corruption
Decentralization may affect government performance through its effect on corruption. From a theoretical perspective, decentralization may help in reducing corruption because it creates enhanced accountability and competition among local governments; it offers additional “exit” and “voice” mechanisms, and higher levels of information and transparency at the local level. On the other hand, decentralization may theoretically weaken monitoring controls and audits by central agencies, thereby creating opportunities for corruption. A decentralized government structure produces a proliferation of agents that manage a wide range of local revenues and expenditures; local politicians may have little fear of being caught and punished for adopting rent-seeking practices. Furthermore, they are likely to be more subject to pressing demands from local interest groups, thus incentivizing corruption. From this perspective, political decentralization may favor a higher incidence of corruption through the involvement of a larger number of officials in dealing with potential investors like feudal lords and oligarchs; a higher incidence of clientelism (by protecting and benefitting political supporters), and interest-group capture where elites dominate the local political scene.
The assumption made here is that decentralization by itself may not be conducive to lower levels of corruption. In fact, decentralization may be a driver for greater corruption, particularly in developing countries where subnational levels of government often lack sufficient institutional capacity—human, financial, and technical capacity—to carry out the tasks required in effective decentralization regimes.
3.3. Inequality and corruption
Though it is usually assumed that corruption is a driving force for income inequality, research suggests—e.g., You and Khagram [34] and Uslaner and Rothstein [35]—that in certain circumstances inequality might be a determinant of corruption. Increasing income inequality may, for instance, generate incentives for the design and implementation of income redistribution programs that may affect the interests of entrenched elites. Confronted by these redistribution policies, these elites may act in ways to acquire greater political influence, which may increase corrupt behavior. The alternative is that in countries with low-income inequality different groups may simply not have the incentive to engage in corrupt behavior because the lack of income inequality ensures that there is little to be gained by corrupt behavior. In other words, the absence of high inequality may promote virtuous behavior in the sense that the incentives for corrupt behavior are not as significant when there is little income difference among all groups. The assumption, then, is that high-income inequality may increase the incentives for greater corruption.
3.4. Tying decentralization and income redistribution policies to fight corruption
The preceding analysis suggests that decentralization may not be sufficient to lower corruption. It may increase it if the institutional framework of a country is weak and underdeveloped. Likewise, the empirical evidence suggests that income inequality is (most likely) positively correlated with corruption and that decentralization, by its very nature, is likely to impact income distribution. If in fact decentralization, income inequality, and corruption are all interconnected, it follows that a plausible way to deter corruption is by tying decentralization and income redistribution policies. The argument made in this study is that in addition to establishing the appropriate conditions for an effective and well-functioning decentralization structure, decentralization is more likely to deter corruption if it is coupled with government policies that improve income distribution. In other words, decentralization by itself may not be conducive to lower corruption, especially in developing countries, but if it is tied to policies that aim at a fairer distribution of income, decentralization may indeed be an effective tool against corruption.
4. Data
The variables utilized are standard and consistent with those found in the corruption literature. Below, the principal indicators of corruption utilized in this study are defined, as well as the decentralization variables, the income inequality indicator, and the various control variables used in the analysis.
4.1. Corruption
The outcome of interest is corruption and the principal indicator is the Corruption Perceptions Index (CPI) produced by Transparency International.3 It ranges from 0 to 100, where 0 represents a “highly corrupt country” and 100 reflects a “very clean country.” The CPI scores and ranks countries/territories based on how corrupt a country's public sector is perceived to be by experts and business executives. It is a composite index, a combination of 13 surveys and assessments of corruption, collected by a variety of institutions. The CPI is widely utilized in the economics literature as an indicator of government corruption. Two alternative corruption indices are also utilized to test the robustness of the main findings. The first one is the Corruption Index (ICRG) produced by the PRS Group.4 It ranges from 0 to 6, where 0 represents “highest possible level of corruption” and 6 reflects “lowest possible level of corruption.” It is an indicator of corruption within the political system and captures the type of corrupt behavior that arises when investors—ICRG is mainly concerned with foreign investors—are faced with demands for special payments and bribes connected with import and export licenses, exchange rate controls, tax assessments, police protection, and access to loans; it also captures actual or potential corruption in the form of excessive patronage, nepotism, job reservations, “favor-for- favors,” secret party funding, and suspiciously close ties between politics and business. The index is calculated by ICRG staff based on subjective analysis of available information.
The second alternative indicator is the Control of Corruption indicator produced by Daniel Kaufmann and Aart Kraay and published by the World Bank.5 It ranges from −2.5 to +2.5, where −2.5 represents “weak government performance” in controlling corruption and +2.5 reflects “strong government performance.” It reflects perceptions of the extent to which public power is exercised for private gain, including both petty and grand forms of corruption, as well as the capture of the state by elites and private interests. This indicator combines the views of a large number of enterprise, citizen, and expert survey respondents in developed and developing countries; it is based on large individual data sources produced by a variety of survey institutes, think tanks, non-governmental organizations, international organizations, and private sector firms.
4.2. Decentralization
Schneider's [45] work is followed to distinguish three dimensions of decentralization: fiscal, administrative, and political. Additionally, the Regional Authority Index (RAI) is employed as an aggregate indicator of decentralization.6 Two fiscal decentralization indicators are utilized: the ratio of subnational government expenditures to general expenditures (subnational expenditures) and the ratio of subnational government revenues to general government revenues (subnational revenues), both expressed in percentage terms.7 One administrative decentralization indicator is employed, the ratio of subnational taxation to subnational grants and revenues (subnational taxation), also expressed in percentage terms.8 Political decentralization is measured by two indicators: municipal elections9 (municipal governments locally elected) and municipal and state elections10 (municipal and state/province governments locally elected).11
All decentralization indicators utilized in this study are imperfect and may not fully capture the extent of decentralization in a country. For instance, none of the fiscal or administrative decentralization indicators reflect the extent of autonomy that subnational governments have in deciding over tax and expenditure decisions. It may still be the case that subnational governments are simply executing decisions made elsewhere. Likewise, the political decentralization indicators do not reflect whether the candidates that are running for executive or legislative positions at various subnational levels were influenced by officials at the national level. The RAI index, which encompasses all fiscal, administrative, and political aspects of the various decentralization indicators utilized here, is subject to the same qualification, namely that it may not truly reflect the extent of decentralization in a country. The principal implication is that the results obtained hinge on the strength and limitations of these decentralization indicators.
4.3. Income inequality
The Gini index, widely utilized in the economics literature, is the indicator of income inequality utilized in this study. It measures the degree of inequality in the distribution of family income in a country; in its intrinsic nature, it ranges from 0 to 1, where 0 represents perfect equality and 1 represents perfect inequality. Here, and to aid in interpretation, the index has been re-scaled to 0–100.
4.4. Control variables
The same control variables (Xit) are included in all specifications and reflect the standard variables found in the corruption literature. First, GDP per capita measured in international US Dollars (GDP per capita at PPP),12 expressed in logs,13 is included to account for the extent of economic growth on corruption. The expectation is that higher income per capita is conducive to lower corruption (e.g., [46, 47]), particularly in countries with strong institutions and clear property rights; trade openness (openness to international trade)—expressed as the ratio of total merchandise trade (exports + imports) on GDP14 - measures the extent to which an open (or closed) economy affects corruption. As several studies have shown (e.g., [48, 49]), greater levels of openness and trade are likely to reduce the levels of corruption, though there is some evidence (e.g., [50]) that the results may hinge on whether the relationship between openness and corruption is monotonic or non-monotonic in nature; the impact of education (human capital index)15 is also included to test whether, as argued by Glaeser and Saks [51], societies with higher levels of education are less tolerant of corruption. Though this relationship has not been tested extensively, the hypothesis is that higher levels of education should be correlated with lower corruption; population (population)16 is included to account for the impact of the size of a country on corruption levels. Notwithstanding that several empirical studies—e.g., Fisman and Gatti [20] and Treisman [38]—have found that population is a key determinant of corruption, others, including Elbahnasawy and Revier [52], have noted that it is an unimportant factor in explaining it; freedom of expression and association (civil liberties index)17 is included and the expectation is that civil participation, in the form of democracy, can combat corruption, as evidenced in Treisman [38] and Bhattacharyya and Hodler [53]; the role of women (proportion of seats held by women in national parliaments)18 is also tested as it has been argued that women are less inclined to engage in corrupt behavior. The empirical evidence—e.g., Dollar et al. [54] and Swamy et al. [55]—seems to support this observation; government fragmentation (level of fragmentation)19 is also included though the empirical evidence on how it affects corruption—see, for instance, Fiorino et al. [56]—is inconclusive; the size of government (government expenditures as a share of GDP)20 is added to capture the impact of government intervention on corruption. The empirical evidence on this relationship is mixed, with some studies showing that larger governments increase corruption (e.g., [57]) while others find the opposite result (e.g., [58]). The ultimate results may hinge on the level of development and quality of democracy of different countries; high levels of economic freedom (freedom index),21 or the freedom to choose how to produce, sell, and use your resources, has been associated with lower levels of corruption—e.g., Saha et al. [59]—and this hypothesis is tested as well; religion (religion) [60] may also play a role in affecting corruption. Specifically, the available empirical evidence finds that countries with a protestant background are associated with lower levels of corruption (e.g., [38]); a democratic system (quality of democracy)22 should, in theory, produce lower levels of corruption. In a democracy, individuals must be re-elected, and it thus follows that if there are regular and fair elections, there should be a lower level of corruption due to increased accountability. Though this assumption has not been tested extensively, it is empirically true in a few studies, including Sandholtz and Koetzle [61]; finally, it has been argued that the kind of legal code (type of legal system) [60] in a country will affect the quality of the government, which in turn affects the level of corruption. The assumption confirmed in Treisman [38] and Goel and Nelson [58], is that countries with common law systems exhibit lower levels of corruption.
Table 1 reports basic descriptive statistics for all variables included in the analysis presented here.
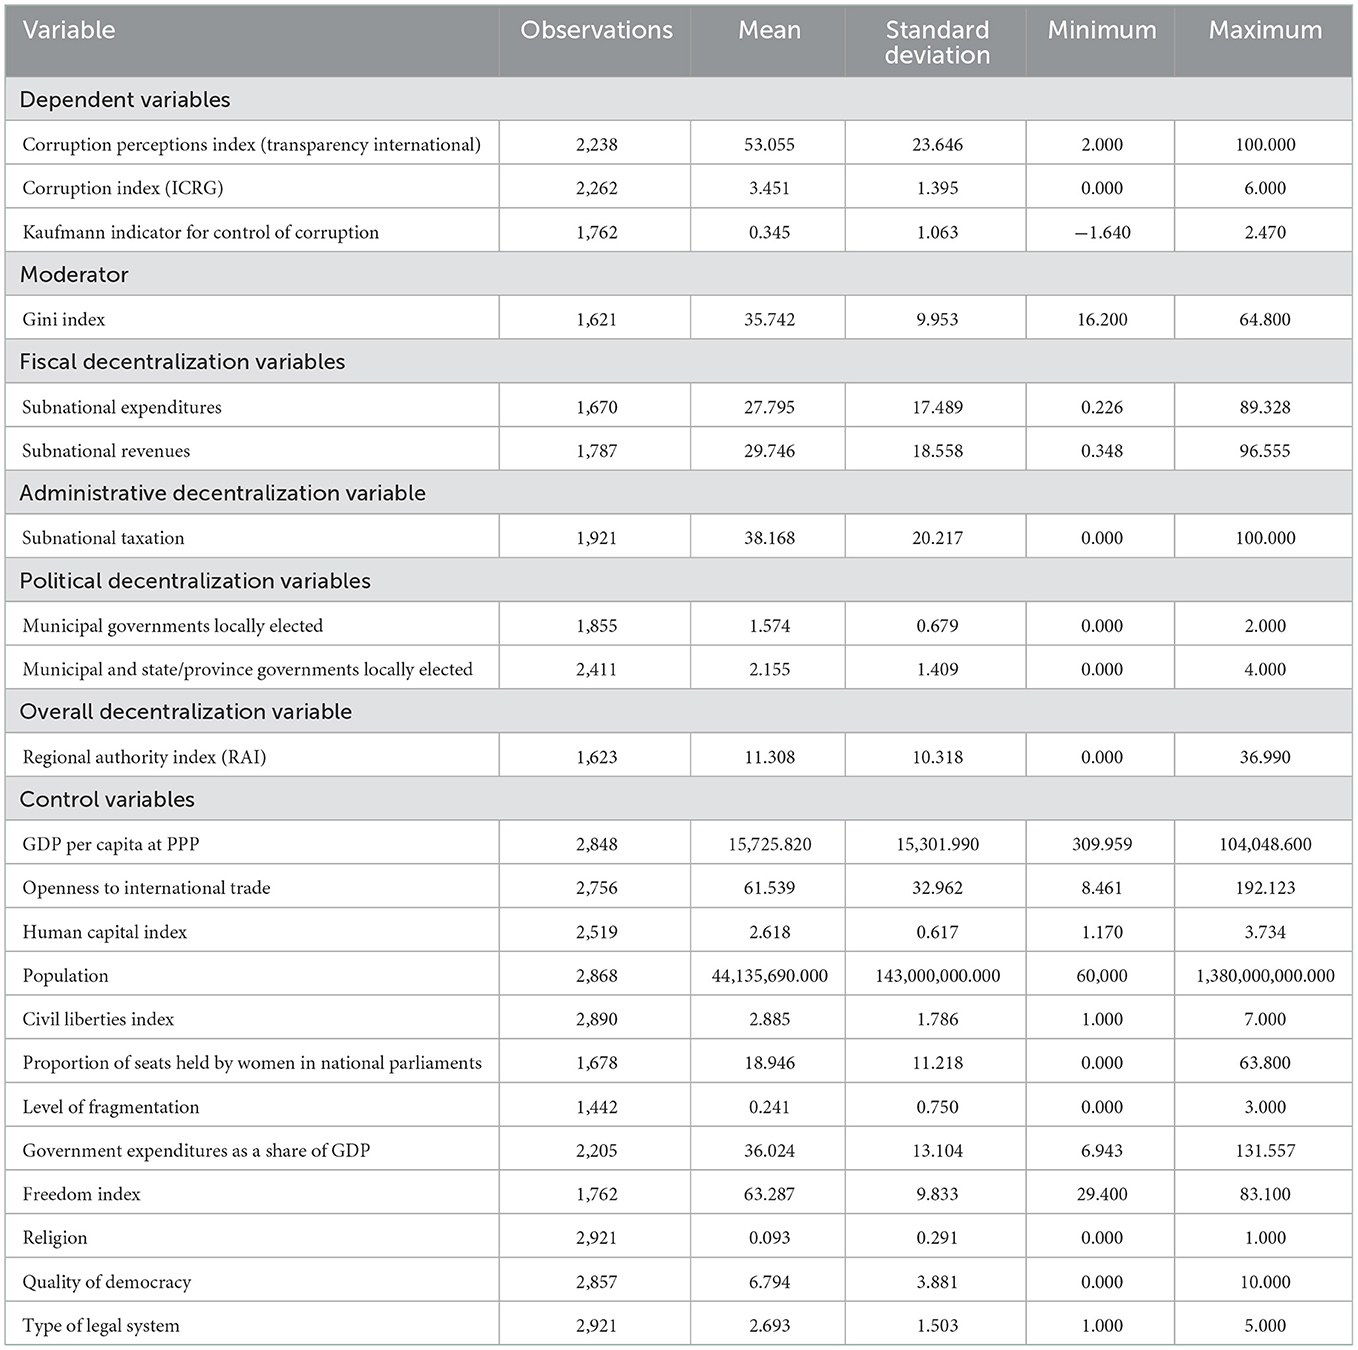
Table 1. Descriptive statistics.
5. Methodology
Utilizing a panel data set, I analyze how fiscal, administrative, and political decentralization—all interacted with the inverse Gini index—affect corruption using a sample of 84 countries over the period 1980–2016.23 I test whether the marginal effect of a given dimension of decentralization is contingent on the level of income inequality and the degree of decentralization in other dimensions. As evidenced in Baltagi [62], Wooldridge [63], and Hsiao [64], the utilization of panel data minimizes the potential for omitted variable bias, increases degrees of freedom, and improves the accuracy of estimates. The model specification is based on the conceptual framework described in Section 3 and on previous empirical work. The multiplicative interaction model with period fixed effects is reflected in the following equation24:
where corruption indexit represents the within-country corruption indicator for country i at time t; Giniit is an indicator of income inequality and it has been inverted so that increases in the ratio 1/Gini reflect a reduction in income inequality; decit is a vector of decentralization indicators (fiscal, administrative, and political); Xit is a vector of time-varying, country-specific characteristics that are included in every regression as control variables; τi is a vector of dummy variables that control for period-specific effects (period fixed effects)25; and εit is a stochastic error term.
To test whether the relationship between corruption and decentralization is contingent on the level of income inequality, interactions between decentralization and the inverse Gini index are included. These interactions are captured in the term decit (1/Gini)it; its coefficient measures the degree to which decentralization is moderated by income inequality. The expectation is that as income inequality improves (worsens), decentralization becomes more (less) effective in reducing corruption. To test this hypothesis, marginal effects for each dimension of decentralization at different values of the Gini index are estimated to determine the point at which income inequality renders decentralization futile in helping to reduce corruption levels.
In line with Bojanic and Collins [10], in addition to testing whether decentralization in one dimension is moderated by the inverse Gini index, dual and tripartite decentralization are also tested. To do so, additional specifications that include all possible two-way and three-way interactions among fiscal, administrative, and political decentralization indicators, all moderated by the inverse Gini index, are estimated. To assess whether there are differences in how decentralization affects corruption, each specification is estimated for the full sample of countries, for OECD nations, and non-OECD countries.
All relevant variables were tested for the presence of unit roots and in all cases, the null hypothesis of non-stationarity was rejected.26 In addition to providing further evidence supporting the utilization of fixed effects, the absence of unit roots clears the possibility of persistence in the dependent variable—i.e., the various corruption indices utilized here—in all decentralization indicators, and the Gini index. Additionally, in line with Arellano [65] and Wooldridge [63], the standard errors in all specifications were estimated using the cross-section SUR method to allow for contemporaneous correlation between cross-sections (clustering by period) while restricting residuals in different periods to be uncorrelated. This estimator is robust to cross-equation (contemporaneous) correlation and heteroskedasticity.27 Finally and to address the issue of endogeneity, two-stage least squares (TSLS) were utilized to estimate equation (1).28 The combination of cross-section SUR and instrumental variables estimation permits the utilization of a Generalized Instrumental Variables estimator in which both the data and the instruments are transformed using the estimated covariances. As noted by Chesher and Rosen [66], an advantage of this approach is that it allows for unobservables to be multivariate and to enter non-separably into the determination of endogenous variables, thereby removing strong practical limitations on the role of unobserved heterogeneity.
6. Empirical results
The baseline empirical analysis tests the impact of decentralization on corruption without the moderating influence of the Gini index. Table 2 presents these results for the full sample of countries as well as separately for OECD and non-OECD countries.
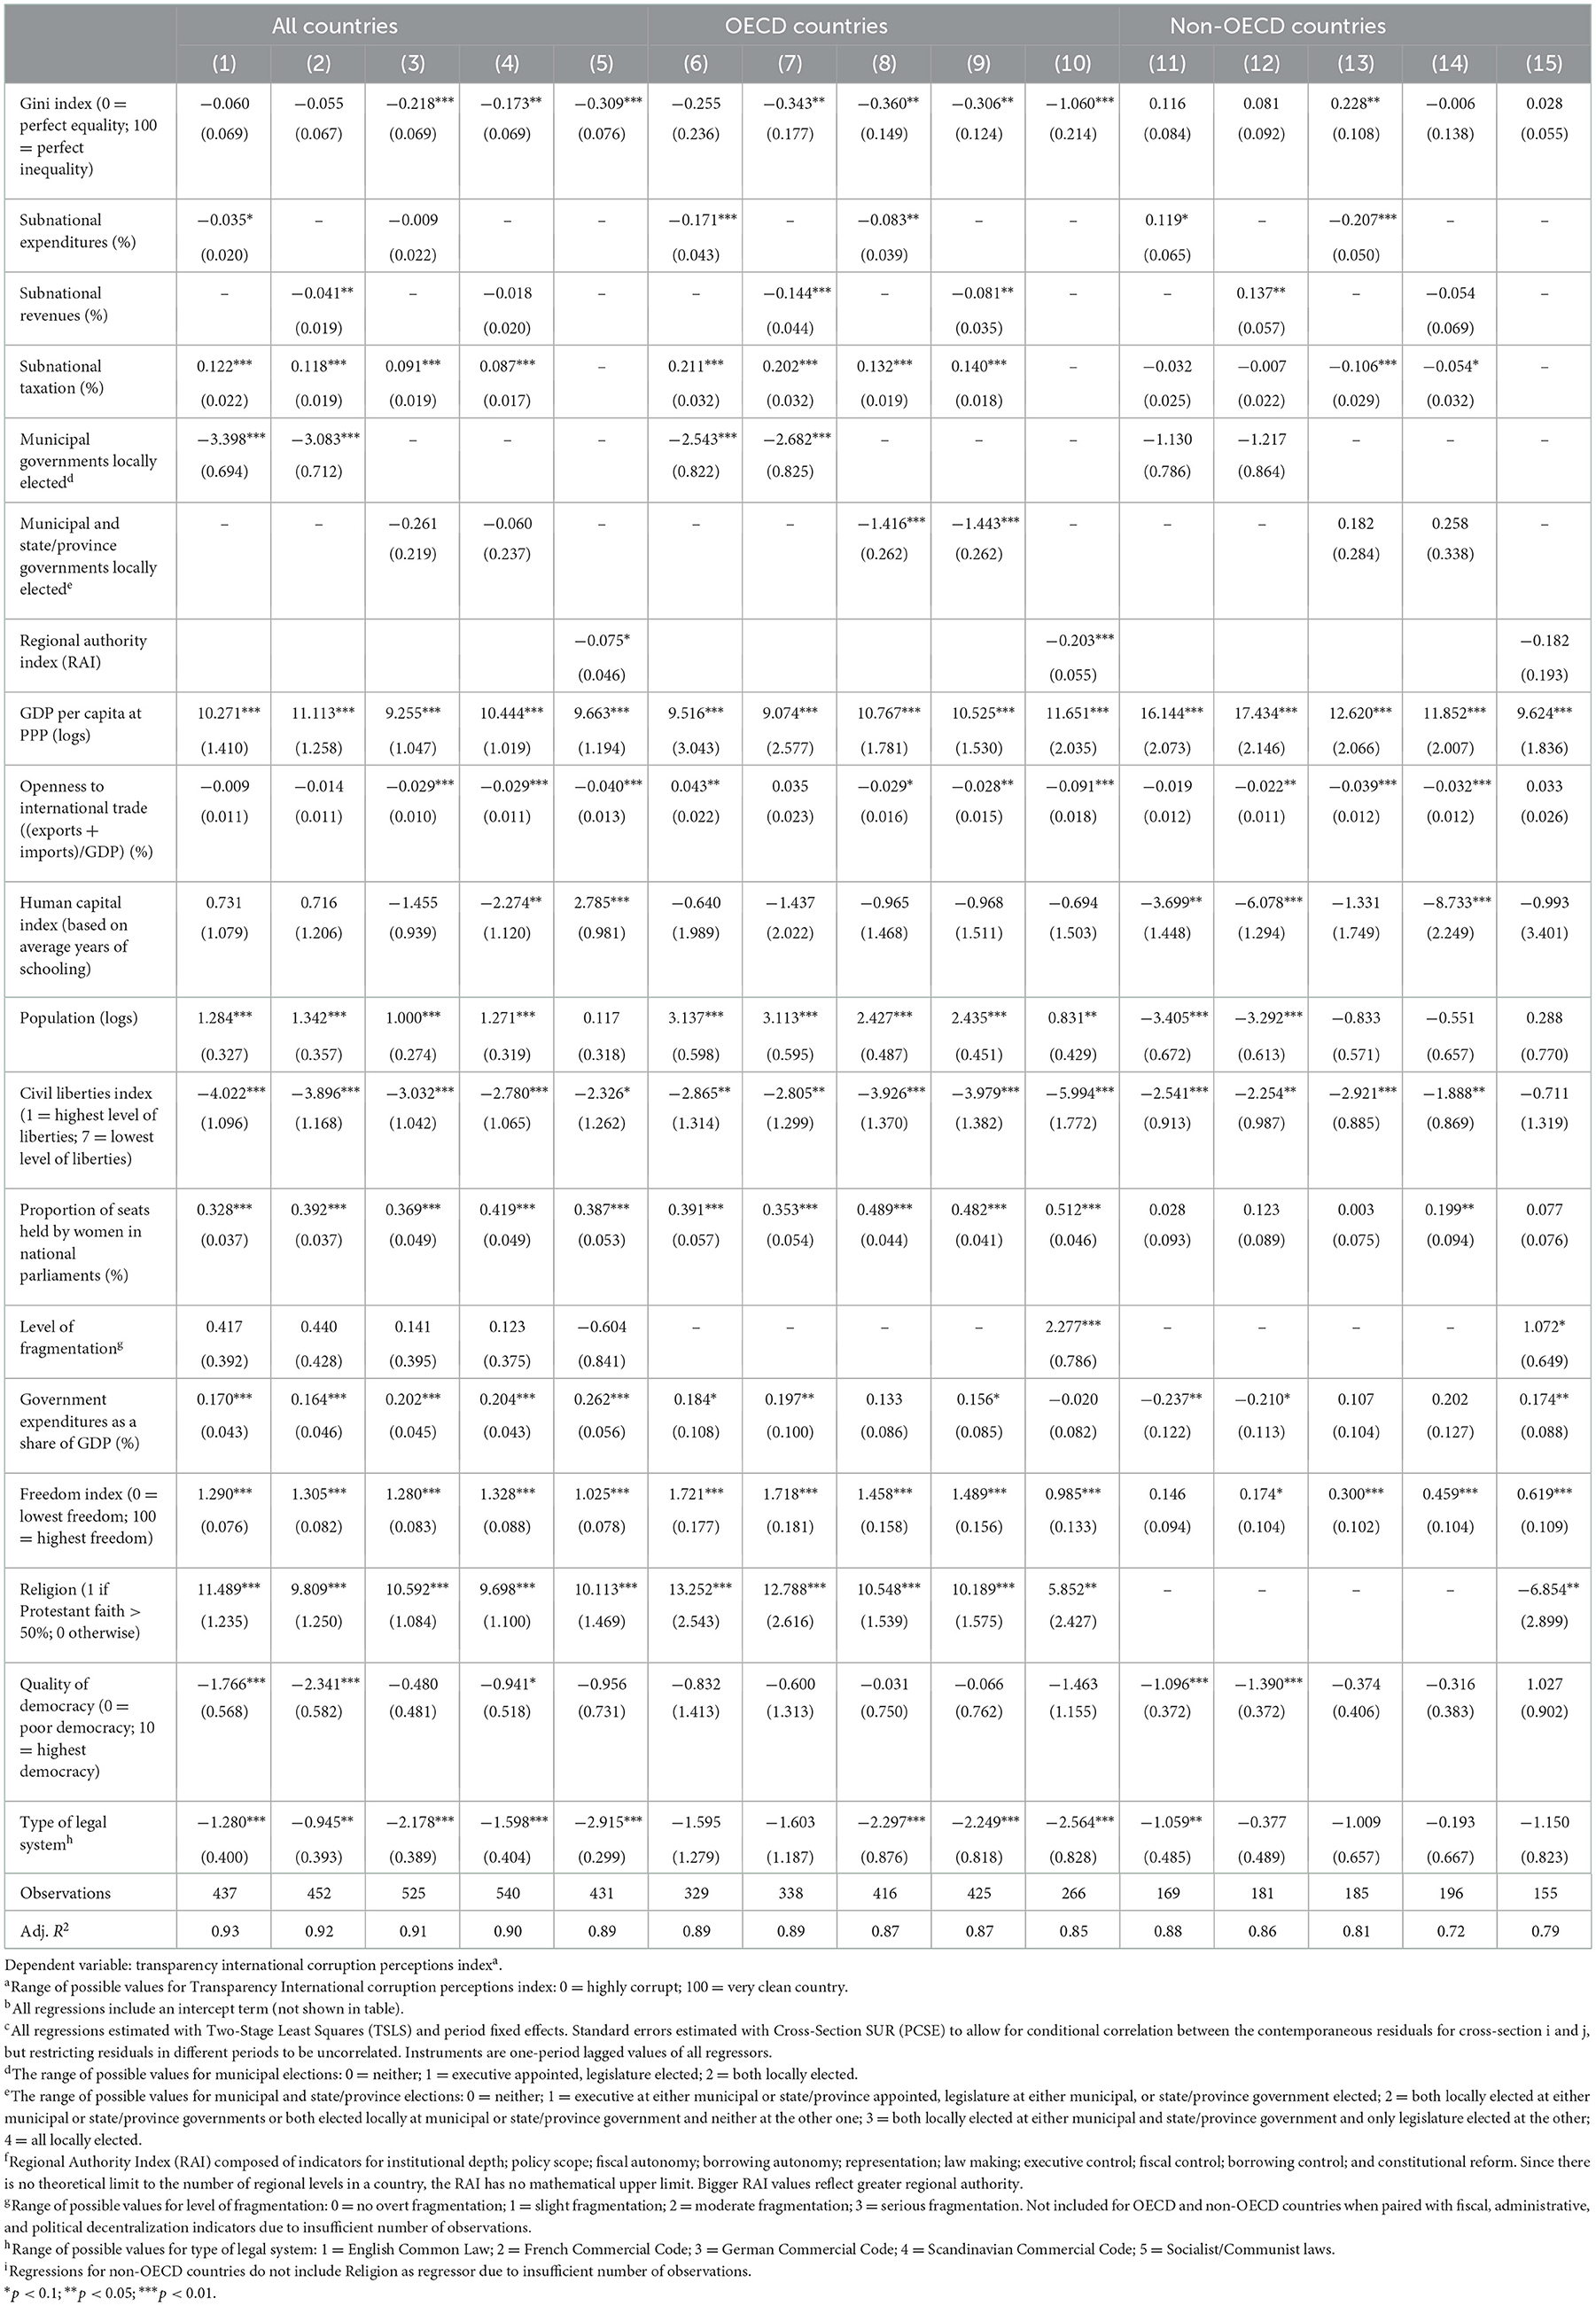
Table 2. Decentralization and corruption.
Based on the results in Table 2, greater income inequality seems to be a driver for higher corruption, though for non-OECD nations, there is some evidence (specification 13 in Table 2) that greater income inequality lowers corruption. Likewise, the impact of decentralization—fiscal, administrative, political, and overall decentralization, as reflected in the RAI index—on corruption is not entirely clear. Fiscal decentralization indicators seem to have a negative effect on the dependent variable—i.e., increase corruption—for the full sample of countries and OECD nations, as reflected in negative and (mostly) statistically significant coefficients for subnational expenditures and subnational revenues. For non-OECD countries, however, the results are uncertain as the coefficients for these indicators titubate between exerting a positive and negative influence on corruption. Subnational taxation, the administrative decentralization indicator, seems to have a positive impact on corruption—i.e., lower corruption—for the full sample of countries and OECD nations, but the opposite result for non-OECD countries. The political decentralization indicators—municipal governments locally elected and municipal and state/province governments locally elected—show a negative impact on corruption for the full sample of countries and OECD nations,29 and their impact on non-OECD countries is statistically insignificant. The RAI index seems to increase corruption in both the full and OECD samples, but it exerts an insignificant impact in non-OECD nations.
The impact of the control variables is, for the most part, what would be expected: higher income per capita, freedom of expression and association, greater participation of women in politics, economic freedom, a protestant faith,30 and having a legal system based on English common law seem to be drivers for lower corruption levels. For the full sample of countries and OECD nations, larger participation of government in the economy seems to reduce corruption levels, but the impact of this variable on non-OECD nations is ambiguous. The impact of trade openness, education, the size of a country, the level of fragmentation, and the quality of democracy, on the other hand, are less clear, as these variables either run counter to expectations or exhibit fluctuating impact on the dependent variable within each subsample of countries.
Overall, variations of the baseline specification reveal mixed results regarding the impact of the Gini index and decentralization on corruption. In some cases, the results indicate that greater income inequality increases corruption; in others, the opposite seems to be true. Likewise, decentralization is shown to be an instrument for reducing corruption levels in certain cases, but in others, it worsens corruption (i.e., it increases corruption levels) or has no effect at all. These mixed results may reflect complexities in the decentralization–income inequality-corruption relationship and could be, in part, due to the non-linearities described in Section 3. Below, I test the conditional hypotheses that greater decentralization in a given dimension affects corruption differently depending on a country's degree of income inequality as well as on the level of decentralization in other dimensions.
6.1. Simple interactions between decentralization and the Gini index
Table 3 reports the impact of decentralization on corruption when the different indicators of decentralization interact with the inverse Gini index. These specifications test the main hypothesis that the degree of income inequality moderates the decentralization–corruption relationship, with statistically significant coefficients on interaction terms lending support for the hypothesis. The secondary hypothesis that, as income inequality improves (i.e., the inverse Gini index increases), the positive impact of decentralization on corruption increases would be supported by a combination of statistically significant negative coefficients on decentralization variables and positive coefficients on associated interaction terms, with the relative magnitude of these coefficients determining whether further decentralization eventually increases (decreases) corruption levels as income inequality worsens (improves).
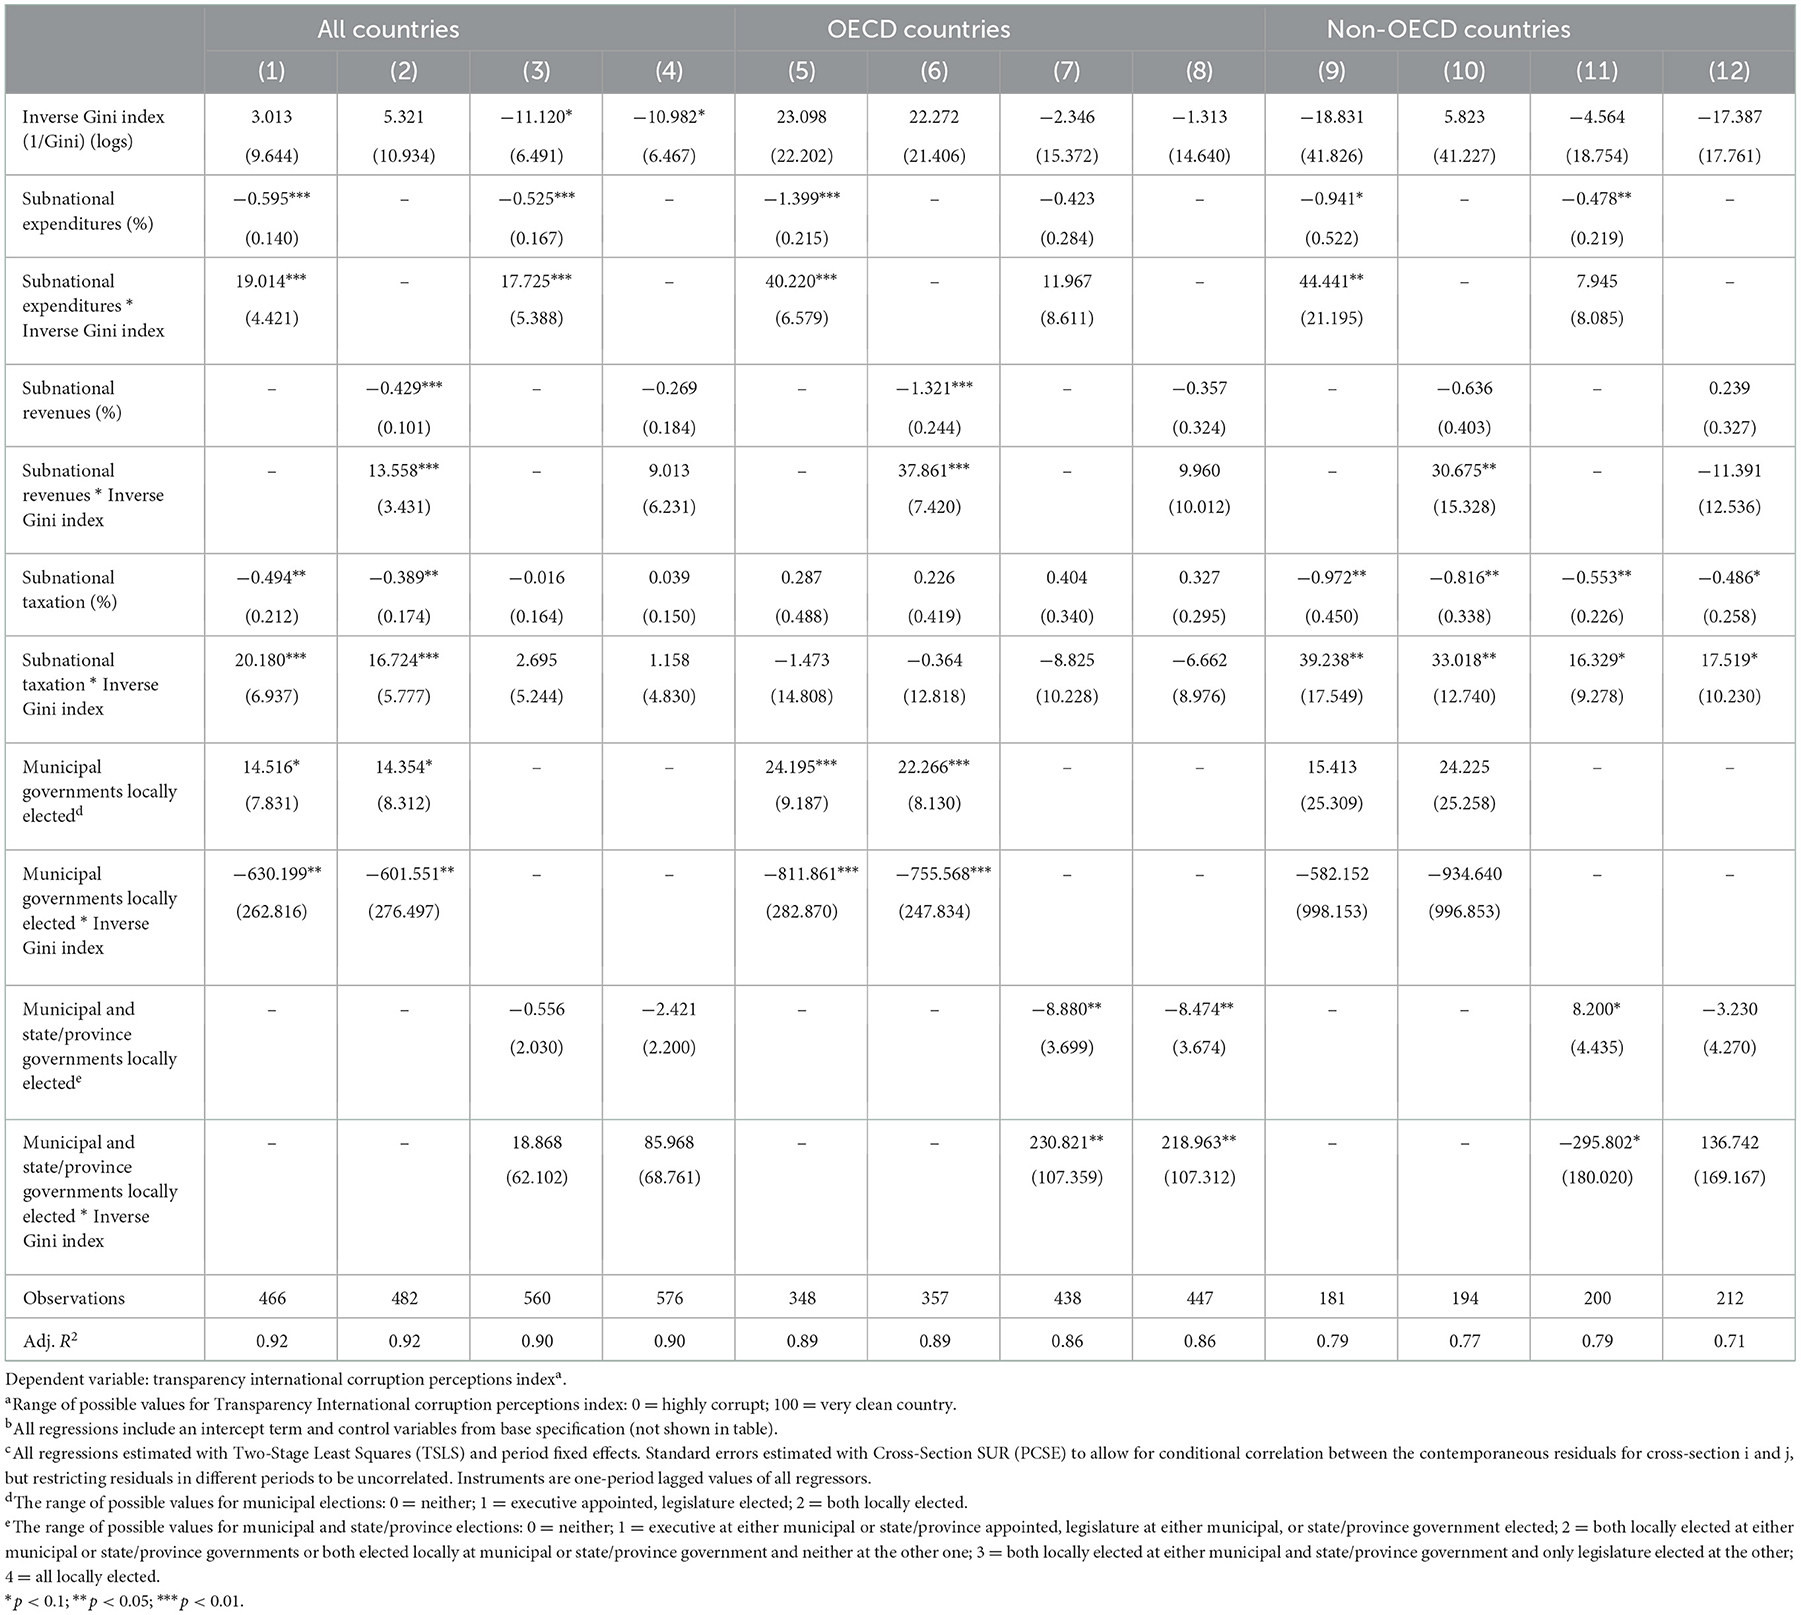
Table 3. Corruption and decentralization moderated by an indicator of income inequality (Gini index).
The results show that this is indeed the case for fiscal and, to some extent, administrative decentralization. As expected, subnational expenditures—one of the fiscal decentralization indicators—is consistently negative and statistically significant,31 denoting that as expenditures at the subnational level increase, the level of corruption increases. For illustrative purposes and focusing on specification [1] in the full sample of countries, a 1-percent increase in subnational expenditures, holding all the other regressors constant, increases corruption levels by ~0.6 points.32 When this indicator interacts with the inverse Gini index, however, the coefficient on interaction terms for all groups of countries is positive and (mostly) statistically significant, implying that as the Gini index decreases and hence there is an improvement in income distribution, corruption levels decrease.33 Similar results are found with subnational revenues, though the findings are less clear as the impact of this indicator and its interaction term with the inverse Gini index is insignificant in certain cases and inconclusive for non-OECD nations.
Administrative decentralization exerts the expected negative effect on corruption in non-OECD nations, as reflected in negative and statistically significant coefficients for subnational taxation in specifications [11] through [14]34; when subnational taxation interacts with the inverse Gini index, however, there is significant evidence that administrative decentralization coupled with improvements in income inequality can play a role in reducing corruption levels in this group of nations, as reflected in consistently positive and statistically significant coefficients for the interactive term in the same specifications.
With political decentralization, the results are less clear. With one indicator—municipal governments locally elected—greater decentralization is associated with lower corruption levels in the full set of countries and OECD nations35; in interaction with the inverse Gini index, however, the coefficient is negative and statistically significant in the full sample and OECD nations, implying that tying greater decentralization with improvements in income distribution may not be conducive for lower corruption levels. The results obtained with the other political decentralization indicator, municipal and state/province governments locally elected, are also unclear: in OECD nations, greater decentralization seems to worsen corruption levels while in non-OECD nations the opposite is true. Likewise, in interaction with the inverse Gini index, greater decentralization is conducive to lower corruption levels in OECD nations but higher corruption in non-OECD countries.
To better assess how the decentralization-corruption relationship varies with different levels of income inequality, marginal effects of decentralization on corruption are computed at different levels of the Gini index based on specifications shown in Table 3. The marginal effects are illustrated in Figure 1 and are also reported in Appendix 1.
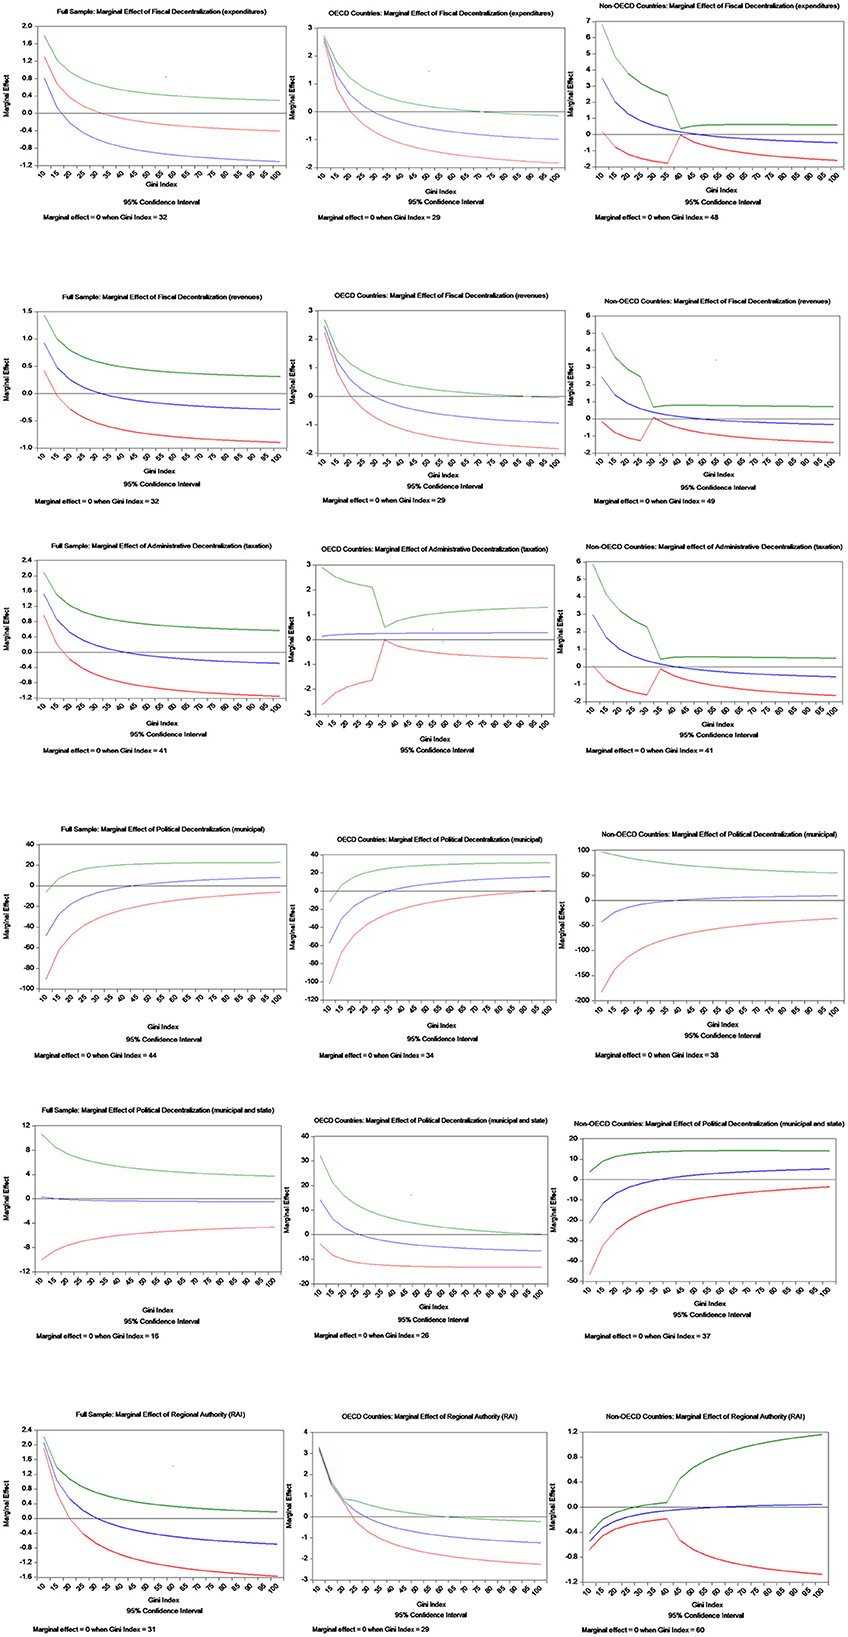
Figure 1. Marginal effect of decentralization (contingent on income inequality) on corruption.
For each diagram in Figure 1, a point on the solid, middle line indicates the marginal effect of decentralization on corruption for given levels of the Gini index. The two lines on each side of the middle line represent 95% confidence intervals. Based on equation (1), the marginal effect of a given decentralization indicator is computed as . To avoid out-of-sample interpretations, marginal effects are only depicted over relevant ranges of the Gini index within each sample.
Considering fiscal decentralization indicators only, Figure 1 suggests that for the full sample of countries both expenditure decentralization and revenue decentralization continue to exert a positive impact on corruption up to a Gini index level of ~32. Beyond this point, worsening income distribution levels render further decentralization worthless in terms of inhibiting corruption levels. For OECD nations, the Gini index level where both fiscal decentralization indicators become ineffective is 29; for non-OECD nations, the Gini index is much higher, 48 and 49, for expenditure and revenue decentralization, respectively, indicating that for developing nations there is a bigger window of opportunity when decentralization may exert a positive influence in decreasing corruption levels. In other words, even in the presence of significant income inequality, fiscal decentralization can still be an effective tool in combating corruption in developing nations.
For administrative decentralization, the results indicate that for non-OECD nations decentralization is effective in reducing corruption up to a Gini index level of 41; in OECD nations, on the other hand, this type of decentralization does not seem to positively impact corruption regardless of the level of income distribution. With political decentralization, the results generate similar results with both decentralization indicators: for OECD nations, greater political decentralization up to Gini index levels of 34 and 26 for municipal governments locally elected and municipal and state/province governments locally elected, respectively, have a positive impact on corruption; for non-OECD nations, the Gini index levels are 38 and 37, showing once again that in developing nations political decentralization has a wider range of income distribution where it may be effective in reducing corruption. With the broader decentralization indicator, the regional authority index, the results are even more apparent: in OECD nations, greater decentralization is effective in combating corruption up to a Gini index level of 29, in line with previous results. In non-OECD nations, however, decentralization is a driver for lower corruption up to a Gini index level of 60, highlighting that aggregate decentralization has a higher chance of positively affecting corruption in developing countries up to significant levels of income inequality.
Overall, the main findings suggest that the impact of decentralization on corruption depends on the dimension of decentralization, on a country's level of income distribution, and on whether the country belongs to the OECD or to the non-OECD group of nations. Furthermore, comparing results for OECD and non-OECD countries, the marginal effects of all types of decentralization—fiscal, administrative, political, and overall decentralization—tend to be larger in non-OECD nations than in OECD countries. This finding suggests that decentralization reduces corruption levels in non-OECD nations even in the presence of significant income inequality, highlighting that decentralization has a greater chance of reducing corruption levels in developing nations.
6.2. Dual and three-way interactions among decentralization indicators
Table 4 shows results for specifications incorporating all possible two-way interactions among decentralization variables. These interactions allow the marginal effect of a given dimension to vary with the level of decentralization in another dimension. All specifications include the baseline control variables described in Section 5.4 as well as an interaction term to test whether the effect of dual decentralization is moderated by the degree of income inequality as measured by the inverse Gini index.
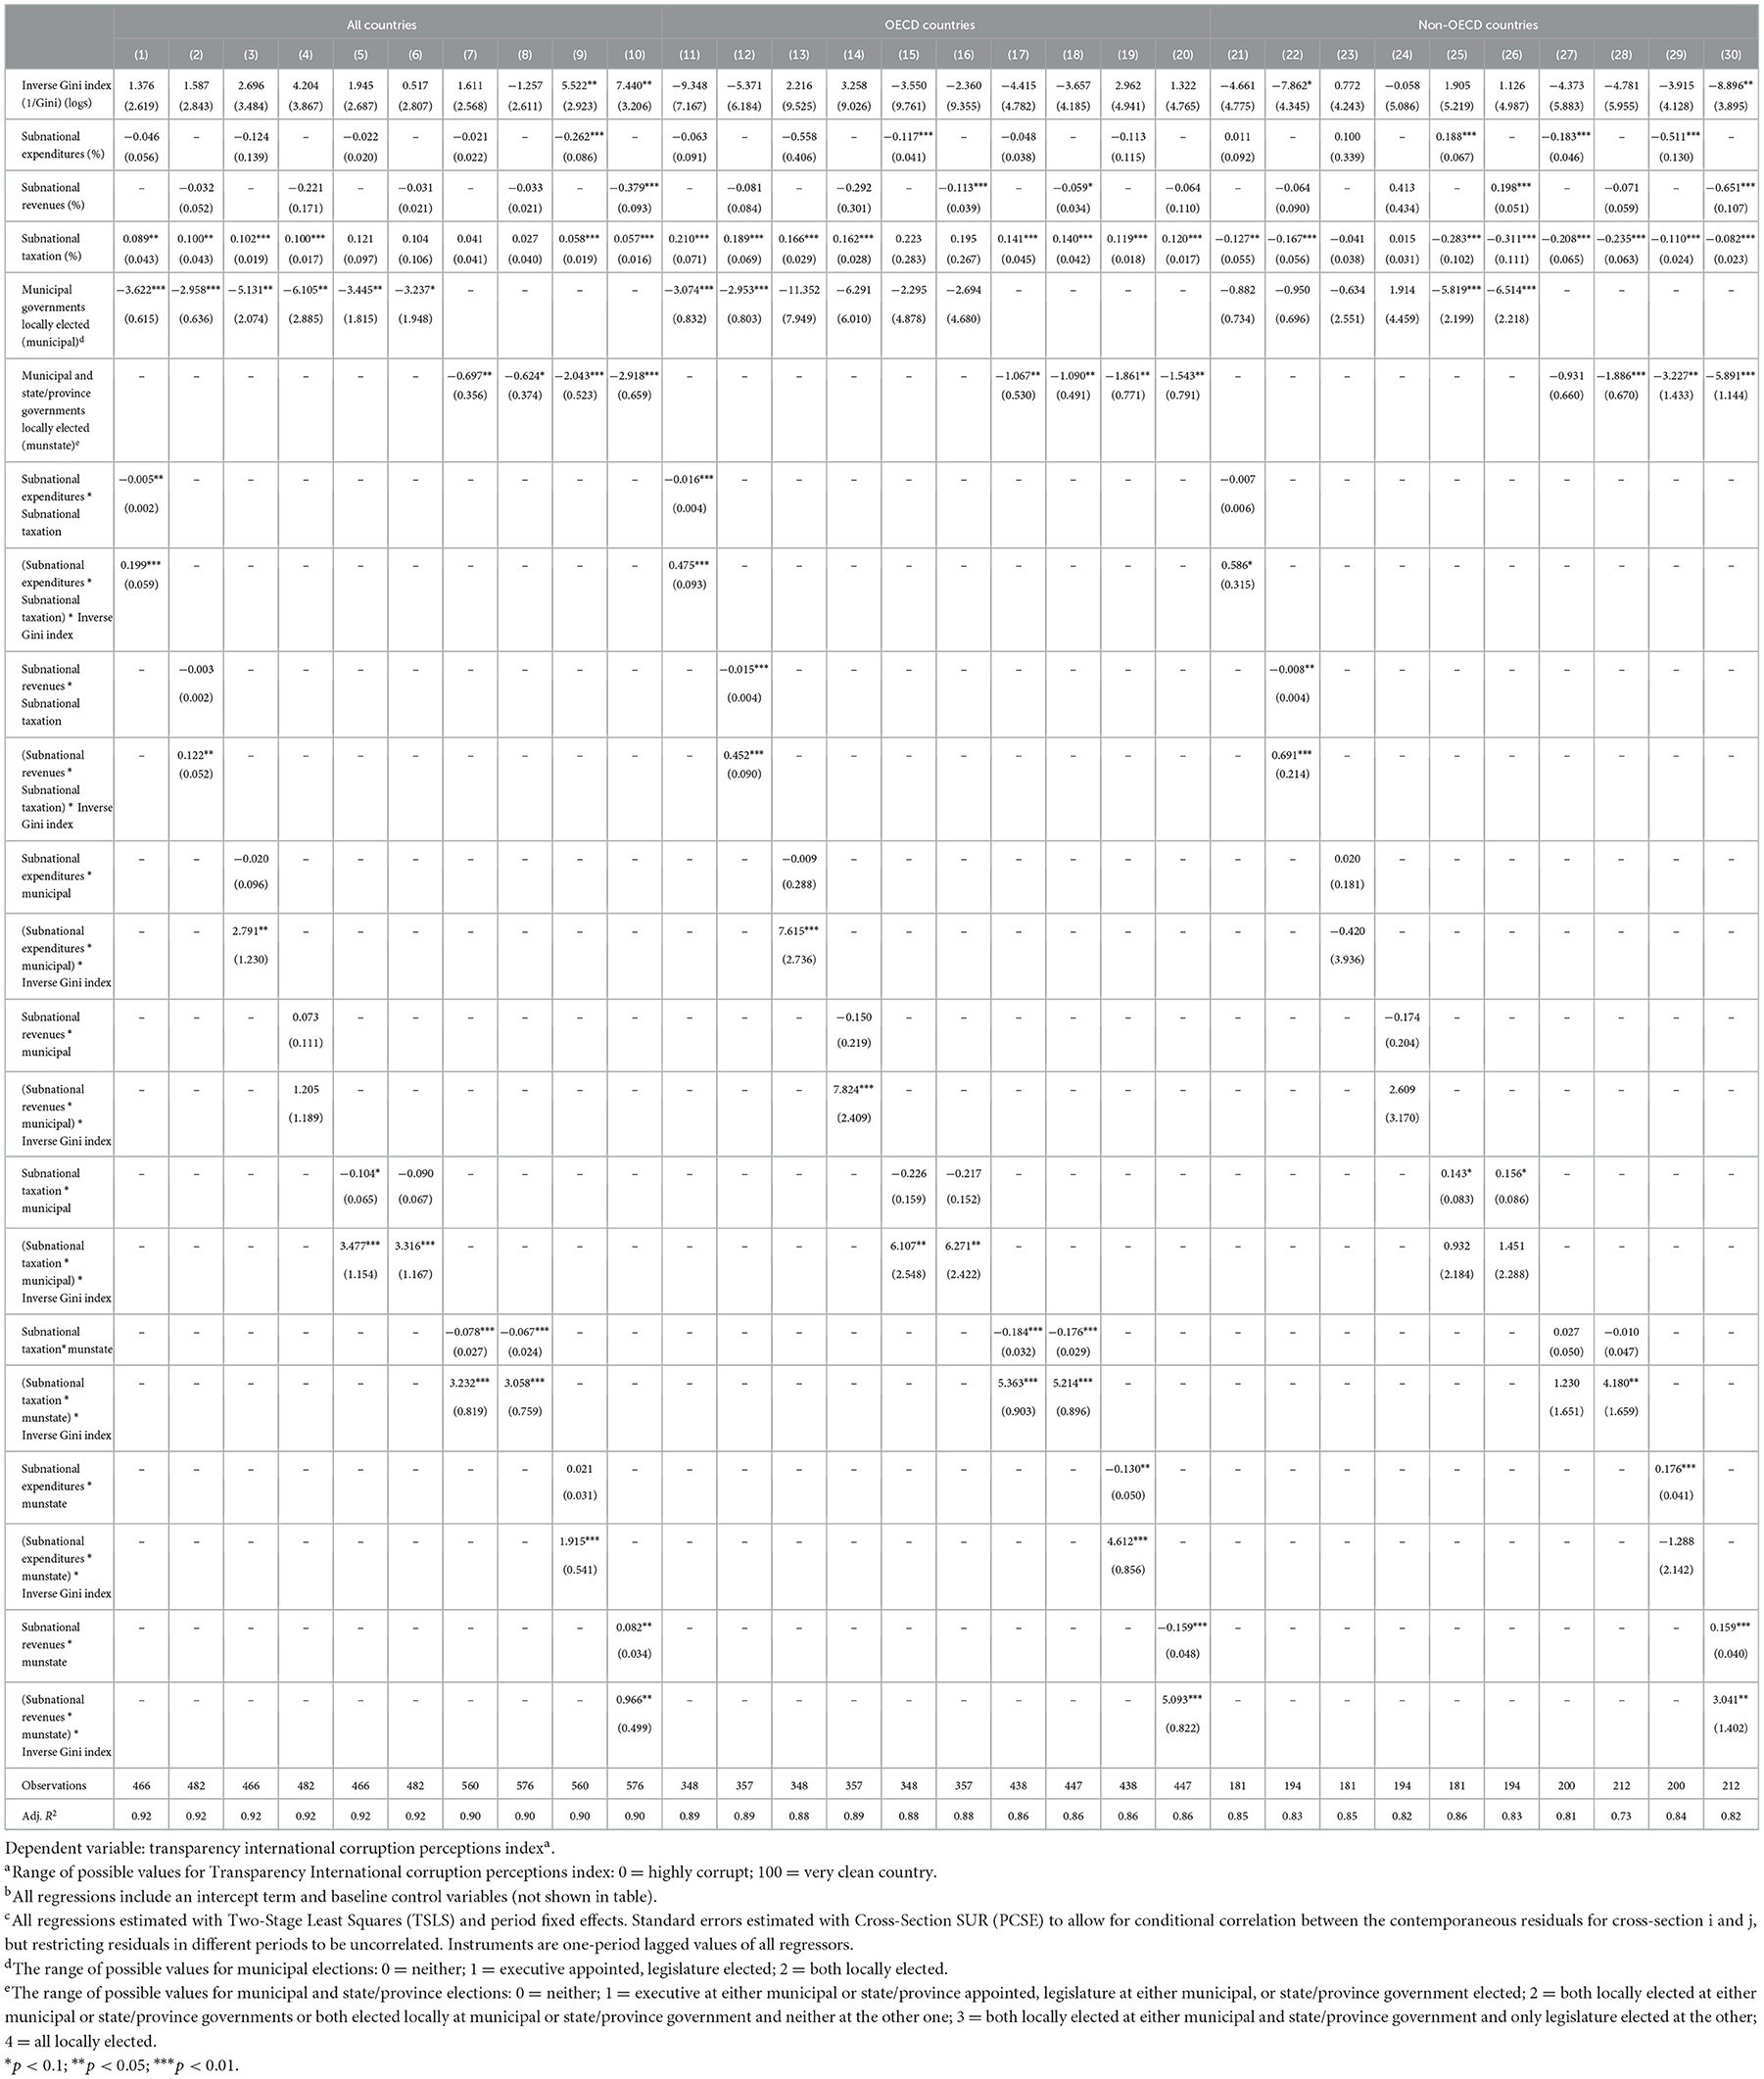
Table 4. Dual interactive decentralization and corruption.
Generally, the pattern of behavior observed when individual decentralization indicators are moderated by the inverse Gini index is also present when decentralization occurs in two dimensions of public administration. In all cases—full sample of countries, OECD countries, and non-OECD countries—dual decentralization is correlated with higher corruption, but when interacted with the inverse Gini index it becomes a driver for lower corruption levels, demonstrating again that tying improvements in income redistribution to decentralization of government functions is an important catalyst in efforts to reduce corruption.36
An important difference concerning the results obtained with individual decentralization is that with dual decentralization the results obtained with political decentralization are clearer. With individual decentralization, it was difficult to observe a consistent pattern of behavior regarding the impact of this type of decentralization. In contrast, with dual decentralization and particularly for the full sample of countries and OECD nations, whenever political decentralization is tied with another dimension of government decentralization, corruption levels tend to increase; when interacted with the inverse Gini index, however, corruption levels decrease, indicating that, at least for these sets of countries, political decentralization moderated by the inverse Gini index can be a driver for lower corruption levels if it is tied with another dimension of decentralization.
Table 5, which shows results for specifications incorporating three-way interactions among decentralization indicators, presents further evidence for the general pattern of behavior observed in Tables 3, 4. These three-way interactions allow the marginal effect of a given dimension to vary with the level of decentralization in other dimensions of government functions. Each specification also includes an interaction term to test whether the effect of tripartite decentralization is moderated by the inverse Gini index. Additionally, Table 5 also shows the impact of the Regional Authority Index (RAI)—a decentralization indicator that aggregates several dimensions of government functions—on corruption, individually and in interaction with the inverse Gini index.
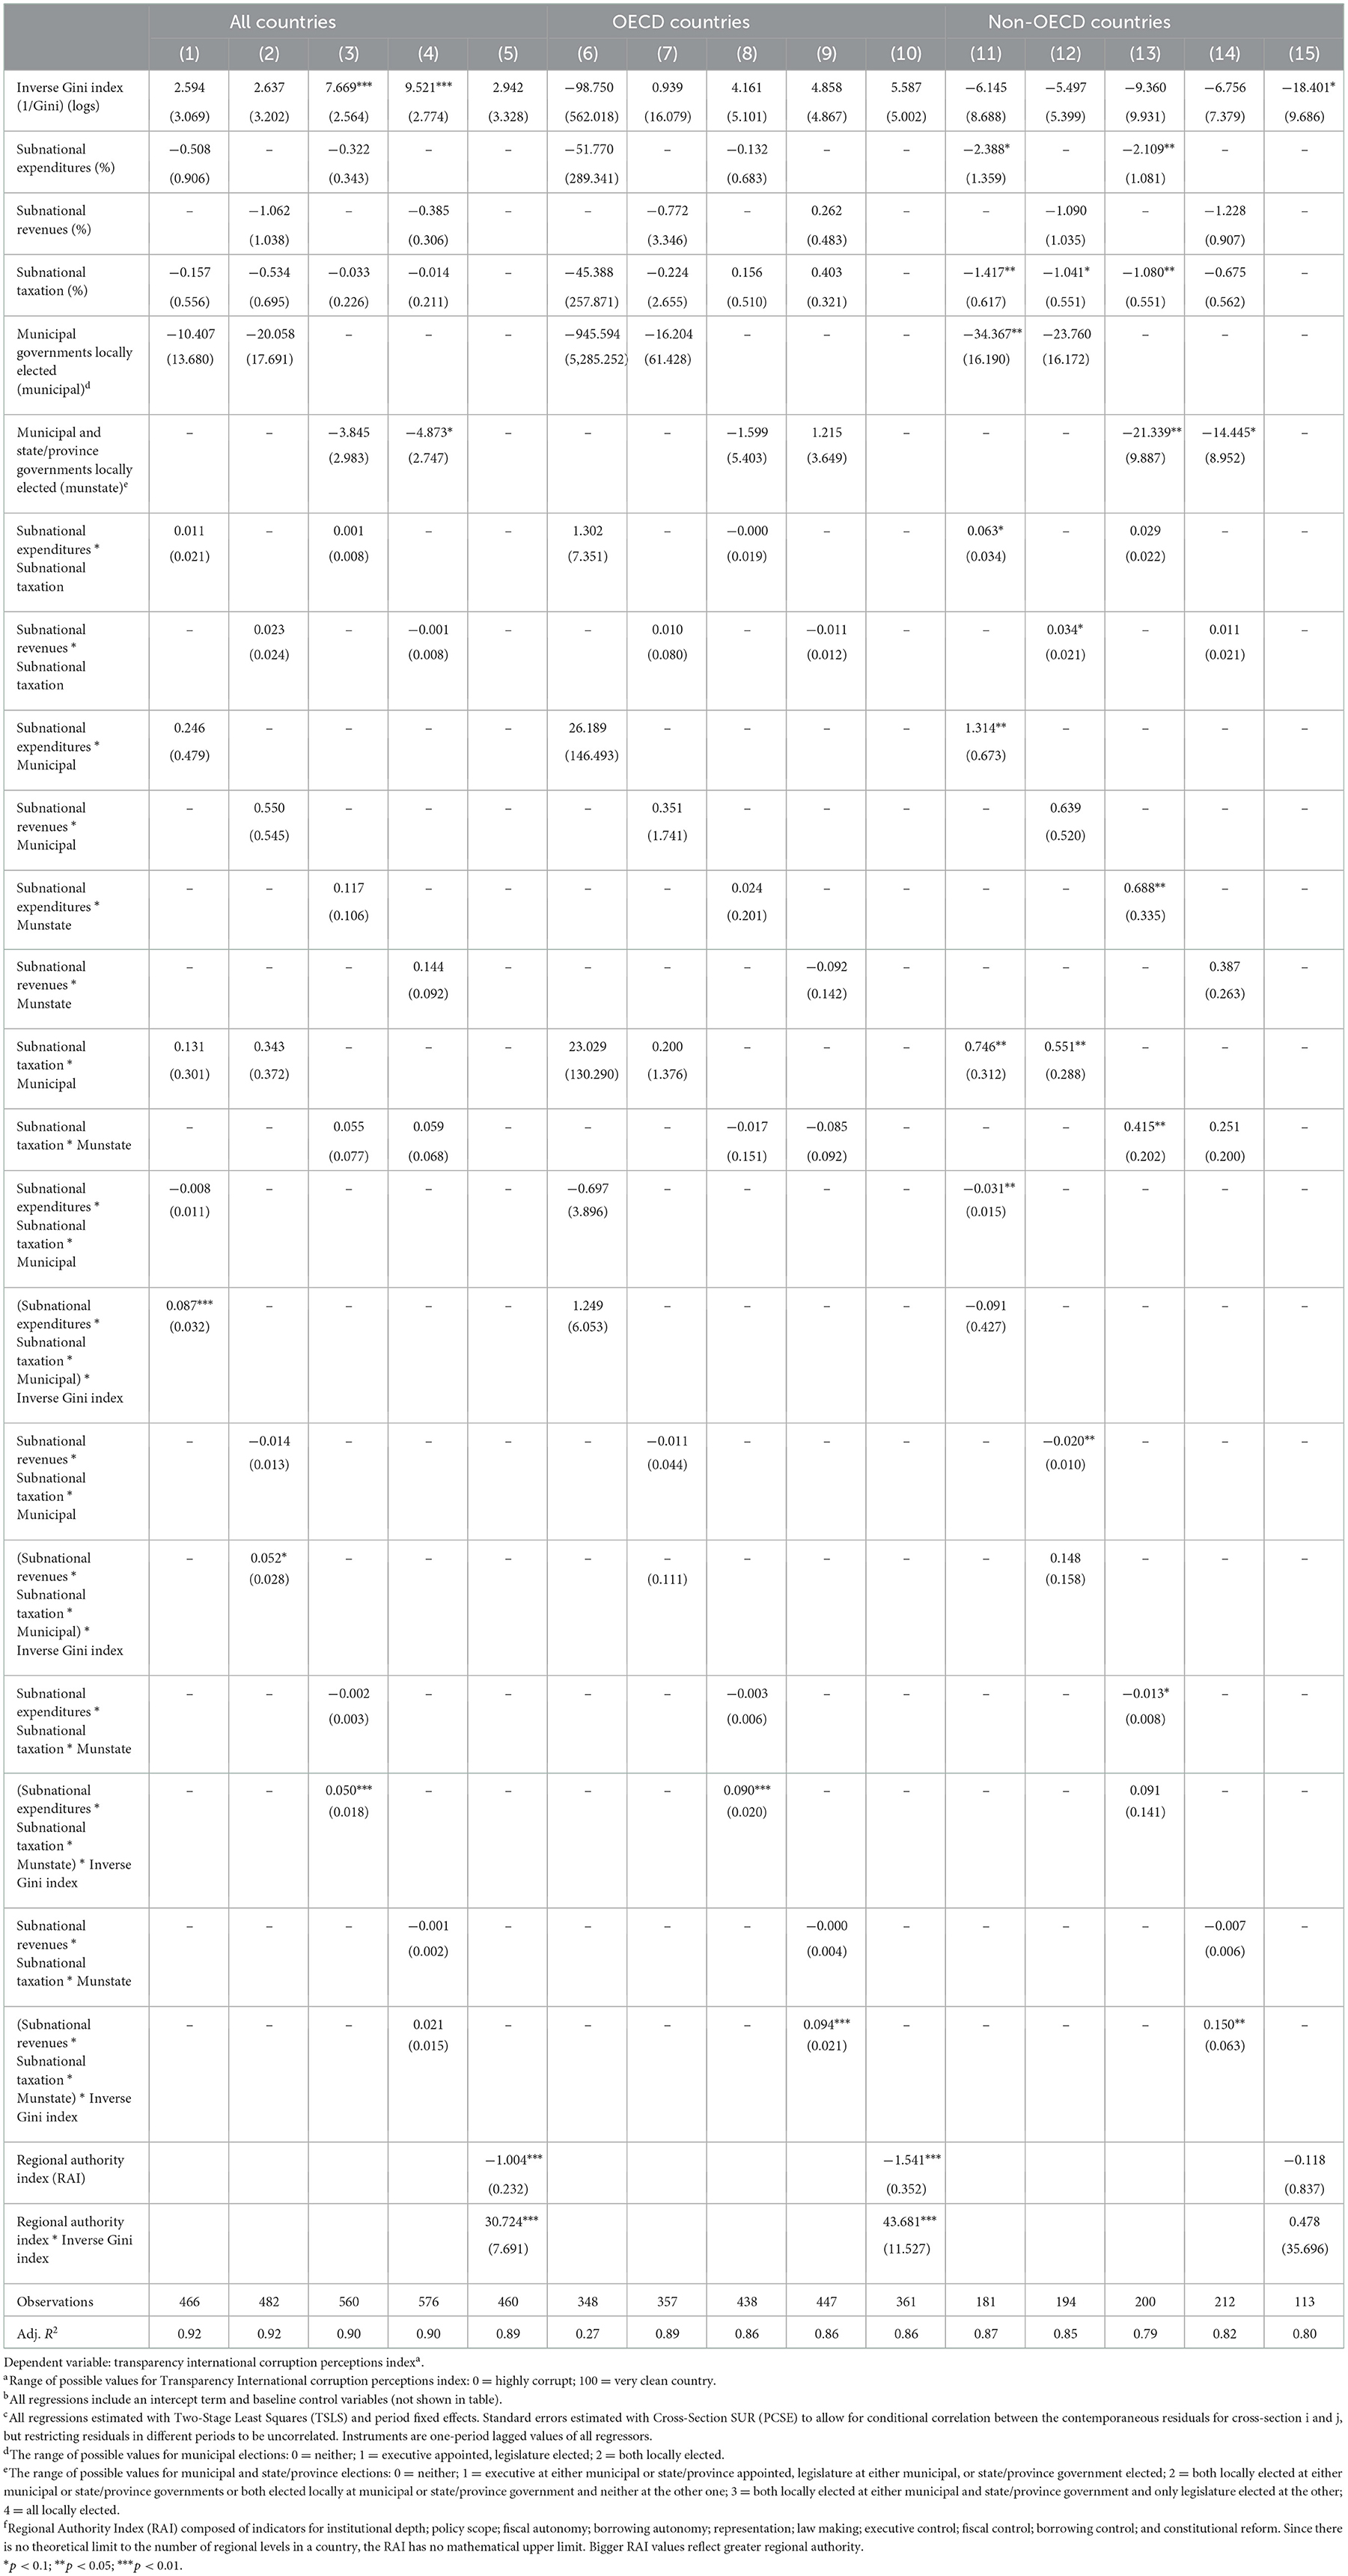
Table 5. Three-way interactive decentralization and corruption.
The results are generally consistent with the pattern of behavior observed with individual and dual decentralization. In all cases, the coefficients on three-way interactions among decentralization variables are negative, evidence of the negative impact of decentralization on corruption. When interacted with the inverse Gini index, however, the coefficients are consistently positive, further highlighting the moderating effect of improvements in income distribution as a way to make the decentralization process a driver for lower corruption levels.37 This pattern of behavior is particularly visible for the full sample of countries and OECD nations when the decentralization indicator is the RAI index, further evidence that decentralization at various levels coupled with lower income inequality can play a positive role in reducing corruption levels.
Table 6 reports robustness checks with the two alternative indicators of corruption described in Section 5.1, the ICRG index and the Kaufmann control of corruption index. Results are reported for all groups of countries and include a sample of specifications with individual, dual, and aggregate decentralization.
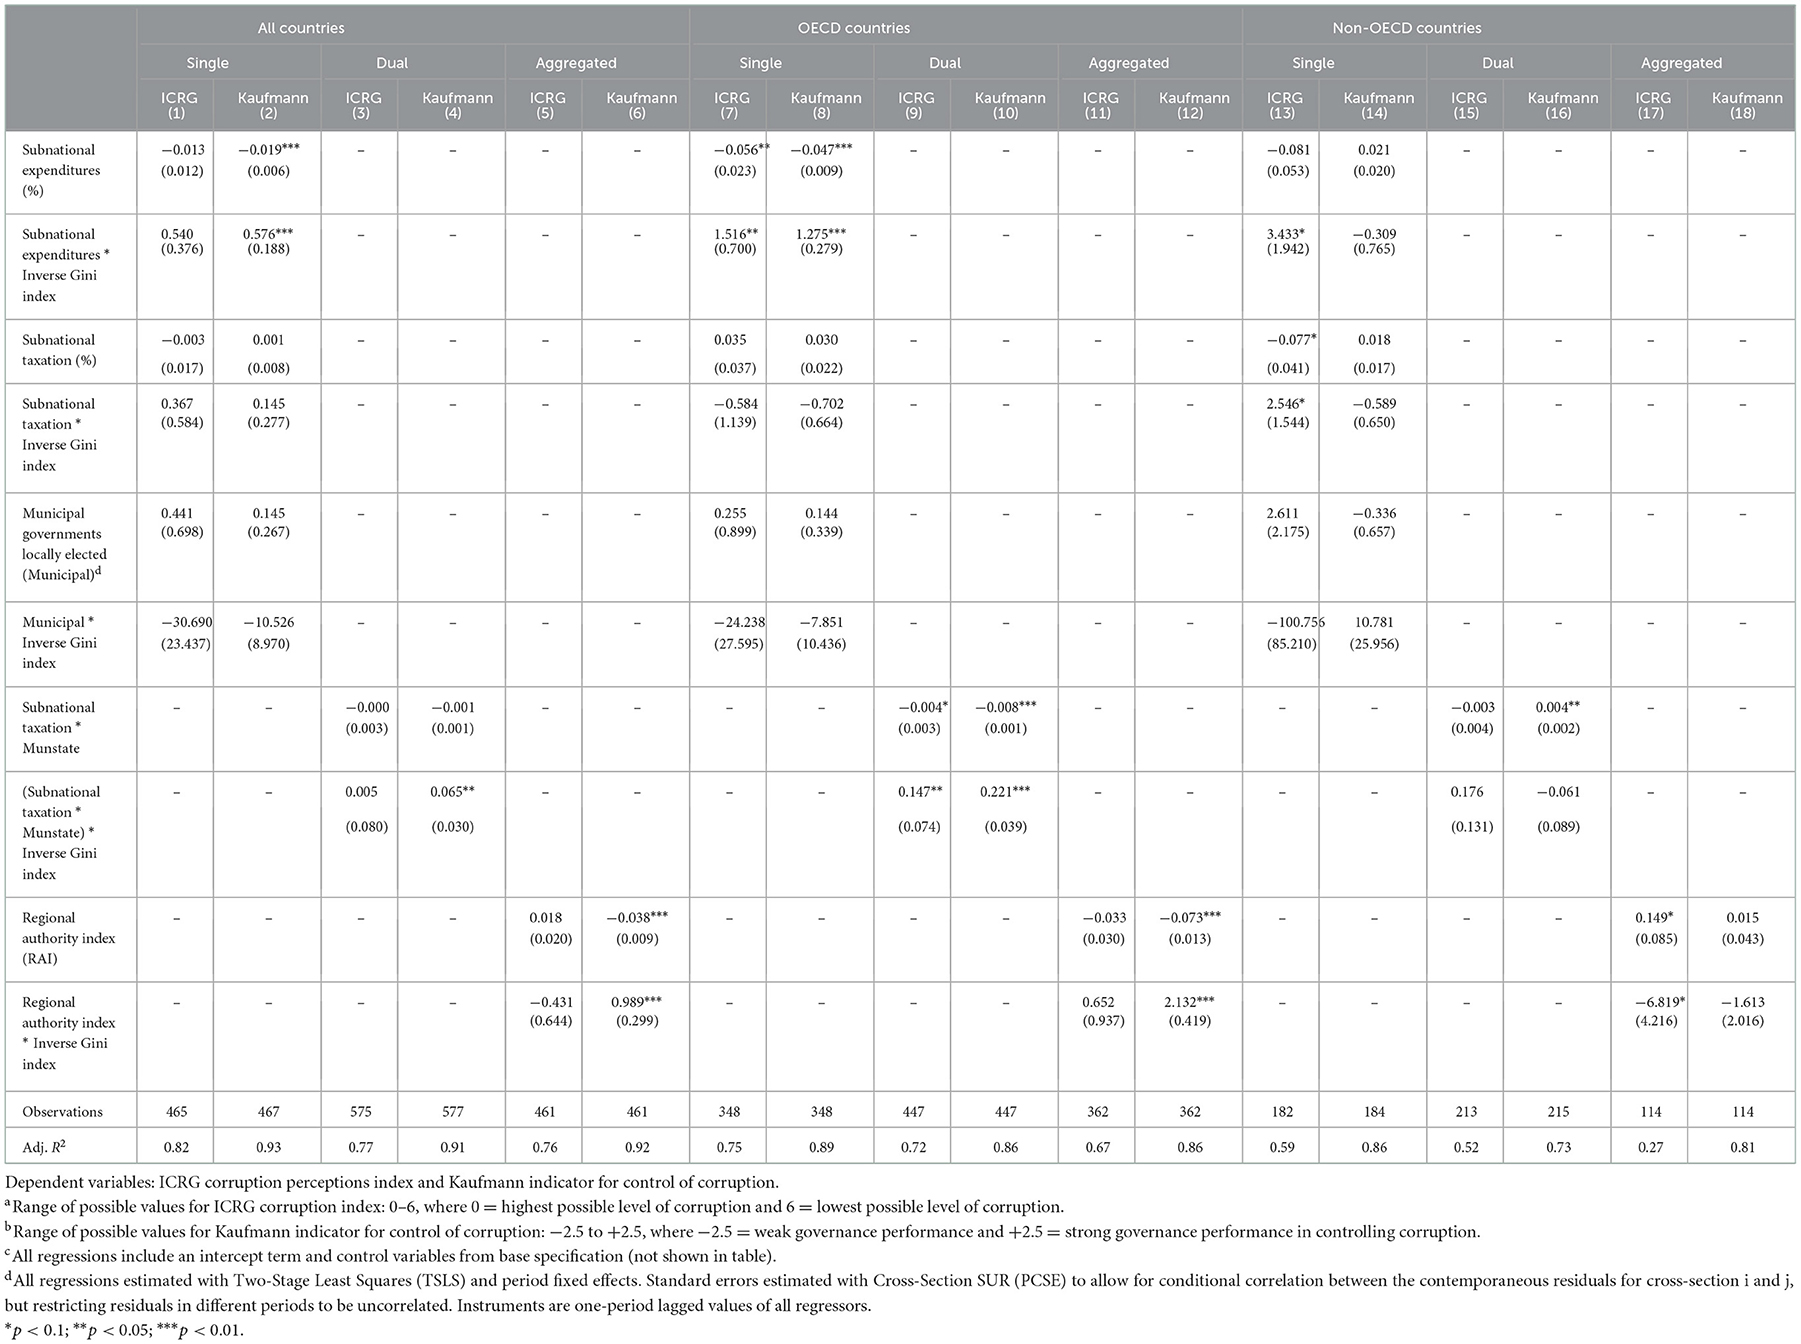
Table 6. Robustness checks.
The results are generally consistent with those observed in Tables 3–538; decentralization by itself is not conducive to lower corruption, but when interacted with the inverse Gini index, it becomes a driving force for improving corruption levels, giving credence to the principal findings reported here.
7. Conclusions and policy implications
This study analyzes how corruption is affected by the interaction of decentralization and the Gini index. The assumption is that if the process of decentralization—fiscal, administrative, political, and overall decentralization—is tied to policies that improve income distribution, corruption levels in a country decrease. The empirical findings tend to support this hypothesis as the results demonstrate that with improvements in income inequality, the impact of certain types of decentralization in lowering corruption increases.
Specifically, the empirical findings demonstrate that fiscal decentralization by itself is not conducive to lowering corruption levels, either in developed or developing countries. When interacted with the inverse Gini index, however, corruption levels in all countries decrease, though the positive impact of decentralization on the expenditure side is stronger than on the revenue side. With administrative decentralization the results are similar: by itself is not conducive to lower corruption, but when coupled with the inverse Gini index corruption levels decrease, a result that is particularly visible in developing countries. With political decentralization, the results are less clear, and interacting this process to the inverse Gini index only produces the expected results under certain circumstances, namely when political decentralization is tied to another dimension of decentralization and this combined decentralization process—two-way or three-way decentralization process—is interacted with the inverse Gini index. The latter result is more clearly reflected when the analysis is done with aggregate decentralization—i.e., utilizing the RAI index; aggregate decentralization by itself will not abate corruption but becomes a driver for lower corruption when interacted with the inverse Gini index, a result that is statistically significant for the full sample of countries and OECD nations. An important observation for non-OECD nations is that for this group of nations decentralization can exert a positive influence in reducing corruption up to high levels of income inequality—that is, the window of opportunities to lower corruption stays open longer. Even in the presence of high-income inequality, decentralization at all levels can still play a significant role in reducing corruption levels.
The principal policy implication is that decentralization cannot be utilized in isolation to confront corruption. If this process is to abate corruption, it must be tied to policies that seek to improve income distribution. From the perspective of developing nations, because decentralization can still be effective in combating corruption even in the presence of significant inequality, the need to develop and maintain well-functioning decentralization regimes remains a high priority.
Data availability statement
The raw data supporting the conclusions of this article will be made available by the authors, without undue reservation.
Author contributions
The author confirms being the sole contributor of this work and has approved it for publication.
Conflict of interest
The author declares that the research was conducted in the absence of any commercial or financial relationships that could be construed as a potential conflict of interest.
Publisher's note
All claims expressed in this article are solely those of the authors and do not necessarily represent those of their affiliated organizations, or those of the publisher, the editors and the reviewers. Any product that may be evaluated in this article, or claim that may be made by its manufacturer, is not guaranteed or endorsed by the publisher.
Supplementary material
The Supplementary Material for this article can be found online at: https://www.frontiersin.org/articles/10.3389/fams.2022.1099553/full#supplementary-material
Footnotes
1. ^The concept of decentralization is broad and is sometimes associated with the term fiscal federalism. As noted by Oates [3], “fiscal federalism” encompasses more than budgetary matters. It concerns the whole range of issues relating to the vertical structure of the public sector.
2. ^This narrow view of what a decentralized government should do, however, has been challenged both at theoretical and policy levels [43, 44]. The argument is that interjurisdictional competition among decentralized levels of government introduces serious allocative distortions that may result in another type of “race to the bottom” effect whereby there is a suboptimal output of public services.
3. ^Transparency International. Available online at: https://www.transparency.org/research/cpi/cpi_early/0
4. ^The PRS Group. The International Country Risk Guide (ICRG). Available online at: https://www.prsgroup.com/explore-our-products/international-country-risk-guide/
5. ^World Bank. Available online at: https://info.worldbank.org/governance/wgi/
6. ^The RAI is composed of indicators for institutional depth; fiscal autonomy; borrowing autonomy; representation; law-making; executive control; fiscal control; borrowing control; and constitutional reform. Since there is no theoretical limit to the number of regional levels in a country, the RAI has no mathematical upper limit; bigger RAI values reflect greater regional authority. Available online at: http://garymarks.web.unc.edu/data/regional-authority/
7. ^Subnational government expenditures (revenues) refer to the combined expenditures (revenues) carried out (collected) by subnational levels of government, namely at the local, municipal, regional, and/or state levels.
8. ^The source of data for both fiscal and administrative decentralization is the IMF Government Finance Statistics (GFS). Available online at: https://data.imf.org/?sk=A0867067-D23C-4EBC-AD23-D3B015045405
9. ^The indicator takes the value of 0 if neither the local executive nor the legislative were locally elected; 1 if the executive was appointed by the central government and the legislative was locally elected; and 2 if both the executive and legislative were locally elected.
10. ^The indicator takes the value of 0 if neither the local executive nor the legislative were locally elected; 1 if the executive at either municipal or state/province appointed, legislature at either municipal or state/provincial government elected; 2 if both locally elected at either municipal or state/provincial governments or both elected locally at municipal or state/provincial governments and neither at the other one; 3 if both locally elected at either municipal and state/provincial government and only legislature elected at the other; and 4 if all locally elected.
11. ^Inter-American Development Bank. Available online at: https://mydata.iadb.org/Reform-Modernization-of-the-State/Database-of-Political-Institutions-2015/ngy5-9h9d
12. ^Source: IMF World Economic Outlook Database. Available online at: https://www.imf.org/external/pubs/ft/weo/2017/01/weodata/index.aspx
13. ^Expressing variables in logs allow, among other things, residuals to be obtained that are approximately normally distributed; it also reduces the effect of outliers.
14. ^Source: World Bank Development Indicators. Available online at: https://data.worldbank.org/indicator/
15. ^Based on years of schooling and returns of education. Available online at: https://www.rug.nl/ggdc/productivity/pwt/
16. ^Source: IMF World Economic Outlook Database.
17. ^Source: Freedom House. Available online at: https://freedomhouse.org/report-types/freedom-world
18. ^Source: World Bank Development Indicators.
19. ^Source: Polity IV Project: Center for Systemic Peace. Available online at: www.systemicpeace.org/inscrdata.html
20. ^Source: IMF World Economic Outlook Database.
21. ^Source: The Heritage Foundation. Available online at: https://www.heritage.org/index/
22. ^Source: Polity IV Project: Center for Systemic Peace.
23. ^The countries used in this study are the following (in alphabetical order): Afghanistan, Albania, Argentina, Armenia, Australia, Austria, Azerbaijan, Belarus, Belgium, Bolivia, Bosnia and Herzegovina, Brazil, Bulgaria, Cape Verde, Canada, Chile, China, Colombia, Congo Republic of, Costa Rica, Croatia, Cyprus, Czech Republic, Denmark, El Salvador, Estonia, Finland, France, Georgia, Germany, Greece, Honduras, Hungary, Iceland, Indonesia, Iran, Ireland, Israel, Italy, Jamaica, Japan, Jordan, Kazakhstan, Kenya, Kiribati, Latvia, Lesotho, Lithuania, Luxembourg, Malaysia, Malta, Mauritius, Mexico, Moldova, Mongolia, Morocco, Netherlands, New Zealand, Norway, Paraguay, Peru, Poland, Portugal, Romania, Russia, Rwanda, Serbia, Slovak Republic, Slovenia, South Africa, South Korea, Spain, Sweden, Switzerland, Tanzania, Thailand, Tunisia, Turkey, Uganda, Ukraine, United Arab Emirates, United Kingdom, United States, and Uzbekistan.
24. ^The Hausman test carried out for equation (1) provides statistical evidence that a fixed-effects model is an appropriate methodology; given a p-value of zero, the null hypothesis that the preferred model is random effects is rejected.
25. ^Cross-section fixed effects were not utilized due to insufficient number of observations and hence lack of degrees of freedom.
26. ^The panel unit root tests in levels and first differences for all corruption indices, the decentralization indicators, and the Gini index demonstrated the absence of unit roots. The p values for the ADF (Fisher Chi-square), PP (Fisher Chi-square), and the Im Pesaran and Shin W-stat were all zero or close to zero, rejecting the null hypothesis of a unit root process.
27. ^Following Wooldridge [63], I estimated a first-difference regression of Equation (1) and tested for AR(1) serial correlation by regressing the estimated residuals from the first-differenced equation on the lagged residuals. Under the null hypothesis that the original idiosyncratic errors are uncorrelated, the lagged residuals from this equation should have a coefficient of −0.5. A Wald test was utilized to test for this restriction and the p values for the t-statistic, F-statistic, and Chi-square statistic rejected the null hypothesis of C(1) = −0.5, implying that the residuals from the first-differenced equation do not have an autocorrelation coefficient of −0.5, evidencing serial correlation.
28. ^One-period lagged values of all regressors were utilized as instruments.
29. ^The impact of municipal and state/province governments locally elected in the full sample of countries is negative but statistically insignificant.
30. ^In non-OECD nations, and when religion is paired with the RAI index, a protestant faith seems to worsen corruption levels.
31. ^For the OECD sample, when subnational expenditures is paired with municipal and state/province governments locally elected (specification 7), its coefficient is negative but statistically insignificant.
32. ^The range of possible values for the dependent variable, the corruption perceptions index, is 0–100, where 0 = highly corrupt and 100 = very clean country.
33. ^As noted by Brambor et al. [67], the interpretation of the coefficient on interactive terms is problematic and hence the main concern here is on the direction—reflected on the sign—of the coefficient.
34. ^In the full sample of countries there is inconclusive empirical evidence supporting the expectation that higher administrative decentralization increases corruption levels; for OECD nations, the empirical evidence is non-existent: subnational taxation does not seem to have any impact on corruption, individually or in interaction with the inverse Gini index.
35. ^For non-OECD nations, the coefficient for municipal governments locally elected in specifications [11] and [12] is positive but statistically insignificant; likewise, in interaction with the inverse Gini index, the coefficient in the same specifications is negative and insignificant.
36. ^There are certain cases when dual decentralization seems to run counter to expectations; this happens whenever one dimension of decentralization involves political decentralization, either through municipal governments locally elected or municipal and state/province governments locally elected. Specifications 10, 25, 26, 29, and 30 in Table 4 are cases in point. While this situation is most visible with non-OECD countries, the general pattern of behavior remains remarkably consistent in all country samples: dual decentralization is most often correlated with higher corruption levels but when interacted with the inverse Gini index it becomes a driver for lower corruption.
37. ^Even though the coefficients on three-way interactions are all negative and turn positive when moderated by the inverse Gini index, they are not always statistically significant.
38. ^Even though the pattern of behavior with these two alternative indicators of corruption generally mimics the one observed with the Transparency International corruptions perceptions index, the coefficients of all decentralization indicators—individually, with dual, with aggregated decentralization, and in interaction with the inverse Gini index—are not always statistically significant.
References
1. Dreher A, Gassebner M. Greasing the wheels? The impact of regulations and corruption on firm entry. Public Choice. (2013) 155:413–32. doi: 10.1007/s11127-011-9871-2
2. Cooray A, Schneider F. Does corruption throw sand into or grease the wheels of financial sector development? Public Choice. (2018) 177:111–33. doi: 10.1007/s11127-018-0592-7
3. Oates WE. An essay on fiscal federalism. J Econ Lit. (1999) 37:1120–49. doi: 10.1257/jel.37.3.1120
4. Martinez-Vazquez J, Lago-Peñas S, Sacchi A. The impact of fiscal decentralization: a survey. J Econ Surv. (2017) 31:1095–129. doi: 10.1111/joes.12182
5. Shah A. Balance, Accountability, and Responsiveness: Lessons About Decentralization. World Bank Policy Research Working Paper No. 2021. Washington, DC: World Bank (1999). doi: 10.1596/1813-9450-2021
6. Arze del Granado JF, Martinez-Vazquez J, McNab R. Fiscal Decentralization and the Functional Composition of Public Expenditures. International Studies Program Working Paper 05–01. Atlanta, GA: Andrew Young School of Policy Studies, Georgia State University.
7. Rodríguez-Pose A, Ezcurra R. Does decentralization matter for regional disparities? A cross-country analysis. J Econ Geogr. (2010) 10:619–44. doi: 10.1093/jeg/lbp049
8. Sepulveda CF, Martinez-Vazquez J. the consequences of fiscal decentralization on poverty and income inequality. Environ Plan C Govern Policy. (2011) 29:321–43. doi: 10.1068/c1033r
9. Tselios V, Rodríguez-Pose A, Pike A, Tomaney J, Torrisi G. Income inequality, decentralization, and regional development in western Europe. Environ Plan A. (2012) 44:1278–301. doi: 10.1068/a44334
10. Bojanic AN, Collins L. Differential effects of decentralization on income inequality: evidence from developed and developing countries. Emp Econ. (2019) 60:1969–2004. doi: 10.1007/s00181-019-01813-2
11. Prud'homme R. The dangers of decentralization. World Bank Res Obs. (1995) 10:201–20. doi: 10.1093/wbro/10.2.201
13. Neyapti B. Revenue decentralization and income distribution. Econ Lett. (2006) 92:409–16. doi: 10.1016/j.econlet.2006.03.026
14. Sacchi A, Salotti S. The effects of fiscal decentralization on household income inequality: some empirical evidence. Spat Econ Anal. (2014) 9:202–22. doi: 10.1080/17421772.2013.833343
15. Weingast BR. The economic role of political institutions: market-preserving federalism and economic development. J Law Econ Organ. (1995) 11:1–31.
16. Seabright P. Accountability and decentralisation in government: an incomplete contracts model. Eur Econ Rev. (1996) 40:61–89. doi: 10.1016/0014-2921(95)00055-0
17. Lockwood B. Fiscal Decentralization: A Political Economy Perspective. Economic Research Papers. University of Warwick; Department of Economics (2005). Available online at: https://warwick.ac.uk/fac/soc/economics/staff/blockwood/handbook.pdf
18. Weingast BR. Second generation fiscal federalism: the implications of fiscal incentives. J Urban Econ. (2009) 65:279–93. doi: 10.1016/j.jue.2008.12.005
19. Arikan GG. Fiscal decentralization: a remedy for corruption? Int Tax Public Fin. (2004) 11:175–95. doi: 10.1023/B:ITAX.0000011399.00053.a1
20. Fisman R, Gatti R. Decentralization and corruption: evidence across countries. J Public Econ. (2002) 83:325–45. doi: 10.1016/S0047-2727(00)00158-4
21. Ivanyna M, Shah A. Decentralization and corruption: new cross-country evidence. Environ Plan C Govern Policy. (2011) 29:344–62. doi: 10.1068/c1081r
22. Altunbas Y, Thornton J. Fiscal decentralization and governance. Public Fin Rev. (2012) 40:66–85. doi: 10.1177/1091142111424276
23. Pavodano F, Fiorino N, Galli E. When does government decentralization affect corruption? In Lago-Peñas S, Martinez-Vazquez J, editors. The Challenge of Local Government Size: Theoretical Perspectives, International Experience, and Policy Reform. Cheltenham: Edward Elgar (2013).
26. Rodden J, Rose-Ackerman S. Does federalism preserve markets? Va Law Rev. (1997) 83:1521–72. doi: 10.2307/1073767
27. Litvack J, Ahmad J, Bird R. Rethinking Decentralization in Developing Countries. Washington, DC: World Bank (1998). doi: 10.1596/0-8213-4350-5
28. Bardhan P, Mookherjee D. Decentralisation and accountability in infrastructure delivery in developing countries. Econ J. (2006) 116:101–27. doi: 10.1111/j.1468-0297.2006.01049.x
29. Fan SC, Lin C, Treisman D. Political decentralization and corruption: evidence from around the world. J Public Econ. (2009) 93:14–34. doi: 10.1016/j.jpubeco.2008.09.001
30. Nelson MA. Corruption and the size of local governments: are they related? In: International Center for Public Policy Working Paper Series, at AYSPS, GSU Paper, 1210. International Center for Public Policy; Andrew Young School of Policy Studies; Georgia State University (2012). doi: 10.4337/9781782544302.00008
31. Meltzer AH, Richard SF. A rational theory of the size of government. J Polit Econ. (1981) 89:914–27. doi: 10.1086/261013
32. Glaeser E, Scheinkman J, Shleifer A. The injustice of inequality. J Monet Econ. (2003) 50:199–222. doi: 10.1016/S0304-3932(02)00204-0
33. Kaufmann D, Vicente PC. Legal Corruption. (2005). Available online at: http://siteresources.worldbank.org/INTWBIGOVANTCOR/Resources/Legal_Corruption.pdf (accessed December 6, 2021).
34. You JS, Khagram S. A comparative study of inequality and corruption. Am Sociol Rev. (2005) 70:136–57. doi: 10.1177/000312240507000107
35. Uslaner EM, Rothstein B. The historical roots of corruption: state building, economic inequality, mass education. Comp Polit. (2016) 48:227–48. doi: 10.5129/001041516817037736
36. Uslaner EM. Corruption, Inequality, and the Rule of Law. New York, NY: Cambridge University Press (2008).
37. Fried BJ, Lagunes P, Venkataramani A. Corruption and inequality at the crossroad: a multimethod study of bribery and discrimination in latin America. Lat Am Res Rev. (2010) 45:76–97. doi: 10.1353/lar.0.0107
38. Treisman D. The causes of corruption: a cross-national study. J Public Econ. (2000) 76:399–457. doi: 10.1016/S0047-2727(99)00092-4
39. Careaga M, Weingast BR. fiscal federalism, good governance, and economic growth in Mexico. In:Rodrik D, , editor. Search of Prosperity: Analytic Narratives on Economic Growth. Princeton, NJ: Princeton University Press (2003).
40. Musgrave RA. The Theory of Public Finance: A Study in Public Economy. New York, NY: McGraw Hill (1959).
41. Oates WE. The theory of public finance in a federal system. Can J Econ. (1968) 1:37–54. doi: 10.2307/133460
43. Break GF. Intergovernmental Fiscal Relations in the United States. Washington, DC: Brookings Institution (1967).
44. Oates WE, Schwab RM. Economic competition among jurisdictions: efficiency enhancing or distortion inducing? J Public Econ. (1988) 35:333–54. doi: 10.1016/0047-2727(88)90036-9
45. Schneider A. Decentralization: conceptualization and measurement. Stud Comp Int Dev. (2003) 38:32–56. doi: 10.1007/BF02686198
46. Aidt TS, Dutta J, Sena V. Governance regimes, corruption and growth: theory and evidence. J Comp Econ. (2008) 36:195–220. doi: 10.1016/j.jce.2007.11.004
47. Bai J, Jayachandran S, Malesky EJ, Olken BA. Does Economic Growth Reduce Corruption? Theory and Evidence From Vietnam. National Bureau of Economic Research (2013). doi: 10.3386/w19483
48. Gokcekus O, Knörich J. Does quality of openness affect corruption? Econ Lett. (2006) 91:190–6. doi: 10.1016/j.econlet.2005.11.015
49. Neeman Z, Daniele Paserman M, Simhon A. Corruption and openness. BE J Econ Anal Policy. (2008) 8:1935–82. doi: 10.2202/1935-1682.2013
50. Majeed MT. Corruption and trade. J Econ Integrat. (2014) 29:759–82. doi: 10.11130/jei.2014.29.4.759
51. Glaeser EL, Saks RE. Corruption in America. J Public Econ. (2006) 90:1053–72. doi: 10.1016/j.jpubeco.2005.08.007
52. Elbahnasawy NG, Revier CF. The determinants of corruption: cross-country-panel-data analysis. Dev Econ. (2012) 50:311–33. doi: 10.1111/j.1746-1049.2012.00177.x
53. Bhattacharyya S, Hodler R. Media freedom and democracy in the fight against corruption. Eur J Polit Econ. (2015) 39:13–24. doi: 10.1016/j.ejpoleco.2015.03.004
54. Dollar D, Fisman R, Gatti R. Are women really the “fairer” sex? Corruption and women in government. J Econ Behav Organ. (2001) 46:423–9. doi: 10.1016/S0167-2681(01)00169-X
55. Swamy AV, Knack S, Lee YI, Azfar O. Gender and corruption. J Dev Econ. (2001) 64:25–55. doi: 10.1016/S0304-3878(00)00123-1
56. Fiorino N, Galli E, Padovano F. Do Fiscal Decentralization Government Fragmentation Affect Corruption in Different Ways? Evidence From a Panel Data Analysis (2013). Available online at: https://ideas.repec.org/p/ays/ispwps/paper1217.html#:~:text=http%3A//icepp.gsu.edu/files/2015/03/ispwp1217.pdf
57. Arvate PR, Andrea Z, Curi FR, Fabio A, Sanches M. Corruption and the size of government: causality tests for OECD and Latin American countries. Appl Econ Lett. (2010) 17:1013–7. doi: 10.1080/13504850802676207
58. Goel RK, Nelson MA. Causes of corruption: history, geography and government. J Policy Model. (2010) 32:433–47. doi: 10.1016/j.jpolmod.2010.05.004
59. Saha S, Gounder R, Su JJ. The interaction effect of economic freedom and democracy on corruption: a panel cross-country analysis. Econ Lett. (2009) 105:173–6. doi: 10.1016/j.econlet.2009.07.010
60. La Porta R, Lopez-de-Salanes F, Shleifer A, Vishny R. The quality of government. J Law Econ Organ. (1999) 15:222–79. doi: 10.1093/jleo/15.1.222
61. Sandholtz W, Koetzle W. Accounting for corruption: economic structure, democracy, and trade. Int Stud Q. (2000) 44:31–50. doi: 10.1111/0020-8833.00147
63. Wooldridge JM. Econometric Analysis of Cross Section and Panel Data. Cambridge, MA: MIT Press (2010).
64. Hsiao C. Analysis of Panel Data. New York, NY: Cambridge University Press (2014). doi: 10.1017/CBO9781139839327
65. Arellano M. Practitioners' corner: computing robust standard errors for within-groups estimators. Oxf Bull Econ Stat. (1987) 49:431–4. doi: 10.1111/j.1468-0084.1987.mp49004006.x
66. Chesher A, Rosen, A. Generalized Instrumental Variable Models, CEMMAP Working Paper CWP43/13. The Institute for Fiscal Studies (2013). doi: 10.1596/1813-9450-2021 Available online at: http://www.cemmap.ac.uk/wps/cwp431313.pdf (accessed December 6, 2021).
Keywords: corruption, decentralization, intergovernmental relations, income inequality, OECD countries, developing countries
Citation: Bojanic AN (2023) Tying decentralization and income redistribution to fight corruption: Empirical evidence from developed and developing countries. Front. Appl. Math. Stat. 8:1099553. doi: 10.3389/fams.2022.1099553
Received: 15 November 2022; Accepted: 21 December 2022;
Published: 16 January 2023.
Edited by:
Franklin Mixon, Columbus State University, United StatesReviewed by:
Steve Caudill, Florida Atlantic University, United StatesKamal Upadhyaya, University of New Haven, United States
Copyright © 2023 Bojanic. This is an open-access article distributed under the terms of the Creative Commons Attribution License (CC BY). The use, distribution or reproduction in other forums is permitted, provided the original author(s) and the copyright owner(s) are credited and that the original publication in this journal is cited, in accordance with accepted academic practice. No use, distribution or reproduction is permitted which does not comply with these terms.
*Correspondence: Antonio N. Bojanic,  YWJvamFuaWNAdHVsYW5lLmVkdQ==
†ORCID: Antonio N. Bojanic orcid.org/0000-0002-4356-0636