 Rui Liang
 Hongmei Zhu
 Grant Lawson2
- 1Department of Mathematics and Statistics, York University, Toronto, ON, Canada
- 2Devhaus Corporation, Toronto, ON, Canada
The benefits of participating in high-quality Early Childhood Education (ECE) have been recognized by people for many years; and the need for high-quality ECE has never been greater. In this case study, we focus on whether ECE can improve learning speed in five domains: social, emotional, communication, cognition, and physical development. The initial ages for each of these five domains, in months since birth, are collected and compared with that of common children as described in Nipissing District Developmental Screen (NDDS). We find that children in the ECE program learned faster with a p-value no >0.0078. In addition, students in an ECE program are labeled by their ages at enrollment as Cohort 1 (infant) and Cohort 2 (toddler), and we conduct the following statistical tests on their difference: Welch's t-test, Hoteling's T2-test, and survival analysis. We find that the average initial observation age of Cohort 1 is 4.82 months earlier than that of Cohort 2 with a p-value no >0.009. We are convinced that ECE programs could advance students' learning in all five domains.
1. Introduction
As we know in traditional education, the main tools of teaching are a blackboard and chalk. It is a teacher-based, i.e., memorization and recitation practice-based education method. Whereas, modern education is more activity-based, which treats students individually according to their own progress in learning (1). The need for high-quality ECE has never been greater (2–4). In recent years there is an increasing trend of new teaching styles, aiming at solving the challenges faced by traditional teaching methods. For example, one of these challenges is that students in large classes have the tendency to “drift off task” more (5). Another challenge is the non-homogeneity of learning paces among students (6) in large classes. However, it could be hard to tell whether the desired improvements have been achieved for ECE students since the standard external assessments and teacher-based assessments are not applicable to ECE students. Still, in the modern ECE program, the best learning approach is to personalize each child's daily activities in terms of their own pace and learning style. In addition, measurable results of each child's progress and achievement are important for educators and parents to clearly evaluate each child's learning progress.
The standard external assessments and teacher-based assessments are meant for school-aged students and must be taken frequently to test the efficacies of different instruction methods (7). The standardized examinations are designed and marked outside of individual schools and, thus, are used mainly for large-scale testing. The teacher-based assessment is an internal assessment conducted by an individual teacher and can be tailored to an individual student (8). For rating licensed childcare centers, the Assessment for Quality Improvement (AQI) is the primary assessment tool in Canada. The AQI assesses a broader range of factors including the learning experiences, learning environment, and interactions between teachers and children. For evaluating individual Early Childhood Education (ECE) students, Nipissing District Developmental Screen (NDDS) is a well-accepted developmental screening tool for children between 1 and 72 months. It provides common expectations on critical skills in social, emotional, communication, cognition, and physical development (9, 10) for ECE students. For example, in the NDDS Looksee checklist, an 18-month child is expected to “Identify pictures in a book” (11).
2. Motivations
There are different opinions on the efficacy of ECE programs. Barnett and Belfield (12) argues that ECE programs improve children's learning outcomes in many aspects including social ability, language acquisition, mathematics, and communication skills. However, Erickson (13) shows that social development among children, as indicated by both emotional and behavioral measures, had significantly deteriorated in Quebec, relative to the rest of Canada due to the compulsory full-day, year-round childcare for all children under the age of 5 years launched in 1997. Additionally, a study by the National Institute of Child Health and Human Development (NICHD) in the US shows that “children who were cared for exclusively by their mothers did not develop differently than those who were also cared for by others” (14). Moreover, Rockville and Maryland claimed that the kindergarten entry age has no relationship with socioemotional functioning (15). For this reason, we are motivated to develop a data-driven approach to evaluate the quality of ECE programs and study their impact on the learning of its students.
Alice and Roberts-Holmes (16) mentioned the increasing importance of data-driven analysis in primary education. The well-known longitudinal data in the National Longitudinal Study of Children and Youth [NLSCY, (17)], were collected every 2 years over Canadian Children's long-term development from 0 to 7 and 14 to 25 years old. Although this survey is useful for examining the general child and parental outcomes, the frequency of data collection is not sufficient to capture the details in the fast developmental stage of early childhood learning. Cleveland et al. (18) demonstrated that Canadian data about ECE programs are incomplete and inconsistent. The availability of high-quality ECE program data is rather limited, and data-driven statistical analyses on the evaluating ECE are still rare (19, 20). Some educational institutions and researchers have been aware of this issue and made some efforts such as collecting data and conducting surveys (21, 22). Here, in this study, the data-driven analysis was conducted on the ECE program where data was collected daily over 2 years from an ECE center in Ontario, where all statistical analysis is performed using Python.
3. Objectives
We would like to contribute a new ECE dataset, which is collected from an ECE center with 11 locations in Ontario, from January 2017 to December 2019.
We also would like to develop both exogenous and endogenous approaches to evaluate ECE program performance. In the exogenous approach, we compare the performance of children in an ECE program against the NDDS standards in every one of the five domains: social, emotional, communication, cognition, and physical (23). In the endogenous approach, we compare the performances of the children with different entry ages into the same ECE center, i.e., we test whether children with longer ECE education (Cohort 1) perform better than children with shorter ECE education (Cohort 2).
Both exogenous and endogenous approaches provide us with an informative evaluation of ECE programs. The exogenous approach answers whether children in an ECE program could outperform the NDDS expectations; and the endogenous approach answers whether children with a longer ECE education master social, emotional, communication, cognitive, and physical skills faster.
4. Data description and processing
4.1. Data description
The data was collected by the teachers in the Learning Jungle ECE center with 11 locations in Ontario from January 2017 to December 2019. They recorded the dates of the first observations of various skills from ECE students as the skill label and date tuples. The systematic NDDS labeling system was strictly followed, where each performance label has four digits, such as “1.1.9.4.” The first digit represents one of the five domains: Domain 1-Social, Domain 2-Emotional, Domain 3-communication, Domain 4-Cognition, and Domain 5-Physical developments. The second digit denotes the subdomain. There is no specific meaning for the subdomain. The third digit represents a skill. There are 14, 14, 34, 42, and 61 skills for these five domains, respectively. The last digit denotes a specific indicator. There are 149, 147, 230, 281, and 331 indicators for these five domains, respectively. For example, “1.1.9.4” stands for “approaching adults as sources of security and support” in Domain 1.
Nipissing District Developmental Screen provides the expected date of first observations for each label, while our real dataset collected the actual observation dates for individuals. For example, NDDS shows that “1.1.9.4.” shall be expected in the 36-month, and our dataset has actual records on when “1.1.9.4.” were observed for different ECE students. Table 1 lists label to be expected at the 36th month by NDDS and relevant to our dataset. Also note that NDDS only associate labels with nominal 2nd, 4, 7, 9, 12, 18, 24, 30, 36, 48, 60th, or 72nd months.
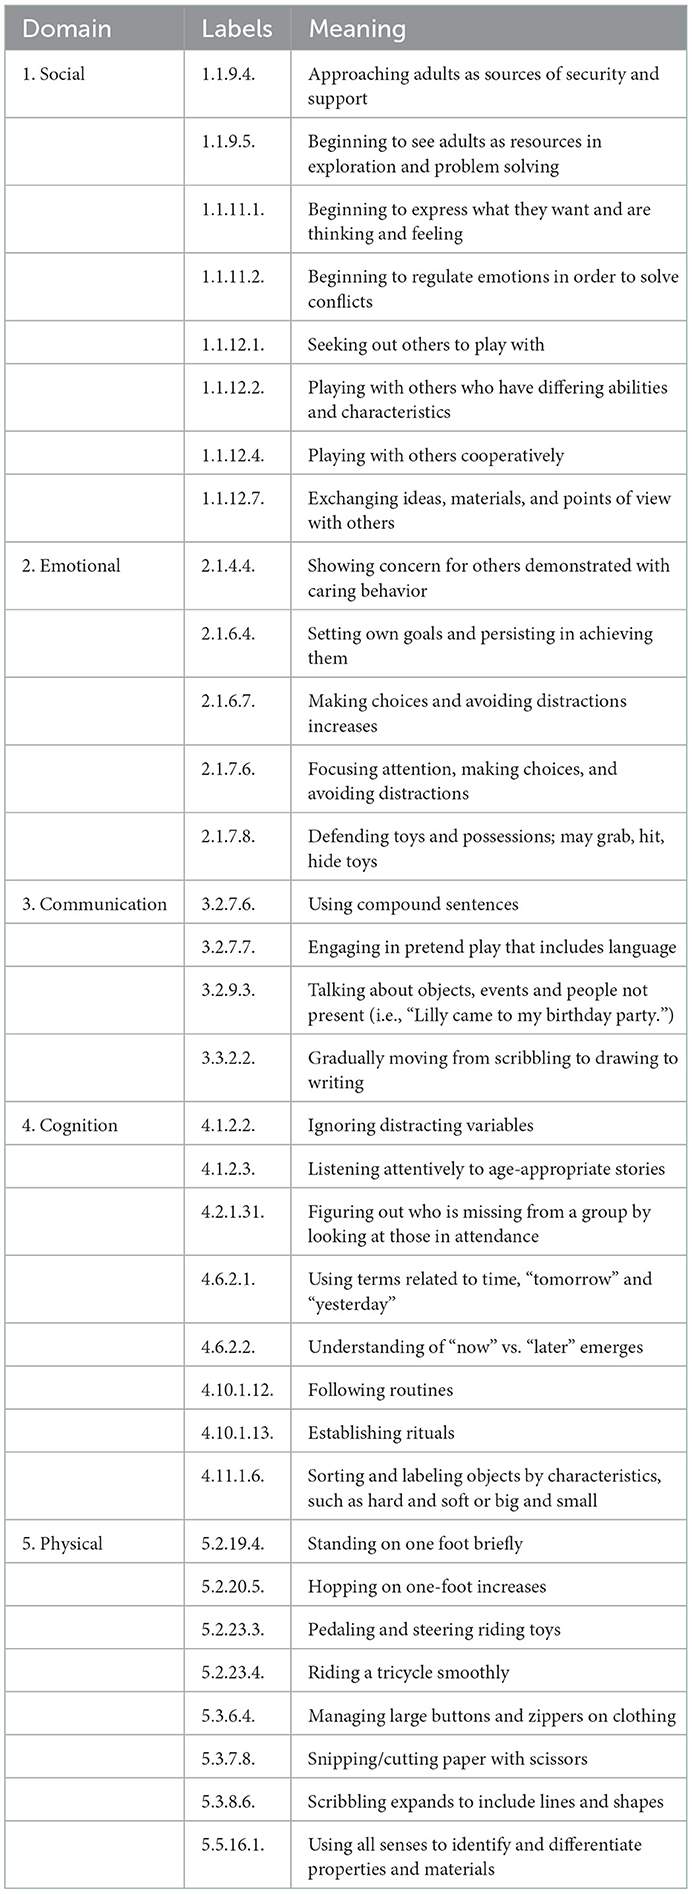
Table 1. Labels and meanings.
4.2. Data processing
We verified and cleaned the dataset with records for 332 students. We first selected 248 students who enrolled in the ECE earlier than the 30th month and then stayed longer than 6 months, since students with shorter ECE experience are unlikely to show educational efficacy. We further selected records whose labels are expected at the 36th month as in NDDS, such as “1.1.9.4.” Records with performance labels associated with nominal 2nd, 4, 7, 9, 12, 18, 24, and 30th months are not as indicative as the labels associated with the nominal 36th due to the experience prior to the ECE education. Records with labels associated with the nominal 48, 60th, or 72nd months are rare since most children left ECE centers by the age of 4 years, hence, there are not sufficient records to establish conclusions for these performance labels. After these filters, 33 performance labels remained in the dataset, which is listed in Table 1. We further averaged the observation ages within each of the five domains. Table 2 shows a few representative rows from our final dataset. For example, entry 25.5 in the column “Domain 1/emotional” in the row with student ID “101” means the average time when the student with ID 101 first demonstrated any “emotional” performance labels as observed by teachers.
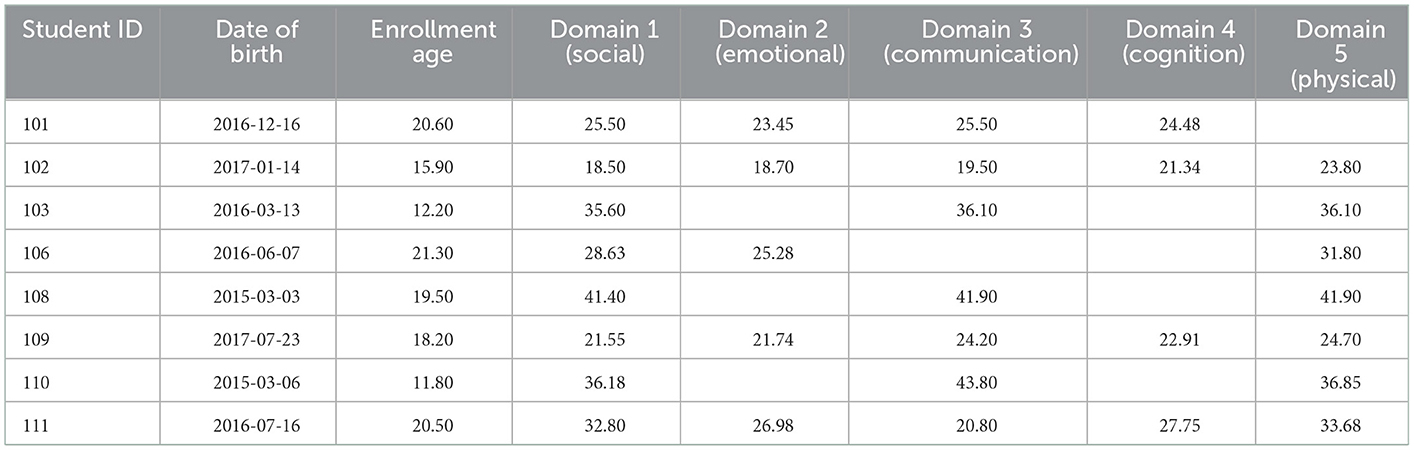
Table 2. Average observation ages (months) from each domain.
We note that there are missing values in Table 2, for example, the entry associated with student 101 and domain 5 (physical) is empty, which indicates that teachers did not observe any activities as listed in domain 5 of Table 1 for the student 101 before the student left the program. Since there are plenty of labels in domain 5 and none of them were observed, it is reasonable to conclude that student 101 has not made physical development typically expected by the 36th month at the time the student left the program. Hence, the missing value is not an indicator of data quality; the missing value means the expected event has not happened yet. Due to the absence of students on observation day or early withdrawal from the ECE program, the missing data percentage at the indicator level ranges from 24 to 91%. This is the main reason why our analysis is focused on the Domain level. At the Domain level, the missing percentage in five domains is from 16 to 44%. In our analysis, we treat missing entries as right censored data in survival analysis and handle it with mean imputation for the t-test.
In the endogenous approach, we split students into two cohorts. The infant cohort (1), which has 37 students, entered the ECE program at the age of 18 months or earlier; the toddler cohort (2), which includes 50 students, started at the age between 18 and 30 months.
5. Statistical analysis
As laid out in our objectives, we conduct both the exogenous and the endogenous statistical analysis. In the exogenous approach, we visualize the observation ages (in the month) of children with ECE experience in five domains by using violin plots. Violin plots can display the distribution of observation ages—“minimum,” “first quarter,” “median,” “third quarter,” and “maximum,” as well as a kernel density, which shows the peaks in the data. It is a quite straightforward method to visualize the comparison between the observation ages of ECE children and the NDDS age labels. We add 36-month NDDS age labels in these violin plots for easy comparisons. Then we apply the one-sided proportion test to provide further statistical evidence on whether the proportion of students who master 36-month skills is larger than 75%. The null hypothesis is that the proportion of the population who have mastered 36-month skills at 36 months is equal to 75%; the alternative hypothesis is that the proportion is larger than 75%. NDDS only says that “most” of the children should catch these skills at the age of 36 months; hence, we choose the 75% as “most” for the purpose of developing a rigorous statistical analysis. We note that the same statistical analysis could be applied to other percentages equally well should 80%, 85%, or other percentages be perceived as “most” in the NDDS in different contexts or for different purposes.
In the endogenous approach, the descriptive statistics, i.e., means, medians, and standard deviations are summarized for five domains and both cohorts, and the mean observation ages are visualized in the result section. The distribution of observation ages in each domain is assessed by histograms. To test whether the mean observation age of Cohort 1 is younger than that of Cohort 2, we perform one-sided two-sample Welch's tests on these five domains. In each test, the null hypothesis is that the mean observation age of Cohort 1 equals that of Cohort 2, the alternative hypothesis is that the mean observation age of Cohort 1 is smaller than that of Cohort 2. Welch's t-test is a univariate test and does not consider the correlation between variables. Therefore, we further conduct Hotelling's T2-test, which is a multivariate generalization of the t-test and is able to tell whether the mean observation ages of two cohorts on all domains are different.
While two tests in the endogenous approach provide convincing evidence of the difference between the two cohorts, we would like to further investigate what is the exact difference. Hence, we performed a deeper statistical analysis: survival analysis, which is a good method for handling the missing values in our case. One goal is to investigate the effect of ECE start age on skills master age, and the other goal is to find the pattern of indicator observation ages in both cohorts and compare the probability patterns between the two cohorts by time.
Survival analysis is a typical statistical analysis approach for analyzing the expected duration of time until one or more events happen. It provides intuitive results concerning time-to-event for events of interest (24). The Cox Proportional-Hazards Model is one such type of survival analysis. It is a linear model for the log of the hazard ratio. By using this method, we can investigate the association between the ECE experience, and the indicator observation ages. Our records are essential “time to event.” An observation time was recorded when a label was observed on an ECE student. The empty cell in the dataset is considered as right censoring since it represents the corresponding skill that has not been observed until the student left the ECE program. We fit the Cox Proportional-Hazards Model to our dataset and plot the predicted survival curves for two cohorts on each domain.
6. Results
6.1. Results of exogenous analysis
Figure 1 is the violin plots of the observation ages on 36-month labels in five domains against the nominal 36-month. It is clear to see that the observation ages for most students are smaller than 36 months, while a few outliers exist for domains 2, 3, and 4.
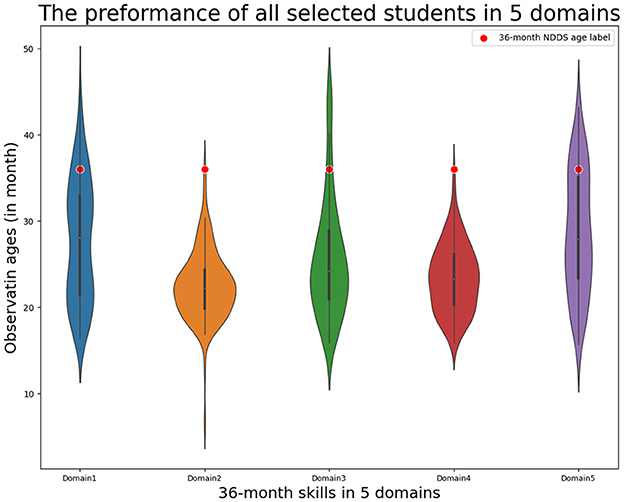
Figure 1. Violin plots of 36-month skills observation ages against NDDS age label.
Table 3 shows the p-value of the one-sided proportion test on all five domains. The p-values in all domains are much smaller than 0.05. Therefore, we are very confident to say the proportion of the population with ECE experiences who have mastered 36-month skills in each domain is larger than that in NDDS (75%). In other words, children with ECE experiences have a higher probability to master 36-month skills faster than the children in the general population.

Table 3. P-value of one-sided proportion test on five domains.
6.2. Results of an endogenous analysis
Table 4 summarizes the average 36-month skills observation ages of two cohorts and their corresponding differences in five domains, and Figure 2 visualizes the result. It is very clear to see that the students in Cohort 1 mastered the 36-month skills earlier than that of Cohort 2 in all five domains. On average, Cohort 1 students were 4.82 months ahead of Cohort 2 students. Especially in Domain 1, the students in Cohort 1 achieved the goal almost 6 months earlier than the students in Cohort 2. This implies that the extra 10.11 months of ECE education could boost the students' development.
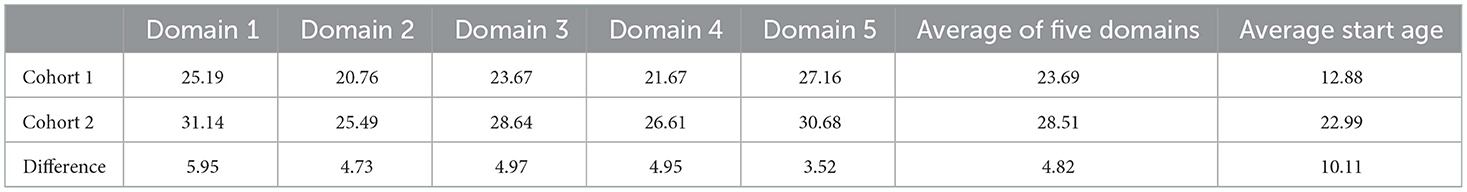
Table 4. The average observation ages (in the month) in each domain of two cohorts.
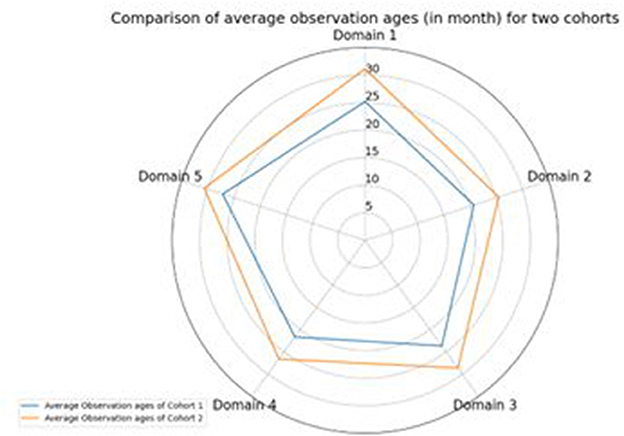
Figure 2. Radar chart for average observation ages of two cohorts.
Welch's t-test is shown in Table 5, and p-values in all five domains are far smaller than 0.05. Thus, there is strong evidence to reject the null hypothesis and be in favor of the alternative hypothesis. In other words, we are very confident to say the average 36-month skills observation ages of Cohort 1 are smaller than that of Cohort 2, i.e., the students who enrolled in the ECE program earlier mastered 36-month skills faster than those who enrolled in the ECE program later.

Table 5. One-sided Welch's t-test P-value.
The p-value of Hoteling's T2-test is 1.11E-16, which is far smaller than 0.05 as well. Therefore, we have very strong evidence to say that after taking into consideration the correlation among the five domains, the population average observation ages on all five domains between the two cohorts are significantly different.
Our Cox Proportional-Hazards Model analysis yields more details on the difference between the two cohorts. Figure 3 visualizes the predicted survival proportion and the 95% confidence interval of the two cohorts. It shows that the probability that a Cohort 1 student will not show 36-month skills is lower than that of Cohort 2, which shows that the skill development for Cohort 1 is faster than Cohort 2. Figure 3 shows that the result not only applies at the instant 36 months but also at any time. It also shows quantitatively how much difference in probability is throughout the period. Furthermore, we can clearly see that the 95% confidence intervals do not overlap in general, which implies a very strong result, which we will show in Table 5. By carefully investigating the overlaps on the confidence interval, we can also see that the biggest difference between the two Cohorts is from Domain 1 (Social), while there are more overlaps in Domain 5 (Physical). This could be interpreted by the fact that Cohort 1 students have a more social life in general. It is interesting that the same pattern can be seen consistently in Tables 3–5 as well.
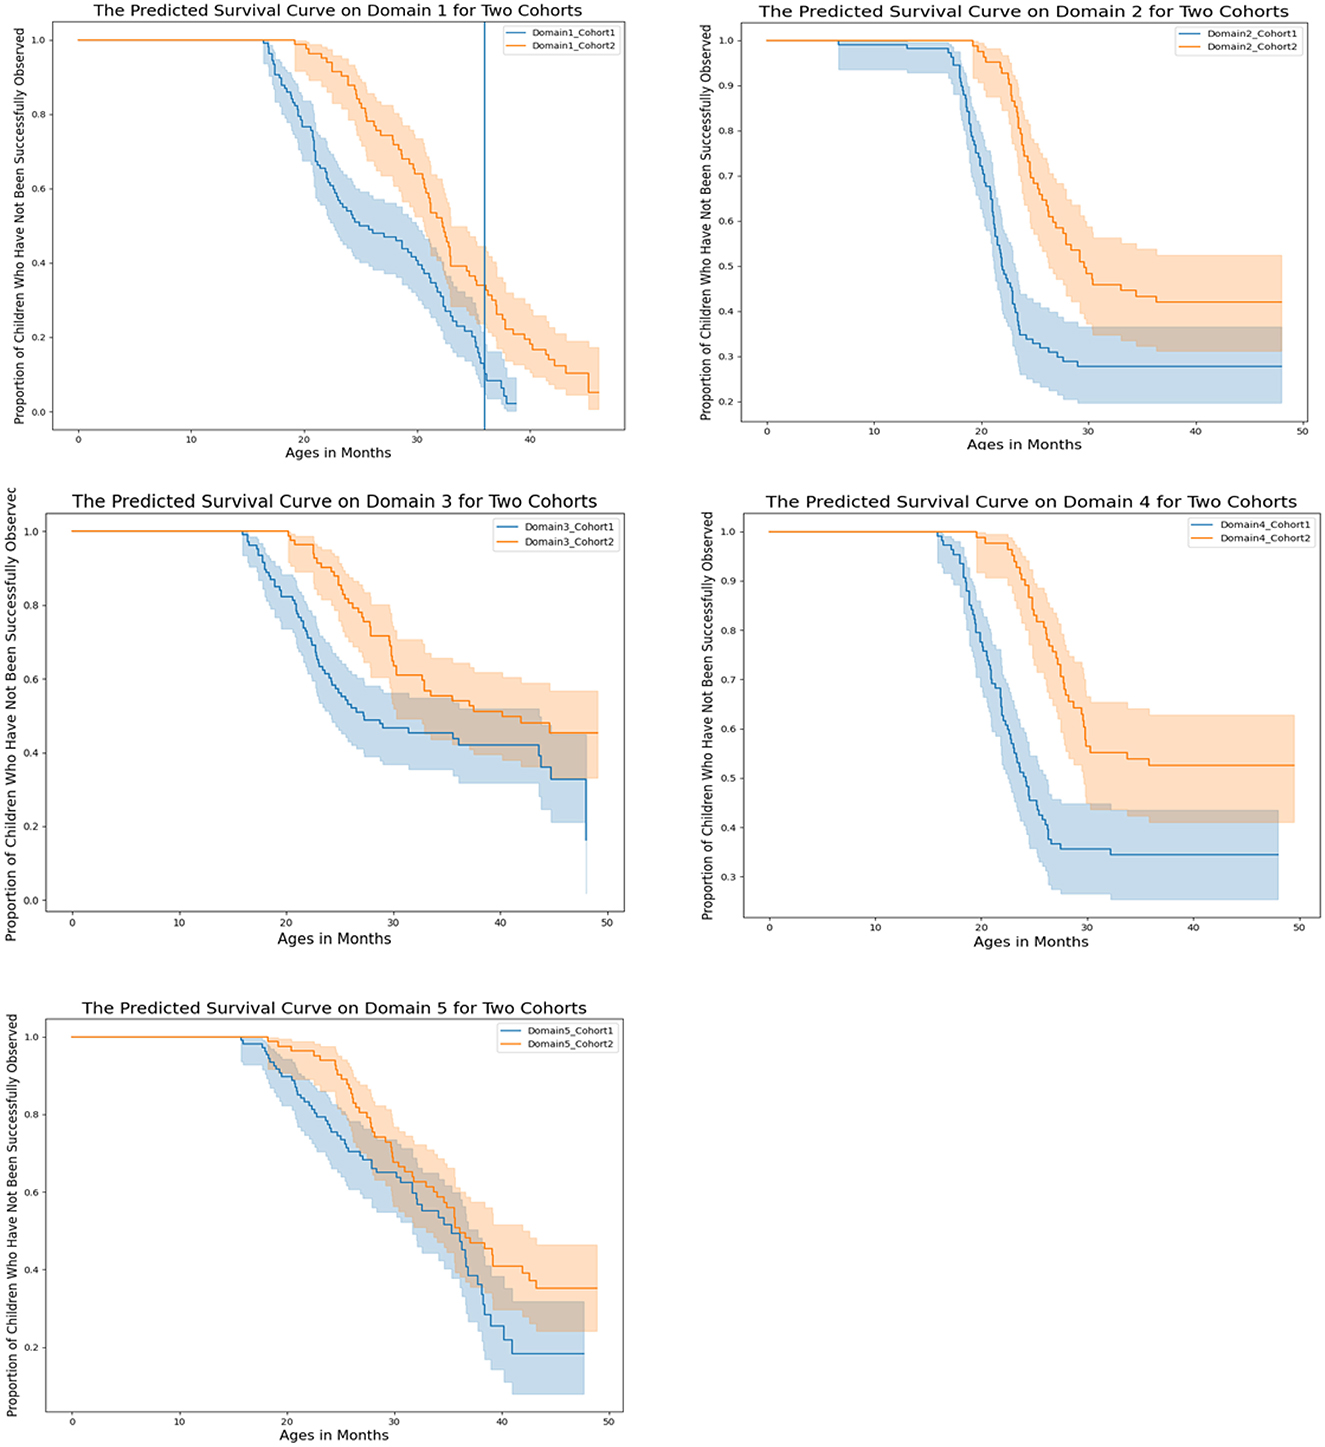
Figure 3. The predicted survival curves with Cox Proportional-Hazards Model on five domains for two cohorts.
Table 6 shows the technical details of our Cox Proportional-Hazards Model analysis, while Figure 3 provides the visualization. In Table 6, the row “Partial log-likelihood” provides the log-likelihood values for five domains. The row “coef” shows the fitted coefficients from the Cox Proportional-Hazards regression model. Taking Domain 1 as an example, “coef” = −0.76 indicates there is a lower probability to observe events in Cohort 2 than in Cohort 1. The row “Hazard Ratio” shows the hazard ratio for Cohort 2 relative to Cohort 1. Taking the example of Domain 1, the “Hazard Ratio” = 0.47 means Cohort 2 has a lower hazard, or chance of observation. The row “se(coef)” represents the standard deviation of the fitted coefficient, from which the consequent rows “coef lower 95%, coef upper 95%, exp(coef) lower 95%, and exp(coef) upper 95%” are derived. The row “z-value” gives the Wald statistic value and tells whether the fitted coef is statistically significantly different from zero. The row “p-value” provides a measure of confidence in the fitted coefficient. Taking the example of Domain 1, the 95% confidence interval for hazard ratio, “(−1.10, −0.43),” does not contain zero, and the p-value is < 0.005, which represents strong confidence. “Concordance” is known as the c-index, which is a measurement of goodness-of-fit for this model. Fitted survival models typically have a concordance index between 0.55 and 0.75 (25). The higher score stands for better fitness. The concordance index in the result of Domain 1 is 0.61, which is between 0.55 and 0.75, and we get a good fit for all other domains as well.
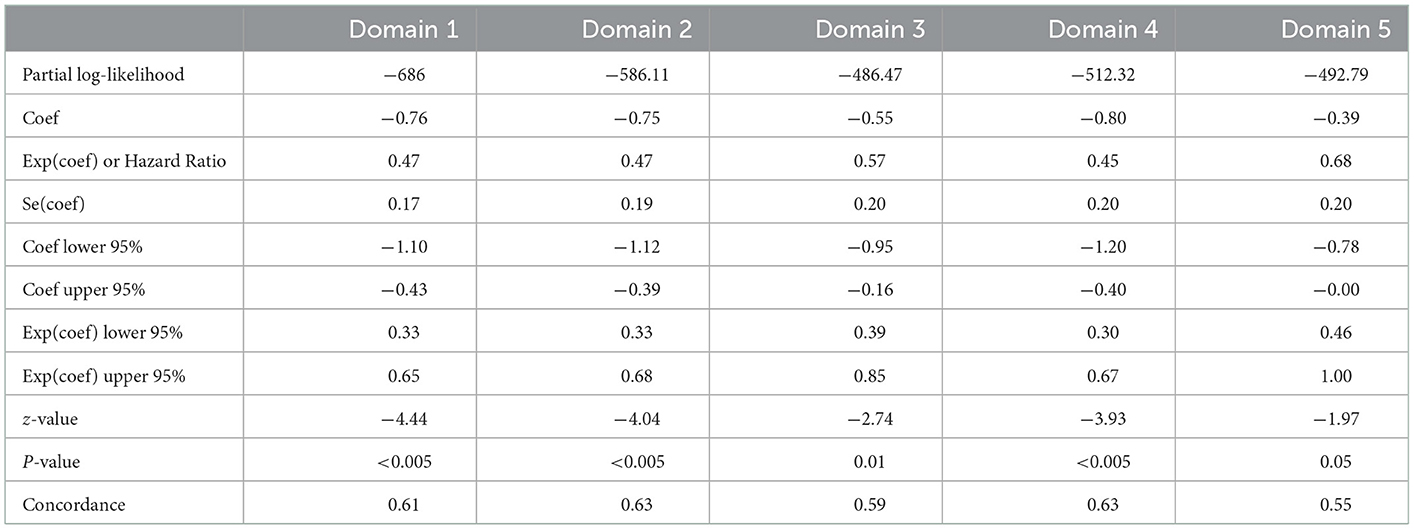
Table 6. Summary of Cox Proportional-Hazards Model on all domains.
7. Discussion/conclusion
From the violin plots visualization and proportion test results in the exogenous comparison, we can conclude that a child with ECE experiences performs better on 36-month skills in social, emotional, communication, cognition, and physical domains than a generic child as described by NDDS.
The result from endogenous comparisons shows that students who started the ECE program earlier mastered these 36-month skills faster than those who enrolled in ECE program later. This implies that a curriculum designer shall consider “program starting ages” when designing the learning content. Particularly, it is not always correct to assign students with similar ages similar learning materials if they started the program at different ages. The curriculum shall be highly adaptive as we see from the analysis that Cohort 2 is slower than Cohort 1 by 4.82 months on average, which is long enough to justify different curriculums for students of similar true ages but different starting ages.
Since the right censoring is included in the Cox Proportional-Hazards model and rates of centering are different among the five domains, we had concerns that the high rate of censoring may lower the accuracy and effectiveness of the analysis. Ying et al. (26) established that when the censored rate is as high as 84%, it severely influences the accuracy of results. However, the censored rates of our dataset are 16, 33.5, 44, 42, and 42% for Domains 1, 2, 3, 4, and 5 separately, which are much smaller than 84%. Hence, the results of survival curves in the five domains are reliable.
This study demonstrates the better performances in terms of 36-month skills of children with ECE experiences and the obvious improvement in skills development speed for children with earlier ECE enrollment. It is desirable to extend this conclusion to other skills in 12, 18, or 30 months. Therefore, to establish more generic results on a wider age range of skills, more data from longer observation periods on more students are needed in the future study. Furthermore, there are multiple factors that affect the performances of young children such as the quality of childcare centers and family education. Hence, more data and more analysis on more factors shall help describe the full picture of ECE education efficacy.
Data availability statement
The raw data supporting the conclusions of this article will be made available by the authors, without undue reservation.
Author contributions
SC and HZ contributed to conception and design of the study. RL, ZL, and YH prepared database and performed the statistical analysis. SC and GL provide advice on analysis interpretation. RL wrote the first draft of the manuscript. All authors contributed to manuscript revision, read, and approved the submitted version.
Funding
This research study was financially supported by Mathematics of Information Technology and Complex Systems and Devhaus Technologies.
Acknowledgments
We would like to sincerely thank colleagues from Devhaus Technologies for zealous discussions on every aspect of the research.
Conflict of interest
GL, ZL, and YH were employed by Devhaus Corporation.
The remaining authors declare that the research was conducted in the absence of any commercial or financial relationships that could be construed as a potential conflict of interest.
Publisher's note
All claims expressed in this article are solely those of the authors and do not necessarily represent those of their affiliated organizations, or those of the publisher, the editors and the reviewers. Any product that may be evaluated in this article, or claim that may be made by its manufacturer, is not guaranteed or endorsed by the publisher.
References
1. Mehta S,. Model Teaching Methods – It‘s Time for the Change. The Voice of Higher Education. (2022). Available online at: https://eduvoice.in/modern-teaching-methods/#0-what-is-modern-teaching (accessed December, 2020).
2. Vandenbroeck M, Lenaerts K, Beblavy M. Benefits of Early Childhood Education and Care and the Conditions for Obtaining Them. EENEE Analytical Report No. 32. Luxembourg: European Expert Network on Economics of Education (EENEE) (2008).
3. Workman S, Ullrich R. Quality 101: Identifying the Core Components of a High-Quality Early Childhood Program. Washington, DC: Center for American Progress (2017).
4. Ontario Ministry of Education. Early Childcare and Annual Report. (2019). Available online at: https://files.ontario.ca/edu-early-years-and-child-care-annual-report-2019-en-2021-03-19.pdf (accessed November, 2020).
5. Blatchford P, Bassett P, Brown P. Examining the effect of class size on classroom engagement and teacher-pupil interaction: Differences in relation to pupil prior attainment and primary vs. secondary schools. Learn Instr. (2011) 21:715–30. doi: 10.1016/j.learninstruc.2011.04.001
6. Morrison A,. Eight Reasons Why the Traditional Education System Is Broken. ZaranTech Training. (2019). Available online at: https://www.zarantech.com/blog/eight-reasons-why-the-traditional-education-system-is-broken/ (accessed December, 2020).
7. Marge A. On Formative Assessment: Readings From Educational Leadership (EL Essentials). ISBN-13: 978-1-4166-2230-7, Alexandria. Alexandria: ASCD (2016).
8. Organization for Economic Co-operation and Development. OECD Reviews of Evaluation and Assessment in Education OECD Reviews of Evaluation and Assessment in Education. Portugal: Czech Republic (2012). p. 145–6. doi: 10.1787/9789264172647-8-en
9. Limbos MM, Joyce DP, Roberts GJ. Nipissing District Developmental Screen: Patterns of use by physicians in Ontario. Canadian Fam Phys Medecin de famille canadien. (2010) 56:e66–72.
10. Community-University Community-University Partnership for the Study of Children Youth and Families. Review of the Nipissing District Developmental Screen (NDDS). Edmonton, AB: Community-University Partnership for the Study of Children, Youth, and Families (2011).
11. Nipissing District Developmental Screen,. Looksee Checklist. NDDS (2021). Available online at: https://www.peelregion.ca/health/professionals/pdfs/ndds-18-months-2011.pdf (accessed November, 2020).
12. Barnett WS, Belfield C. Early childhood development and social mobility. Fut Child. (2006) 16:73–98. doi: 10.1353/foc.2006.0011
13. Erickson J,. Measuring the Long-Term Effects of Early, Extensive Day Care. (2018). Available online at: https://ifstudies.org/blog/measuring-the-long-term-effects-of-early-extensive-day-care/ (accessed June 23, 2020).
14. U.S. Department of Health and Human Services. The NICHD Study of Early Child Care and Youth Development: Findings for Children up to Age 4 ½ Years. Washington, DC: U.S. Department of Health and Human Services (2006).
15. NICHD Early Child Care Research Network. Age of entry to kindergarten and children's academic achievement and socioemotional development. Early Educ Develop. (2007) 18:337–68. doi: 10.1080/10409280701283460
16. Alice B, Roberts-Holmes G. The Datafication of Primary and Early Years Education: Playing with Numbers. Abingdon, Oxon, Routledge (2018). doi: 10.4324/9781315279053
17. Government Government of Canada S,. National Longitudinal Survey of Children and YOUTH (NLSCY). (2010). Available online at: https://www23.statcan.gc.ca/imdb/p2SV.pl?Function=getSurvey&Id=56797#a2 (accessed April 03, 2021).
18. Cleveland G, Colley S, Friendly M, Lero DS. The State of Data on Early Childhood Education and Care in Canada: National Data Project Final Report. ISBN 1-896051-26-X. Toronto: Childcare Resource and Research Unit. (2003).
19. Vlach HA, DeBrock CA. Statistics learned are statistics forgotten: Children's retention and retrieval of cross-situational word learning. J Exp Psychol. (2019) 45:700–11. doi: 10.1037/xlm0000611
20. Aleman H. Early-life environmental exposures and childhood growth: A comparison of statistical methods. PLoS ONE. (2018) 13:209321. doi: 10.1371/journal.pone.0209321
21. Zweig J, Irwin, CW, Kook, JF, Cox, J,. Data Collection Use in Early Childhood Education Programs: Evidence From the Northeast Region (REL 2015–084). Washington, DC: U.S. Department of Education, Institute of Education Sciences, National Center for Education Evaluation Regional Assistance, Regional Educational Laboratory Northeast & Islands. (2015). Available online at: http://ies.ed.gov/ncee/edlabs (accessed December, 2020).
22. Barton JL, Akin BA. Implementation drivers as practical measures of data-driven decision-making: An initial validation study in early childhood programs. Glob Implement Res Appl. (2022) 2:141–52. doi: 10.1007/s43477-022-00044-5
23. Curtin M, Browne J, Staines A, Perry IJ. The early development instrument: An evaluation of its five domains using Rasch analysis. BMC Pediatr. (2016) 16:10. doi: 10.1186/s12887-016-0543-8
24. Junyong I, Lee DK. Survival analysis: Part I - analysis of time-to-event. Kor J Anesthesiol. (2018) 71:182–91. doi: 10.4097/kja.d.18.00067
25. LIFELINES. “Survival regression.” 2014-2021. (2021). Available online at: https://lifelines.readthedocs.io/en/latest/Survival%20Regression.html# (accessed December, 2020).
26. Ying S, Wen-Fei L, Nian-Yong C, Ning Z, Guo-Qing H, Fang-Yun X, et al. Induction chemotherapy combined with concurrent chemoradiotherapy versus simple concomitant chemoradiotherapy for locoregionally advanced nasopharyngeal carcinoma. Chin J Clin Oncol. (2013) 40:202–7. doi: 10.1016/S1470-2045(16)30410-7
Keywords: Early Childhood Education (ECE), statistical analysis, survival analysis, Welch's t-test, Hoteling's T2-test
Citation: Liang R, Zhu H, Lawson G, Lian Z, Huang Y and Chen S (2023) Early childhood learning analytics: A case study of Learning Jungle. Front. Appl. Math. Stat. 8:1075653. doi: 10.3389/fams.2022.1075653
Received: 20 October 2022; Accepted: 26 December 2022;
Published: 25 January 2023.
Edited by:
Qiang Wu, Middle Tennessee State University, United StatesReviewed by:
Yunlong Feng, University at Albany, United StatesXin Yang, Middle Tennessee State University, United States
Copyright © 2023 Liang, Zhu, Lawson, Lian, Huang and Chen. This is an open-access article distributed under the terms of the Creative Commons Attribution License (CC BY). The use, distribution or reproduction in other forums is permitted, provided the original author(s) and the copyright owner(s) are credited and that the original publication in this journal is cited, in accordance with accepted academic practice. No use, distribution or reproduction is permitted which does not comply with these terms.
*Correspondence: Rui Liang,  cmF5bmEubGlhbmdAZ21haWwuY29t; Shengyuan Chen, Y2hlbnN5QHlvcmt1LmNh