
95% of researchers rate our articles as excellent or good
Learn more about the work of our research integrity team to safeguard the quality of each article we publish.
Find out more
ORIGINAL RESEARCH article
Front. Appl. Math. Stat. , 01 October 2021
Sec. Mathematical Biology
Volume 7 - 2021 | https://doi.org/10.3389/fams.2021.760259
This article is part of the Research Topic Data Driven Modeling in Mathematical Biology View all 7 articles
A mathematical model of the dengue epidemic in the Philippines is developed to analyse the vaccination of children in 2016–2017. Reported case data and reported mortality data from the Philippines Department of Health is used to analyze quantitatively this vaccination program. The model compares the epidemic outcomes of no vaccination of children, vaccination only of previously infected children, and vaccination of all children.
Dengue infections have increased world-wide in recent years, and dengue incidence currently affects approximately 400 million people and causes approximately 20,000 deaths each year [1]. Dengue vaccines have been developed in recent years and tested in clinical trials, and offer hope that dengue epidemics may be mitigated. A controversy, however, surrounds dengue vaccine. This controversy is associated with dengue antibody-dependent enhancement (ADE). Dengue ADE occurs after a primary dengue infection. The primary infection promotes the production of antibodies in the immune system, which are specific to the strain of the dengue virus, trap and kill this strain in the blood, and can remain in the blood for decades [2]. Dengue virus is present in four strains, and the antibodies specific to the strain of the primary infection cannot bind well with a secondary infection of a different strain. Instead, these antibodies may promote replication of a secondary infection of a different strain, with much greater disease severity than the primary strain infection.
Clinical studies have shown that dengue vaccination may mimic a primary infection, and thus promote ADE in someone who has not had a primary infection before vaccination, but has a primary infection after vaccination [3]. Clinical studies have also shown that the vaccination of someone who has previously been infected, does not have higher risk of death if a secondary infection subsequently occurs. We examine these issues surrounding dengue vaccination in the context of the dengue vaccination program in the Republic of the Philippines in 2016 and 2017.
In the Philippines, reported dengue deaths average approximately 750 people per year, with a high proportion of these deaths in younger age groups. In April 2016, the Philippines began a dengue vaccination program of 9 years old children. The program involved approximately 875,000 9 years olds, each receiving at least one dose, approximately 400,000 receiving two doses, and approximately 350,000 receiving all three doses [4, 5]. The program was terminated in December 2017, because of 12 confirmed deaths due to dengue infection of these vaccinated children [6]. As of September, 2018, 19 dengue deaths of vaccinated children had been confirmed [7]. At issue is whether these deaths were due to ADE and the failure of the vaccine to prevent a subsequent infection, and was the vaccination program justified.
In our References we have listed mathematical modelling treatments of dengue epidemics [1–5, 7, 10–23, 24–26, 34–43, 23–48, 49–55]. Our objective is to employ a mathematical model for the vaccination of a population of 875,000 9 years old children, beginning April 4, 2016 and ending December, 2017 (the period of the vaccination program) to provide understanding of this issue. We will use data from the Philippines Department of Health [8] to analyze the following scenarios: 1) vaccination of all the children in this population during this time period; 2) no vaccination of the children in this population during this time period; 3) vaccination only of previously infected children in this population during this time period. We will compare the numbers of reported cases and reported deaths in the first scenario with reported cases and reported deaths as projected by our model for the second and third scenarios.
The epidemic data is from Philippines Department of Health, Epidemiology Bureau, Public Health Surveillance Division [8]. The weekly reported cases for all ages in 2016, 2017, 2018 is given in Supplementary Figure S1 (Supplementary Materials). Reported case data for each of the years 2016, 2017, 2018 is given in the Supplementary Materials. Reported case data for 2016 is given in Supplementary Figures S2, S3, S8. Reported case data for 2017 is given in Supplementary Figures S4, S5, S9. Reported case data for 2018 is given in Supplementary Figures S6, S7, S10. The data in Supplementary Figures S2–S7 is age structured according to 5 years brackets. This data does not account for asymptomatic infections nor low grade infections that are not reported. In the total Philippine population, 5–14 years olds constitute ≈23,000,000 [9]. We consider a population of 2,300,000 9 years olds in 2016, and a population of 2,300,000 8 years olds in 2016. We approximate the number of reported cases of 9 years olds in this population from April 3, 2016 to December 1, 2017, and the number of reported deaths of 9 and 10 years olds in this population from April 3, 2016 to September 30 in 2018.
In 2016, The total number of cases age 5 to 14 was 89,000 (Supplementary Figure S2). The total number of reported cases of ages 5 to 14 between April 3 and December 31 was
Similar calculations are given for 2017 and 2018 in Table 1. From Table 1 we obtain the following reported cases and reported deaths for 875,000 children who were 8 or 9 years old in 2016:

TABLE 1. Age structured data of the dengue epidemic in years 2016, 2017, 2018. The reported data is age structured according to 5–9 or 10–14 years age brackets. The data contains no information about the effects of vaccination of this population. The data is obtained from [8] and is provided in the Supplementary Materials.
2016, April 3 to December 31: Reported cases in 437,500 9 years olds:
2017, all year: Reported cases in 875,000 9 and 10 years olds:
2018, January 1 to September 30: Reported deaths in 875,000 10 and 11 years olds:
Thus, 37 reported deaths occurred in reported cases from April 3, 2016 to September 30, 2018, in 875,000 children who were 8 or 9 years old in 2016, according to the reported data in [8]. Since September 30, 2018, the Republic of the Philippines Department of Public Health has not provided further information about confirmed deaths due directly to dengue infection of the 875,000 vaccinated children.
The model consists of a system of ordinary differential equations for the subpopulations of susceptible, primary infected, secondary infected, recovered from primary infection, recovered from secondary infection, unvaccinated, vaccinated without previous infection, and vaccinated with precious infection in the population of 875,000 9 years old children. We assume that the primary infection and the secondary infection correspond to two different strains of the four strains of dengue virus. We do not distinguish these four strains specifically. The model equations, with time units in weeks, are
The compartments of the model are given in Table 2 and illustrated in Figure 1.
The parameters of the model are chosen to align with the dengue epidemic data in the Philippines in 2016, 2017, 2018 during the time period of vaccination (April 1, 2016 to December 1, 2017) and the time period of reported deaths of vaccinated children (April 1, 2016 to September 30, 2018). The time dependent infection rate α Λ(t) is specific to a population of 875,000 5–14 years olds, since infection rates are age-specific. The total weekly reported cases for all ages is given in Supplementary Figure S8 for 2016, Supplementary Figure S9 for 2017, Supplementary Figure S10 for 2018 [8]. Λ(t) is a cubic spline approximation of this total weekly reported cases for all ages, with a separate scaling factor for each of the years 2016, 2017, 2018, as in Table 1:
The graph of Λ(t) is given in Figure 2.
Λ(t) indirectly models the infection rate of these children due to mosquitoes. The seasonality of the mosquito population is incorporated indirectly into Λ(t). We do not model the mosquito population directly, but assume the mosquito infection rate of 5–14 years olds is proportional to the reported case data in this age range. The value of α is chosen so that the dynamics of the model equations yield the general epidemic data for ages 9, 10, 11, in 2016, 2017, 2018, respectively, and for the 19 reported deaths of vaccinated 875,000 9 years olds for whom the vaccination failed in the period April 2016 to September 2018.
The time dependent vaccination rate νS(t) of previously uninfected 9 years olds incorporates multiple doses. This parameter involves a rate per week corresponding to the vaccine-effectiveness. We first assume a weekly rate 0.06, which corresponds to 70% effectiveness overall (Figure 4). The vaccine-effectiveness percentage is controversial, and we will explore outcomes with other values [11–13]. We assume the time dependent vaccination rate νR(t) of previously infected susceptibles is the same as νS(t), and the fraction of vaccination effectiveness is also the same. The formula for νS(t) is
The time independent parameters of the model are given in Table 3. The recovery rates per week of infected individuals are β1, β2, βSV1, βSV2, βRV2, all equal to one, which means that the average period of symptomatic infection is approximately 1 week. The death rates per week of infected individuals are δ1, δ2, δSV1, δSV2, δRV2. It is assumed that deaths occur only during the periods of symptomatic infection. We assume that the death rate of unvaccinated secondary infection (δ2) is 10 times the death rate of unvaccinated primary infection (δ1). We assume that the death rate (δSV1) of vaccinated not previously infected, who become infected, is approximately 7 times the death rate (δ1) of unvaccinated primary infected [14]. The values of the parameters are determined by these assumptions and the fit of model solutions to reported data.
The number of previously infected in the population of 875,000 vaccinated 9 years olds is calculated according to the reported cases in the years 2008–2017. In any 2-years age bracket for these years there are ≈ 4,600,000 children in the Philippines [9]. For 2013, there were 186,000 reported cases in all ages and 72,000 cases ages 1 to 10 (Supplementary Figure S11). Thus, the number of reported cases in the age bracket {5, 6} in 2013 of vaccinated 9 years olds was
In the years 2008–2012, the data in [8] is non-specific to age. We extrapolate the data in Table 4 for these years by defining the function F(y) = 0.0168 y−265.856, as the least squares fit to the number of reported cases in the 2-years age brackets in Table 4, where y is the reported number for cases of all ages in the year of this age bracket. The graph of F(y) is given in Figure 3.
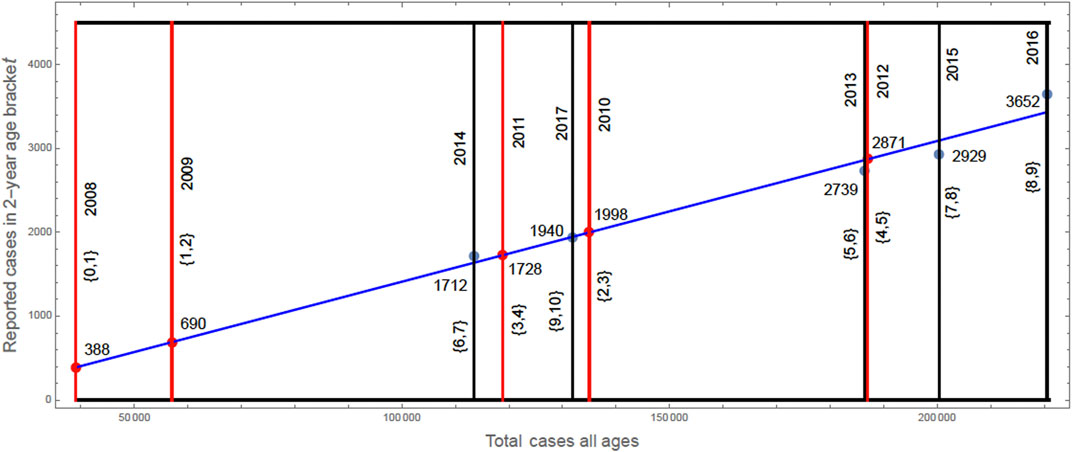
FIGURE 3. The graph of F(y), where y = 187,031 for 2012, y = 1,188,681 for 2011, y = 135,000 for 2010, y = 57,000 for 2009 [8], and y = 39,000 for 2008 [6].
The total number of reported previous infections for the population of 875,000 9 year olds is 388 + 690 + 1712 + 1728 + 1940 + 1998 + 2,739 + 2,871 + 2,929 + 3,652 × 1/2 ≈ 18, 821. This reported case data is adjusted to account for unreported cases. In [15] it is claimed that underreported cases are approximately 4.7 times the number of reported cases annually in the years 2010–2014 (we assume the number of reported deaths is accurate). We thus obtain 18, 821 × 4.7 ≈ 88, 500 previously reported cases in the population of 875,000 9 years olds. We set R1 (0) = 80, 000 and R2 (0) = 8, 500 to account for the cumulative number of previously infected, primary and secondary, in the population of 875, 000 8 and 9 years olds.
The initial conditions of the model (Table 5) are chosen to correlate with the data of reported cases and reported deaths of the population of vaccinated 875,000 8 and 9 years olds in the time period April 3, 2016 to December 1, 2017 (beginning to ending of the vaccination program) and April 3, 2016 to September 30, 2018 (beginning to ending to the reported deaths in this population). The initial conditions for the compartments of the model are approximately 95% of 875,000, because it is assumed approximately 5% of the vaccinated children will not be successfully monitored for infection.
The model output for the case that all 875,000 9 years olds are vaccinated is given below.
In Figure 4 the graph of the cumulative number of vaccinated is given. The vaccine efficiency is 70%, which is interpreted as failure of the vaccine to prevent infection in 30% of the vaccinated 875, 000 9 years olds.
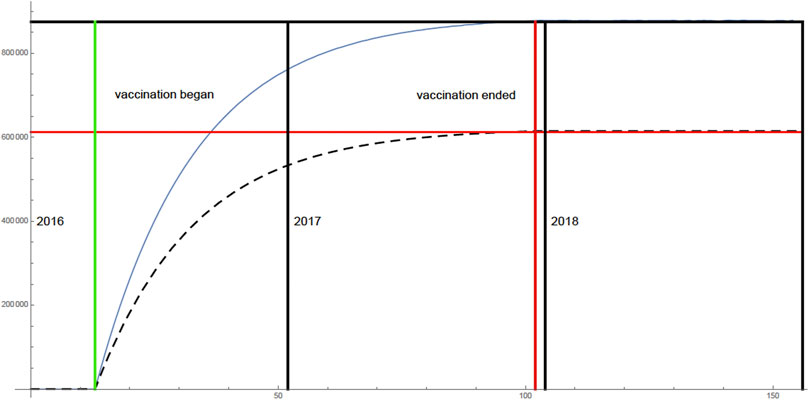
FIGURE 4. All 875,000 9 years olds are vaccinated. The cumulative number of vaccinated 9 years olds (top graph). At the end of the vaccination program, 70% of the 875,000 of the children vaccinated (612,500) were vaccine-effective (bottom graph).
In Figure 5 the graphs of the cumulative number of deaths each week of the 875,000 vaccinated 9 years olds is given for the compartments I1(t), I2(t), SVI1(t). The cumulative number of deaths in the compartments SVI2 and R1VI2 are negligible.

FIGURE 5. All 875,000 9 years olds are vaccinated. The cumulative number of deaths each week in the compartments I1(t), I2(t), SVI1(t). Most of the deaths occurred in vaccinated 9 year olds, who were not infected before vaccination, and became infected after vaccination as a result of vaccine failure (SVI1(t)).
In Figure 6 the graph of the cumulative number of all deaths each week of the 875,000 vaccinated 9 years olds is given. The number of all deaths in 2016, 2017, 2018 is ≈30. From the beginning of the vaccination program (April 4, 2016) to the date of the last reported deaths (September 2018), 19 of the deaths occurred in vaccinated 9 years olds, who were not infected before vaccination, and became infected after vaccination as a result of vaccine failure, which agrees with the number reported by the Philippines Department of Public Health during this time period.
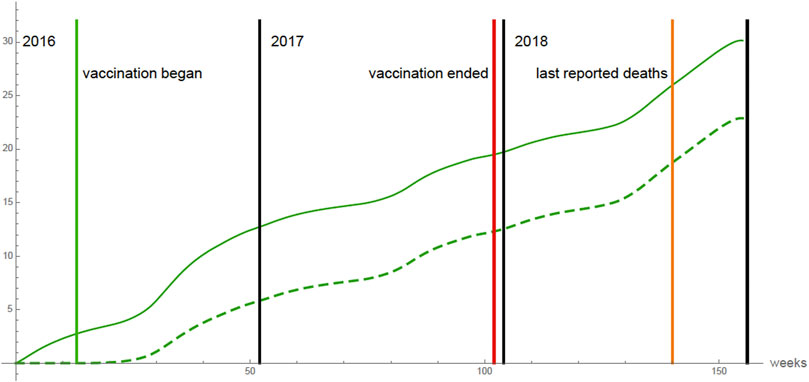
FIGURE 6. All 875,000 9 years olds are vaccinated. The cumulative number of all deaths each week of the 875,000 vaccinated 9 years olds in 2016, 2017, 2018 (top graph), and the vaccinated 9 years olds, who were not infected before vaccination, and became infected after vaccination as a result of vaccine failure (bottom graph).
The model output for the case that none of the 875,000 9 years olds are vaccinated is given below. The only change in the parameters is that νS(t) ≡ 0 and νR(t) ≡ 0. In Figure 7 the graph of the number of infected each week of the 875,000 (unvaccinated) 9 years olds is given. The number of secondary infected each week of these 875,000 9 years olds is ≈ 3.6% of the number of primary infected.
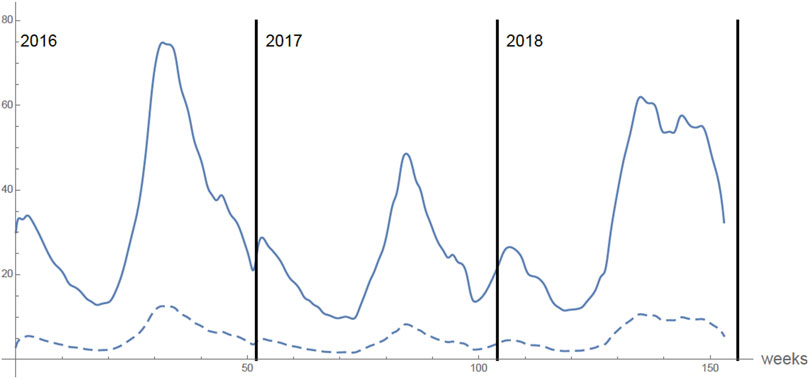
FIGURE 7. None of the 875,000 9 years olds are vaccinated. The number of infected each week of the 875,000 vaccinated 9 years olds in 2016, 2017, 2018. The top graph is the number of primary infections each week. The bottom graph is the number of secondary infections each week.
In Figure 8 the graph of the total cumulative number of all deaths each week of the 875,000 (unvaccinated) 9 years olds is given. The number of all deaths between the beginning of the vaccination program (April 4, 2016) and the last reported deaths (September 2018) is ≈ 30. The number of all deaths in 2016, 2017, 2018 is ≈ 40.
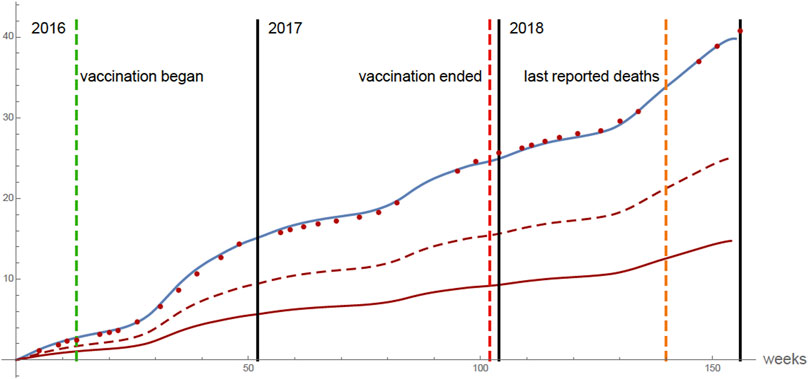
FIGURE 8. None of the 875,000 9 years olds are vaccinated. Top graph: cumulative total number of all deaths each week of the 875,000 (unvaccinated) 9 years olds. The red dots correspond to a scaling of the reported case data for total cases of all ages [8]. The scaling accounts for the total deaths of the 875,000 9 years olds in the population (the scaling factor is 0.014 as in Figure 4). Middle graph: cumulative total secondary infected deaths. Bottom graph: cumulative total primary infected deaths.
The model output for the case that only previously infected of the 875,000 9 years olds are vaccinated is given below. The change in the parameters is that νS(t) ≡ 0 and νR(t) = 0.06 for 13 ≤ t ≤ 102 and νR(t) = 0 otherwise.
In Figure 9 the graphs of the cumulative number of deaths each week in the case that only previously infected are vaccinated are given for the primary infected cases I1(t) and secondary infected cases I2(t). The cumulative number of deaths in the compartments SVI1, SVI2 and R1VI2 are negligible.
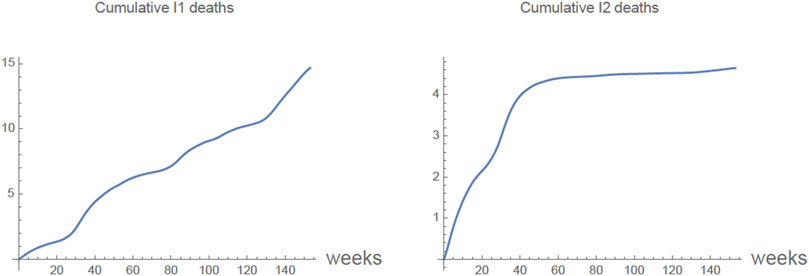
FIGURE 9. Only previously infected of the 875,000 9 years olds are vaccinated. The cumulative number of deaths each week of primarily infected I1(t) and secondary infected I2(t).
In Supplementary Figure S11 (Supplementary Materials) the graph of the total cumulative number of all deaths each week is given for the case that only previously infected are vaccinated. In this case the number of deaths between the beginning of the vaccination program April 4, 2016 and the last reported deaths September 2018 is ≈15. The number of all deaths in 2016, 2017, 2018 is ≈20.
In this section we vary the parameter f corresponding to the fraction of vaccinated for which the vaccine used in the Philippines was effective. The value of f depends on strain serotypes 1–4, specific locations, age levels at vaccination, serostatus, and other factors. Currently, new vaccines are being developed and undergoing clinical trials with possible improved efficacy. The World Health Organization has reported various efficacies from Phase 3 clinical trials, ranging from 43% to 79% [11].
In the example above, for the case that only previously infected are vaccinated, the percentage vaccinated was 70% (f = 0.7). In Supplementary Figure S12 (Supplementary Materials), for the case that only previously infected are vaccinated, the vaccine efficacy is 80% (f = 0.8). In Supplementary Figure S13 (Supplementary Materials), for the case that only previously infected are vaccinated, the vaccine efficacy is 60% (f = 0.6).
In all three examples of the model output (f = 0.6, f = 0.7, f = 0.8), the cumulative number of deaths is less for the vaccinated 875,000 children than the cumulative number of deaths without any vaccination. The number of cumulative deaths in the case that only previously infected children are vaccinated is approximately the same in all three examples. The number of cumulative deaths in the case that all children are vaccinated decreases proportionately as f increases. In Table 6, a comparison of model output for these cases is given. The unreported cases are assumed ≈5 times the number of reported cases, as in [15].
The dengue vaccination program in the Philippines, which began in April 2016, was halted in December, 2017, because of the number of deaths of vaccinated children that had occurred. A controversy surrounds this vaccination program, which has been claimed to be a disaster for the 875,000 9 years old children who were vaccinated [14]. The core issue in this controversy is the increased risk of severe dengue symptoms and deaths of vaccinated individuals who were previously uninfected. For dengue, a secondary infection, with a strain different from the primary infection, has greater symptoms severity [16]. It is claimed that vaccination for dengue mimics a primary infection, and a subsequent primary infection if the vaccine fails, acts like a secondary infection.
In 2018, WHO advised that prior screening for dengue infection was preferable, but if not feasible, general dengue vaccination programs could be administered to individuals age nine and older, if the population had a dengue endemicity rate higher than 80% [14]. In June 2021, the CDC Advisory Committee on Immunization Practices (ACIP) recommended use of Dengvaxia to prevent dengue in children aged 9–16 years, with laboratory-confirmed previous dengue virus infection and living in areas where dengue is common [17].
We have developed a model of the dengue vaccination program in the Philippines to provide understanding of the controversy surrounding this vaccination program. We used reported case data and reported mortality data from the Philippines Department of Health, to analyze quantitatively this vaccination program. We then reformulated our model to correspond to the case that no vaccination program had occurred or only previously infected children had been vaccinated. Our results our summarized in Table 4. We varied the vaccine efficacy rate as 60, 70, and 80%. For all three efficacy rates, the number of deaths was as high or higher without the vaccination of all 875,000 children. For all three efficacy rates, the number of deaths was also higher with the vaccination of only previously infected in the population of 875,000 children.
The vaccination program in the Philippines may have prevented a significant number of deaths, although a controversy still surrounds the issue of whether the vaccine itself contributed to some of the deaths of the children uninfected before vaccination. If these children had not been vaccinated, it is likely that they would not have died. The fundamental axiom of medicine is to do no harm. If the vaccine fails to prevent a subsequent infection resulting in death in someone who has not been previously infected, the vaccine has caused harm. But what is the threshold of harm, as opposed to the society benefit of the vaccine for prevention of deaths?
This issue relates to the current general controversy surrounding vaccination programs, and their distrust by some within our societies. The issue of vaccine hesitancy is of major concern in public health policies throughout the world [18–20]. Negative publicity concerning vaccination programs relating to severe illness and mortality in vaccinated individuals contributes to vaccine hesitancy. In the current COVID-19 pandemic, vaccine hesitancy is a major concern for advancing vaccination levels to sufficiently high percentages in order to control the epidemics throughout the world [21,22,27].
In general, if the vaccine efficacy is sufficiently high, then a consequent significant reduction in the number of deaths justifies the vaccination program in all age groups. A further consideration is the possibility of reducing the number of cases that occur in a dengue epidemic by vaccinating most or all individuals in all age groups in an on-going general vaccination program. The model analysis reveals that the total number of dengue cases are greatly reduced if all individuals are vaccinated, but not significantly reduced if only previously infected individuals are vaccinated. Thus, a general on-going vaccination program of all individuals could reduce the infected mosquito population, which would reduce the disease infection rate proportionately. Over time the dengue epidemic could be effectively eradicated.
Publicly available datasets were analyzed in this study. This data can be found here: https://doh.gov.ph/statistics.
All authors listed have made a substantial, direct, and intellectual contribution to the work and approved it for publication.
The authors declare that the research was conducted in the absence of any commercial or financial relationships that could be construed as a potential conflict of interest.
All claims expressed in this article are solely those of the authors and do not necessarily represent those of their affiliated organizations, or those of the publisher, the editors and the reviewers. Any product that may be evaluated in this article, or claim that may be made by its manufacturer, is not guaranteed or endorsed by the publisher.
The Supplementary Material for this article can be found online at: https://www.frontiersin.org/articles/10.3389/fams.2021.760259/full#supplementary-material
1. Aguiar, M, Stollenwerk, N, and Halstead, SB. The Risks behind Dengvaxia Recommendation. Lancet Infect Dis (2016) 16:882–3. doi:10.1016/S1473-3099(16)30168-2
2. Aguiar, M, Stollenwerk, N, and Halstead, SB. The Impact of the Newly Licensed Dengue Vaccine in Endemic Countries. PLOS Negl Trop Dis (2016) 10:e0005179. doi:10.1371/journal.pntd.0005179
3. Andraud, M, Hens, N, Marais, C, and Beutels, P. Dynamic Epidemiological Models for Dengue Transmission: A Systematic Review of Structural Approaches. PLOS One (2012) 7:e49085. doi:10.1371/journal.pone.0049085
4. Aguiar, M, and Stollenwerk, N. Dengvaxia Efficacy Dependency on Serostatus: A Closer Look at More Recent Data. Clin Infect Dis (2018) 66:641–2. doi:10.1093/cid/cix882
5. Billings, L, Fiorillo, A, and Schwartz, IB. Vaccinations in Disease Models with Antibody-dependent Enhancement. Math Biosciences (2008) 211:265–81. doi:10.1016/j.mbs.2007.08.004
6. Bravo, L, Roque, VG, Brett, J, Dizon, R, and L'Azou, M. Epidemiology of Dengue Disease in the Philippines (2000-2011): A Systematic Literature Review. PLOS Negl Trop Dis (2014) 8:e3027. doi:10.1371/journal.pntd.0003027
7. Carvalho, SA, da Silva, SO, and Charret, Id. C. Mathematical Modeling of Dengue Epidemic: Control Methods and Vaccination Strategies. Theor Biosci (2019) 138:223–39. doi:10.1007/s12064-019-00273-7
8.Centers for Disease Control and Prevention. Dengue Vaccine. Available at: https://www.cdc.gov/dengue/prevention/dengue-vaccine.html.
9.Centers for Disease Control and Prevention. Estimates of Vaccine Hesitancy a COVID-19 (2021). Available at: https://data.cdc.gov/stories/s/Vaccine-Hesitancy-for-COVID-19/cnd2-a6zw.
10. Chanprasopchai, P, Tang, IM, and Pongsumpun, P. SIR Model for Dengue Disease with Effect of Dengue Vaccination. Comput Math Methods Med (2018) 2018:1–14. doi:10.1155/2018/9861572
11. Chowell, G, Diaz-Dueñas, P, Miller, JC, Alcazar-Velazco, A, Hyman, JM, Fenimore, PW, et al. Estimation of the Reproduction Number of Dengue Fever from Spatial Epidemic Data. Math Biosciences (2007) 208:571–89. doi:10.1016/j.mbs.2006.11.011
12. de los Reyes, AA, and Escaner, JML. Dengue in the Philippines: Model and Analysis of Parameters Affecting Transmission. J Biol Dyn (2018) 12:894–912. doi:10.1080/17513758.2018.1535096
13. Esteva, L, and Vargas, C. Analysis of a Dengue Disease Transmission Model. Math Biosciences (1998) 150:131–51. doi:10.1016/S0025-5564(98)10003-2
14. Esteva, L, and Vargas, C. A Model for Dengue Disease with Variable Human Population. J Math Biol (1999) 38:220–40. doi:10.1007/s002850050147
15. Fatima, K, and Syed, NI. Dengvaxia Controversy: Impact on Vaccine Hesitancy, Edinburgh: J. Global Health (2018) p. 8. doi:10.7189/jogh.08-02031210.7189/jogh.08.020312
16. Feng, Z, and Velasco-Hernández, JX. Competitive Exclusion in a Vector-Host Model for the Dengue Fever. J Math Biol (1997) 35:523–44. doi:10.1007/s002850050064
17. Ferguson, NM, Donnelly, CA, and Anderson, RM. Transmission Dynamics and Epidemiology of Dengue: Insights from Age-Stratified Sero-Prevalence Surveys. Phil Trans R Soc Lond B (1999) 354:757–68. doi:10.1098/rstb.1999.0428
18. Cerón Gómez, M, and Yang, HM. A Simple Mathematical Model to Describe Antibody-dependent Enhancement in Heterologous Secondary Infection in Dengue. Math Med Biol (2019) 36:411–38. doi:10.1093/imammb/dqy016
19. Gulbudak, H, and Browne, CJ. Infection Severity across Scales in Multi-Strain Immuno-Epidemiological Dengue Model Structured by Host Antibody Level. J Math Biol (2020) 80:1803–43. doi:10.1007/s00285-020-01480-3
20. Guzmán, MG, Kouri, G, Bravo, J, Valdes, L, Vazquez, S, and Halstead, SB. Effect of Age on Outcome of Secondary Dengue 2 Infections. Int J Infect Dis (2002) 6:118–24. doi:10.1016/S1201-9712(02)90072-X
21. Halstead, SB, Lan, NT, Myint, TT, Shwe, TN, Nisalak, A, Kalyanarooj, S, et al. Dengue Hemorrhagic Fever in Infants: Research Opportunities Ignored. Emerg Infect Dis (2002) 8:1474–9. doi:10.3201/eid0812.020170
22. Hartley, LM, Donnelly, CA, and Garnett, GP. The Seasonal Pattern of Dengue in Endemic Areas: Mathematical Models of Mechanisms. Trans R Soc Trop Med Hyg (2002) 96:387–97. doi:10.1016/s0035-9203(02)90371-8
23. Hutabarak, E, Sianturi, P, and Bakhtiar, T. Mathematical Model of Dengue Infectious Diseases with Vector Control and Vaccination. Int J Eng Manag Res (2014) 6:56–9. ISSN : 2250-0758.
24. Larson, HJ, Jarrett, C, Eckersberger, E, Smith, DMD, and Paterson, P. Understanding Vaccine Hesitancy Around Vaccines and Vaccination from a Global Perspective: A Systematic Review of Published Literature, 2007-2012. Vaccine (2014) 32:2150–9. doi:10.1016/j.vaccine.2014.01.081
25. Larson, HJ, Hartigan-Go, K, and de Figueiredo, A. Vaccine Confidence Plummets in the Philippines Following Dengue Vaccine Scare: Why it Matters to Pandemic Preparedness. Hum Vaccin Immunother (2019) 15:625–7. doi:10.1080/21645515.2018.1522468
26. Larson, HJ, and Broniatowski, DA. Volatility of Vaccine Confidence. Science (2021) 371:1289. doi:10.1126/science.abi6488
27. Li, R, Xu, L, Bjørnstad, ON, Liu, K, Song, T, Chen, A, et al. Climate-driven Variation in Mosquito Density Predicts the Spatiotemporal Dynamics of Dengue. Proc Natl Acad Sci USA (2019) 116:3624–9. doi:10.1073/pnas.1806094116
28. Libatique, CP, Pajimola, AKJ, and Addawe, JM. Bifurcation Analysis of Dengue Transmission Model in Baguio City, Philippines. AIP Conf Proc (2017) 1905:030023. doi:10.1063/1.5012169
29. Manoff, SB, Sausser, M, Falk Russell, A, Martin, J, Radley, D, Hyatt, D, et al. Immunogenicity and Safety of an Investigational Tetravalent Recombinant Subunit Vaccine for Dengue: Results of a Phase I Randomized Clinical Trial in Flavivirus-Naïve Adults. Hum Vaccin Immunother (2019) 15:2195–204. doi:10.1080/21645515.2018.1546523
30. Mizumoto, K, Ejima, K, Yamamoto, T, and Nishiura, H. On the Risk of Severe Dengue during Secondary Infection: a Systematic Review Coupled with Mathematical Modeling. J Vector Borne Dis (2014) 51:153–64.
31. Nishiura, H, and Halstead, SB. Natural History of Dengue Virus (DENV)-1 and DENV‐4 Infections: Reanalysis of Classic Studies. J Infect Dis (2007) 195:1007–13. doi:10.1086/511825
32.Philippines Demographics. Worldometers (2021). www.worldometers.info/demographics/philippines-demographics.
33.Republic of the Philippines. Department of Health, Epidemiology Bureau, Disease Surveillance Division (2019). www.doh.gov.ph/statistics.
34. Pinho, STR, Ferreira, CP, Esteva, L, Barreto, FR, Morato e Silva, VC, and Teixeira, MGL. Modelling the Dynamics of Dengue Real Epidemics. Phil Trans R Soc A (2010) 368:5679–93. doi:10.1098/rsta.2010.0278
35. Pongsumpun, P, Tang, I-M, and Wongvanich, N. Optimal Control of the Dengue Dynamical Transmission with Vertical Transmission. Adv Differ Equ (2019) 2019:176. doi:10.1186/s13662-019-2120-6
36. Sardar, T, Rana, S, and Chattopadhyay, J. A Mathematical Model of Dengue Transmission with Memory. Commun Nonlinear Sci Numer Simulation (2015) 22:511–25. doi:10.1016/j.cnsns.2014.08.009
37. Shim, E. Optimal Dengue Vaccination Strategies of Seropositive Individuals. Math Biol Eng (2019) 16:1171–89. doi:10.3934/mbe.2019056
38. Shim, E. Dengue Dynamics and Vaccine Cost-Effectiveness Analysis in the Philippines. Amer J Trop Med Hyg (2016) 95:1137–47. doi:10.4269/ajtmh.16-0194
39. Song, H, Tian, D, Tian, D, and Shan, C. Modeling the Effect of Temperature on Dengue Virus Transmission with Periodic Delay Differential Equations. Math Biosci Eng (2020) 17:4147–64. doi:10.3934/mbe.2020230
40. Sridhar, S, Luedtke, A, Langevin, E, Zhu, M, Bonaparte, M, Machabert, T, et al. Effect of Dengue Serostatus on Dengue Vaccine Safety and Efficacy. N Engl J Med (2018) 379:327–40. doi:10.1056/NEJMoa1800820
41. Supadmi, W, Suwantika, AA, Perwitasari, DA, and Abdulah, R. Economic Evaluations of Dengue Vaccination in the Southeast Asia Region: Evidence from a Systematic Review. Value Health Reg Issues (2019) 18:132–44. doi:10.1016/j.vhri.2019.02.004
42. Tewa, JJ, Dimi, JL, and Bowong, S. Lyapunov Functions for a Dengue Disease Transmission Model. Chaos, Solitons & Fractals (2009) 39:936–41. doi:10.1016/j.chaos.2007.01.069
43. Thai, KTD, Nishiura, H, Hoang, PL, Tran, NTT, Phan, GT, Le, HQ, et al. Age-specificity of Clinical Dengue during Primary and Secondary Infections. PLOS Neg Trop Dis (2011) doi:10.1371/journal.pntd.0001180
44. Thunstrom, L, Ashworth, M, Finnoff, D, and Newbold, S. Hesitancy toward a COVID-19 Vaccine, 35 New York: CEPR Press (2021). p. 1–51. doi:10.1007/s10393-021-01524-0
45. Undurraga, E, Edillo, F, Erasmo, J, Alera, M, Yoon, I, Largo, F, et al. Disease Burden of Dengue in the Philippines, Adjusting for Underreporting by Comparing Active and Passive Dengue Surveillance in Punta Princesa, Cebu City. J Trop Med Hyg (2017) 96:887–98. doi:10.4269/ajtmh.16-0488
46. Valido, E, Laksanawati, I, and Utarini, A. Acceptability of the Dengue Vaccination Among Parents in Urban Poor Communities of Quezon City, Philippines before and after Vaccine Suspension. BMC Res Notes (2018) 11:661. doi:10.1186/s13104-018-3766-y
47. Wang, W, and Zhao, X. A Nonlocal and Time-Delayed Reaction-Diffusion Model of Dengue Transmission. SIAM J Appl Math (2011) 71:147–68. doi:10.1137/090775890
48. Yang, Y, Meng, Y, Halloran, M, and Longini, I. Dependency of Vaccine Efficacy on Preexposure and Age: A Closer Look at a Tetravalent Dengue Vaccine. Clin Infect Dis (2018) 66:178–84. doi:10.1093/cid/cix766
49. Yasmin, S, and Mukerjee, M. How the World’s First Dengue Vaccination Drive Ended in Disaster. New York: Sci. Amer. (2019).
50.World Health Organization. Update on the Dengue Situation in the Western Pacific Region (2021). Available at: www.who.int/news-room/fact-sheets/detail/dengue-and-severe-dengue.
52.Wikipedia. Dengvaxia Controversy (2019). Available at: en.wikipedia.org/wiki/Dengvaxia_controversy.
53.Wikipedia. Vaccine Hesitancy (2021). Available at: en.wikipedia.org/wiki/Vaccine_hesitancy.
54. Wu, C, and Wong, P. Dengue Transmission: Mathematical Model with Discrete Time Delays and Estimation of the Reproduction Number. J Biol Dyn (2019) 13:1–25. doi:10.1080/17513758.2018.1562572
Keywords: dengue, Philippines, vaccination, antibody, dependent, enhancement
Citation: Magal P, Seydi O, Webb G and Wu Y (2021) A Model of Vaccination for Dengue in the Philippines 2016–2018. Front. Appl. Math. Stat. 7:760259. doi: 10.3389/fams.2021.760259
Received: 17 August 2021; Accepted: 06 September 2021;
Published: 01 October 2021.
Edited by:
Daihai He, Hong Kong Polytechnic University, Hong Kong, SAR ChinaReviewed by:
Alain Miranville, University of Poitiers, FranceCopyright © 2021 Magal, Seydi, Webb and Wu. This is an open-access article distributed under the terms of the Creative Commons Attribution License (CC BY). The use, distribution or reproduction in other forums is permitted, provided the original author(s) and the copyright owner(s) are credited and that the original publication in this journal is cited, in accordance with accepted academic practice. No use, distribution or reproduction is permitted which does not comply with these terms.
*Correspondence: Glenn Webb , Z2xlbm4uZi53ZWJiQHZhbmRlcmJpbHQuZWR1
Disclaimer: All claims expressed in this article are solely those of the authors and do not necessarily represent those of their affiliated organizations, or those of the publisher, the editors and the reviewers. Any product that may be evaluated in this article or claim that may be made by its manufacturer is not guaranteed or endorsed by the publisher.
Research integrity at Frontiers

Learn more about the work of our research integrity team to safeguard the quality of each article we publish.