 Mohammad Tuqan
 Maurizio Porfiri
94% of researchers rate our articles as excellent or good
Learn more about the work of our research integrity team to safeguard the quality of each article we publish.
Find out more
ORIGINAL RESEARCH article
Front. Appl. Math. Stat., 14 October 2021
Sec. Dynamical Systems
Volume 7 - 2021 | https://doi.org/10.3389/fams.2021.751351
This article is part of the Research TopicModelling collective motion across scalesView all 9 articles
Zebrafish is a model organism that is receiving considerable attention in preclinical research. Particularly important is the use of zebrafish in behavioral pharmacology, where a number of high-throughput experimental paradigms have been proposed to quantify the effect of psychoactive substances consequences on individual and social behavior. In an effort to assist experimental research and improve animal welfare, we propose a mathematical model for the social behavior of groups of zebrafish swimming in a shallow water tank in response to the administration of psychoactive compounds to select individuals. We specialize the mathematical model to caffeine, a popular anxiogenic compound. Each fish is assigned to a Markov chain that describes transitions between freezing and swimming. When swimming, zebrafish locomotion is modeled as a pair of coupled stochastic differential equations, describing the time evolution of the turn-rate and speed in response to caffeine administration. Comparison with experimental results demonstrates the accuracy of the model and its potential use in the design of in-silico experiments.
Animal experiments are a standard practice for hypothesis testing in preclinical research [1,2]. However, experimental studies involving pharmacological treatment of sentient animals continue to raise ethical concerns regarding the well-being of the animals [3]. Computational methods can enable in-silico experiments that might help in the fulfillment of the 3Rs: Reducing the number of subjects, Refining experimental design and setup, and Replacing the use of live subjects [4–6].
Zebrafish (Danio rerio) has emerged as a species of choice in experimental studies in pharmacology where it is used in high throughput drug screening of several psychoactive compounds [7,8]. Its genetic and physiologic similarities with humans have made the zebrafish an attractive species for experimental investigations of human dysfunctional processes [9]. In particular, zebrafish experiments could clarify some of the open questions on anxiety-related behaviors in humans [10]. In these experiments, fish behavior is monitored in an experimental setup to investigate how anxiety-related behavior is modulated by anxiolytic and anxiogenic compounds, such as caffeine, cocaine, and ethanol [11–15]. Experiments on fish treated with such compounds have revealed numerous anxiety-related behaviors, including erratic activity (jump turns and sudden change in direction), thigmotaxis (tendency to stay near the wall), geotaxis (tendency to stay at the bottom of the tank), and freezing [16–18].
Previous efforts have leveraged data-driven, mathematical models to accurately describe the locomotion of isolated fish swimming in shallow or deep water tanks [19–23]. Concerning zebrafish, a number of studies have sought to incorporate their unique burst-and-coast swimming style, composed of sudden tail bursts that are followed by coasting phases [24,25]. The general line of approach consists of formulating a stochastic differential equation (SDE) for the turn-rate evolution, in which white noise is superimposed to intermittent excitation in the form of a jump process [26]. The original jump persistent turning walker (JPTW) was later adapted to the study of the effect of psychoactive manipulations in two separate studies [19,21]. Mwaffo and Porfiri [21] investigated the effect of acute ethanol treatment of zebrafish on model parameters of the JPTW, discovering a strong effect of concentration on the parameters of the jump process. Burbano-Lombana and Porfiri [19] expanded on the JPTW to simulate zebrafish response to acute caffeine administration. Not only did the model account for speed modulation during locomotion through an additional SDE, but also did it incorporate a detailed treatment of freezing episodes using discrete-time Markov chain. Overall, these studies suggest that the sensitivity of model parameters to the administration of psychoactive compounds must be considered when performing projective, in-silico experiments.
Other studies have extended individual fish models to groups, thereby including fish social interactions in terms of schooling and shoaling behaviors. In these models, social interaction is introduced as a response function that modulates the speed and turn-rate. Visual stimuli associated with the presence of conspecifics have been often considered in these models [23,27–29,29–32], where fish tend to align and swim closer to neighboring subjects accommodating to alignment and attraction forces. Related efforts have included hydrodynamic interactions to incorporate lateral line sensing of the flow caused by neighboring subjects [34–37]. Overall, the mathematical underpinnings of these studies are common to the investigation of the structure of collective behavior of several species, from ants [38] to bats [39].
To the best of our knowledge, models looking at the effect of psychoactive compounds on zebrafish social behavior have never been explained in the literature. Here, we aimed to partially fill this gap by proposing a model that not only captures the effect of caffeine administration on fish locomotory activity but also takes into consideration the influence of the social environment in modulating the pharmacological response. To this end, we modeled fish dynamics in terms of speed and turn-rate, along two time-scales similar to Burbano-Lombana and Porfiri [19]. We defined a slow time-scale that captures the transitions between swimming and freezing states using a discrete-time Markov chain. During the swimming state, we modeled the speed and turn-rate evolution along a fast time-scale as a system of coupled SDEs. In the evolution of the turn-rate, we accounted for social interactions for each subject based on visual cues from neighboring individuals, therein, we utilized different interaction parameters depending on the treatment of the specific subject. To calibrate the model parameters, we relied on the experimental data-set from Neri et al. [40], wherein a group of untreated subjects swam with a caffeine-treated individual.
We investigated the value of the social group in modulating the response of fish to caffeine administration. Specifically, we compared calibrated model parameters for a treated fish swimming with an untreated group with those of a treated fish swimming in isolation from Burbano-Lombana and Porfiri [19]. We further highlighted an asymmetric interaction between the treated individual and untreated subjects, associated with the effect of caffeine on locomotory activity of fish and how it is perceived by untreated subjects. Lastly, we verified the predictive ability of the proposed model in capturing the social behavior of the group by comparing a set of social interaction metrics obtained from in-silico experiments to those from real experiments.
Our theoretical endeavor is grounded in experiments from Neri et al. [40] (approved by the Animal Welfare Committee of New York University: protocol number 13–1424) on the effect of acute caffeine treatment on social behavior. Below, we summarize the main components of the experimental framework and data analysis from Neri et al. [40].
The setup consisted of a circular tank of diameter d = 90 cm filled with water at depth h = 10 cm. Cameras were used to record fish behavior at 40 frames/s for 5 minutes (Texp = 300 s). Videos were processed by an in-house multitarget tracking system developed in MATLAB [41,42].
Experiments were performed on groups of five adult subjects, including four untreated individuals and one treated individual, at four different caffeine concentrations: 0 (vehicle), 25, 50, and 70 mg/L. For each trial, five fish were randomly chosen from the holding tank. 50 fish were chosen at random to conduct ten experimental trials for each caffeine concentration (200 fish in total). One of the fish was kept in a 0.5 L beaker of a caffeine solution for 1 hour. Four untreated fish were introduced to the circular arena at the same time the beaker with the treated fish was placed in the arena. After 10 minutes of habituation, the treated fish was hand-netted from the beaker and released into the arena. The average fish body length (BL) was approximately 3 cm.
Fish trajectories were obtained by tracking the centroid of each fish. Figure 1 illustrates representative trajectories from each concentration. The trajectory of the i-th fish is denoted by (xi (kΔ), yi (kΔ)), where Δ = 0.025 s is the sampling time, and

FIGURE 1. Representative trajectories of a group of five subjects, with four untreated individuals and one subject treated with caffeine, at a concentration of: 0 (A), 25 (B), 50 (C), and 70 mg/L (D).
Position increments between consecutive readings were used to obtain the velocity
Fish trajectories were also used to score the time spent freezing, an anxiety-related behavior in zebrafish [18]. According to Kopman et al. [43], a fish was considered to be in a freezing episode if it stayed within 2 cm radius for at least TF = 2 s. From experimental data, we defined a binary Boolean variable Γi (nTF), with
Four experimental trials were discarded due to recording issues (two from 0 mg/L, and two from 50 mg/L). We omitted four additional experimental trials due to insufficient data points for experimental analysis and parameter calibration (two from 25 mg/L, and two from 70 mg/L), whereby the fish spent less than 10 s in the swimming state and more than two BL away from the wall. For this reason, the experimental results presented in this paper may differ from those presented in Neri et al. [40] that relies on the same data-set.
Here, we introduce the proposed data-driven framework to study the effect of caffeine treatment on individual and social behavior. Concerning our previous work [19], this study contributes a detailed model of social behavior, including attraction and alignment between subjects. Most importantly, these parameters are functions of the caffeine concentration and vary between treated and untreated subjects.
With respect to the state of the art on social behavior, the proposed model brings forward the critical role of the freezing response, by developing a two-time-scale modeling dichotomy where freezing evolves a slow time-scale that dictates when the animal is swimming or motionless. During locomotion, we used two coupled stochastic differential equations (SDEs) to describe the evolution of the turn-rate and the speed. The variables and notation used in the manuscript are included in Supplementary Table S1 in the supplemental material.
The fish were swimming in a shallow water tank, such that we could consider a two-dimensional (2D) model to describe their motion. Each fish was modeled as a rigid body, moving in a global reference frame [X, Y] with origin O. The position of the centroid of fish i at time t was denoted as
with initial conditions xi (0) = x0,i, y (0) = y0,i, and θi (0) = θ0,i. Here, vi(t) and ωi(t) were the speed and turn-rate of the fish, respectively. We developed a mathematical model for the time-evolution of vi(t) and ωi(t) to predict the individual and social response of zebrafish.
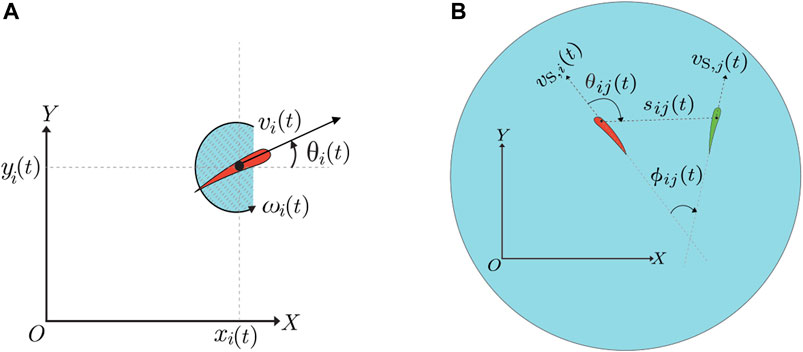
FIGURE 2. (A) Fish kinematics: at time t, the fish pose is denoted as
We adopted a discrete-time Markov chain to capture the transitions between freezing and swimming states. Building on the work of Burbano-Lombana and Porfiri [19] on isolated animals, for the i-th fish, we introduced a binary process Γi (nTF) that takes values 0 (freezing, F) and 1 (swimming, S), where n ∈ {1, … , ϒ},
The speed and turn-rate of the i-th fish were
Such that during a freezing episode both the speed and turn-rate are zero and during swimming they evolve based on the SDEs described below.
Speed and turn-rate in the swimming state were modeled as a system of two coupled SDEs. In the model, we included social interaction terms that modulate fish locomotion based on the visual cues from neighboring conspecifics. As illustrated in Figure 2B, we described fish schooling between the focal fish, i, and the neighboring fish, j, in terms of the relative orientation, ϕij(t) = θi(t) − θj(t). Further, we examined fish shoaling in terms of the relative position of the neighboring fish with respect to the focal fish expressed in terms of the distance between the pair of fish, sij(t), and relative angle, θij(t).
To model the evolution of the speed, we adopted the following logistic model, similar to Burbano-Lombana and Porfiri [19] for a single fish [45]:
where
where stdω,i was the standard deviation of the absolute instantaneous value of the turn-rate [19]. This function captured the need of fish to slow down when turning, while attaining larger speeds during straight swimming.
This model offers a first approximation of speed modulation during social behavior. For each fish, the model required the calibration of two parameters, assuming that the body length is common to the entire group: ηi, and σv,i. In this basic incarnation, the model does not incorporate speed-based social interaction, which has been proposed by several authors to play some role in the social response of social fish [46–50]. The choice of neglecting social interactions mediated by the speed was due to the need of reducing the number of model parameters, magnified by the presence of individual differences in the treatment of the group.
The turn-rate dynamics were captured by the JPTW [26,33],
where
Due to the presence of the caffeine treatment, the social interaction gains should vary in the group. We expected untreated fish to respond differently to a treated subject compared to an untreated one. Further, we anticipated the influence of treated on untreated to be different from the influence of untreated on treated, such that their interaction should be asymmetric. These claims are grounded in two propositions from the literature. First, the anxiogenic value of caffeine has been shown to influence the tendency of the caffeine-treated fish to interact with untreated conspecifics [15,51]. Second, the psychostimulatory nature of caffeine is known to influence the locomotory response of the animals [52], which may underlie differences in the appraisal of treated fish by untreated individuals. Accordingly, the turn-rate response function was written as
where
We categorized these parameters based on the direction of interaction as follows:
where TU, UT, and UU identified the response of the treated to untreated fish, the untreated to the treated fish, and the interaction between untreated subjects, respectively. The presence of Γj (nTF) in Eq. 6 was used to selectively limit the social response of fish to the group members that were actively swimming. Fish that were freezing were excluded from the social interaction model, based on calibration of the model on real data as well as biological observations that suggested zebrafish are more responsive to dynamic, rather than static stimuli [53].
The wall interaction function was written as follows [19,20]:
where the intensity of wall interactions,
We finally modeled the jump noise for the i-th fish as a compounded Poisson process,
Here, Ak,i(t)’s were independent and identically distributed Gaussian random variables with zero mean and variance
For each fish in the group, i ∈ {1, … ,N}, we calibrated the set of locomotion and social interaction model parameters. The transition probabilities for the discrete-time Markov chain model were obtained by simply counting instances of freezing and transitions to swimming in the experimental time-series. On the other hand, maximum likelihood estimation was applied to calibrate the locomotion model parameters.
In summary, we calibrated the following parameters: transition probabilities, pFS,i and pSF,i; linear expansion rate, ηi; strength of added noise on speed, σv,i; relaxation rate, αi; strength of added noise on turn-rate, σω,i; intensity of jump turns, γi; frequency of jump turns, λi; alignment gains of treated to untreated fish,
We obtained the binary sequences
where NSF,i and NFS,i were the number of transitions by the i-th fish from swimming to freezing and from freezing to swimming, respectively. NSS,i and NFF,i were the number of instances in which the fish maintained the swimming or freezing state, respectively.
Estimated transition probabilities for the treated fish in the group are shown in Supplementary Table S2. For completeness, in Supplementary Table S3, we also report a summary of the transition probabilities for the discrete-time Markov chain of the untreated fish in terms of mean and standard deviation calculated across all trials.
Using the experimental sampling time Δ as the time-step for discretization, we approximated Eqs 3, 5 via the Euler-Maruyama method as follows [54]:
where
We followed the same discretization approach to approximate the JPTW in Eq. 5, leading to.
where
For each individual, we consolidated unknown parameters in two vectors, φv,i and φω,i, one for the speed and the other for the turn-rate dynamics, in Eqs 11, 12, respectively. These vectors were determined by solving two independent optimization problems for the speed and turn-rate. The parameters were estimated for each fish in the group independently for every trial.
For the approximated logistic equation in Eq. 11, the vector of unknown parameters for each fish was
The maximum-likelihood estimation problem was formulated as
The likelihood function, lv,i (φv,i, vS,i (kΔ), ωS,i (kΔ)), was derived from the model approximation in Eq. 11 as
where H (x, σ) was the Gaussian distribution at x with zero mean and variance σ2. Further, qi (kΔ) was given by
Heuristically, we found that κ = 5 guarantees convergence of the optimization problem.
A similar approach was adopted to calibrate the discrete JPTW in Eq. 12. For each fish, we solved the optimization problem for the vector of unknown parameters for each fish,
where χω was in
and zi (kΔ) was
The locomotion parameters of each treated fish for all trials are displayed in Supplementary Table S4. A summary of the parameters of the untreated fish is shown in Supplementary Table S5, in terms of mean and standard deviation calculated across all trials. Supplementary Table S6 displays the attraction gains of the treated fish
We relied on the work of Burbano-Lombana and Porfiri [19] to obtain the wall function parameters in Eq. 8. The wall interaction function was calibrated for a fish swimming alone, from the data-set of Neri et al. [40], using a wall-corrected turn-rate from the real time-series of the turn-rate of fish swimming alone,
where ωa (kΔ) was the turn-rate of the fish swimming alone and ωc (kΔ) was the corrected turn-rate. Next, ωc (kΔ) was plotted against the distance from the wall dw (kΔ) where only the positive values of the corrected turn-rate were considered to capture wall avoidance. A robust non-parametric locally weighted least squares (RLOESS) function in MATLAB was used to fit the signal to a parametric exponential function. As such, the wall interaction parameters were obtained by calculating the average across all trials as aw = 11.68 rad s−2 and bw = 0.19 cm−1.
We began our analysis of the model by examining the influence of caffeine concentration on fish locomotion in terms of the variations of relevant model parameters. With respect to parameters on freezing response and locomotion, we compared with model parameters obtained in Burbano-Lombana and Porfiri [19] to assess the effect of the social environment on fish response to caffeine administration. Finally, we conducted in-silico experiments to demonstrate the predictive power of the model in anticipating experimental results on schooling and shoaling.
First, we investigated the effect of caffeine concentration and social environment on the locomotion parameters of the treated fish, utilizing two-way ANOVA with caffeine concentration and social environment (single or group) as independent variables. Second, we conducted ANOVA comparisons with caffeine concentration as a single independent variable to compare the interaction parameters across concentrations. Post-hoc comparisons were conducted using Tukey’s HSD (honestly significant difference). The significance level was set to 0.050 throughout.
We found that caffeine concentration did not influence the Markov chain transition probabilities pFS (F3,50 = 0.424, p = 0.738) and pSF (F3,50 = 0.125, p = 0.944), neither in isolation nor in group (shown in Figures 3A,B, respectively). No difference was detected across social environment with respect to pFS (F1,50 = 0.630, p = 0.443). Although we registered a dependence on the social environment with respect to pSF (F1,50 = 5.416, p = 0.027), we did not detect any variation in post-hoc analysis. The interaction between the two independent variables was found to be not significant for both pFS (F3,50 = 1.733, p = 0.181) and pSF (F3,50 = 0.812, p = 0.497).
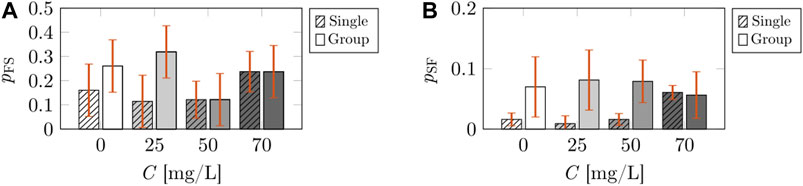
FIGURE 3. Comparisons of discrete-time Markov chain parameters of the treated fish across caffeine concentrations and social environment (single or group). The bars represent the mean value of the probability of transition from freezing to swimming (A), and the mean value of the probability of transition from swimming to freezing (B). The striped bars correspond to the calibrated parameters for the case of a single treated fish from Burbano-Lombana and Porfiri [19]. The solid bars correspond to the calibrated parameters for the case of a treated fish swimming in a social group. The vertical red error bars represent standard errors of the means.
Likewise, the linear expansion rate, η, was not influenced by either caffeine concentration (F3,50 = 1.264, p = 0.297) or social environment (F1,50 = 0.698, p = 0.407), shown in Figure 4A. Further we did not detect differences in the interaction of the independent variables on η (F3,50 = 0.048, p = 0.986). In terms of the strength of added noise on the speed evolution, σv, we found a dependence on caffeine concentration (F3,50 = 3.039, p = 0.038; Figure 4B), which, however was not accompanied by variations in post-hoc analysis. We found that the presence of the social environment had an effect on σv (F1,50 = 33.21, p < 0.001), and post-hoc analysis indicated a decrease in the strength of added noise in the presence of untreated subjects for 0 mg/L. We did not detect a significant interaction between the independent variables on σv (F3,50 = 1.088, p = 0.363).
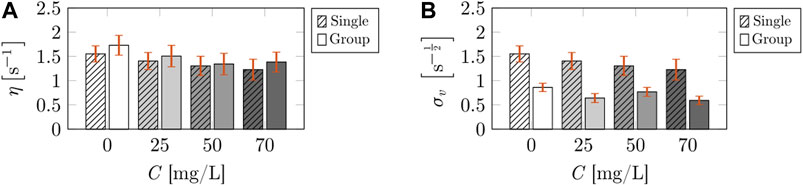
FIGURE 4. Comparisons of the locomotion parameters corresponding to the speed evolution of the treated fish across caffeine concentrations and social environment (single or group). The bars represent the mean value of the linear expansion rate (A), and strength of added noise in the speed evolution (B). The striped bars correspond to the calibrated parameters for the case of a single treated fish from Burbano-Lombana and Porfiri [19]. The solid bars correspond to the calibrated parameters for the case of a treated fish swimming in a social group. The symbol $ indicates a significant difference (p < 0.050) in Tukey’s HSD post-hoc analysis comparing individuals swimming alone or on group (single versus group). The vertical red error bars represent standard errors of the means.
With respect to the turn-rate model parameters, we did not detect an effect of caffeine concentration on the mean reversion rate, α (F3,50 = 1.368, p = 0.263). Although we found α to be affected by the social environment (F3,50 = 15.49, p < 0.001; Figure 5A), post-hoc analysis did not reveal significant differences between concentrations. Likewise, we did not discover a significant interaction between caffeine concentration and social environment on α (F3,50 = 0.519, p = 0.672). While caffeine concentration was found to have an influence on the strength of added noise in the turn-rate evolution, σω (F3,50 = 2.926, p = 0.043; Figure 5B), no variations were identified in post-hoc analysis. We determined a modulatory role of the social environment (F3,50 = 24.83, p < 0.001), where σω increased in the presence of a social group for 50 mg/L in post-hoc analysis. No significant interaction was detected between the independent variables with respect to σω (F3,50 = 0.866, p = 0.465). With respect to intensity of jumps, γ, we found caffeine concentration to play a modulatory role (F3,50 = 5.760, p = 0.002; Figure 5C), with post-hoc analysis revealing a decrease in the intensity of jumps for treated fish swimming in isolation from 50 to 70 mg/L. In addition, we found the social environment to influence γ (F1,50 = 15.90, p < 0.001), where we detected an increase in the jump intensity in the presence of untreated subjects for 0 mg/L in post-hoc analysis. We did not identify a significant interaction between caffeine concentration and social environment with respect to γ (F3,50 = 0.747, p = 0.529). Finally, the frequency of jumps, λ, was not affected by caffeine concentration (F3,50 = 2.166, p = 0.104). In contrast, we detected significant differences across social environment (F1,50 = 13.65, p < 0.001; Figure 5D). Post-hoc analysis revealed that fish swimming in isolation had higher values of λ than those swimming in group for the 25 mg/L treatment. We registered a significant interaction of the independent variables on λ (F3,50 = 2.924, p = 0.048).
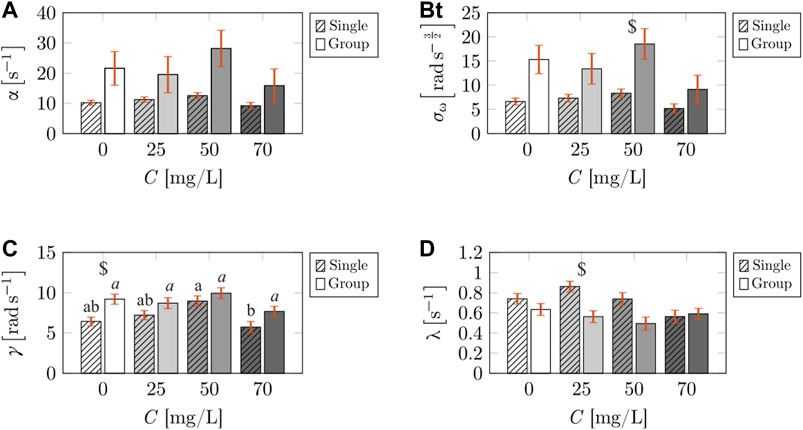
FIGURE 5. Comparisons of the locomotion parameters corresponding to the turn-rate evolution of the treated fish across caffeine concentrations, and social environment (single or group). The bars represent the mean value of the mean reversion rate (A), strength of added noise in the turn-rate evolution (B), intensity of jumps in the turn-rate evolution (C), and frequency of jumps in turn-rate evolution (D). The striped bars correspond to the calibrated parameters for the case of a single treated fish from Burbano-Lombana and Porfiri [19]. The solid bars correspond to the calibrated parameters for the case of a treated fish swimming in a social group. Different letters on top of the bars indicate a significant difference (p < 0.050) in Tukey’s HSD post-hoc analysis across caffeine concentrations, comparing individuals swimming in isolation (standard font) or in group (italic font). The symbol $ indicates a significant difference (p < 0.050) in Tukey’s HSD post-hoc analysis comparing individuals swimming alone or on group (single versus group). The vertical red error bars represent standard errors of the means.
Next, we investigated the effect of caffeine concentration on the interaction gains in the turn-rate model, as shown in Figure 6. We identified an effect of caffeine concentration on the attraction gain of the treated fish towards untreated fish,
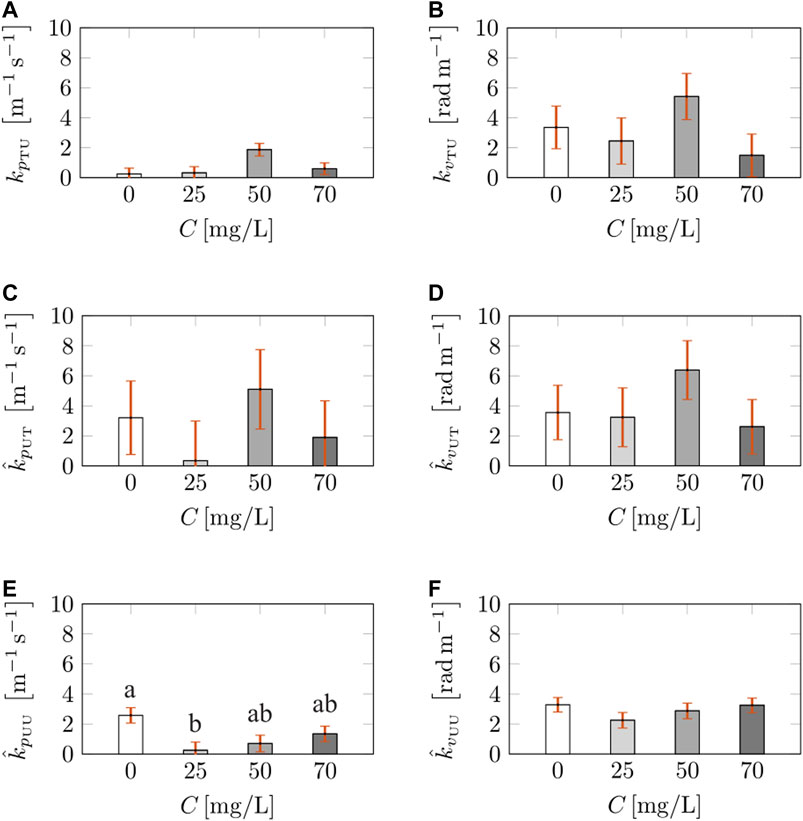
FIGURE 6. Calibrated interaction parameters in the turn-rate evolution across caffeine concentrations. The bars represent the mean value of the attraction gain of treated fish towards untreated fish (A), alignment gain of treated fish towards untreated fish (B), average attraction gain of untreated fish towards treated fish (C), average alignment gain of untreated fish towards treated fish (D), average attraction gain between untreated fish (E), and average alignment gain between untreated fish (F). Different letters on top of the bars indicate a significant difference (p < 0.050) in Tukey’s HSD post-hoc analysis across caffeine concentrations. The vertical red error bars represent standard errors of the means.
In summary, among all the freezing and locomotion parameters, we only found the intensity of jumps to depend on caffeine concentration, yet, without differences with respect to vehicle-treated individuals. Comparisons across social environment revealed variations in the strength of added noise on both speed and turn-rate and in the jump parameters. Swimming in group reduced the strength of the added noise on the speed evolution of vehicle-treated subjects, and it increased the strength of the added noise on the turn-rate evolution at the intermediate concentration. Further, while the presence of a social group increased the intensity of jumps of vehicle-treated subjects, it reduced the frequency of jumps of individuals treated at a low concentration. Parameters pertaining to social response were generally robust with respect to caffeine concentration, except for the attraction of untreated fish towards other untreated subjects, with low caffeine concentration causing a reduction in alignment.
We conducted in-silico experiments to validate the developed model and investigate its ability to predict the social behavior of fish detected from experimental time-series [40], for a range of interaction metrics that quantify schooling, and shoaling.
Schooling is a measure of fish tendency to align their bodies during swimming [55,56]. The degree of alignment among the four untreated fish was scored in terms of the instantaneous polarization [57],
where N = 5 was the number of fish in the experiment. Polarization varies between 0 and 1, where 1 identified the case in which untreated fish are perfectly aligned in the same direction.
The alignment between the treated fish and the untreated group of fish was scored in terms of the relative instantaneous polarization, R (kΔ),
Relative polarization ranges between −1 and 1, where 1 corresponded to the group of untreated fish pointing in the same direction of the treated fish, and −1 indicated that the treated fish is pointing in the opposite direction to the group of untreated fish. These quantities were averaged in time to compute the average polarization and the average relative polarization.
To quantify fish shoaling, the tendency of fish to swim nearby, we computed the inter-individual distance, dij (kΔ), between each pair in the group. We scored the average distance between the treated and untreated subjects, and the average distance among untreated individuals.
We conducted in-silico experiments using the model parameters for the case of in-group swimming, shown in solid bars in Figures 3–6. Ten simulations were performed for each of the four caffeine concentrations. For each fish in all 40 trials, the interaction gains were sampled from a Gaussian distribution with mean and standard deviation of the corresponding parameter at that concentration. On the other hand, since we did not find any effect of caffeine concentration on the transition probabilities and locomotion parameters for in-group swimming, those parameters were taken as the average of all fish across all experimental trials based on treatment. The initial conditions xi (0), yi (0), θi (0), Γi (0), vi (0), and ωi (0) were chosen uniformly at random in their respective intervals. Time-series of four trajectories for each caffeine concentration are shown in Figure 7; videos are presented at the link provided in the data availability statement. Note that the wall function adopted in this study does not take into consideration the wall following behavior of zebrafish, thus explaining the differences in wall interactions between in-silico trajectories in Figure 7 and experimental ones in Figure 1.
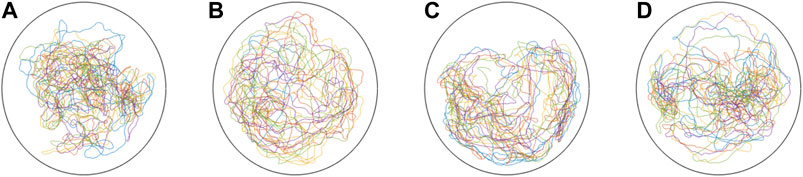
FIGURE 7. Representative in-silico trajectories of a group of five subjects, with four untreated individuals and one subject treated with caffeine, at a concentration of: 0 (A), 25 (B), 50 (C), and 70 mg/L (D).
We performed statistical analysis to compare the social interaction metrics across caffeine concentrations, and validate the in-silico results against those obtained from real experiments. For this purpose, we conducted two-way ANOVA with caffeine concentration and data-type (experiments or in-silico) as independent variables. Post-hoc comparisons were conducted using Tukey’s HSD. The significance level was set to 0.050 throughout.
We detected influence of caffeine concentration on the average polarization,
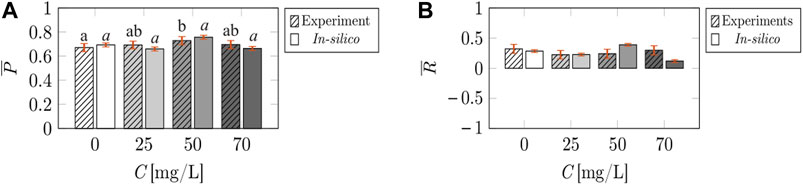
FIGURE 8. Comparisons of the schooling tendency of the fish, measured in terms of average polarization (A), and average relative polarization (B), across caffeine concentrations and data-types (experiment or in-silico). Different letters on top of the bars indicate a significant difference (p < 0.050) in Tukey’s HSD post-hoc analysis across caffeine concentrations, comparing interaction metrics in experiment (standard font) or in-silico (italic font) data-type. The vertical red error bars represent standard errors of the means.
Next, we determined that the shoaling tendency between the treated fish and untreated subjects, in terms of the average distance
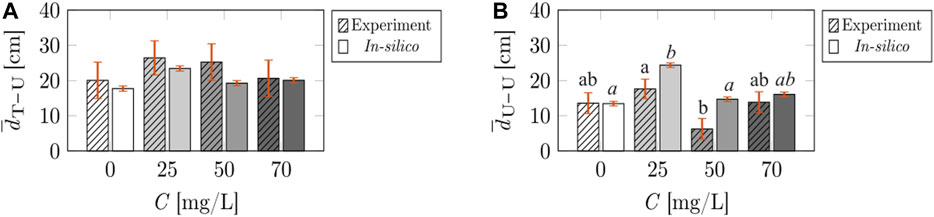
FIGURE 9. Comparisons of the shoaling tendency of the fish, measured in terms of the average distance between treated fish and untreated fish (A), and average distance between untreated fish (B), across caffeine concentrations and data-types (experiment or in-silico). Different letters on top of the bars indicate a significant difference (p < 0.050) in Tukey’s HSD post-hoc analysis across caffeine concentrations, comparing interaction metrics in experiment (standard font) or in-silico (italic font) data-type. The vertical red error bars represent standard errors of the means.
In this work, we developed a modeling framework to study the effect of acute caffeine treatment on the social behavior of zebrafish. We contributed two key advances to previous work on modeling collective behavior of zebrafish. First, similar to the analysis with respect to zebrafish swimming alone in Burbano-Lombana and Porfiri [19], we included the freezing response of each individual within the group, which is necessary to capture anxiety-related behavior in response to caffeine [58]. For this purpose, we developed a two-time-scale modeling dichotomy. Along a slow time-scale, we used a discrete-time Markov chain to describe the transition between swimming and freezing states. At a fast time-scale, we modeled the evolution of the speed and turn-rate during swimming as a system of coupled SDEs: a logistic equation to represent the speed and a JPTW to describe the turn-rate. Second, we granularly tracked the directional interaction between each pair of fish based on the treatment of each fish within the pair. This approach takes into consideration previous experimental work highlighting the effect of caffeine on the behavioral response of treated fish and its appraisal by untreated conspecifics [51,52].
We calibrated the model on real experimental data from previous work [40], where we studied groups of caffeine-treated subject and untreated individuals swimming in a shallow water tank. For each group of five individuals, we estimated 20 parameters, entering the Markov chain and the SDEs. Calibration employed a combination of maximum likelihood estimation and classical plug-in estimation. We displayed our results on two fronts. First, we compared the model parameters obtained for a treated fish swimming with untreated subjects with those obtained by Burbano-Lombana and Porfiri [19] for the case of an isolated fish. Second, we compared the social interaction metrics, in terms of average polarization, average relative polarization, and average inter-individual distance, between the experimental and in-silico data-sets.
In contrast with our expectations, we did not observe a modulatory role of caffeine on freezing and locomotion parameters. Our expectation was based on a number of previous studies documenting a robust dependence of zebrafish behavioral response to acute caffeine administration [18,59]. This was particularly evident for individuals swimming with untreated subjects, for which we failed to detect any effect of caffeine treatment. Likely, the explanation for the abolishment of a dose-dependent response should be sought in the presence of the social environment, which, indeed was responsible for a few, salient variations in locomotion parameters associated with the speed and turn-rate evolution. It is tenable that the presence of social cues had a leveling role on the anxiogenic effect of caffeine, which is indirectly evidenced by the tendency to enhance white noise with respect to the jump noise in the turn-rate evolution. Jumps have been associated with erratic activity of the animal, in the form of C- and U-turns, so that their reduction in favor of steady swimming offers an indication of an axiolytic value of the social environment, also discussed by Neri et al. [40]. With respect to the effect on untreated subjects, we recorded a decrease in their tendency to shoal with each other, which highlights an interesting, albeit indirect, effect of caffeine treatment. Caffeine treatment of one selected individuals might bear an anxiolytic effect on the rest of the group that reduce their tendency to stay close [15,51]; understanding this counter-intuitive finding should be the object of future research.
The calibrated model is in good agreement with experimental observations on social metrics, related to shoaling and schooling. While this agreement should be desired in any calibrated model, it is not obvious to attain. In fact, in-silico experiments do not contain the fine-grain variations that are unique to the experimental subjects, whereby we excluded from the simulations any statistical variation in the locomotion and freezing parameters. Accounting for variations in the social gains due to caffeine administration through a simple normal distribution seems sufficient to capture the emergent response of the groups, as well as the role of the treated individual.
The proposed model is not free of limitations. First, we assumed that the interaction between fish is solely based on visual stimuli. Incorporating other mechanisms of social interactions, such as hydro interactions [35,37], may help refine the mathematical model, especially in terms of short-range interactions related to the perturbations they create in the fluid environment [37]. Second, the current model does not incorporate wall following behavior observed in real experiments, whereby interaction with the wall is limited to a simple repulsion [20]. Third, the model is purely two-dimensional, thereby failing to capture salient anxiety-related responses that have been documented in zebrafish, such geotaxis [18, 60]. Fourth, the entire modeling framework is based on a single psychoactive compound, which bears limitations in the generalizations of the predictions to other substances that impinge on anxiety [11,14]. Along this line, the most fundamental limitations of the model is the lack of a direct link between the molecular composition of the substance or the brain mechanisms it affects and the parameters of the model. In its present incarnation, the model requires knowledge of all its parameters to perform in-silico experiments, without allowing for exploring different substances or even untested concentrations on caffeine.
Despite these limitations, the proposed model offers a first step in the design of in-silico experiments that can aid the 3R’s with respect to zebrafish experimentation. The proposed model can be used to reduce the number of experiments, by affording statistical insight into the sample size. Likewise, the model can be used to refine existing data-sets, by informing model-based analysis of the data and, potentially, assist in verification and tracking. Finally, pilot studies could be conducted on a computer, thereby reducing the number of subjects utilized in experimental research.
The experimental data-set and representative videos of the in-silico experiments can be found in the repository of our research laboratory at https://github.com/dynamicalsystemslaboratory/CaffeineSocialBehavior.
MP designed and supervised the research. MT developed the computer codes, conducted model calibration, performed statistical analysis, and wrote a first, preliminary draft of the work. MP consolidated the draft in the present submission. Both authors developed the mathematical model and analyzed results.
This work was partially supported by the National Science Foundation under grant number CMMI 1901697 and by the National Institutes of Health, National Institute on Drug Abuse under grant number 1R21DA042558-01A1 and Office of Behavioral and Social Sciences Research that co-funded the National Institute on Drug Abuse grant, all awarded to MP. The funders had no role in study design, data collection and analysis, decision to publish, or preparation of the manuscript.
The authors declare that the research was conducted in the absence of any commercial or financial relationships that could be construed as a potential conflict of interest.
All claims expressed in this article are solely those of the authors and do not necessarily represent those of their affiliated organizations, or those of the publisher, the editors and the reviewers. Any product that may be evaluated in this article, or claim that may be made by its manufacturer, is not guaranteed or endorsed by the publisher.
The Supplementary Material for this article can be found online at: https://www.frontiersin.org/articles/10.3389/fams.2021.751351/full#supplementary-material
1. Chow, PKH, Ng, RTH, and Ogden, BE. Using Animal Models In Biomedical Research. Singapore: World Scientific (2008). doi:10.1142/6454
2. Sánchez Morgado, JM, and Brønstad, A. Experimental Design and Reproducibility in Preclinical Animal Studies. Springer International Publishing (2021).
3. Badyal, D, and Desai, C. Animal Use in Pharmacology Education and Research: The Changing Scenario. Indian J Pharmacol (2014) 46(3):257–65. doi:10.4103/0253-7613.132153
4. Ford, KA. Refinement, Reduction, and Replacement of Animal Toxicity Tests by Computational Methods. Ilar J (2016) 57(2):226–33. doi:10.1093/ilar/ilw031
5. Raunio, H. In Silico Toxicology - Non-testing Methods. Front Pharmacol (2011) 2:33. doi:10.3389/fphar.2011.00033
6. Viceconti, M, Pappalardo, F, Rodriguez, B, Horner, M, Bischoff, J, and Musuamba Tshinanu, F. In Silico trials: Verification, Validation and Uncertainty Quantification of Predictive Models Used in the Regulatory Evaluation of Biomedical Products. Methods (2021) 185:120–7. doi:10.1016/j.ymeth.2020.01.011
7. Goldsmith, P. Zebrafish as a Pharmacological Tool: the How, Why and when. Curr Opin Pharmacol (2004) 4(5):504–12. doi:10.1016/j.coph.2004.04.005
8. Guo, S. Linking Genes to Brain, Behavior and Neurological Diseases: what Can We Learn from Zebrafish. Genes Brain Behav (2004) 3(2):63–74. doi:10.1046/j.1601-183x.2003.00053.x
9. Stewart, AM, Braubach, O, Spitsbergen, J, Gerlai, R, and Kalueff, AV. Zebrafish Models for Translational Neuroscience Research: from Tank to Bedside. Trends Neurosciences (2014) 37(5):264–78. doi:10.1016/j.tins.2014.02.011
10. Stewart, A, Gaikwad, S, Kyzar, E, Green, J, Roth, A, and Kalueff, AV. Modeling Anxiety Using Adult Zebrafish: A Conceptual Review. Neuropharmacology (2012) 62(1):135–43. doi:10.1016/j.neuropharm.2011.07.037
11. da Silva Chaves, SN, Felício, GR, Costa, BPD, de Oliveira, WEA, Lima-Maximino, MG, Siqueira Silva, DHd., et al. Behavioral and Biochemical Effects of Ethanol Withdrawal in Zebrafish. Pharmacol Biochem Behav (2018) 169:48–58. doi:10.1016/j.pbb.2018.04.006
12. Egan, RJ, Bergner, CL, Hart, PC, Cachat, JM, Canavello, PR, Elegante, MF, et al. Understanding Behavioral and Physiological Phenotypes of Stress and Anxiety in Zebrafish. Behav Brain Res (2009) 205(1):38–44. doi:10.1016/j.bbr.2009.06.022
13. Gerlai, R, Ahmad, F, and Prajapati, S. Differences in Acute Alcohol-Induced Behavioral Responses Among Zebrafish Populations. Alcohol Clin Exp Res (2008) 32(10):1763–73. doi:10.1111/j.1530-0277.2008.00761.x
14. Kacprzak, V, Patel, NA, Riley, E, Yu, L, Yeh, J-RJ, and Zhdanova, IV. Dopaminergic Control of Anxiety in Young and Aged Zebrafish. Pharmacol Biochem Behav (2017) 157:1–8. doi:10.1016/j.pbb.2017.01.005
15. Speedie, N, and Gerlai, R. Alarm Substance Induced Behavioral Responses in Zebrafish (Danio rerio). Behav Brain Res (2008) 188(1):168–77. doi:10.1016/j.bbr.2007.10.031
16. Cachat, J, Canavello, P, Elegante, M, Bartels, B, Hart, P, Bergner, C, et al. Modeling Withdrawal Syndrome in Zebrafish. Behav Brain Res (2010) 208(2):371–6. doi:10.1016/j.bbr.2009.12.004
17. Khan, KM, Collier, AD, Meshalkina, DA, Kysil, EV, Khatsko, SL, Kolesnikova, T, et al. Zebrafish Models in Neuropsychopharmacology and CNS Drug Discovery. Br J Pharmacol (2017) 174(13):1925–44. doi:10.1111/bph.13754
18. Maximino, C, de Brito, TM, da Silva Batista, AW, Herculano, AM, Morato, S, and Gouveia, A. Measuring Anxiety in Zebrafish: A Critical Review. Behav Brain Res (2010) 214(2):157–71. doi:10.1016/j.bbr.2010.05.031
19. Burbano-L, DA, and Porfiri, M. Data-driven Modeling of Zebrafish Behavioral Response to Acute Caffeine Administration. J Theor Biol (2020) 485:110054. doi:10.1016/j.jtbi.2019.110054
20. Gautrais, J, Jost, C, Soria, M, Campo, A, Motsch, S, Fournier, R, et al. Analyzing Fish Movement as a Persistent Turning walker. J Math Biol (2009) 58:429–45. doi:10.1007/s00285-008-0198-7
21. Mwaffo, V, and Porfiri, M. Turning Rate Dynamics of Zebrafish Exposed to Ethanol. Int J Bifurcation Chaos (2015) 25(7):1540006. doi:10.1142/s0218127415400064
22. Mwaffo, V, Butail, S, and Porfiri, M. In-silico Experiments of Zebrafish Behaviour: Modeling Swimming in Three Dimensions. Sci Rep (2017) 7:39877. doi:10.1038/srep39877
23. Zienkiewicz, A, Barton, DAW, Porfiri, M, and Di Bernardo, M. Data-driven Stochastic Modelling of Zebrafish Locomotion. J Math Biol (2015) 71:1081–105. doi:10.1007/s00285-014-0843-2
24. Blake, RW. Fish Functional Design and Swimming Performance. J Fish Biol (2004) 65(5):1193–222. doi:10.1111/j.0022-1112.2004.00568.x
25. Chung, M-H. On Burst-And-Coast Swimming Performance in Fish-like Locomotion. Bioinspir Biomim (2009) 4(3):036001. doi:10.1088/1748-3182/4/3/036001
26. Mwaffo, V, Anderson, RP, Butail, S, and Porfiri, M. A Jump Persistent Turning walker to Model Zebrafish Locomotion. J R Soc Interf (2015) 12(102):20140884. doi:10.1098/rsif.2014.0884
27. Butail, S, Mwaffo, V, and Porfiri, M. Model-free Information-Theoretic Approach to Infer Leadership in Pairs of Zebrafish. Phys Rev E (2016) 93(4):042411. doi:10.1103/PhysRevE.93.042411
28. Calovi, DS, Lopez, U, Schuhmacher, P, Chaté, H, Sire, C, and Theraulaz, G. Collective Response to Perturbations in a Data-Driven Fish School Model. J R Soc Interf (2015) 12(104):20141362. doi:10.1098/rsif.2014.1362
29. Calovi, DS, Litchinko, A, Lecheval, V, Lopez, U, Pérez Escudero, A, Chaté, H, et al. Disentangling and Modeling Interactions in Fish with Burst-And-Coast Swimming Reveal Distinct Alignment and Attraction Behaviors. Plos Comput Biol (2018) 14(1):e1005933. doi:10.1371/journal.pcbi.1005933
30. Collignon, B, Séguret, A, and Halloy, J. A Stochastic Vision-Based Model Inspired by Zebrafish Collective Behaviour in Heterogeneous Environments. R Soc Open Sci (2016) 3(1):150473. doi:10.1098/rsos.150473
31. Gautrais, J, Ginelli, F, Fournier, R, Blanco, S, Soria, M, Chaté, H, et al. Deciphering Interactions in Moving Animal Groups. Plos Comput Biol (2012) 8(9):e1002678. doi:10.1371/journal.pcbi.1002678
32. Mwaffo, V, Korneyeva, V, and Porfiri, M. simUfish: An Interactive Application to Teach K-12 Students about Zebrafish Behavior. Zebrafish (2017) 14(5):477–88. doi:10.1089/zeb.2016.1409
33. Zienkiewicz, AK, Ladu, F, Barton, DAW, Porfiri, M, and Bernardo, MD. Data-driven Modelling of Social Forces and Collective Behaviour in Zebrafish. J Theor Biol (2018) 443:39–51. doi:10.1016/j.jtbi.2018.01.011
34. Filella, A, Nadal, F, Sire, C, Kanso, E, and Eloy, C. Model of Collective Fish Behavior with Hydrodynamic Interactions. Phys Rev Lett (2018) 120:198101. doi:10.1103/physrevlett.120.198101
35. Gazzola, M, Tchieu, AA, Alexeev, D, de Brauer, A, and Koumoutsakos, P. Learning to School in the Presence of Hydrodynamic Interactions. J Fluid Mech (2016) 789:726–49. doi:10.1017/jfm.2015.686
36. Jhawar, J, Morris, RG, Amith-Kumar, UR, Danny Raj, M, Rogers, T, Rajendran, H, et al. Noise-induced Schooling of Fish. Nat Phys (2020) 16(4):488–93. doi:10.1038/s41567-020-0787-y
37. Porfiri, M, Karakaya, M, Sattanapalle, RR, and Peterson, SD. Emergence of In-Line Swimming Patterns in Zebrafish Pairs. Flow (2021) 1:E7. doi:10.1017/flo.2021.5
38. Valentini, G, Mizumoto, N, Pratt, SC, Pavlic, TP, and Walker, SI. Revealing the Structure of Information Flows Discriminates Similar Animal Social Behaviors. eLife (2020) 9:e55395. doi:10.7554/eLife.55395
39. Shirazi, MJ, and Abaid, N. Collective Behavior in Groups of Self-Propelled Particles with Active and Passive Sensing Inspired by Animal Echolocation. Phys Rev E (2018) 98(4):042404. doi:10.1103/physreve.98.042404
40. Neri, D, Ruberto, T, Mwaffo, V, Bartolini, T, and Porfiri, M. Social Environment Modulates Anxiogenic Effects of Caffeine in Zebrafish. Behav Pharmacol (2019) 30(1):45–58. doi:10.1097/fbp.0000000000000415
41. Butail, S, Bartolini, T, and Porfiri, M. Collective Response of Zebrafish shoals to a Free-Swimming Robotic Fish. PLoS ONE (2013) 8:e76123–7. doi:10.1371/journal.pone.0076123
42. Ladu, F, Butail, S, Macrí, S, and Porfiri, M. Sociality Modulates the Effects of Ethanol in Zebra Fish. Alcohol Clin Exp Res (2014) 38(7):2096–104. doi:10.1111/acer.12432
43. Kopman, V, Laut, J, Polverino, G, and Porfiri, M. Closed-loop Control of Zebrafish Response Using a Bioinspired Robotic-Fish in a Preference Test. J R Soc Interf (2013) 10(78):20120540. doi:10.1098/rsif.2012.0540
44. Waldron, KJ, and Schmiedeler, J. Springer Handbook of Robotics. Cham: Springer (2016) p. 11–36. chap. Kinematics.
45. Pasquali, S. The Stochastic Logistic Equation: Stationary Solutions and Their Stability. Rendiconti Del Seminario Matematico Della Università di Padova (2001) 106:165–83.
46. Berdahl, A, Torney, CJ, Ioannou, CC, Faria, JJ, and Couzin, ID. Emergent Sensing of Complex Environments by mobile Animal Groups. Science (2013) 339(6119):574–6. doi:10.1126/science.1225883
47. Herbert-Read, JE, Perna, A, Mann, RP, Schaerf, TM, Sumpter, DJT, and Ward, AJW. Inferring the Rules of Interaction of Shoaling Fish. Proc Natl Acad Sci (2011) 108(46):18726–31. doi:10.1073/pnas.1109355108
48. Herbert-Read, JE, Krause, S, Morrell, LJ, Schaerf, TM, Krause, J, and Ward, AJW. The Role of Individuality in Collective Group Movement. Proc R Soc B (2013) 280(1752):20122564. doi:10.1098/rspb.2012.2564
49. Katz, Y, Tunstrom, K, Ioannou, CC, Huepe, C, and Couzin, ID. Inferring the Structure and Dynamics of Interactions in Schooling Fish. Proc Natl Acad Sci (2011) 108(46):18720–5. doi:10.1073/pnas.1107583108
50. Krause, J, Ward, AJW, Jackson, AL, Ruxton, GD, James, R, and Currie, S. The Influence of Differential Swimming Speeds on Composition of Multi-Species Fish shoals. J Fish Biol (2005) 67(3):866–72. doi:10.1111/j.0022-1112.2005.00768.x
51. Miller, N, and Gerlai, R. Quantification of Shoaling Behaviour in Zebrafish (Danio rerio). Behav Brain Res (2007) 184(2):157–66. doi:10.1016/j.bbr.2007.07.007
52. Gupta, P, Khobragade, S, Rajaram, S, and Shingatgeri, V. Assessment of Locomotion Behavior in Adult Zebrafish after Acute Exposure to Different Pharmacological Reference Compounds. Drug Dev Ther (2014) 5(2):127–33. doi:10.4103/2394-2002.139626
53. Ruberto, T, Mwaffo, V, Singh, S, Neri, D, and Porfiri, M. Zebrafish Response to a Robotic Replica in Three Dimensions. R Soc Open Sci (2016) 3(10):160505. doi:10.1098/rsos.160505
54. Higham., DJ. An Algorithmic Introduction to Numerical Simulation of Stochastic Differential Equations. SIAM Rev (2001) 43(3):525–46. doi:10.1137/s0036144500378302
55. Pitcher, TJ, Magurran, AE, and Allan, JR. Size-segregative Behaviour in Minnow shoals. J Fish Biol (1986) 29:83–95. doi:10.1111/j.1095-8649.1986.tb05001.x
56. Miller, N, and Gerlai, R. From Schooling to Shoaling: Patterns of Collective Motion in Zebrafish (Danio rerio). PLoS ONE (2012) 7(11):e48865. doi:10.1371/journal.pone.0048865
57. Aureli, M, Fiorilli, F, and Porfiri, M. Portraits of Self-Organization in Fish Schools Interacting with Robots. Physica D: Nonlinear Phenomena (2012) 241(9):908–20. doi:10.1016/j.physd.2012.02.005
58. Maximino, C, da Silva, AWB, Gouveia, A, and Herculano, AM. Pharmacological Analysis of Zebrafish (Danio rerio) Scototaxis. Prog Neuro-Psychopharmacology Biol Psychiatry (2011) 35(2):624–31. doi:10.1016/j.pnpbp.2011.01.006
59. Stewart, A, Kadri, F, DiLeo, J, Min Chung, K, Cachat, J, Goodspeed, J, et al. The Developing Utility of Zebrafish in Modeling Neurobehavioral Disorders. Int J Comp Psychol (2010) 23(1):104–20.
Keywords: anxiety, collective behavior, Danio rerio, in-silico, pharmacology, social interaction, stochastic differential equations
Citation: Tuqan M and Porfiri M (2021) Mathematical Modeling of Zebrafish Social Behavior in Response to Acute Caffeine Administration. Front. Appl. Math. Stat. 7:751351. doi: 10.3389/fams.2021.751351
Received: 01 August 2021; Accepted: 20 September 2021;
Published: 14 October 2021.
Edited by:
Nicole Abaid, Virginia Tech, United StatesReviewed by:
Jaquelinne Pinheiro-da-Silva, Federal University of Rio Grande do Norte, BrazilCopyright © 2021 Tuqan and Porfiri. This is an open-access article distributed under the terms of the Creative Commons Attribution License (CC BY). The use, distribution or reproduction in other forums is permitted, provided the original author(s) and the copyright owner(s) are credited and that the original publication in this journal is cited, in accordance with accepted academic practice. No use, distribution or reproduction is permitted which does not comply with these terms.
*Correspondence: Maurizio Porfiri, bXBvcmZpcmlAbnl1LmVkdQ==
Disclaimer: All claims expressed in this article are solely those of the authors and do not necessarily represent those of their affiliated organizations, or those of the publisher, the editors and the reviewers. Any product that may be evaluated in this article or claim that may be made by its manufacturer is not guaranteed or endorsed by the publisher.
Research integrity at Frontiers
Learn more about the work of our research integrity team to safeguard the quality of each article we publish.