
94% of researchers rate our articles as excellent or good
Learn more about the work of our research integrity team to safeguard the quality of each article we publish.
Find out more
BRIEF RESEARCH REPORT article
Front. Appl. Math. Stat., 02 August 2021
Sec. Mathematical Finance
Volume 7 - 2021 | https://doi.org/10.3389/fams.2021.649501
This article is part of the Research TopicArtificial Intelligence in Insurance and FinanceView all 12 articles
 Tiffany Jiang1,2*
An unprecedented amount of access to data, “big data (or high dimensional data),” cloud computing, and innovative technology have increased applications of artificial intelligence in finance and numerous other industries. Machine learning is used in process automation, security, underwriting and credit scoring, algorithmic trading and robo-advisory. In fact, machine learning AI applications are purported to save banks an estimated $447 billion by 2023. Given the advantages that AI brings to finance, we focused on applying supervised machine learning to an investment problem. 10-K SEC filings are routinely used by investors to determine the worth and status of a company–Warren Buffett is frequently cited to read a 10-K a day. We sought to answer–“Can machine learning analyze more than thousands of companies and spot patterns? Can machine learning automate the process of human analysis in predicting whether a company is fit to merge? Can machine learning spot something that humans cannot?” In the advent of rising antitrust discussion of growing market concentrations and the concern for decrease in competition, we analyzed merger activity using text as a data set. Merger activity has been traditionally hard to predict in the past. We took advantage of the large amount of publicly available filings through the Securities Exchange Commission that give a comprehensive summary of a company, and used text, and an innovative way to analyze a company. In order to verify existing theory and measure harder to observe variables, we look to use a text document and examined a firm’s 10-K SEC filing. To minimize over-fitting, the L2 LASSO regularization technique is used. We came up with a model that has 85% accuracy compared to a 35% accuracy using the “bag-of-words” method to predict a company’s likelihood of merging from words alone on the same period’s test data set. These steps are the beginnings of tackling more complicated questions, such as “Which section or topic of words is the most predictive?” and “What is the difference between being acquired and acquiring?” Using product descriptions to characterize mergers further into horizontal and vertical mergers could eventually assist with the causal estimates that are of interest to economists. More importantly, using language and words to categorize companies could be useful in predicting counterfactual scenarios and answering policy questions, and could have different applications ranging from detecting fraud to better trading.
AI applications are changing the financial services industry. Fraud detection and compliance, banking chatbots and robo-advisory services, and algorithmic trading are just a few applications that leverage artificial intelligence in their solutions. Consumer finance has benefited from increased security provided by AI’s ability to prevent fraud and cyber-security threats in a quantity unnoticed and unrecognizable by humans. Corporate finance has benefited through AI’s ability to answer prediction questions–whether it is the future of loan risks or stock price, AI has been able to power strong portfolios and minimize risk of loan underwriting. AI has been key in improving process automation, where intelligent character recognition makes it possible to automate routine chores that are time-consuming and prone to mistakes. JP Morgan Chase, a leading financial firm, developed Robotic Process Automation to extract data and a Contract Intelligence (COiN) platform to leverage natural language processing (NLP), processing legal documents and extracting essential data. 360,000 labor hours reading 12,000 contracts was cut down to just a few hours. To better detect accounting fraud, the SEC is now using topic models. They draw on text mining and NLP to help us understand the behavioral incentives of different market participants. These are unsupervised learning techniques, and these applications can be used to learn from past violations of regulations and predict new ones. Insider trading and cartel detection are examples. In our case, we will be using supervised machine learning to determine new irregularities in company behavior–merging and acquiring.
From 1982 to 2012, industries in manufacturing, retail trade, wholesale trade, services, finance, and utilities and transportation reported remarkably consistent upward trends in concentration in each sector. The relationship between trends in concentration and competition have presented two hypotheses: an increase in concentration indicates a decline in competition, or a concentration increase reflects the forces of competition and has presented economies of scale. To begin to answer the question of which hypothesis reflects the current trends of large incumbent firms and their gains in market share, we sought to examine characteristics of a firm that predicted merger activity. Prediction is particularly useful to answer a merger question in two ways–first, it allows the examination of a counter-factual, or in this case, a merger retrospective. Second, predicting scenarios of mergers that might lessen competition in the future aids with preventing the loss of potential competition.
Anti-trust economists are generally interested in enforcing stricter merger policy to protect consumers. For instance, a firm’s growing market power could drive up prices and lower wages and standards of living. It is in societal interest that antitrust authorities are able to identify and punish collusion in order to promote competition. Vertical mergers are often seen as socially desirable, while horizontal mergers are not. The answer of how to enforce horizontal mergers is an empirical question that is answered by examining merger retrospectives–which mergers harmed customers by lessening competition?
Gentzkow, Kelly, and Taddy (2018) detailed the importance of causal inference compared to prediction in economics. Commonly, economists are more interested in the “how” of a question. They detail how increased data sources could supplement traditional data, especially in finance economics. “For social scientists, the information encoded in text is a rich complement to the more structured kinds of data traditionally used in research, and recent years have seen an explosion of empirical economics research using text as data. In finance, text from financing news, social media, and company filings is used to predict asset price movements and study the causal impact of new information.” In our case, we are using company filings in order to predict merger activity and study the causal impact of this new data set.
With the newly available quantities of digital text, we sought textual data that could complement current financial data of firm characteristics. Often times, firm characteristics have been measured using financial data and stock prices. Unique aspects of a firm, we conjectured, such as culture, heavy legal involvement, or product descriptions are not as easy to identify through just numerical values alone. A financial value is one number, and it is hard to distinguish specific characteristics of a firm other than profits. A firm’s 10-K SEC filing, an annual document required by the government for all firms to complete, details around 15 items and five distinct sections that includes business, risk factors, selected financial data, management’s discussion and analysis of financial condition and results of operations and financial statements and supplementary data. Using text data to supplement current available datasets of a firm, we hypothesized, could gain more insight to the qualities of a firm that predict merger activity. As a next step, we plan on categorizing the acquisitions to horizontal or vertical mergers using detailed product descriptions, or determining which section of a 10-K document has the most predictive ability.
To analyze the text, we modeled the methods after those described by Gentzkow, Kelly, and Taddy (2017). After transforming the text into arrays of words, we further reduce the dimensionality by using LASSO techniques to select words that are promising prediction variables. To select the best model penalized by the LASSO, we used cross-validation techniques to select the best performing regressor variables.
The application of machine learning and textual analysis is unique to economics in two ways.
First, economics commonly does not look at prediction problems. Text data differs from other kinds of economics data in that it is inherently high dimensional. While this is useful for prediction, this makes it difficult for any sort of causal analysis because the high dimensionality of the data makes ordinary least squares (OLS) and other traditional economics techniques infeasible. The main category of interest is causal inference, or identification. “Economics journals emphasize the use of methods with formal properties of a type that many of the ML methods do not naturally deliver. This includes large sample properties of estimators and tests, including consistency, normality, and efficiency.” [1–4] The object of interest is a causal effect, which can be quantified with semi-parametric estimates, or when the number of covariates are large relative to the observation. However, ML and prediction could still provide benefits to economic analysis.
ML could improve empirical analysis to selection functional form flexibly. ML could estimate and compare many models, which is different from economics, where a research will pick a model based on hypothesis and estimate it once. ML also could evaluate the simpler questions of prediction and classification tasks. More work needs to be done to apply an algorithmic approach to economic problems, as they says, but using ML “could provide the best of both worlds: the model selection is data driven, systematic, and a wide range of models are considered; yet, the model selection is fully documented, and confidence intervals take into account the entire algorithm. ML is a very powerful tool for data-driven model selection.”
Second, an increased amount of data and the different types of data will become available to economists. Text data and increasing digitization suggest new identification questions to be answered, and digitization is leading the amounts of big data that can be used in economics. According to Gentzkow, Kelly, and Taddy, “In industrial organization and marketing, text from advertisements and product reviews is used to study the drivers of consumer decision making. In political economy, text from politicians’ speeches is used to study the dynamics of political agendas and debate. The most important way that text differs from the kinds of data often used in economics is that text is inherently high dimensional.” In our case, text is a new form of data in economics that was previously unused. 10-K SEC filings are just a case example of how text can be used to supplement the traditional economic database. The 10-K document also has significance in the role of an investment banker or analyst–they are commonly read over and used to determine the worth of a company and to evaluate the landscape of the business. The document includes pages and pages of what the company itself, the expert in their own business, summarizes and even discloses a risk factor analysis. As to abide by legal guidelines, companies are incentivized to be as thorough and exhaustive as possible as to avoid misleading stakeholders. Previously, only financial data and stock prices were examined in order to analyze a company. To measure harder to observe variables that are not just captured in financial variables, we propose using a text document and examine a firm’s 10-K SEC filing. Statistical learning technique also offers an advantage by taking into account many aspects of the data.
Our procedure uses big data. We use tens of thousands of disclosures, and even more words in order to obtain predictive regressors from the text. We propose to use LASSO as a regularization technique, which has been more successful than the bag-of-words method and RIDGE regression. We used the K-fold cross validation in order to obtain the best hyper-parameter.
Three common ways of looking at merger types are to categorize them into horizontal, vertical and conglomerate mergers. Merger motives are primarily due to financial considerations for the profit maximizing firm, and these considerations are driven by increasing market power, exploiting economies of scale, and eliminating managerial inefficiency. Other motivations include risk reduction by diversifying activity, government policy, and principal-agent problems in which company managers have different interests from the stakeholders and prefer to instead maximize their own income. To examine theoretical models of mergers we have three groups. The first are neoclassical models, which propose that merger waves come from political, economic, industrial, or regulatory shocks. The second are models that demonstrate herding, hubris or agency problems and propose takeovers are led by managerial inefficiency. The third are models that reflect capital market development and attribute mergers to market timing. The second may be hard to measure through words alone.
Coase (1937) is an early proponent of the model suggesting that takeover activity is driven by technological change. A later model by Gort (1969) claims that economic disturbances, such as market disequilibrium, may cause wholesale industry restructuring.
Jovanovic and Rousseau (2001, 2002) builds on Gort’s theory, and developed the Q-theory of takeovers, which posits that economic and technological changes cause a higher degree of corporate growth opportunities. Such changes may cause capital to be reallocated to more productive and efficient firms. What about situations that do not fall into any of these categories? These is where the regularization and the selection of predictive variables could reveal situations that have been unprecedented in previous patterns.
Gentzkow and Shapiro popularized the use of text as data by measuring a previously difficult to observe variable, media slant. They determined whether a newspaper was more Republican or Democratic, and then used words that captured slant to incorporate in a demand function that maximizes newspaper profits to predict consumer behavior. This was compared with an actual profit maximizing choice to validate economic preference, and it was found that consumers had a preference for newspapers that were like-minded.
[5] determine firm similarity and product differentiation through textual analysis and found that estimating patterns of similarities in this method performed better than SIC or NAICS codes. However, SIC and NAICS codes have major drawbacks of being too broad. First, neither reclassifies firms significantly over time as the product market evolves. Second, neither can easily accommodate innovations that create entirely new product markets. In the late 1990s, hundreds of new technology and web-based firms were grouped into a large and nondescript SIC-based “business services” industry. Third, SIC and NAICS impose transitivity even though two firms that are rivals to a third firm might not be rivals. Hoberg and Phillips further examined asset complementaries as a way to analyze merger pairs and further predict merger activity.
[6] use market conditions to test the effects of uncertainty on acquisition by using a firm’s financial data that includes size, stock returns, and dividends to find that assets and being in a high acquisition industry increases the probability of being acquired. The model yields R-squared of around 0.02.
Previous attempts to explain merger activity have yielded a Psuedo R-squared that ranges from 0.01 to 0.09. [7–9].
[10] are the first to use words alone to predict merger activity. The authors cite a number of papers that use various financial information to predict merger activity and note “predicting target firms with any accuracy has proven difficult” (Betton, Eckbo, and Thorburn, 2008). In their study, they use one specific section of a company’s 10-K SEC filing, the firm’s Management Discussion and Analysis and two-word phrases to fit their model. Their text uses the frequency of words appearing on a document and transform the counts with a logarithm function to account for any right-hand skew. Their main discovery supports the Q-theory of takeovers and find that firms that are struggling financially are more likely to be acquired. Their models range from a 0.01 to a 0.07 R-squared.
None of these past works, however, uses the entire document. Our dataset is also the most recent. Our dataset is from 2013 to 2017, and the landscape for technology and business is arguably much different from 10 years ago. Previous works have also attempted to evaluate the accuracy of a model by using Pseudo R-squared, still attempting to retain some interpretability from the data. We propose using accuracy to measure predictive success. Future studies could include different measures of accuracy, such as sensitivity and specificity, or measuring an ROC curve. No method also uses tf-idf to transform the text data. Tf-idf accounts for common and rare words and considers how important a word is to the document. This adds some transformation to text data that could reduce noise and add significant information to the regression.
Theoretically, neoclassical models have pointed to the ways that increase the likelihood of a firm merging with another. These changes have been hard to measure in the past, and accordingly have not had confident estimates about the magnitude of an effect or a conclusion on the sign. Thus, we turn to a different empirical investigation.
The central contributions of this study are 1) an application of machine learning in economics to uncover a new field of policy and prediction questions previously unanswered, and 2) using text as a new dataset previously unused in economics.
The estimates presented below are based on US SEC filings for the periods of 2013–2016. Merger activity are based on aggregate U.S. data from 2013 to 2017 (Table 1).
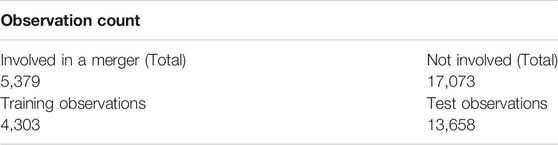
TABLE 1. Observation count broken down, from years 2013–2017.
We performed the standard cleaning to transform the 10-K filings into a text corpus data set. Punctuation and common words were removed, white space was stripped, and all words were transformed for lower characters. We defined each observation as a 10-K SEC filing - this is our document for cleaning.
The method used to represent the documents was filtering first by “tf-idf”, or “term-frequency inverse-document-frequency”. This method excludes both common (“a”, “the”, “and”) and rare (“sesquipedalian”, “phantasm”) words. Rare words are excluded to optimize model fit, as their marginal value of meaning often exceeds adding more features to the model. Common words that appear with most documents will have a low tf-idf score, and words that have a low tf-idf score will be cut off from the document. This technique has proven to be very useful in practice as it reduces the number of features to something more manageable [11].
Term Frequency1: Measures how frequently a term occurs in a document. Since every document is different in length, it is possible that a term would appear much more times in long documents than shorter ones. Thus, the term frequency is often divided by the document length (aka. the total number of terms in the document) as a way of normalization.
Inverse Document Frequency: Measures how important a term is. While computing TF, all terms are considered equally important. However it is known that certain terms, such as “is”, “of”, and “that”, may appear a lot of times but have little importance. Thus we need to weigh down the frequent terms while scaling up the rare ones.
We start off with textual data because of the use of 10-K’s by investment bankers and investors to determine company value. The 10-K differs from other documents such the annual shareholders report in length, detail, and scrutiny and are meant to be lengthy, detailed, and not easily digestible. Successful fund managers have cited reading the 10-K as a way to gauge worthwhile investments and have listed notable sections in the Management Discussion and Analysis, the chairman’s letter, the risk factor analysis, proxy statements, earnings adjustments and even footnotes. See Table 2 for the full 10-K description.
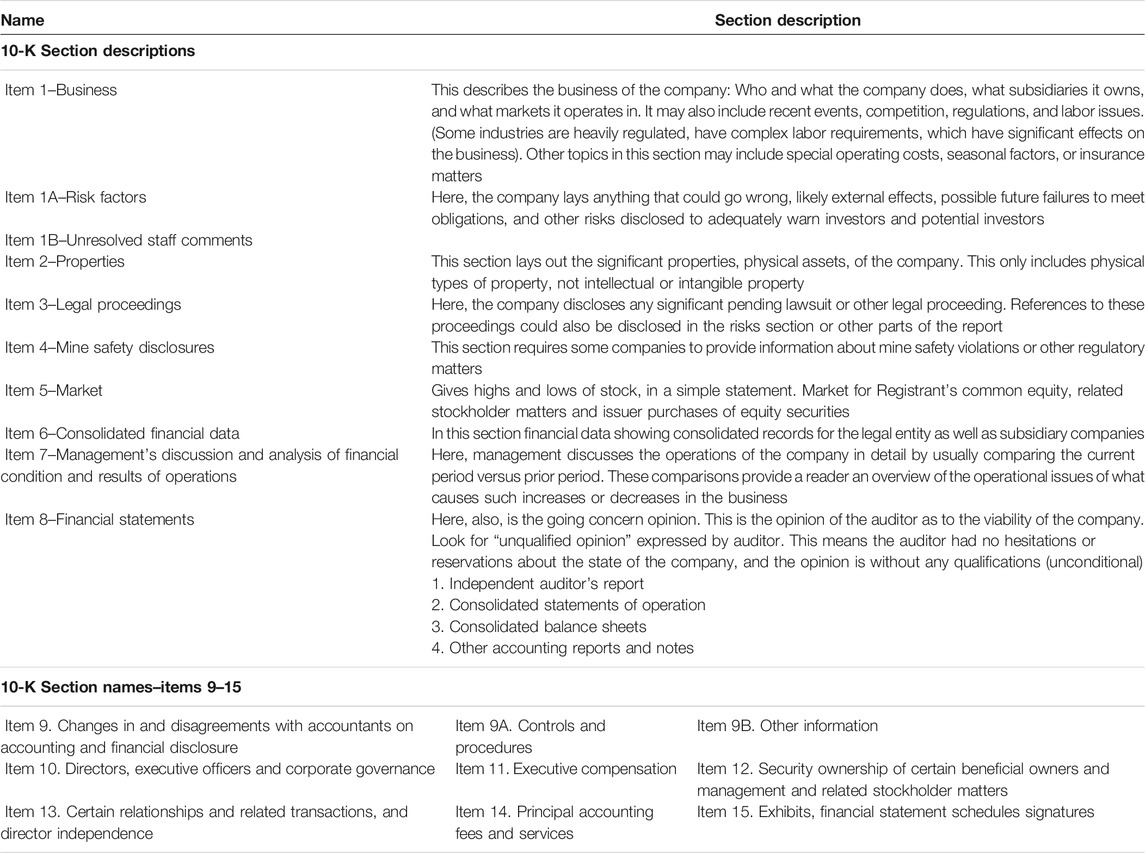
TABLE 2. Detailed description of a 10-K filing.
We use the entire document in our findings. Total observations are 22,418. We try to test whether there is a way to develop an automated decision support system for helping the human process determining the characteristics of a company and then use these new predictors to predict merger activity. Natural language processing techniques are ways to quantify business phrases such as “synergies” in a more robust manner or at least in a different way compared to previous methods.
Merger events are drawn through Thomson Reuters’ SDC Platinum database. Firms that have been recorded as involved with merger activity are labeled, and those that have not are also marked accordingly.
Three major steps were taken, in the following order, as modeled by [11]:
1. Represent raw text (documents) as numerical array C.
2. Map C to predicted values of
3. Use
The first step was completed using the cleaning and tf-idf method described in section 3.
We decided on using the LASSO over ridge or elastic net. In our case, we wanted to come up with a limited set of words that predicted merger activity. The high dimensionality.
The LASSO, or the Least Absolute Shrinkage and Selection Operator, imposes a restriction on a high-dimensional linear model. The model is penalized by the size of the model through the absolute values of the coefficients [12]. define the LASSO as
where λ > 0 is the “penalty level” and γj are the “penalty loadings.” [13, 14] discuss how the LASSO corresponds to 1) a quadratic loss function, 2) a class of linear functions (over some fixed set of possible variables), and 3) a regularizer which is the sum of absolute values of coefficients. This absolute-value regularizer shrinks many coefficients to zero, yielding an approximately sparse linear framework.
With regularization techniques such as the LASSO comes the advantage of allowing for “wide” data, where there are more regressor variables than observations themselves, such as the case with the text data from the SEC filings. Using such machine learning techniques effectively allows for the data to speak for itself–the LASSO could potentially uncover generalizable patterns that were not specified by the economist in advance.
However, there are limitations to using the LASSO [13]. detail how correlations between variables must be limited. There are two particularly strong assumptions for the LASSO to hold - that first, only a few variables are relevant, and second, none of the irrelevant covariates can be even moderately related to the set of relevant ones. This leaves danger of interpreting the
As increasingly flexible methods are used, variance will increase and bias decreases. Traditional models want no bias. Machine learning allows some bias and reduces variability (e.g., Lasso, Ridge). The model is penalized for size, i.e., how many coefficients is put into the equation. To adjust, a different sample once a model is selected to test for goodness of fit. In order to ensure that the model we created has external validity, we use cross-validation training techniques and separate the dataset to a training set and a test set.
In order to select the optimal λ, we used the K-fold cross-validation technique. This splits our sample into 10 subsets, and then fit a model 10 times excluding each subset in turn. With this, 10 mean squared errors were obtained by verifying the accuracy of the model fit on the subset that was left out for 100 values of λ. The value of λ which minimizes the average error was selected as the λ in the final prediction model.
Given our explanatory variables, our prediction y will have a binary value: 1 for a prediction that a firm will be involved in the merger as either a target or be the takeover company, 0 for a prediction that will not. The final formula is:
To model the relationship between p(X) = Pr(Y = 1|X) and X, we use the logistic regression:
To fit this logistic regression, the parameters are fit through a maximum likelihood function:
Seeing the low prediction rate of our original theory, we decided to try to find the best prediction model instead. With this result, the LASSO selected 12 words as predictors (Table 3). Given the size of the estimates and the nature of tf-idf, the results are difficult to interpret and the best method to find the predictors of a firm’s potential to merge would probably be to feed the individual 10-K document into the code and observe each result on a case by case basis. However, perhaps the word “but” could signify a struggling firm - perhaps management needs to explain poor performance by using the word “but” a lot to argue in favor of the firm.
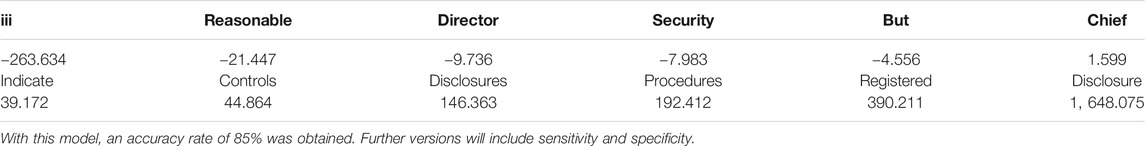
TABLE 3. Words picked by the LASSO, tf-idf.
Originally, we represented words using the bag-of-words method (Table 4). This technique represents words in terms of frequency, where wordij is an element in the dictionary vector that appears j times in document i.
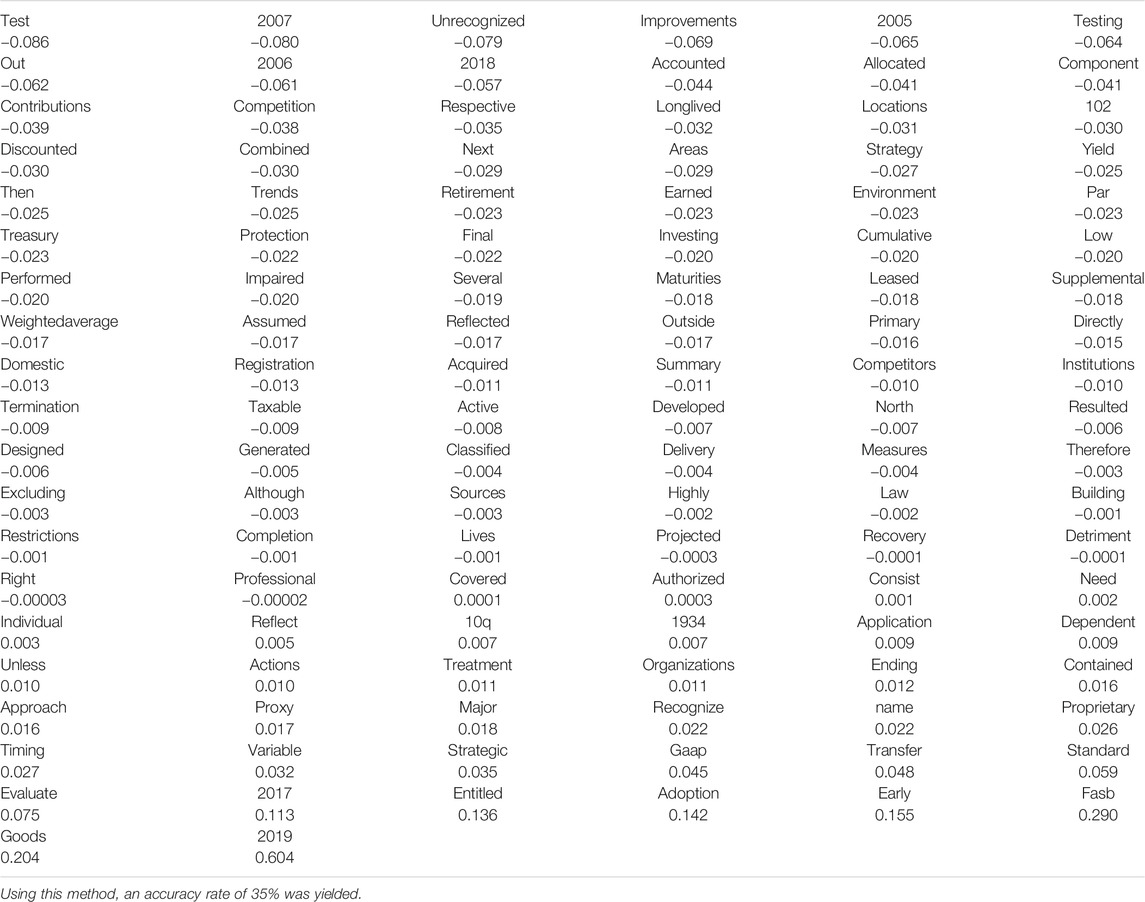
TABLE 4. LASSO results, Bag of Words method.
Example2, where the text of document i is:
Good night, good night! Parting is such sweet sorrow.
After stemming, removing stop words, and removing punctuation, we might be left with “good night good night part sweet sorrow.” The bag-of-words representation would then have cij = 2 for j ∈ {good, night}, cij = 1 for j ∈ {part, sweet,sorrow}, and cij = 0 for all other words in the vocabulary.
To test whether words supplemented financial datasets when describing a firm or could completely replace financial variables entirely when looking to predict merger activity, we used financial variables to predict merger accuracy to compare it to textual accuracy (Table 5). Financial variable accuracy yielded a 85% success rate. However, the interpretability of the variables is different from the text regression, and offers different insight. This suggests text supplementing financial variables could be a powerful combination.
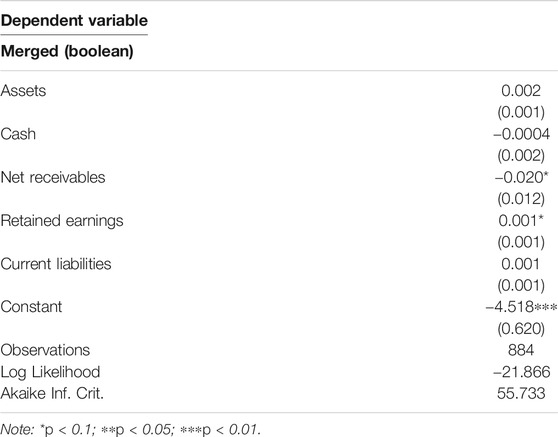
TABLE 5. Financial regression.
Originally, we had personally narrowed down a dictionary of words without using tf-idf in order to attempt to use some amount of theory to drive the variables that would go into the model.
To verify Jovanic and Rousseau’s theory on take-overs for the financially deteriorating firm, we hypothesized that one would look for characteristics that signal a poorly performing firm. To study whether firms abide by diversification incentives or horizontal and vertical merger incentives, one would prefer information on the specifics on a firm such as product descriptions and equipment. While examining a principal agent problem, one would look for information detailing management and executive leadership.
We looked for this information in the 10-K sections that described who and what the company does, subsidiaries it owns, and what markets it operates in, recent events, competition, regulations, and labor issues, operating costs, season factors, and insurance matters as well as a section describing the properties and physical assets of the company. To aid with examining management concerns, the documents contain two pertinent sections: certain relationships and related transactions and director independence and directors, executive officers and corporate governance.
With this kind of motivation in mind, we used the bag of word techniques in attempt to verify existing theory. We assume that phrases such as “technological”, “commercial”, “marketing”, “integrated”, “data”, “development”, “electronically”, “technical”, and “support” are proxies for technological change as proposed by Coase (1937). “Liabilities”, “loan”, “losses”, “expense”, “adversely”, “adverse”, “negatively”, “fail”, “deteriorate”, “risk”, and “depreciation” are used to test Q-theory of takeovers. “Global”, “established”, “minimum”, “competitive”, “holders”, “forward looking”, “comparable”, “health”, “international”, “respect”, “power”, “properties”, “longterm”, “exceed”, and “trends” are used to test for market power theory. “Promotion”, “training”, “managerial”, “finance” are phrases that test for management inefficiency. We also test directly for mention of acquisition with “acquired”, “consolidated”, “accumulated”, “aggregate”, “integrated”, “cumulative”, “portfolio”, “spread”. For market conditions and any anti-trust considerations, we examine words such as “fluctuations” and “sarbanesoxley”. These proxy variables have limitations of having poor correlation with my intended variable of interest. As these are one-word phrases, it is difficult to directly measure the extent in which it describes the characteristic we wish to examine. For instance, “risk” is used to test for signs of a financially deteriorating firm, but perhaps the phrase “risk” was used in the phrase “little risk”. This method, however, did not achieve a high accuracy rate.
Traditionally, machine learning estimation works best in creating a predictive model. The trade-offs of creating a flexible, nonparametric predictive model are that causal interpretations are often lost. Linear regression is relatively inflexible approach but easy to interpret. Flexible models avoid assumptions of a particular functional form for a model, but require a large number of observations and are more difficult to interpret.
The limitations of this work are primarily definitional–defining accuracy in a more rigorous way, such as using sensitivity and specificity. Sensitivity would determine the accuracy of the amount of mergers correctly identified that would have merged. Specificity rates would determine the accuracy of determining the rate of non-mergers–the number of companies who are predicted to not merged over the amount that did not merge. This requires increased programming capabilities that a future paper could take into account. This limits how we can exactly we can interpret the prediction model. Using 2-word tokens, or two-word phrases, might also provide more information that we’d like to take as a next step. However, as Gentzkow, Kelly, and Taddy (2018) note, this might create memory and computational limitations, but could provide more insight on merger activity.
There are four potential next steps that we hope to take this research.
The first is to attempt to find the best predictive model by using different machine learning techniques. So far, we have used a penalized linear model to predict merger activity. However, there are also nonlinear regression methods such as generalized linear models, support vector machines, regression trees, and deep learning. There are also Bayesian regression methods such as the spike-and-slab, as well as topic modeling techniques such as Linear Discriminant Analysis. So far, the LASSO method is just one technique amongst the numerous machine learning methods.
The next direction is to attempt to predict horizontal and vertical mergers through product descriptions [15]. have discovered the limitations to categorize firms through traditional SIC and NAICS descriptions. For example, the descriptions do not reclassify firms over time as the product market evolves, or accommodate innovations that create entirely new product markets. Using product descriptions could potentially better determine whether a merger was horizontal or vertical, a pressing antitrust issue.
The third is to use the words to proxy characteristics of a firm in an index, the same way [16–19] measured slant.
This would be to see if there’s a way to predict specific types of mergers to prevent “loss of future competition occurred when a large incumbent firm acquires a highly capable firm operating in an adjacent space.”
The equation would look like:
To give an example, we took a look at two 10-k’s in 2013–Dish Network and Echostar. we predicted that maybe Dish would acquire Echostar eventually after reading the 10-K, and sure enough, they bought Echostar’s DBS and OTT assets in 2017. A few phrases that stood out: “ku-band payload,” “xrbl taxomony extension,” “high thorough geostationary,” “satellite orbit,” “transponder service agreements” showed up, both were a “colorado corporation”, and given the variations of “subscriber services” and “customer subscriptions” that showed up in Dish’s 10-k, Dish probably has more incentive to acquire to satisfy their customer base. “Treble damages” also showed up frequently in Echostar’s 10-K.
Lastly, merger types are usually well defined. However, a lot of “unusual” merger activity have occurred recently. For example: Amazon and Whole Foods, Intel and Caring.com, Delta Airlines and Refinery Phillips 66. Perhaps the “culture” of a firm would have to do with those who choose to engage in conglomerate mergers. This would be a textual exercise, where one would search for stylistic preferences and firm values. The equation might look like:
Previously, merger activity has been hard to define and predict. We believe, however, with more granular data that captures information about a company that financial variables could not, NLP and applied machine learning could begin to chip away at harder to understand cases of mergers. Our use of LASSO and tf-idf on a text regression produced favorable results and interpretability different from financial variables alone. We found that poor performance predicted merger likelihood because of a struggling firm becoming likely to become a takeover target. We found that tf-idf was favorable for prediction purposes compared to bag-of-words, and that financial variables also added prediction power. Machine learning, like in our case, can be applied to problems that were traditionally difficult to solve and offer insight that past datasets could not. Text is a powerful data source that could capture a lot of missing information that limited past research endeavors. We believe that an important transformation of economics and applied finance is underway.
The original contributions presented in the study are included in the article/supplementary material, further inquiries can be directed to the corresponding author.
The author confirms being the sole contributor of this work and has approved it for publication.
The author declares that the research was conducted in the absence of any commercial or financial relationships that could be construed as a potential conflict of interest.
All claims expressed in this article are solely those of the authors and do not necessarily represent those of their affiliated organizations, or those of the publisher, the editors and the reviewers. Any product that may be evaluated in this article, or claim that may be made by its manufacturer, is not guaranteed or endorsed by the publisher.
We would like to thank Giovanni Peri, Colin Cameron, and the faculty of UC Davis Economics.
1Source of definition of tf-idf comes from http://www.tfidf.com/
1. Athey, S. The Impact of Machine Learning on Economics. The Econ Artif Intelligence: Agenda (2019) 21:507–52. doi:10.7208/chicago/9780226613475.003.0021
2. Athey, S. Machine Learning and Causal Inference for Policy Evaluation. In Proceedings of the 21th ACM SIGKDD International Conference on Knowledge Discovery and Data Mining (2015) p. 5–6. doi:10.1145/2783258.2785466
3. Athey, S, and Imbens, GW. The State of Applied Econometrics: Causality and Policy Evaluation. J Econ Perspect (2017) 31(2):3–32. doi:10.1257/jep.31.2.3
4. Angrist, JD, and Pischke, J-S. Undergraduate Econometrics Instruction: Through Our Classes, Darkly. J Econ Perspect (2017) 31(2):125–44. doi:10.1257/jep.31.2.125
5. Hoberg, G, and Phillips, G. Text-Based Network Industries and Endogenous Product Differentiation. J Polit Economy (2017) 124(5):1423–65. doi:10.1086/688176
6. Harford, J. What Drives Merger Waves? J Financial Econ (2005) 77:529–60. doi:10.1016/j.jfineco.2004.05.004
7. Edmans, A, Goldstein, I, and Jiang, W. The Real Effects of Financial Markets: The Impact of Prices on Takeovers. J Finance (2012) 67:933–71. doi:10.1111/j.1540-6261.2012.01738.x
8. Chatterjee, S, John, K, and Yan, A. Takeovers and Divergence of Investor Opinion. Rev Financ Stud (2012) 25(1):227–77. doi:10.1093/rfs/hhr109
9. Cocco, JF, and Volpin, PF. Corporate Pension Plans as Takeover Deterrents. J Financ Quant Anal (2013) 48(4):1119–44. doi:10.1017/s0022109013000355
10. Routledge, B, Sacchetto, S, and Smith, N. Predicting Merger Targets and Acquirers from Text. Carnegie Mellon University Working Paper (2018).
11. Gentzkow, M, Kelly, B, and Taddy, M. Text as Data. J Econ Lit (2019) 57(3):535–74. available at: https://web.stanford.edu/∼gentzkow/research/text-as-data.pdf. doi:10.1257/jel.20181020
12. Belloni, A, Chernozhukov, V, and Hansen, C. High-Dimensional Methods and Inference on Structural and Treatment Effects. J Econ Perspect (2014) 28(2):29–50. doi:10.1257/jep.28.2.29
13. Mullainathan, S, and Spiess, J. Machine Learning: An Applied Econometric Approach. J Econ Perspect (2017) 31(2):87–106. doi:10.1257/jep.31.2.87
14. Tibshirani, R. Regression Shrinkage and Selection via the Lasso. J R Stat Soc Ser B (Methodological) (1996) 58(1):267–88. doi:10.1111/j.2517-6161.1996.tb02080.x
15. Hoberg, G, and Phillips, G (2018). Product Integration and Merger Success. Tuck School of Business Working Paper No. 2933283, Marshall School of Business Working Paper No. 17–21. Available at: https://ssrn.com/abstract=2933283.
16. Gentzkow, M, and Shapiro, J. What Drives Media Slant? Evidence from U.S. Daily Newspapers. Econometrica (2010) 78(1):35–71. doi:10.3982/ecta7195
17. Kleinberg, J, Ludwig, J, Mullainathan, S, and Obermeyer, Z. Prediction Policy Problems. Am Econ Rev (2015) 105(5):491–5. doi:10.1257/aer.p20151023
18. Gregoriou, GN, and Renneboog, L. Understanding Mergers and Acquisitions. Quantitative Finance (2007) 1:1–20. doi:10.1016/b978-075068289-3.50003-4
Keywords: supervised training, machine learning, finance, mergers and acquisations, text
Citation: Jiang T (2021) Using Machine Learning to Analyze Merger Activity. Front. Appl. Math. Stat. 7:649501. doi: 10.3389/fams.2021.649501
Received: 04 January 2021; Accepted: 16 July 2021;
Published: 02 August 2021.
Edited by:
Glenn Fung, American Family Insurance, United StatesReviewed by:
Simon Grima, University of Malta, MaltaCopyright © 2021 Jiang. This is an open-access article distributed under the terms of the Creative Commons Attribution License (CC BY). The use, distribution or reproduction in other forums is permitted, provided the original author(s) and the copyright owner(s) are credited and that the original publication in this journal is cited, in accordance with accepted academic practice. No use, distribution or reproduction is permitted which does not comply with these terms.
*Correspondence: Tiffany Jiang, dGlmZmo1NkBnbWFpbC5jb20=
Disclaimer: All claims expressed in this article are solely those of the authors and do not necessarily represent those of their affiliated organizations, or those of the publisher, the editors and the reviewers. Any product that may be evaluated in this article or claim that may be made by its manufacturer is not guaranteed or endorsed by the publisher.
Research integrity at Frontiers
Learn more about the work of our research integrity team to safeguard the quality of each article we publish.