 Stefano Polizzi
 Alain Arneodo
 Francisco-José Pérez-Reche
 Françoise Argoul
- 1University Bordeaux, CNRS, LOMA, UMR5798, Talence, France
- 2Institute for Complex Systems and Mathematical Biology, SUPA, University of Aberdeen, Aberdeen, United Kingdom
Actin is the major cytoskeletal protein of mammal cells that forms microfilaments organized into higher-order structures by a dynamic assembly-disassembly mechanism with cross-linkers. These networks provide the cells with mechanical support, and allow cells to change their shape, migrate, divide and develop a mechanical communication with their environment. The quick adaptation of these networks upon stretch or compression is important for cell survival in real situations. Using atomic force microscopy to poke living cells with sharp tips, we revealed that they respond to a local and quick shear through a cascade of random and abrupt ruptures of their cytoskeleton, suggesting that they behave as a quasi-rigid random network of intertwined filaments. Surprisingly, the distribution of the strength and the size of these rupture events did not follow power-law statistics but log-normal statistics, suggesting that the mechanics of living cells would not fit into self-organized critical systems. We propose a random Gilbert network to model a cell cytoskeleton, identifying the network nodes as the actin filaments, and its links as the actin cross-linkers. We study mainly two versions of avalanches. First, we do not include the fractional visco-elasticity of living cells, assuming that the ruptures are instantaneous, and we observe three avalanche regimes, 1) a regime where avalanches are rapidly interrupted, and their size follows a distribution decaying faster than a power-law; 2) an explosive regime with avalanches of large size where the whole network is damaged and 3) an intermediate regime where the avalanche distribution goes from a power-law, at the critical point, to a distribution containing both 1) and (ii). Then, we introduce a time varying breaking probability, to include the fractional visco-elasticity of living cells, and recover an approximated log-normal distribution of avalanche sizes, similar to those observed in experiments. Our simulations show that the log-normal statistics requires two simple ingredients: a random network without characteristic length scale, and a breaking rule capturing the broadly observed visco-elasticity of living cells. This work paves the way for future applications to large populations of non-linear individual elements (brain, heart, epidemics, … ) where similar log-normal statistics have also been observed.
1 Introduction
Avalanche processes are very common in living systems, such as firing rates in brain [1], fractures in living cells cytoskeleton (CSK) [2], but also in amorphous [3] and random media [4], or earthquakes. Actually, all the systems that can be considered as composed by elementary threshold units, which are connected and can transfer information to each other, are subject to avalanches. Indeed, as soon as a unit reaches its threshold it can cause other units to do the same in turn.
In statistical physics, avalanches are often treated in the framework of critical systems. This is justified by the observation of critical behavior of avalanche statistics, with distributions usually approximated by power-laws, at least for some length or energy scales. Power-laws are reminiscent of self-organized criticality [5], and are ubiquitous for avalanches in solids and amorphous materials [6–9], describing for example the avalanche sizes of a granular material falling apart. Self-organized criticality has also been associated to neural dynamics (first in [10] and later in [11, 12]), showing widely spread power-law statistics with a typical exponent invariant among different species [12] and in different environmental situations. Lately, sleep-wake micro-architecture and regulation have been identified as non-equilibrium processes to maintain a critical state of the brain network [13, 14]. In all these examples, fluctuations, and thus their distribution, play a major role in triggering the system to the critical state. Recently, some doubts about the ubiquity of power-law distributions have been advanced [15], pointing out that many real system’s data are actually better fitted by other skewed, fat-tailed distributions, such as the log-normal. This is true for network degree distributions, in social, biological or technological networks [15], but also for avalanche statistics, in neural networks [16, 17] or living cells cytoskeleton [2]. Indeed, the growth of a network can be seen itself as an avalanche process, thinking for example of the preferential attachment rule [18]. In general, power-law distributions are difficult to irrefutably hold for any kind of real data. Remarkably, power-law and log-normal distributions are closely related to each other and small variations in the generative mechanisms can lead to one or the other [19, 20].
Nevertheless the power-law, with some adaptations, has been the largely dominant model in the last decades for all data showing a fat-tailed distribution, either for network theory or for avalanche processes. There are mainly two reasons for the large predominance of the power-law modeling up to now: 1) because much is known about the modeling of power-laws, thanks to the statistical physics of phase transitions, leading to an ease of data treatment and interpretation. Concerning network science theory, the same is true for scale free networks [21], justifying a power-law interpretation of real data distributions, while models for other fat tail distributions do not exist so far [15, 22]; 2) due to the difficulty to fit real data with fat-tailed distributions, because a power-law tail is only visible beyond a given threshold of the random variable, and not in the whole domain. Actually, any skewed distribution can be approximated by a power-law, if only a finite and small scale range is taken into account (see Figure 1C). In Figure 1, comparing the distributions of hippocampal firing rates in a linear scale (Figure 1A), in a log-lin scale (Figure 1B) and in a log-log scale (Figure 1C), we realize that focusing on the tail of the distribution in a log-log representation increases the risk of missing some essential features of the underlying process [17].
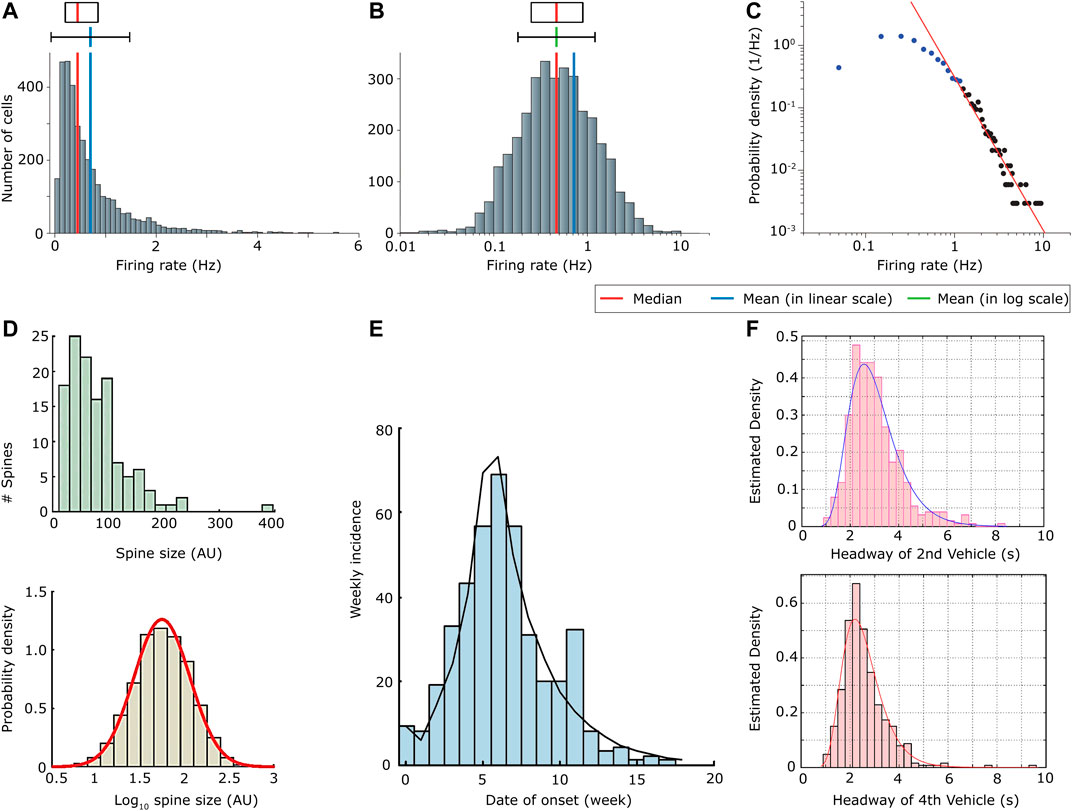
FIGURE 1. (A) Non-normalized distribution of firing rates of hippocampal CA1 pyramidal neurons during slow-wave sleep. The firing rate is measured in Hz; (B) Distribution (non-normalized) of the logarithm of the firing rate as in (A); (C) Distribution of the firing rate as in (A) in a log-log plot. Notice that by taking into account only the tail of the distribution (black dots), the distribution could be fitted by a power-law, even though we may be missing some important information; (D) Distribution of the spine size in arbitrary units (AU) (top), and probability density of the logarithm of the spine size (bottom); (E) Distribution of the new number of Ebola cases per week (week incidence); (F) Probability density of the lag times at which 2 vehicles waiting at rest at a traffic light pass the stop line. This is what is called headway. The distributions are reported for the lag between two successive vehicles considering the second position (top) and the fourth position (bottom) of the line: for instance the bottom plot describes the distribution of the difference of times at which the third and the fourth vehicle of the queue cross the stop line. All times are given in seconds; (A) (B) and (C) are adapted from [17] (D) is adapted with permission from [23] (E) is reproduced with permission from [24] and (F) from [25].
The point 2) led to an ongoing debate about what is the most appropriate fitting distribution for the considered data. Some concepts such as low-degree saturation and large-degree cutoff have been developed for example in network-science theory, in order to account for important characteristics of real systems, such as their finite size [22]. This solves point 2), adapting the power-law distribution to be applied to real systems. On the other hand, point 1) reveals the need of an alternative modeling framework which could validate the choice of other fat-tail distributions, in order to understand the underlying mechanisms leading to one distribution or the other. In the same way as degree distributions of networks, so far there are no models accounting for log-normal distributions of avalanches on networks, while there is strong evidence that log-normally distributed avalanches exist. In Figure 1, we show a few examples of processes related to an avalanche dynamics showing log-normal distributions: the distribution of the spine (small dendritic protrusion crucial in the transmission of electrical signals) sizes in neural networks [23] (Figure 1D); the distribution of new numbers of Ebola cases per week [24] (Figure 1E); the distribution of lags between two consecutive vehicles to cross the stop line at a crossroad [25] (Figure 1F).
Beyond power-laws and log-normals, other skewed distributions are sometimes used to model biological data. For example, it is worth mentioning the Gamma distribution used to model inter-spike intervals of neurons [26] or the inter-beat interval variation of heartbeats [27, 28]. We should notice that statistically it is not always easy to distinguish log-normal from gamma distributions. In any case both are alternative to the power-law framework.
Originally motivated by the experimental observation of log-normal statistics in avalanches of fractures of the CSK of living cells [2, 29], we focus in this paper on the modeling of log-normal avalanches on random networks. Our model is inspired by our previous 1-D model [2] and by works on epidemics spreading on networks [30, 31], in our case the population is represented by actin filaments, being in two possible states: cross-linked or not. The network structure models the CSK structure and the avalanche is a model for rupture mechanics in living cells, when plastic deformations are considered. Given that we do not consider here active cross-linking carried out from myosin filaments, the same framework can be applied to other cross-linked polymers with glassy dynamics. Therefore similar conclusions can be applied to amorphous glassy materials, like polymers, metallic glasses or colloidal glasses, which all share slow dynamics, and long mechanical relaxation delays [32]. This can be useful for understanding all processes not showing good power-law statistics, and in general what makes a distribution shifting from power-law to log-normal, highlighting the characteristics that a process needs to have to deviate from the most common power-law modeling.
2 Evidence for Log-Normal Statistics in Cell Mechanics
2.1 Brief Introduction on Cytoskeleton Mechanics
Among all the fascinating properties of living cells, we must emphasize their ability to constantly remodel their structural organization to withstand forces and deformations and to promptly adapt to their mechanical environment [33, 34]. This versatility is fundamentally required for many vital cellular functions, such as migration, mitosis, apoptosis or wound healing, and an alteration of the cell mechanical properties can participate in pathogenesis and disease progression, such as cancer [35, 36].
The mechanical properties of living cells are mediated by their CSK, a dynamic network of filamentous proteins composed of actin filaments, microtubules, and intermediate filaments [37–42].
We focus here with more details on the actin cytoskeleton. These filaments are the most relevant for our modeling, since they cover the perinuclear zone of cells, which is the cell compartment poked by our micro-indenting tips. They present a polar structure [43], a quite fast, with respect to global active reorganization processes, polymerization rate (larger than one per minute) and a depolymerization rate a little slower, of the order of one per a few minutes [44]. Moreover they can build a cross-linked network whose mechanical properties depend in general on the cross-linker proteins density and on the network structure.
Actin filaments networks are designed by a wide variety of actin-binding protein cross-linkers, which can be passive or active, i.e., activated by ATP (Adenosine Triphosphate) hydrolysis, the latter having a slower dynamics (time scale of tens of minutes) [37–42, 45, 46]. This cross-linked network gives to living cells some properties of soft-glassy materials [47, 48], such as the weak power-law dependence of the shear relaxation modulus G with both time and frequency. This behavior was first modeled by an empirical law known as structural damping from material engineering [49] and later on associated to the fractional visco-elastic Kelvin-Voigt model (a springpot and a dashpot in parallel), see e.g., [50]. The power-law decay (in time) is quite impressively not depending much on the particular experimental technique, neither on the different type of cell: the decay exponent α mostly belongs to the interval [0.2–0.4] [47, 51–54]. Notice that
For our purposes the three functional forms will be considered as equivalent, since they all account for a slow relaxation dynamics given by the glassy structure and thus a memory of the past deformation.
Considering cells as soft glassy materials, we can extrapolate that they are constructed from a disordered structure of connected discrete elements by weak attractive interactions. Each of these elements would be in a metastable state [48], allowing cells to flow, and therefore prone, for instance by an external forcing, to generate avalanches of fractures, which are typically out of equilibrium processes. Indeed, by tuning the proportions of passive or active actin-binding proteins, and reorganizing the network structure, living cells can control their power-law (scale-free) CSK rheology [37, 58]. Interestingly, cells exhibit both solid and liquid-like properties. Solid-like behavior is associated with strongly cross-linked actin filaments which resist sliding and accumulate tension [44, 59], while weakly cross-linking proteins produce actin filaments which slide more readily, enabling the network to flow as a liquid [60].
This paradox can be solved within the theory of soft glassy materials, by considering that, upon external deformations, the CSK of a living cell can undergo deep structural transformations such as the unfolding of protein domains, the unbinding of cytoskeletal cross-linkers, and the breaking of weak sacrificial bonds. All these structural changes are inelastic (non-reversible in a strict sense), they dissipate locally the elastic energy of the CSK network (structural damping) [61, 62].
The ability of cells to switch quickly from fluid-like responses to more brittle solid-like responses [2] is directly linked to the interplay between stability/rigidity and flexibility, in a way similar to what happens in neural networks [63]. This fast switch is likely driven by avalanche processes, which allow fast transfer of information. At the same time, such events reduce the connectivity of the CSK and may result in permanent plastic deformations or even more dramatic irreversible failures [38, 39] which, for instance, could be at the origin of the recently observed incomplete shape recovery of living cells after repeated creep [64]. These effects are reminiscent of those in cyclically loaded solids which can lead to fatigue-induced failure [4, 6, 7].
The observation of universal relationships governing cell (and not only) rheology is evocative of the universality of statistical mechanics systems, such as the Ising model [65], in which individual details of the filaments and particular molecular interactions are unimportant to identify global behaviors.
2.2 Poking Living Cells With a Sharp Atomic Force Microscopy Tip
Previous experiments done in our group motivated this study [2, 66, 67]. We introduce here the main characteristics of these experiments useful for the modeling. Atomic force microscopy (AFM) was operated in force-spectroscopy mode, therefore giving as result the force indentation curves, i.e., the plot of the instantaneous force against the indentation length inside isolated adherent cells. The indentation was stopped at a certain set-point force, after which the motion of the AFM tip was inverted. This was achieved after some calibration steps whose details can be found in [2, 66, 67]. It was important to carry out this indentation with very sharp tips (pyramidal or conical) with a tip curvature radius of only a few nanometers, allowing their penetration inside the meshes of the cross-linked network. The indentation was performed at constant velocity
The cell compartment poked by the AFM tip was the region just above the nucleus (perinuclear), which besides being better recognizable, is also very rich of actin stress fibers and cross-linked filaments. As previously noted [2, 66, 67] this indentation caused locally a strain stiffening, signature of an increased tension in the network, eventually resulting in local singularities in the force indentation curves, interpreted as avalanche of fractures. We were able, thank to the wavelet transform mathematical microscope [68–70], to quantify these singular events and characterize them, by their force drop, indentation length and finally energy released [2].
2.3 Rupture Event Statistics From Two Primary Cell Lines
Some examples of the statistics of these singular fracture events, together with global shear relaxation moduli distributions are shown in Figure 2. We can see that both the force drop
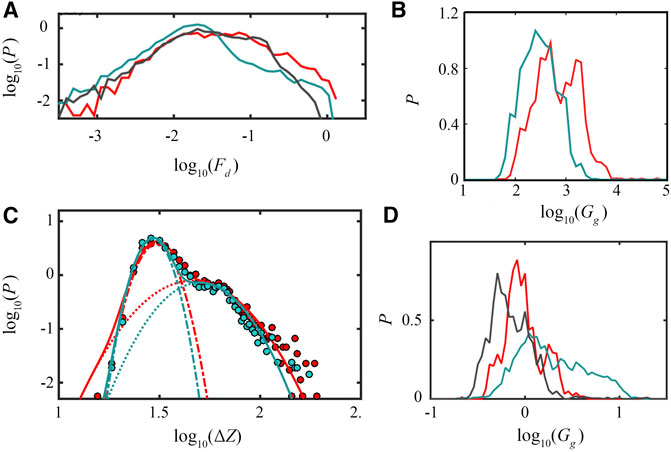
FIGURE 2. (A) Probability distributions of the logarithm of the local force drops
We speculate that the log-normal statistics observed in different living cell types on macroscopic elastic moduli (see also results on breast tissue cells from [55]) is strictly connected to the microscopic processes taking place in the polymer network, i.e., avalanches of reorganization fractures. Indeed, the log-normal statistics of avalanches would reflect in a log-normal noise (skewed fluctuations are observed also e.g., in [55]) biasing the estimation of the global elastic moduli. We can thus interpret the shear-relaxation modulus as the response of a sum of microscopic avalanches, as results of a dynamical reorganization of the network structure. This interpretation is supported by Sollich’s theory of soft glassy rheology [48], in which the glassy polymer is interpreted as composed of individual units in metastable energetic states (with different energy depths) and in which rearrangements are due to disordered interactions summarized by an effective temperature.
3 Random Network Presentation
3.1 A Random Network Model for the Cell Cytoskeleton
Let us now introduce our random network model for the cell CSK. We consider a network with N nodes, being identified as the actin filaments, connected by randomly assigned (in a way explained hereafter) links, identified as the cross-linker proteins. In light of what we said previously about CSK mechanics (see section 2.1), if we want to build a random network model for the cytoskeleton we need the network to be in a percolating regime. Indeed, since a cell can be seen as a soft glassy material there needs to be a giant, percolating cluster of connected nodes, allowing for the transition between a fluid material and a glassy one. A second important condition that we ask the network to satisfy is the correct degree distribution (i.e., the distribution of cross-links per filament) as observed in real living cells CSK. Unfortunately, precise data on this distribution do not seem to be available to our knowledge. However, from the literature [72], we can deduce that the degree distribution would not be well approximated by a power-law and therefore the CSK could not be modeled as a scale-free random network. There is also another reason why the scale-free network may not be a good model for cell CSK: it has been proved [73] that on scale-free networks the critical threshold for an epidemic is exactly 0, meaning that avalanches would always affect a finite proportion of the population (in the large N limit), thus implying irreversibly a large proportion of cross-linkers, scaling as the size of the system. This is not what is observed for avalanches of fractures in cells, since their distributions are of finite size.
For all these reasons, we propose a Gilbert [74] random graph to model the CSK structure. A Gilbert graph is a variant of the Erdős-Rényi graph [75], and the two graphs are equivalent in the large N limit. The network is constructed in the following way: 1) we define a network of N isolated nodes, with N fixed; 2) we connect each possible pair of nodes with probability
This process creates a network with a binomially distributed degree of connections:
where the binomial factor takes into account all the possible pairs of nodes having a degree of k, out of all possible
In the limit of
The average global number of links of the network, and thus of cross-linkers available for the avalanche, can also be computed by multiplying the probability of connection of pair of nodes
and then for a network of
Before moving on and describing the avalanche process, we would like to observe some characteristics of this network useful for our modeling. From probabilistic arguments it can be noticed (see [75]) that, in the limit of
This can be found by considering that the fraction of nodes u is composed by the sum of two separated events. A node i not belonging to the giant component is: i) either disconnected to an other node j because the link
At this point we can work out the probability
where the right hand side is the ratio of the average number of links not belonging to the giant cluster
On this network structure, an avalanche of ruptures is described by the following algorithm. Notice that while the probability of connection
• we pick at random a link of the network and we break it (removing it from the network), this initiates the avalanche
• look for the links coming out from both extremities of the broken link;
• we break all of them with a probability
• we consider the links coming out from the ones broken at the previous time step from both extremities and break them with probability
We repeat the last point and increase the time step by one unit, until the avalanche stops when there are no more links that break, either because the probability of breaking is too low or because of the damage caused to the network, which will have decreased the abundance of unbroken links. The time at which the avalanche stops,
Rupture avalanches propagate on networks that remain static during the rupture process, since actin polymerization and active cross-linkers act on time scales much longer than the time scale of the experiment, which is of the order of 1 s. Nevertheless this assumption is relaxed in section 3.4, to account for the fact that cross-linkers can be restored on very short time scales even by physical contact.
Statistically speaking an avalanche is a binomial process of probability
The probability of having k broken links is then given by the product of the Poisson distribution, giving the probability of having n links available for breaking, times the binomial distribution giving the probability of having k successes out of n trial. To include all possible disjoint events we have to sum over
The problem with this reasoning is that the number of available links is not drawn from the same distribution as far as the avalanche moves forward. Indeed the number of available links depends on the particular path of the avalanche, since the broken links disappear from the network. Therefore as far as the avalanche progresses, the number of available links may not even follow a Poisson distribution, making the analytic expression of the number of broken links impossible. The same is true if we consider the restoration of crosslinks, as in section 3.4, because the avalanche process introduces an effective and uncontrolled time dependence of p on t, by changing the actual number of available links. This effect is the main reason why we do not find perfect log-normals in our model, as in our first 1D model [2] or related models without a network structure [20]. Actually, this was checked on a random multiplicative process with a multiplicative factor drawn at each time step from the same distribution as in Eq. 7 for different parameters
We considered
It is conceptually interesting to note that the proposed avalanche model is actually equivalent to an epidemic model running with probability
Simulations of avalanches were done with self-written codes using open source software R version 4.0.2 and Python 3.6. Figures and data analysis were done with Python 3.6 using basic packages and a customized version of the module powerlaw [76] with a corrected computation of the cumulative distribution function and added graphical features. For all the following simulations it was checked that changing the size of the network N ((but keeping the same values of
3.2 Avalanche Statistics With Constant Probability of Breaking
First we implemented the avalanche model with a probability of breaking
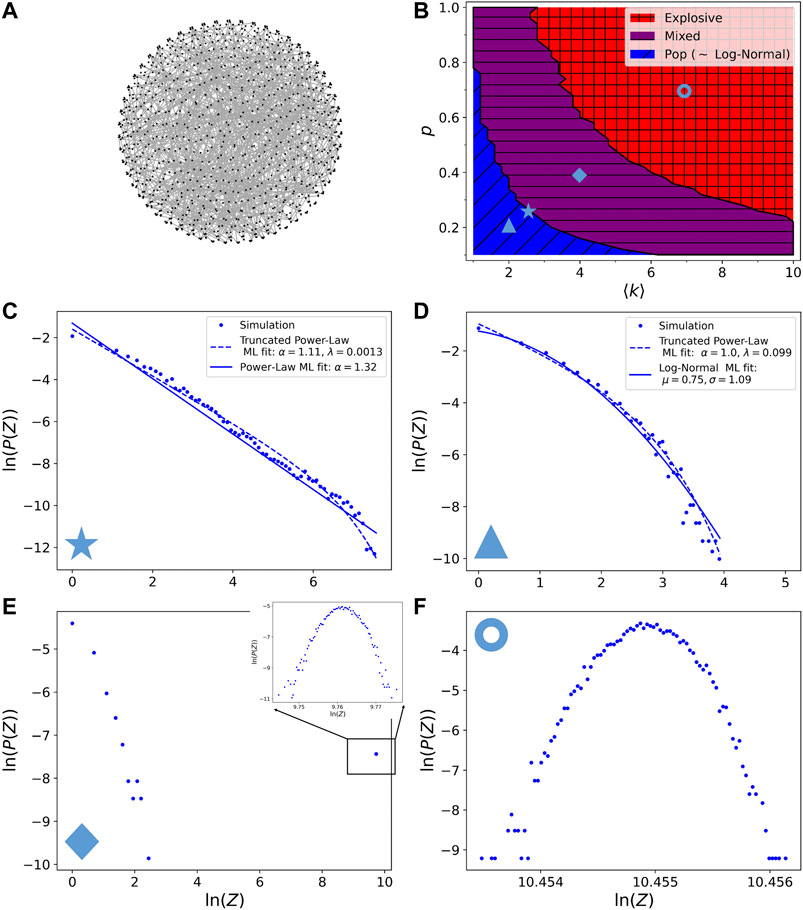
FIGURE 3. (A) Picture of the random network model, embedded in a sphere. Notice that this is just a choice of representation, the shape of the network is not fixed: our network model is only a set of connections, it can be embedded in any metric space. Dots are the nodes of the network and lines are the links. For better visibility the network has here only
A likelihood-ratio test, based on the ratio of the likelihood of the model fitted by two different distributions, can be done to compare possible outcome distributions [77]. In Figure 3D, we show the maximum of likelihood (ML) fit for the log-normal distribution and the truncated power-law distribution, with density function
When applying the likelihood-ratio test to compare the two distributions it turns out that the log-normal is always a better fit than the truncated power-law. For the example of Figure 3D, the p-value is
The boundary between the pop and mixed regimes is computed by an algorithm detecting for which parameters
In the mixed regime the size distribution consists of two separated parts: a small size part similar to the pop regime distribution and a large size part corresponding to a very narrow bump. In Figure 3E we show the full Z distribution in a log-log plot, in the inset is shown in detail the distribution of the large avalanche size narrow bump, represented by only one dot in the large field view. In this regime, moving toward the explosive regime causes a shift to the right of the large avalanche size bump and a decrease of importance of the small avalanche size part. Notice that the large avalanche size bump is not disappearing in the large N limit: if we take a distribution in the mixed regime for a given p and k and we increase the size of the network N (we did it for
Finally the explosive regime, of which a typical distribution is shown in Figure 3F is detected by the criterion of less than 1% of small size avalanches. In this regime the distribution of avalanche sizes is a very narrow bump having a size comparable to the number of links of the system. The integrity of the whole network is therefore compromised and only a few sparse links are intact.
Note that even though it could be tempting to say that the bump in mixed and explosive regimes is a log-normal distribution (remember that in a log-log representation a log-normal becomes a parabola), this cannot be assessed, because the distribution is very narrow and therefore a log-normal cannot be distinguished from a normal distribution. In none of the three regimes observed so far we can recognize avalanche size distributions similar to those observed experimentally, i.e., approximately log-normal and of finite size. Nonetheless, we observe that the distributions of the pop regime (showing a log-normal tail) are strikingly similar to those observed for avalanches of firing rates in freely behaving rats in [16]. In that work, even though the firing rate distributions were also claimed to follow a log-normal tail, it was justified from data undersampling, keeping the hypothesis of a critical state (and therefore power-law distributed). Our simulation results suggest another possible reason of the observed distributions, as given either by a small connectivity of the network or by an extremely fast absorption of the avalanches stress here the fact that our network model does not have a metric, hence no concept of distance, it is only a network of interactions. It does not matter if the links are close in space (see Figure 3A), but only if they format of <<>>. However, it is possible to embed the random network model in any metric space and in any shape, considering for example nodes that are connected to each other closer than others, without impacting our results: as far as the interactions follow this structure the shape of the network does not matter. With this interpretation the small pop avalanches in the mixed regime can be thought as a boundary effect: they represent avalanches where the starting randomly chosen link is in a less than average connected region.
3.3 Avalanche Statistics by Introducing Visco-elasticity
We now introduce the exponential relaxation coming from fractional visco-elasticity (see section 2.1). We let then the probability of breaking be dependent on time in the following way:
The
In Figure 4 we show the results after introducing a time dependent
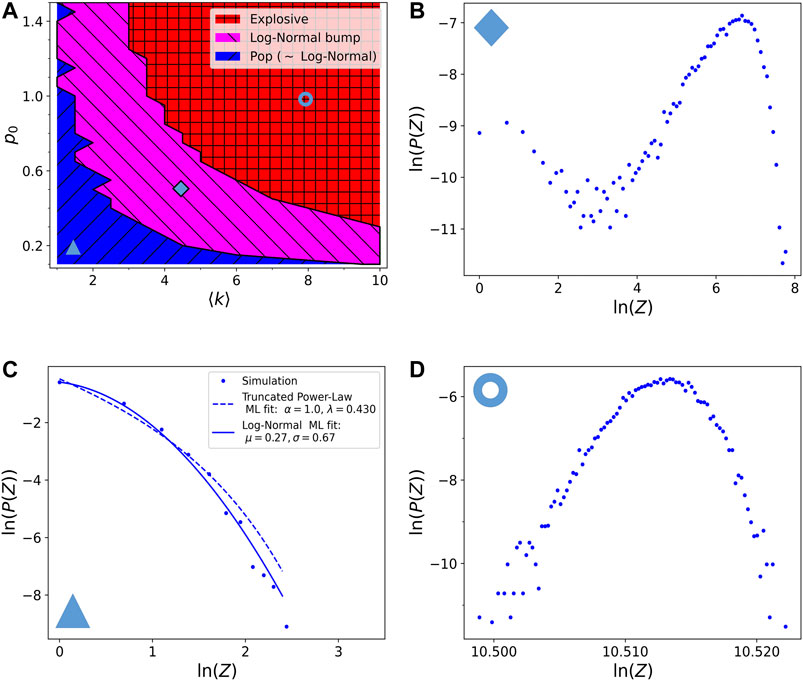
FIGURE 4. Phase diagram of the resulting avalanche size distributions with respect to the model parameters
The important difference introduced by a fractional visco-elastic relaxation is in the mixed regime, which shows now the emergence of an approximately log-normal finite size bump, and it is thus called the log-normal bump regime, in magenta. Indeed the very narrow bump observed in the non-visco-elastic model broadens here due to the time relaxing probability and it is not at a size comparable to the size of the system, therefore not causing a global destruction of the network. Observing Figure 4B we can see that there are still some small avalanches of pop type in the distribution. These may still be an effect of picking low reticulated zones as starting point of the avalanche, but as previously said, even running the avalanches only on the giant cluster they are still present. Notice that while moving toward the red region the log-normal bumps shrinks and moves to larger sizes becoming then similar to the distribution in Figure 3E.
The boundaries between the regimes are detected with the same algorithms as described in section 3.2. Notice that here we can let the probability
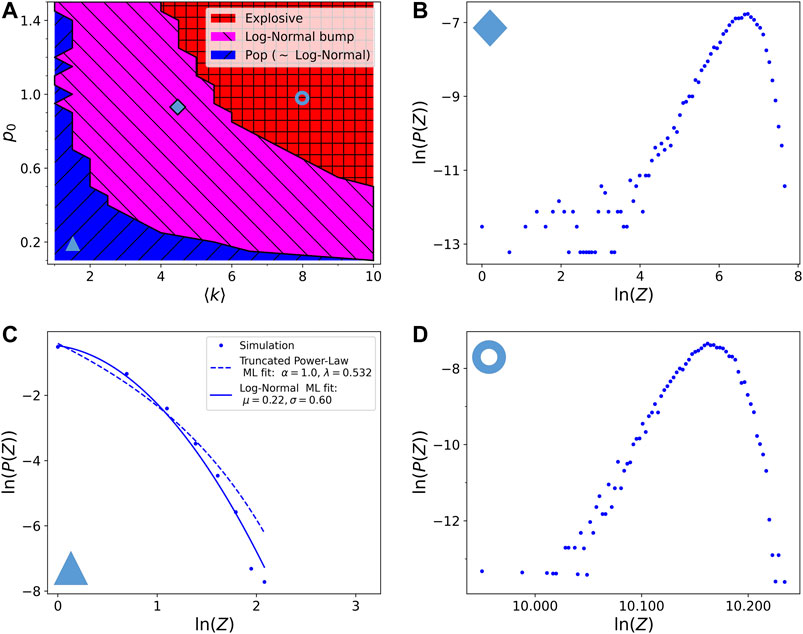
FIGURE 5. (A) Phase diagram of the resulting avalanche size distributions with respect to the model parameters
We note that these new distributions are not exactly log-normal, but only approximately. It is for example possible that they could be as well approximated by other skewed distributions, as the Gamma distribution, but for sure not by power-laws. It is interesting that these skewed distributions of the log-normal bump region are originated by both the introduction of time correlation (in the form of visco-elastic relaxation) and the non-linear dynamics of the avalanche propagation. Similar arguments (but instead of time correlations it was for phase correlations) were used in [27, 28] to explain the appearance of skewed distributions for the temporal variability of the heart rate, suggesting that an avalanche process may also be latent in that case.
3.4 Avalanche Statistics With Local Restoring of Cross-Linkers
In order to test the effects of local cross-linkers restoring on the final avalanche size distribution, we consider the most extreme case, where all broken links are restored after only one time step. Therefore the broken links disappear from the network only for the first time step after their rupture. This could be interpreted as an extremely fast network restoring. In this scenario, the probability of breaking must relax with time, otherwise the avalanche would never stop as soon as
The phase diagram and the resulting avalanche size distributions, when propagating avalanches with local restoring of cross-linkers, are almost the same as in section 3.3 (compare Figures 4, 6). We have chosen exactly the same points in the phase diagram as in Figure 4 for ease of comparison. The pop region is very similar to the one in Figure 4. The two other distributions have the same shape as before, but they are shifted to larger values, because the number of links available for the avalanches is more abundant than in Figure 4, this is a direct consequence of the link repair mechanism introduced for these simulations. We can thus conclude that our results about the log-normal bump regime are robust and do not seem to depend on the details of the particular avalanche algorithm, provided a visco-elastic relaxation is included in the model. However these details can be important to tune the average and the width of the resulting distributions.
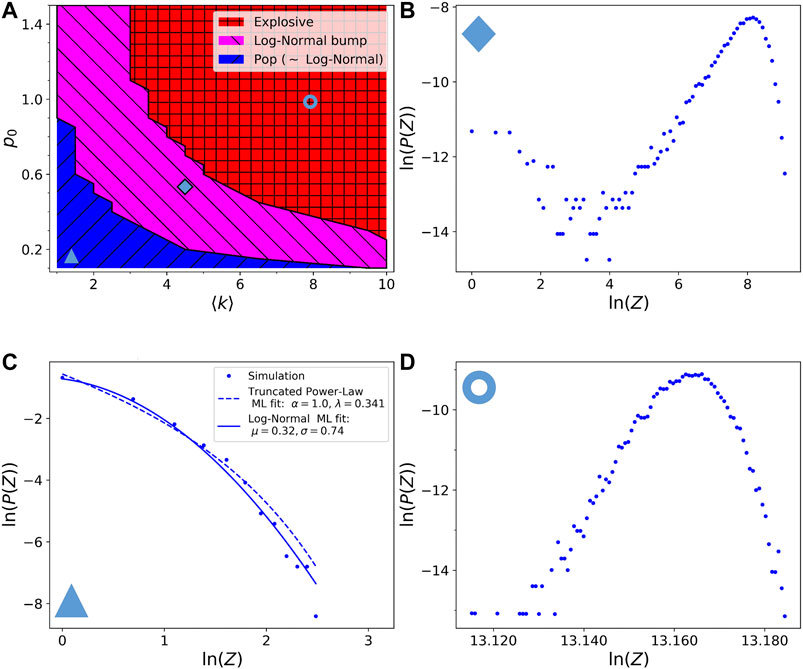
FIGURE 6. (A) Phase diagram of the resulting avalanche size distributions with respect to the model parameters
4 Discussion and Future Directions
Our phenomenological model shows that it is possible to model approximately log-normal avalanches, as experimentally observed. We showed this on a network structure which does not have a natural metric, but it is primarily a structure of interactions. Therefore interactions are not necessarily due to physical contacts, but can for example be given by vibrational modes, or other forms of interaction. However, this characteristic should not be thought of as a limitation, but rather as a feature that makes the model more general. Indeed, the network structure can always be embedded in some metric space if desired, e.g., on a 3-D sphere, and the same results would remain valid.
Interestingly, in order to have approximately log-normal avalanches, an elastic-instantaneous breaking mechanism is not sufficient. With this first rule we only get small pop avalanches, explosive avalanches leading to a global destruction of the network, or a mixture of both regimes. Along the critical line, where large avalanches proportional to the network size start being present, the distribution looks like an exponentially truncated power-law, typical of critical systems in physics. A key ingredient for having log-normal type avalanches is the introduction of a breaking rule taking into account the visco-elastic memory of cells (or other glassy materials), thus introducing time correlations. This behavior is shown to be robust even with different avalanche propagation rules, as for example by introducing the local restoration of cross-linkers. We should also mention that even with a completely different breaking rule the qualitative avalanche behavior is the same. We did preliminary studies on avalanches with a propagation rule consisting in breaking at each time step only the weakest link (by setting randomly attributed <<strength>> to the links), supposing that the avalanche propagates along the weaknesses of the material, and we could again recognize the same three regimes. We were then able to obtain avalanche size distributions closer to a log-normal by imposing faster relaxation times as in Figure 5. In this way the log-normal bump region becomes larger, thus showing slightly new distributions with a less important proportion of small pop avalanches, while the other resulting distributions stay the same.
Our model does not give quantitative information, because we did not make the link with physical units. Accounting for this, however, may be possible by introducing an appropriate scaling factor to make the size of the avalanche a physical measurable quantity (as the released energy). At the same time the correspondence of the lasting time of the avalanche with the experimental one can be done. This would attribute a unit to τ, hence leading to an estimation of the physical relaxation time needed to have log-normal avalanches. Altogether, these results suggest that, for cells, the local fracture mechanism resembles that of the global mechanical response of the cytoskeleton network. The global shear-relaxation modulus can thus be interpreted as a sequence of local avalanches of ruptures.
We conclude by saying that, in contrast to simpler 1-D models without a network structure (see [2, 20]), here the resulting distributions are not exactly log-normal. It is for example possible that they can as well be approximated by skewed distributions other than the log-normal, as the Gamma distribution, yet our model is an alternative to the power-law modeling. Furthermore our avalanches follow a skewed distribution which does not depend on the system size. Notably, these skewed distributions in the log-normal bump region are originated by both the introduction of time correlations (in the form of visco-elastic relaxation) and non-linear dynamics in the avalanche propagation. These are the same ingredients (but instead of time correlations it was for phase correlations) identified to cause the appearance of skewed distributions for the variations in the heart-rate signal in [27, 28], behind which an avalanche process may also be latent. This paves the way to possible applications to physiological data, where non-linear units are organized in a networked communicating structure, such as brain seizures, heartbeats or chemical signaling inside cells.
Data Availability Statement
The original contributions presented in the study are included in the article/Supplementary Material, further inquiries can be directed to the corresponding author.
Author Contributions
Conception and design: AA, FA, SP, and FP-R. Development and methodology: SP, AA, FA, and FP-R. Analysis and interpretation of data: SP, AA, FA, and FP-R. Writing, review, and/or revision of the manuscript: SP, FA, and FP-R. Administrative, technical or material support (i.e., requiring and organizing data, constructing databases): FA.
Funding
We acknowledge financial support from the Agence Nationale de la Recherche (ANR grant number ANR-18-CE45-0012-01) and from the French Research Minister (MESRI) for SP. PhD funding.
Conflict of Interest
The authors declare that the research was conducted in the absence of any commercial or financial relationships that could be construed as a potential conflict of interest.
Acknowledgments
We are very grateful for the participants of the second ISINP meeting at Lake Como for stimulating exchanges about our talk. We are thanful to P. Argoul, A. Guillet, E. Hartè, L. Delmarre for fruitful discussions. SP wishes to thank T. Matteuzzi for his inspiring considerations. We are indebted to Erika Polizzi for her graphical help.
References
1. Beggs, JM, and Plenz, D. Neuronal avalanches in neocortical circuits. J Neurosci (2003). 23:11167–77. doi:10.1523/JNEUROSCI.23-35-11167.2003
2. Polizzi, S, Laperrousaz, B, Perez-Reche, F, Nicolini, F, Satta, V, Arneodo, A, et al. A minimal rupture cascade model for living cell plasticity. New J Phys (2018). 20:053057. doi:10.1088/1367-2630/aac3c7
3. Peŕez-Reche, FJ, Truskinovsky, L, and Zanzotto, G. Driving-induced crossover: from classical criticality to self-organized criticality. Phys Rev Lett (2008). 101:230601.
4. Salje, EK, Saxena, A, and Planes, A. eds. Avalanches in functional materials and geophysics. Cham, Switzerland: Springer Int. Publ. (2017).
5. Bak, P. How nature works: the science of self-organized criticality. New York, NY: Springer Science and Business Media (2013). p. 212.
6. Song, Y, Chen, X, Dabade, V, Shield, TW, and James, RD. Enhanced reversibility and unusual microstructure of a phase-transforming material. Nature (2013). 502:85–8. doi:10.1038/nature12532
7. Chuang, CP, Yuan, T, Dmowski, W, Wang, GY, Freels, M, Liaw, PK, et al. Fatigue-induced damage in zr-based bulk metallic glasses. Sci Rep (2013). 3:2578. doi:10.1038/srep02578
8. Pérez‐Reche, FJ, Triguero, C, Zanzotto, G, and Truskinovsky, L. Origin of scale-free intermittency in structural first‐order phase transitions. Phys Rev B. (2016). 94: 144102.
9. Perez‐Reche, FJ. Modeling avalanches in martensites. In: Avalanches in functional materials and geophysics. chap. 6 Dordrecht, Netherlands: Springer International Publishing (2017). p. 99–136.
10. Lo, CC, Amaral, LN, Havlin, S, Ivanov, PC, Penzel, T, Peter, JH, et al. Dynamics of sleep-wake transitions during sleep. EPL (2002). 57:625. doi:10.1209/epl/i2002-00508-7
11. Klaus, A, Yu, S, and Plenz, D. Statistical analyses support power law distributions found in neuronal avalanches. PloS One (2011). 6:e19779. doi:10.1371/journal.pone.0019779
12. Dvir, H, Elbaz, I, Havlin, S, Appelbaum, L, Ivanov, PC, and Bartsch, RP. Neuronal noise as an origin of sleep arousals and its role in sudden infant death syndrome. Sci Adv (2018). 4:eaar6277. doi:10.1126/sciadv.aar6277
13. Wang, JW, Lombardi, F, Zhang, X, Anaclet, C, and Ivanov, PC. Non‐equilibrium critical dynamics of bursts in θ and δ rhythms as fundamental characteristic of sleep and wake micro-architecture. PLoS Comput. Biol. (2019). 15 (11): e1007268. doi:10.1371/journal.pcbi.1007268
14. Fabrizio, L, Manuel, G‐E, Pedro, B‐G, Ramalingam, V, Clifford, BS, Thomas, ES, et al. Critical dynamics and coupling in bursts of cortical rhythms indicate non-homeostatic mechanism for sleep‐stage transitions and dual role of VLPO neurons in both sleep and wake. J, Neurosci. (2020). 40 (1):171–190. doi:10.1523/JNEUROSCI.1278-19.2019
15. Broido, AD, and Clauset, A. Scale-free networks are rare. Nat Commun (2019). 10:1017. doi:10.1038/s41467-019-08746-5
16. Ribeiro, TL, Copelli, M, Caixeta, F, Belchior, H, Chialvo, DR, Nicolelis, MAL, et al. Spike avalanches exhibit universal dynamics across the sleep‐wake cycle. PLoS One. (2010). 5 (11):e14129. doi:10.1371/journal.pone.0014129
17. Buzsáki, G, and Mizuseki, K. The log-dynamic brain: how skewed distributions affect network operations. Nat Rev Neurosci (2014). 15:264–78. doi:10.1038/nrn3687
18. Albert, R, Jeong, H, and Barabási, AL. Diameter of the world-wide web. Nature (1999). 401:130–1. doi:10.1038/43601
19. Kesten, H. Random difference equations and Renewal theory for products of random matrices. Acta Math (1973). 131:207–48. doi:10.1007/BF02392040
20. Polizzi, S. Emergence of log-normal distributions in avalanche processes, validation of 1-D stochastic and random network models, with an application to the characterization of cancer cells plasticity. [Ph.D. thesis]. Bordeaux (France): Univ. Bordeaux (2020).
21. Barabási, AL, Albert, R, and Jeong, H. Mean-field theory for scale-free random networks. Phys Stat Mech Appl (1999). 272:173–87. doi:10.1016/S0378-4371(99)00291-5
22. Barabási, AL, and Pósfai, M. Network science. Cambridge, United Kingdom.: Cambridge University Press (2016). p. 475.
23. Loewenstein, Y, Kuras, A, and Rumpel, S. Multiplicative dynamics underlie the emergence of the log-normal distribution of spine sizes in the neocortex in vivo. J Neurosci (2011). 31:9481–8. doi:10.1523/JNEUROSCI.6130-10.2011
24. Legrand, J, Grais, RF, Boelle, PY, Valleron, AJ, and Flahault, A. Understanding the dynamics of ebola epidemics. Epidemiol Infect (2007). 135:610–21. doi:10.1017/S0950268806007217
25. Jin, X, Zhang, Y, Wang, F, Li, L, Yao, D, Su, Y, et al. Departure headways at signalized intersections: a log-normal distribution model approach. Transport Res C Emerg Technol (2009). 17:318–27. doi:10.1016/j.trc.2009.01.003
26. Gerstein, GL, and Mandelbrot, B. Random walk models for the spike activity of a single neuron. Biophys J (1964). 4:41–68. doi:10.1016/s0006-3495(64)86768-0
27. Ivanov, PC, Rosenblum, MG, Peng, CK, Mietus, J, Havlin, S, Stanley, HE, et al. Scaling behaviour of heartbeat intervals obtained by wavelet-based time-series analysis. Nature (1996). 383:323–7. doi:10.1038/383323a0
28. Ivanov, PC, Rosenblum, MG, Peng, CK, Mietus, JE, Havlin, S, Stanley, HE, et al. Scaling and universality in heart rate variability distributions. Physica A (1998). 249:587–93. doi:10.1016/s0378-4371(97)00522-0
29. Laperrousaz, B, Drillon, G, Berguiga, L, Nicolini, F, Audit, B, Satta, VM, et al. From elasticity to inelasticity in cancer cell mechanics: a loss of scale-invariance. AIP Conf Proc (2016). 1760:020040. doi:10.1063/1.4960259
30. Newman, ME, Strogatz, SH, and Watts, DJ. Random graphs with arbitrary degree distributions and their applications. Phys Rev E–Stat Nonlinear Soft Matter Phys (2001). 64:026118–7. doi:10.1103/PhysRevE.64.026118
31. Newman, ME. Spread of epidemic disease on networks. Phys Rev E–Stat Nonlinear Soft Matter Phys (2002). 66:016128. doi:10.1103/PhysRevE.66.016128
32. Ritort, F, and Sollich, P. Glassy dynamics of kinetically constrained models. Adv Phys (2003). 52:219–342. doi:10.1080/0001873031000093582
33. Hoffman, BD, and Crocker, JC. Cell mechanics: dissecting the physical responses of cells to force. Annu Rev Biomed Eng (2009). 11:259–88. doi:10.1146/annurev.bioeng.10.061807.160511
34. Chauvière, A, Preziosi, L, and Verdier, C. Cell mechanics: from single scale-based models to multiscale modeling. Boca Raton, FL: CRC Press (2010). p. 482.
35. Brunner, C, Niendorf, A, and Käs, JA. Passive and active single-cell biomechanics: a new perspective in cancer diagnosis. Soft Matter (2009). 5:2171–8. doi:10.1039/B807545J
36. Kai, F, Laklai, H, and Weaver, VM. Force matters: biomechanical regulation of cell invasion and migration in disease. Trends Cell Biol (2016). 26:486–97. doi:10.1016/j.tcb.2016.03.007
37. Gardel, ML, Kasza, KE, Brangwynne, CP, Liu, J, and Weitz, DA. Chapter 19: mechanical response of cytoskeletal networks. Methods Cell Biol (2008). 89:487–519. doi:10.1016/S0091-679X(08)00619-5
38. Lieleg, O, Claessens, MM, and Bausch, AR. Structure and dynamics of cross-linked actin networks. Soft Matter (2010). 6:218–25. doi:10.1039/b912163n
39. Kollmannsberger, P, and Fabry, B. Linear and nonlinear rheology of living cells. Annu Rev Mater Res (2011). 41:75–97. doi:10.1146/annurev-matsci-062910-100351
40. Fletcher, DA, and Mullins, RD. Cell mechanics and the cytoskeleton. Nature (2010). 463:485–92. doi:10.1038/nature08908
41. Huber, F, Schnauß, J, Rönicke, S, Rauch, P, Müller, K, Fütterer, C, et al. Emergent complexity of the cytoskeleton: from single filaments to tissue. Adv Phys (2013). 62:1–112. doi:10.1080/00018732.2013.771509
42. Käs, L, Boujemaa-Paterski, R, Sykes, C, and Plastino, J. Actin dynamics, architecture, and mechanics in cell motility. Physiol Rev (2014). 94:235–63. doi:10.1152/physrev.00018.2013
43. Li, R, and Gundersen, GG. Beyond polymer polarity: how the cytoskeleton builds a polarized cell. Nat Rev Mol Cell Biol (2008). 9:860–73. doi:10.1038/nrm2522
44. Tseng, Y, Kole, TP, Lee, JS, Fedorov, E, Almo, SC, Schafer, BW, et al. How actin crosslinking and bundling proteins cooperate to generate an enhanced cell mechanical response. Biochem Biophys Res Commun (2005). 334:183–92. doi:10.1016/j.bbrc.2005.05.205
45. Wagner, B, Tharmann, R, Haase, I, Fischer, M, and Bausch, AR. Cytoskeletal polymer networks: the molecular structure of cross-linkers determines macroscopic properties. Proc Natl Acad Sci USA (2006). 103:13974–8. doi:10.1073/pnas.0510190103
46. Ehrlicher, AJ, Krishnan, R, Guo, M, Bidan, CM, Weitz, DA, and Pollak, MR. Alpha-actinin binding kinetics modulate cellular dynamics and force generation. Proc Natl Acad Sci USA (2015). 112:6619–24. doi:10.1073/pnas.1505652112
47. Fabry, B, Maksym, GN, Butler, JP, Glogauer, M, Navajas, D, and Fredberg, JJ. Scaling the microrheology of living cells. Phys Rev Lett (2001). 87:148102. doi:10.1103/PhysRevLett.87.148102
48. Sollich, P. Rheological constitutive equation for a model of soft glassy materials. Phys Rev (1998). 58:738. doi:10.1103/PhysRevE.58.738
49. Hildebrandt, J. Comparison of mathematical models for cat lung and viscoelastic balloon derived by Laplace transform methods from pressure-volume data. Bull Math Biophys (1969). 31:651–67. doi:10.1007/BF02477779
50. Bonfanti, A, Kaplan, JL, Charras, G, and Kabla, A. Fractional viscoelastic models for power-law materials. Soft Matter (2020). 16:6002–20. doi:10.1039/d0sm00354a
51. Streppa, L, Ratti, F, Goillot, E, Devin, A, Schaeffer, L, Arneodo, A, et al. Prestressed cells are prone to cytoskeleton failures under localized shear strain: an experimental demonstration on muscle precursor cells. Sci Rep (2018). 8:8602–16. doi:10.1038/s41598-018-26797-4
52. Trepat, X, Grabulosa, M, Buscemi, L, Rico, F, Farré, R, and Navajas, D. Thrombin and histamine induce stiffening of alveolar epithelial cells. J Appl Physiol (2005). 98:1567–74. doi:10.1152/japplphysiol.00925.2004
53. Gerasimova-Chechkina, E, Streppa, L, Schaeffer, L, Devin, A, Argoul, P, Arneodo, A, et al. Fractional rheology of muscle precursor cells. J Rheol (2018). 62:1347–62. doi:10.1122/1.5035127
54. Khalilgharibi, N, Fouchard, J, Asadipour, N, Barrientos, R, Duda, M, Bonfanti, A, et al. Stress relaxation in epithelial monolayers is controlled by the actomyosin cortex. Nat Phys (2019). 15:839–47. doi:10.1038/s41567-019-0516-6
55. Carmichael, B, Babahosseini, H, Mahmoodi, SN, and Agah, M. The fractional viscoelastic response of human breast tissue cells. Phys Biol (2015). 12:046001. doi:10.1088/1478-3975/12/4/046001
56. Gorenflo, R, Loutchko, J, and Luchko, Y. Computation of the mittag-leffler function eα, β (z) and its derivative. Fract Calc Appl Anal (2002). 5:491–512.
57. Baró, J, and Davidsen, J. Universal avalanche statistics and triggering close to failure in a mean-field model of rheological fracture. Phys Rev (2018). 97:033002. doi:10.1103/PhysRevE.97.033002
58. Juelicher, F, Kruse, K, Prost, J, and Joanny, JF. Active behavior of the cytoskeleton. Phys Rep (2007). 449:3–28. doi:10.1016/j.physrep.2007.02.018
59. Dos Remedios, CG, Chhabra, D, Kekic, M, Dedova, IV, Tsubakihara, M, Berry, DA, et al. Actin binding proteins: regulation of cytoskeletal microfilaments. Physiol Rev (2003). 83:433–73. doi:10.1152/physrev.00026.2002
60. Esue, O, Tseng, Y, and Wirtz, D. Alpha-actinin and filamin cooperatively enhance the stiffness of actin filament networks. PloS One (2009). 4:e4411. doi:10.1371/journal.pone.0004411
61. Wolff, L, Fernandez, P, and Kroy, K. Inelastic mechanics of sticky biopolymer networks. New J Phys (2010). 12:053024. doi:10.1088/1367-2630/12/5/053024
62. Gralka, M, and Kroy, K. Inelastic mechanics: a unifying principle in biomechanics. Biochim Biophys Acta (2015). 1853:3025–37. doi:10.1016/j.bbamcr.2015.06.017
63. Badre, D, and Wagner, AD. Computational and neurobiological mechanisms underlying cognitive flexibility. Proc Natl Acad Sci USA (2006). 103:7186–91. doi:10.1073/pnas.0509550103
64. Bonakdar, N, Gerum, R, Kuhn, M, Spörrer, M, Lippert, A, Schneider, W, et al. Mechanical plasticity of cells. Nat Mater (2016). 15:1090–4. doi:10.1038/nmat4689
65. Ising, E. Beitrag zur theorie des ferromagnetismus. Z Phys (1925). 31:253–8. doi:10.1007/BF02980577
66. Laperrousaz, B, Berguiga, L, Nicolini, FE, Martinez-Torres, C, Arneodo, A, Satta, VM, et al. Revealing stiffening and brittling of chronic myelogenous leukemia hematopoietic primary cells through their temporal response to shear stress. Phys Biol (2016). 13:03LT01. doi:10.1088/1478-3975/13/3/03LT01
67. Streppa, L. Characterizing mechanical properties of living C2C12 myoblasts with single cell indentation experiments: application to Duchenne muscular dystrophy. [Ph.D. thesis]. Lyon (France): University of Lyon (2017).
68. Grossmann, A, and Morlet, J. Decomposition of hardy functions into square integrable wavelets of constant shape. SIAM J Math Anal (1984). 15:723–36. doi:10.1137/0515056
69. Digiuni, S, Berne-Dedieu, A, Martinez-Torres, C, Szecsi, J, Bendahmane, M, Arneodo, A, et al. Single cell wall nonlinear mechanics revealed by a multiscale analysis of AFM force-indentation curves. Biophys J (2015). 108:2235–48. doi:10.1016/j.bpj.2015.02.024
70. Martinez‐Torres, C, Arneodo, A, Streppa, L, Argoul, P, and Argoul, F. Passive microrheology of soft materials with atomic force microscopy: a wavelet-based spectral analysis. Appl Phys Lett (2016). 108:034102. doi:10.1063/1.4940220
71. Sneddon, IN. The relation between load and penetration in the axisymmetric boussinesq problem for a punch of arbitrary profile. Int J Eng Sci (1965). 3:47–57. doi:10.1016/0020-7225(65)90019-4
72. Eghiaian, F, Rigato, A, and Scheuring, S. Structural, mechanical, and dynamical variability of the actin cortex in living cells. Biophys J (2015). 108:1330–40. doi:10.1016/j.bpj.2015.01.016
73. Pastor-Satorras, R, and Vespignani, A. Epidemic spreading in scale-free networks. Phys Rev Lett (2001). 86:3200. doi:10.1103/PhysRevLett.86.3200
76. Alstott, J, Bullmore, E, and Plenz, D. Powerlaw: a python package for analysis of heavy-tailed distributions. PloS One (2014). 9:e85777. doi:10.1371/journal.pone.0085777
77. Severini, T. Likelihood methods in statistics. New York, NY: Oxford Univ. Press (2001). p. 105–37.
Keywords: random network, avalanches, log-normal distributions, power-law, cell plasticity, cytoskeleton ruptures
Citation: Polizzi S, Arneodo A, Pérez-Reche F-J and Argoul F (2021) Emergence of Log-Normal Type Distributions in Avalanche Processes in Living Systems: A Network Model. Front. Appl. Math. Stat. 6:613962. doi: 10.3389/fams.2020.613962
Received: 04 October 2020; Accepted: 23 December 2020;
Published: 28 January 2021.
Edited by:
Plamen Ch. Ivanov, Boston University, United StatesReviewed by:
Changgui Gu, University of Shanghai for Science and Technology, ChinaChengyu Huo, Changshu Institute of Technology, China
Copyright © 2021 Polizzi, Arneodo, Pérez-Reche and Argoul. This is an open-access article distributed under the terms of the Creative Commons Attribution License (CC BY). The use, distribution or reproduction in other forums is permitted, provided the original author(s) and the copyright owner(s) are credited and that the original publication in this journal is cited, in accordance with accepted academic practice. No use, distribution or reproduction is permitted which does not comply with these terms.
*Correspondence: Françoise Argoul, ZnJhbmNvaXNlLmFyZ291bEB1LWJvcmRlYXV4LmZy