
ORIGINAL RESEARCH article

Front. Appl. Math. Stat., 27 November 2020
Sec. Dynamical Systems
This article is part of the Research Topic Latest Developments on Synchronization in Dynamical Systems and Neural Networks View all 5 articles

2θ-Burster for Rhythm-Generating Circuits

Aaron KelleyAaron Kelley1Andrey Shilnikov,
Andrey Shilnikov1,2*
  • 1Neuroscience Institute, Georgia State University, Atlanta, GA, United States
  • 2Department of Mathematics and Statistics, Georgia State University, Atlanta, GA, United States

We propose a minimalistic model called the 2θ-burster due to two slow phase characteristics of endogenous bursters, which when coupled in 3-cell neural circuits generate a multiplicity of stable rhythmic outcomes. This model offers the benefits of simplicity for designing larger neural networks along with an acute reduction in the computation cost. We developed a dynamical system framework for explaining the existence and robustness of phase-locked states in activity patterns produced by small rhythmic neural circuits. Several 3-cell configurations, from multifunctional to monostable, are considered to demonstrate the versatility of the proposed approach, allowing the network dynamics to be reduced to the examination of 2D Poincaré return maps for the phase lags between three constituent 2θ-bursters.

1. Introduction

Neural networks called central pattern generators (CPGs) [18] produce and control a great variety of rhythmic motor behaviors, including heartbeat, respiration, chewing, and locomotion. Many physiologically diverse CPGs involve 3-cell motifs, such as the spiny lobster pyloric network [6], the Tritonia swim circuit [4], and the Lymnaea respiratory CPGs [3]. Pairing experimental studies and modeling studies has been proven to be the key for disclosing basic operational and dynamical principles of CPGs [914]. Although various circuits and models of specific CPGs have been developed, the mystery of how CPGs gain the level of robustness and adaptation observed in nature remains unsolved. It is also not evident what mechanisms a single motor system can use to generate multiple rhythms, that is, whether CPGs need a specific circuitry for every function or whether it can be multifunctional to determine several behaviors [1517]. Switching between multistable rhythms can be attributed to input-dependent switching between attractors of the CPG, where each attractor is associated with a specific rhythm. The goal of this article is to characterize how observed multistable states can emerge from the coupling using simple neural models on small networks.

This article, based on our original work, reemphasizes some basic principles well established in the characterization of 3-cell networks made of detailed Hodgkin-Huxley–type models of endogenous bursters [1820] and the Fitzhugh-Nagumo–like neurons [21]. We use a bottom-up approach to show the universality of rhythm-generation principles in such 3-cell circuits regardless of the cell model selected, which can be the HH-type model of the leech heart interneuron [22, 23], the generalized Fitzhugh–Nagumo (gFN) model of neurons [24], or the minimalistic 2θ-burster suggested in this article, provided that all three meet some simple and generic criteria. We are convinced that one should first investigate the rules and mechanisms underlying the emergence of cooperative rhythms in basic neural motifs, as well as the role of coupling in generating a multiplicity of coexisting rhythmic outcomes in larger networks s[25].

The predecessor of a 2θ-burster proposed and examined below is the so-called spiking θ-neuron [26]. It is described by a phase differential equation with a specific term cosθ. The θ-neuron is meant to demonstrate a slow “quiescent” phase followed by a fast “spiking” transition. Mathematically, its equation is normal for a saddle-node bifurcation on a unit circle through which two equilibrium states, stable and repelling, merge and disappear. After the equilibriums are gone, the phase point keeps revolving on a unit circle (see Section 3 below). That is why this bifurcation is referred to as a homoclinic saddle-node bifurcation on an invariant circle or SNIC in short. The notion of the θ-neuron capitalizes on the feature of the saddle-node bifurcation, causing the well-known bottleneck effect, which results in slow quiescent and fast spiking time-scale dynamics in such systems.

The concept of the new model, called the 2θ-burster due to the driving term cos2θ in its ODE description, is inspired by the dynamics of endogenous bursters (like ones shown in Figure 1) with two characteristic slow phases: depolarized tonic spiking and hyperpolarized quiescent. These phases are also referred to as “on” or active and “off” or inactive depending on whether the membrane voltage is above or below some synaptic threshold. During the active phase, the presynaptic cell releases neurotransmitters to inhibit or excite other cells on the network, whereas during the inactive phase, the cell takes a pause from “communicating.” This is a feature of chemical synapses that contrasts electric one or gap junctions, allowing cells interact all the time regardless of the voltage values. In contrast to interact the θ-neuron, there are two slow transient states, active and inactive, in the 2θ-burster due to two saddle-node bifurcations that alternate with fast progressions in between. We recall that a similar saddle-node bifurcation controlling the duration of the tonic-spiking phase, and hence the number of spikes is associated with the codimension-one bifurcation known as the blue-sky catastrophe [23, 2932].

FIGURE 1
www.frontiersin.org

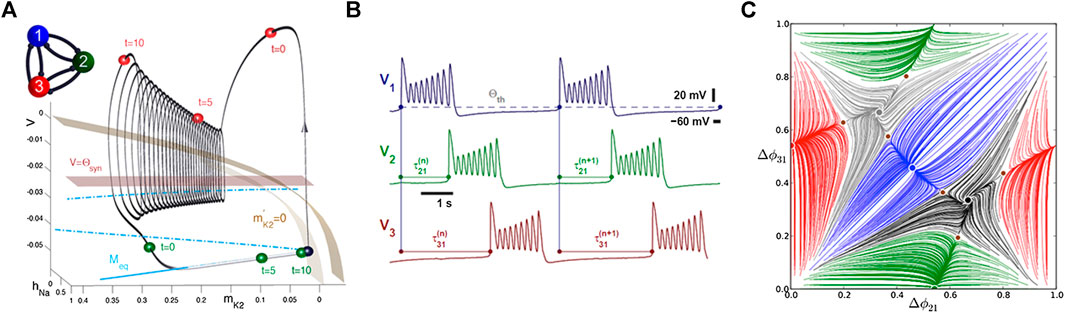
FIGURE 1. (A) Snapshots of the transient states (shown as the blue, green, and red spheres) of three inhibitory-coupled Hodgkin-Huxley–type cells at t=0 and at t=10, superimposed with a bursting orbit (grey) in the 3D phase space (voltage V and two gating variables hNa and mK2 for the fast sodium and slow potassium current ) of the reduced leech heart interneuron model [22, 23]. A plane V=Θsyn representing a voltage threshold of the chemical synapses divides the active “on” phase in which the red cell 3 inhibits the quiescent green/blue cells 1/2 in the inactive “off” phase, transitioning along the 1D Meq-hyperpolarized branch in the phase space. (B) Burst initiations in successive voltage traces define the relative delays τi1’s and the phase lags (given by Eq. 1) between its constituent bursters (see details in refs. 27 and 28.) that after being normalized over the network period are converted to the phase lags Δϕ21 and Δϕ21 populating the map in panel (C). (C) 2D Poincaré return map of the phase lags between the burst initiations in the symmetric 3-cell motif of the inhibitory-coupled HH-type cells. Observe that this map with five stable fixed points and the map for the 3-cell motif composed of identical bursters in Figure 3A below have the same structure.

2. Return Maps for Phase Lags

We developed a computational toolkit for oscillatory networks that reduces the problem of the occurrence of bursting and spiking rhythms generated by a CPG network to the bifurcation analysis of attractors in the corresponding Poincaré return maps for the phase lags between oscillatory neurons. The structure of the phase space of the map is a unique signature of the CPG as it discloses all characteristics of the functional range of the network. The recurrence of rhythms generated by the CPG (represented by a system of coupled Hodgkin-Huxley–type neurons [23]) allows us employ Poincaré return maps defined for phaselags between spike and burst initiations in the constituent neurons [27, 28], as illustrated in Figures 1, 2, and 6. With such return maps, we can predict and identify the set of robust outcomes in a CPG with mixed, inhibitory, excitatory, and electrical synapses, which are differentiated by phase-locked or periodically varying lags corresponding, respectively, to stable fixed points and invariant circles on the return map.

FIGURE 2
www.frontiersin.org

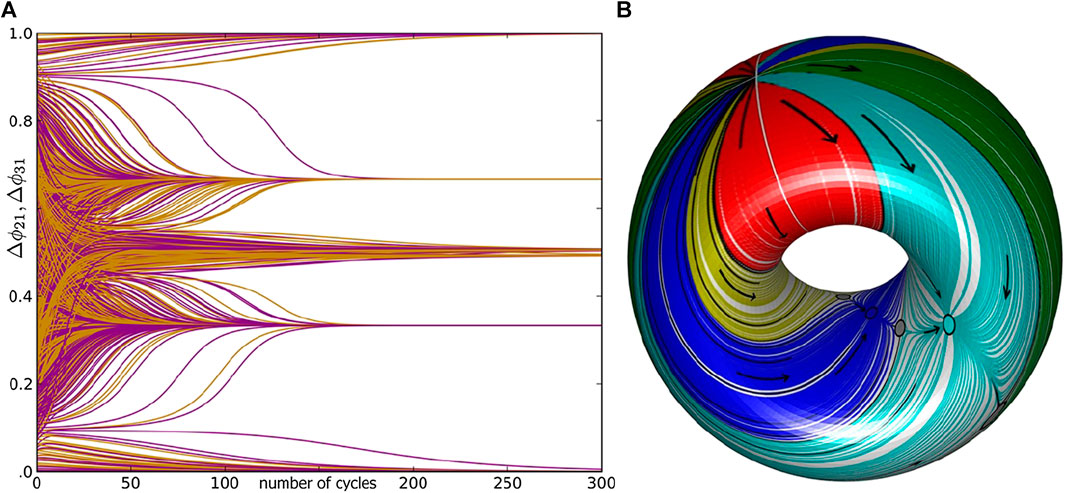
FIGURE 2. (A) The demonstration of the slow exponential convergence of initial states of Δϕ21 (yellow curves) and Δϕ31 (purple curves) to four phase-locked states: {01,13,12,23} in the inhibitory 3-cell motif (4) with weak coupling βij=0.003. (B) Poincaré return map defined on a unit 2D torus, S2=S1S1 of the two phase lags (discrete values), revealing color-coded attraction basins of several fixed points (solid dots of the same colors) corresponding to the phase-locked rhythms generated by the 3-cell motif. A flattened torus is shown in Figure 3A.

Let us introduce a 3-cell network (Figure 1A) made of weakly coupled HH-like bursters; see the equations in the Appendix. Here, “weakly” indicates that coupling cannot disturb the shape of the stable bursting orbit in the 3D phase space of the individual HH model (Figure 1A). Weak interactions, inhibitory (mainly repulsing) and excitatory/gap junction (mainly attracting), can only affect the phases of the periodically varying states of the neurons, represented by the color-coded spheres (blue/green/red, respectively, for cells 1/2/3), on the bursting orbit in the 3D phase space of the given interneuron model. As such, weak coupling can only gently alter the phase differences or phase lags between the networked neurons (Figure 2A). We also note that coupling remains weak as long as individual cell models stay away from bifurcations, such as a saddle-node bifurcation typical for 1D 2θ-bursters. Making coupling stronger will make the convergence to the phase-locked states faster. However, in this study, we would like to demonstrate the reduction approach through which the 2D maps appear because they were defined analytically and not computationally. Otherwise, the trajectories will lose smoothness and look jagged and tangled.

Being inspired by neurophysiological recordings performed on various rhythmic CPGs, we employ only voltage traces generated by oscillatory networks to examine the time delays, τ21 and τ31, between the burst upstrokes on each cycle in the reference/blue cell 1 and in cells 2 (green) and 3 (red). Next, we will show that like the biologically plausible HH-type networks, 3-cell circuits of coupled 2θ-bursters can stably produce similar phase-locked rhythms. They include, for example, peristaltic patterns or traveling waves, in which the cells burst sequentially one after the other (see Figures 1 and 3C,E), and the so-called pacemaker rhythms, in which one cell effectively inhibits and bursts in antiphase with the other two bursting synchronously. The symmetric connectivity implies that such 3-cell networks can produce multiple rhythms due to cyclic permutations of the constituent cells (see Figure 3 below).

FIGURE 3
www.frontiersin.org

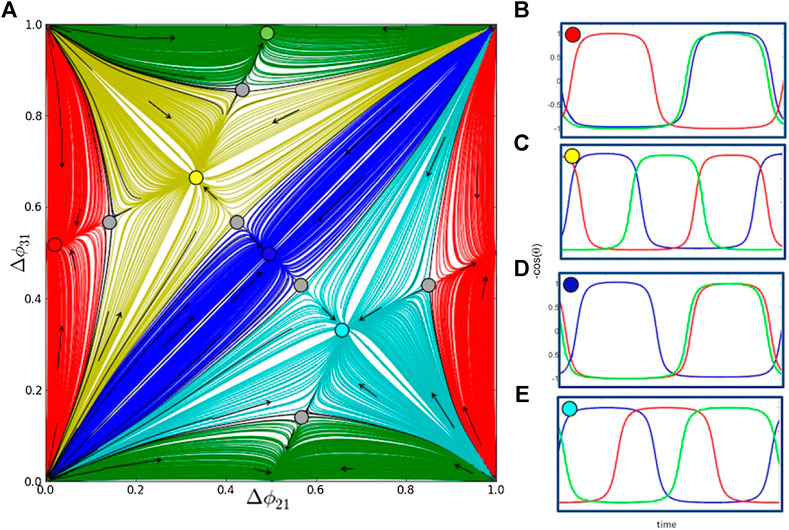
FIGURE 3. Multistable outputs of the 3-cell homogeneous network with six equal synaptic connections (all βij=0.003). (A) The Poincaré return map for the (Δϕ21,Δϕ31) phase lags with five stable fixed points representing robust three pacemaker (PM) patterns: red at (0,12), green at (12,0), and blue at (12,12) and two traveling wave (TW) rhythmic patterns: yellow clockwise at (13,23) and teal counterclockwise at (23,13) (shown in panel (B)). The color-coded attraction basins of these five FPs are determined by positions of stable sets (separatrices) of six saddles (gray dots). The origin is a repelling FP of the map with the even number—total eight of hyperbolic FPs. Panels (BE) depict the traces with phases locked to the specific values (indicated by color-coded dots at top-left corners), corresponding to the color-matching stable FPs in (A).

To analyze the existence and the stability of various recurrent rhythms produced by such networks, we employ our previously developed approach using Poincaré return maps for phase lags between constituent neurons. We introduce phase lags at specific events in time when the voltage in cells reaches some threshold value, signaling the burst initiation (see Figure 1B). The phase lag Δϕ1j(n) is then defined by a delay between nth burst initiations in the given cell and the reference cell 1, normalized over the bursting period:

Δϕ12(n)=t2(n)t1(n)t1(n+1)t1(n),Δϕ13(n)=t3(n)t1(n)t1(n+1)t1(n),mod1.(1)

Sequences of phase lags {Δϕ12(n),Δϕ13(n)} defined on module one represent forward trajectories Mn on a 2D phase torus (Figure 2B). The specific phase-lag values such as 0 (or 1) and 0.5 represent, respectively, in-phase and antiphase relationships of cells 2 and 3 with the reference cell 1. We examine the (Δϕ12,Δϕ13) phase-lag structure of the 2D Poincaré return maps (such as one shown in Figure 3A) of the 3-cell networks by initiating multiple trajectories with a dense distribution of initial phase lags (50×50 grid) and by following their progressions over large numbers of cycles. In the long run, these trajectories can eventually converge to some attractors, one or several. Such an attractor can be a fixed point (FP) with constant values Δϕ12* and Δϕ13* in Eq. 1, which correspond to a stable rhythmic pattern with phase lags locked (Figure 2A). All phase trajectories converging to the same fixed point are marked by the same color to reveal the attraction basins of the corresponding rhythms (Figures 2B and 3A). This reduces the analysis of rhythmic activity generated by a 3-cell network on the examination of the corresponding 2D Poincaré map for the phase lags. For example, the map shown in Figure 3A reveals the existence of pentastability with the symmetric circuit generating three pacemaker (PM) rhythms and two, clockwise and counterclockwise, traveling waves (Figure 3). These three PM rhythms correspond to the blue, green, and red fixed points near (0.5,0.5), (0.5,0), and (0,0.5), respectively, whereas two traveling-wave patterns are associated with stable FPs located at (1/3,2/3) and (2/3,1/3), respectively, in the 2D return map.

Other attractors in the return maps on a 2D torus can be a stable invariant curve (IC) corresponding to rhythmic patterns with periodically varying phase lags. Such a curve can enclose a focal fixed point on the torus or wrap around the 2D torus [27, 28] (see Figure 2B and Section 5.4 below). If the map has a single attractor, then the corresponding network is monostable; otherwise, it is a multifunctional or multistable network capable of producing several rhythmic outcomes robustly. Such as 2D return map, where Π:  MnMn+1, for the phase lags can be represented as follows:

Π:Δϕ21(n+1)=Δϕ21(n)+μ1f1(Δϕ21(n),Δϕ31(n)),Δϕ31(n+1)=Δϕ31(n)+μ2f2(Δϕ21(n),Δϕ31(n)),mod 1,(2)

with small μi being associated with weak coupling; fi being some undetermined coupling function such that their zeros: f1=f2=0 correspond to fixed points: Δϕj1*=Δϕj1(n+1)=Δϕj1(n) of the map. These functions, similar to phase-resetting curves, can be numerically evaluated from all simulated trajectories {Δϕ21(n),Δϕ31(n)} (see Figure 4C). By treating fi as partials F/ϕij, one may try to restore a “phase potential”—some surface F(ϕ21,ϕ31)=C (see Figure 4). The fi quantities can be evaluated as the distance between two consecutive points (iterates) Mn and Mn+1 on every trajectory of the map (see Figure 3, for example). The shape of such a surface determines the location of critical points associated with FPs—attractors, repellers, and saddles of the map. With this approach, one can try to predict bifurcations due to landscape transformations and thus to interpret possible dynamics of the network as a whole. Figures 4A,B are meant to give an idea of how the potential surface may look like in the case of the 3-cell circuit with only two stable traveling wave patterns and in the case of three coexisting pacemakers only, respectively. Figure 4C shows a numerical reconstruction of the pseudopotential with the use of the distances between all pairs of successive iterates of the map with five stable FPs as depicted in Figure 3A.

FIGURE 4
www.frontiersin.org

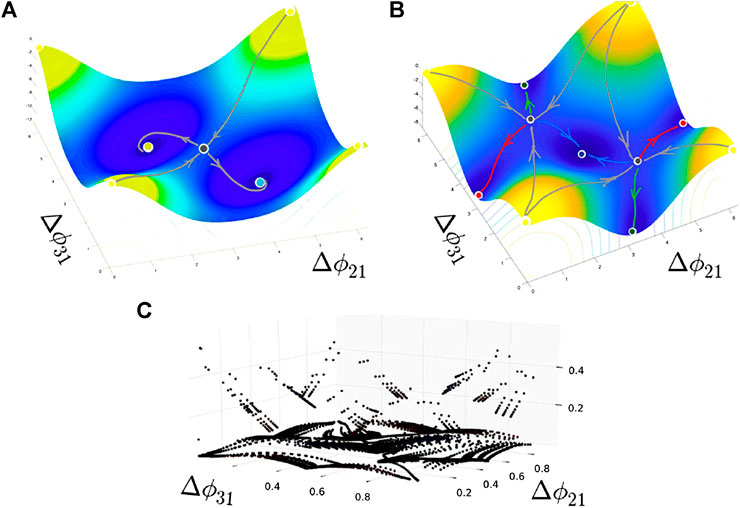
FIGURE 4. Critical points of the sketched “pseudopotentials” with periodic boundary conditions reveal the location of potential wells—attractors, as well as saddles (including with six separatrices in (B)) and repellers (a single local maximum at the origin) in the (ϕ21,ϕ31) phase space. These configurations correspond to the network with two traveling waves only (A) and with three pacemakers only (B), respectively. (C) A computational reconstruction of a pseudopotential/coupling function corresponding to the return map in Figure 3A.

3. Minimalistic 2θ-Burster

The key feature of the 2θ-neuron given by

θ=ωcos2θ+αcosθ,mod 2π,(3)

which is the occurrence of two saddle-node bifurcations giving rise to the two slow transient phases in its dynamics alternating with fast transitions in between. Likewise endogenous bursters with two such slow states (Figure 1), the duration of the active tonic spiking, and the quiescent phases can be controlled independently in the 2θ-burster: the active “on” state and the inactive “off” state are due to the same bottleneck effects caused by the saddle-node bifurcations. This regulates the duty cycle of bursting, which is the fraction of the active-state duration compared with the burst period. As seen from Figure 5, the θ-model was meant to replicate phenomenologically fast-spiking cells, whereas the “spikeless” 2θ-neuron mimics burster dynamics instead. Next, we show that the network dynamics of a 3-cell motif of inhibitory coupled 2θ-bursters demonstrate that the key properties observed in such motifs are composed of Hodgkin-Huxley–type bursters.

FIGURE 5
www.frontiersin.org

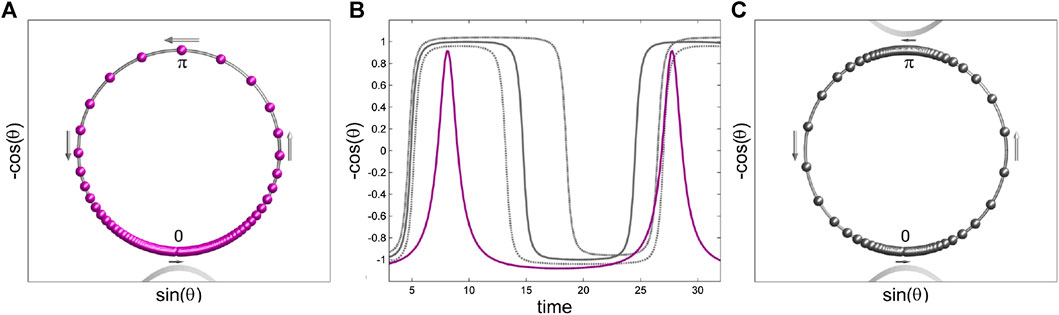
FIGURE 5. Comparison of the oscillatory dynamics generated by the spiking θ-neuron and the 2θ-burster. Panels (A) and (C) present snapshots of typical trajectories generated by both models on a unit circle S1 (parametrized using Cartesian coordinates: x(t)=sin(θ(t)) and y(t)=cos(θ(t)) with the origin 0 at 6 pm. (A) Clustering of purple spheres near the origin is due to a post-effect posteffect caused by a saddle-node bifurcation (SNIC) in the θ-model, whereas the 2θ-burster in (C) features two such bottleneck post-effect due to two heteroclinic saddle-node connections causing the stagnation of gray spheres near the top, “on” state and the inactive “off” state of the symmetric 2θ-burster and fast transitions in between. (B) Spiking trace (purple) of the θ-neuron, overlapped with 2-plateau traces of the 2θ-neuron with three values of the bursting duty cycle: 50%, 30%, and 70% (solid, short-, and long-dashed gray curves, respectively) controlled by small variations of the α-parameter in Eqs. 3 and 4.

First, let us observe from Eq. 3 that the dynamics of the individual 2θ-burster is determined mainly by the driving term ωcos2θ in symmetric α=0 and asymmetric cases due to small α-values. So, whenever the frequency 0<ω1, there exist two pairs of stable and unstable equilibriums: one pair is near the bottom θ0 and the other is at the top around θπ. The stable equilibria are associated with the hyperpolarized active and depolarized quiescent states of neurons, respectively. Increasing ω>1 makes the 2θ-neuron oscillatory through two simultaneous (if α=0) saddle-node bifurcations (SNIC) on a unit circle S1, which is its phase space. Moreover, as long as ω=1+Δω, where 0<Δω1, the 2θ-burster possesses two slow phases: the active “on” state near θ=π and the inactive “off” state near 0 on S1. These slow phases are alternated with fast counterclockwise transitions, which will be referred to as an upstroke and a downstroke, respectively. For greater values of ω, the active and inactive phases are defined more broadly they are: π/2<θ3π/2 and 3π/2<θπ/2, respectively. This is convenient because the inactive phase remains below the synaptic threshold, which is set at θth=π/2 so that cosθth=0 for the sake of simplicity, thus equally dividing the unit circle (see Figure 6A). The duty cycle of the 2θ-burster is controlled by the axillary term αcosθ in Eq. 3, provided that it remains oscillatory as long as ω|α|>1. Note that when α=0, the duty cycle of bursting is 50%, and the corresponding traces have two even plateaus (see Figure 5B). The active or inactive phases can be extended or shortened with small variations of the α-parameter so that α<0 increases the duty cycle and α>0 decreases the duty cycle of the individual 2θ-burster when it is shifted, respectively, closer to the top or to the bottom saddle-node “phantom,” because the bottleneck effects become more profound, see Figure 5B,C.

FIGURE 6
www.frontiersin.org

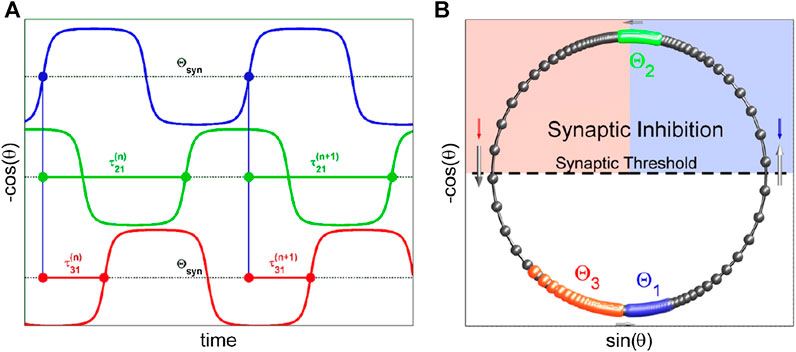
FIGURE 6. (A) Sampling the moments in phase traces, yi(t)=cos(θi(t)), plotted against time, when they reach a synaptic threshold θsyn=0, defines a sequence of the phase lags (τ21(n),τ31(n)) between upstrokes in the reference (blue) neuron 1 and the other two 2θ-neurons coupled in the 3-cell network. (B) Parametric representation of the 1D phase space of the coupled 2θ-bursters traversing counterclockwise (long gray arrows indicating rapid transition between “on and off” states) on a unit circle S1. Small downward blue and red arrows illustrate the inhibitory perturbations projected from the active green cell above the synaptic threshold that delays the forthcoming upstroke of the blue cell and speeds up the red cell toward the inactive phase. The gray arrows indicate the direction and its speed on a unit circle.

4. Three Equations for 3-Cell Network

A 3-cell circuit of the 2θ-bursters coupled with chemical synapses is given by the following system:

{θ1=ωcos2θ1+αcosθ1[β211+ekcosθ2+β311+ekcosθ3][121+eksinθ1],θ2=ωcos2θ2+αcosθ2[β121+ekcosθ1+β321+ekcosθ3][121+eksinθ2],θ3=ωcos2θ3+αcosθ3[β131+ekcosθ1+β231+ekcosθ2][121+eksinθ3], mod2π.(4)

The 2θ-burster is coupled in the network using the fast-inhibitory synapses driven by the fast-threshold modulation [33]. It is due to the sigmoidal term [11+ekcosθi] that, rapidly (here k=10) varying between 0 and 1, triggers an influx of inhibition flowing from the presynaptic neuron to the postsynaptic neuron, as soon as the former enters the active “on" phase above the synaptic threshold cosθth=0, that is, π/2<θi<3π/2. Note that the negative sign of this term makes the synapse inhibitory so that replacing it with “positive sign” makes the synapse excitatory because it would increase the rate of θ during the upstroke, in contrast to slowing down the upstroke in the inhibitory case. The strength of the coupling is determined by the maximal conductance value βij. Depending on the magnitude of βij values, the active cell in the “on” state can either slow down the inactive postsynaptic one due to the bottleneck effect (weak coupling) or shut it down completely with the saddle-node bifurcation in its perturbed state (strong coupling), which can be referred to as soft vs. hard locking, respectively. If the post-synaptic cell happens to be at the active phase, then the inhibition will shorten its duration significantly provided that βij is large enough. We deemphasize that it is the closeness to the saddle-node bifurcations in the postsynaptic cells that determines whether the coupling is weak or strong. Our coupling strategy is to ensure that θi>0 in all three equations in Eq. 4, that is, the cells maintain endogenous bursting in isolation and on the network and converge to the phase-locked states exponentially (Figure 2A). This does not have been the case case. By increasing increasing βij and α or by decreasing bursting frequency ω or by manipulating all three parameters, one can speed up the convergence substantially (Figure 7D) or even make the network rapidly reach any steady state in one or two steps [21].

The last term [121+eksinθ], breaking the symmetry of coupling on upstrokes and downstrokes, converts the synaptic input into qualitative inhibition. Namely, its sign is switched from + to − upon crossing the values θ=0 and θ=π. During the fast upstroke, when 0<θ<π, this term is positive, thereby ensuring that inhibition slows down or delays the transition into bursting. When π<θi<2π, during the fast downstroke, this term [121+eksinθ]<0 to ensure that the inhibition speeds up the transition from the active (tonic-spiking) phase of bursting into the inactive (quiescence) phase. This is phenomenologically consistent with neurophysiological recordings because inhibition projected onto the postsynaptic burster typically shortens the burst duration and extends the interburst intervals. Alternatively, this term can be replaced with [111+eksinθ] as it not only breaks the symmetry but also only acts during the upstroke of bursting.

The electrical coupling or the gap junction between the neurons is handled by the other term Celecsin(θpreθpost). It slows down the rate θpost when θpost>θpre and speeds it up if θpost<θpre. The conductivity coefficient Celec is to be set around two orders of magnitude smaller than β values to maintain a balanced effect in the network. When Celec and β are of the same magnitude, the dynamics of network are solely dictated by the electrical coupling with the inhibitory synapses insignificantly affecting it.

Let us note that unlike the bidirectional electrical synapse, a chemical one is unidirectional and hence asymmetric because it has a synaptic threshold: the chemical synapse becomes functional when the membrane voltage in the presynaptic cell rises above the only synaptic threshold in the active phase; otherwise the synapse is silent. This is the reason why a network composed of identical cell, and identical chemical synapses can only be called symmetric loosely, in some permutation sense. This is the reason why a permutation-symmetric 3-cell network always possesses a pair of traveling wave patterns (stable or not) where the cells burst sequentially and/or may generate three pacemaker patterns where one cell bursts in antiphase with the two others. Note that the last rhythms cannot be produced by a properly symmetric network by default.

5. Poincaré Return Maps for the Phase Lags. Results

Figure 6A shows how phase lags between upstrokes are introduced (here, cell 1 (blue) is the reference) between the three-networked 2θ-bursters turning counterclockwise on the unit circle S1 (Figure 6B). It is observed that inhibition generated by the green cell 2 in the active slow phase near θ=π above the synaptic threshold (given by cosθth=0) brings the other two cells closer to the bottom quiescent state bear θ=0 by accelerating the red burster 3 on the downstroke and by slowing down the blue burster 1 on the upstroke.

Following the same approach used in the weakly coupled HH-type models above, we first create a uniform distribution of initial phases on S1, and therefore, the phase lags between the three 2θ-bursters. Next, we integrate the network (4) over a large number of cycles and record burst initiations (see Figure 5A) to determine the phase lags between the reference cell 1 and two other cells and determine the kind of phase-locked states they can converge. This approach is illustrated in Figure 2A for the symmetric 3-cell motif composed of identical 2θ-bursters and equal inhibitory synapses. The corresponding 2D Poincaré return map, with the coexisting stable fixed points and saddles is shown in Figure 3. By stitching together the opposite sides of this map, we wrap it around a 2D torus as shown in Figure 2B.

The fixed points and their attraction basins are coded with different colors in the map. For example, the Poincaré return map for the (Δϕ21,Δϕ31) phase lags represented in Figure 3A has five stable fixed points representing robust three pacemaker FPs: red at (0,12), green at (12,0), and blue at (12,12) and two traveling wave rhythmic patterns: yellow clockwise at (13,23) and teal counterclockwise at (23,13). The borders of the attraction basins of these five FPs are determined by positions of stable sets (separatrices) of six saddles (gray dots). The origin is a repelling FP. In total, there are eight hyperbolic FPs in this Poincaré return map.

Let us underline another handy feature of the 2θ-burster paradigm. We can easily detect and explore repelling FPs or invariant circles, if any, existing in the 2D Poincaré map by reversing the integration direction of system (4), that is, multiplying the right-hand sides by −1, simulating the network in backward time. This reverses the direction to spin trajectories clockwise on S1, whereas the backward time integration will make dissipative systems run to infinity.

5.1.Homogeneous Motif With Identical Cells and Synapses

It will be shown below that 2θ-bursters weakly coupled in 3-cell networks, whether they are homogenous/symmetric or nonhomogeneous/asymmetric, can generate the same stable rhythms as the networks of biologically plausible HH-type models. We also discuss the bifurcations occurring in the networks and corresponding maps as synaptic connectivity and intrinsic temporal characteristics of the 2θ-bursters are changed. Bifurcations in the system are identified and classified by a change in the stable phase rhythms, which can be due to the stability loss of a particular FP or when it merges with a close saddle so that both disappear through a saddle-node bifurcation.

Let us first consider a symmetric network with two bifurcation parameters: the coupling strength β=βii(i=1,2,3) and the α-parameter in Eq. 3 that controls the duty cycle (DC) of the 2θ-bursters. We use five different DC values as α is varied from −0.11 to 0.11l while synaptic strength is increased through four steps from β = 0.0001 through β = 0.1. The results are presented in Figure 7. The Panels A2/3 represent the most balanced, weakly coupled network that can produce all five bursting rhythms with 50% DC. One can see that by increasing the β-value, the saddles separating 2 TWs and 3 PMs move toward the latter ones, and after some critical values, three pairs, a saddle and the nearest stable PM, merge and vanish simultaneously. After that, the symmetric network can produce two only rhythms: counterclockwise and clockwise TWs corresponding to the teal and yellow stable FPs at (13,23) and (23,13), respectively. This would correspond to the case of the “pseudopotential” depicted in Figure 4A.

FIGURE 7
www.frontiersin.org

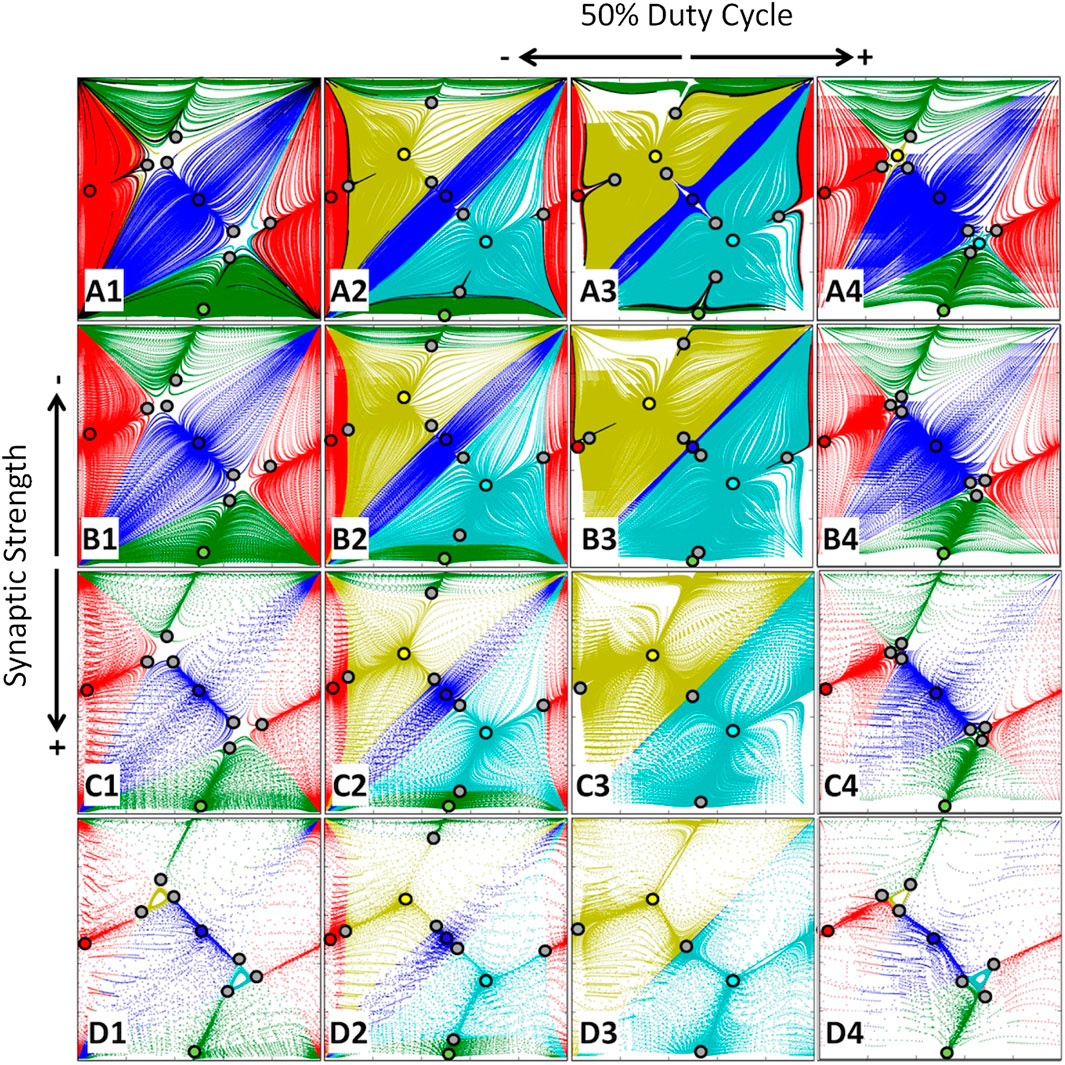
FIGURE 7. Bifurcations of FPs in the (Δϕ21,Δϕ31)-return map for the symmetric motif as the coupling β parameter and the duty cycle (via variations of α) are changed; β-values are [0.001, 0.003, 0.01, 0.03] from top to bottom labeled (AD), respectively, while α-values are [−0.11, −0.05, 0.0, 0.11] from left to right labeled, 1 through 4, respectively, with 50% DC at α=0.0 in column 3. With larger β-values, the rate of convergence to the FPs increases. The TW rhythms dominate the network dynamics when the DC is about 50%, as seen in the middle columns. The PM rhythms become dominant at small and large DC values, as depicted in the outer panels. Once can observe that with larger β-values, the network converges to the phase-locked states substantially faster, which is indicated by the growing distance between the successive iterates in the maps in panel D1–D4.

The stable PMs promote or dominate the dynamics of the symmetric case at extreme α-values corresponding to the bursting rhythms with short or long burst durations. Once we compare panels, say A1 and D4 reveal this time, the separating saddles group around the stable TWs to minimize their attraction basins, and hence the likelihood of the occurrence of these rhythms in the network. These cases correspond to the “pseudopotential” depicted in Figure 4B.

5.2.“Winner Takes all” Motif

The first asymmetric case considered is a motif termed the “winner takes it all.” In this modeling scenario, both outgoing inhibitory synapses from the given cell, here the reference blue burster 1, are evenly increased in the strength, see Figure 8A. It is observed that such a configuration breaks down the circular (and permutation) symmetries supporting traveling waves in the network. Let us start with Figure 8B: no surprise that with an initial increase in β1,2/3, two saddles shift away from the blue PM at (0.5, 0.5) toward 2 TWs, then merge with them to disappear pairwise. Next, as β1,2/3 is increased further, two other saddles annihilate the green and red PMs through similar saddle-node bifurcations (Figure 8C). In the aftermath, the 3-cell network with a single burster generating the repulsive inhibition much stronger than the other two cells becomes a monostable one producing a single pacemaking rhythm with the phase lags locked at (0.5, 0.5).

FIGURE 8
www.frontiersin.org

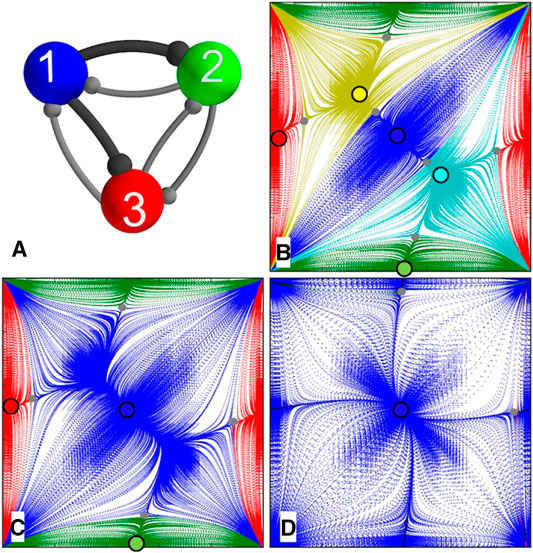
FIGURE 8. (A) “Winner takes all” motif with two synapse strengths, β13 and β12, increased (indicated by darker connections), relative to the other synapse strengths. (B) The first of three (Δϕ21,Δϕ31) return maps, with β13 and β12 synaptic strengths slightly greater than the other βs, the (blue) attraction area extends so that the two saddles nearest the blue PM at (12,12) move away from the blue PM, closer toward the yellow and teal TWs at (13,23) and (23,13), respectively. (C) With further increase in β13 and β12, these saddles and TWs merge with and annihilate each other through saddle-node bifurcations, and the blue PM basin grows. (D) At greater β13 and β12 values, the network becomes a winner-take-all, blue PM winning, after the red and green PMs, at (12,0) and (0,12), respectively, vanish through subsequent saddle-node bifurcations. The parameters are as follows: ω = 1.15, α = 0.07, and β = 0.003 except β13 and β12 = 0.0038, 0.004, and 0.015 for panels (BD).

5.3.Mono-Biased Motif

We refer as a mono-biased motif to another asymmetric network with a single different synapse. In this case, the strength β21 of the outgoing synapse from cell 2 to cell 1 is increased, which violates the circular symmetry supporting the counterclockwise traveling wave in the network, see Figure 9F. So, as β21 is increased, the counterclockwise stable FP at (23,13) first disappears through a saddle-node bifurcation, as seen in Figures 9A,B. Because this was the saddle between the TW and the green PM, the attraction basin of the latter increases after the first bifurcation in the sequence. The next saddle-node bifurcation eliminates the red stable FP at (0, 0.5). The reasoning is as follows: for this rhythm to persist, the red PM should evenly inhibit both green and blue PMs. However, a growing inhibition imbalance between them is no longer reciprocal. As we pointed out earlier, the stronger inhibition from cell 2 shortens the active phase of the blue burster. As so, they cannot longer line up by the burster 3, which causes the disappearance of this PM-rhythm and the FP itself (Figure 9C). Similar arguments can be used to justify the disappearance of the green PM as cell 2 cannot inhibit cells 1 and 2 evenly to hold them together as β21 is increased further (not shown). This is in this case is in good agreement with the 3-cell networks of the HH-type bursters.

FIGURE 9
www.frontiersin.org

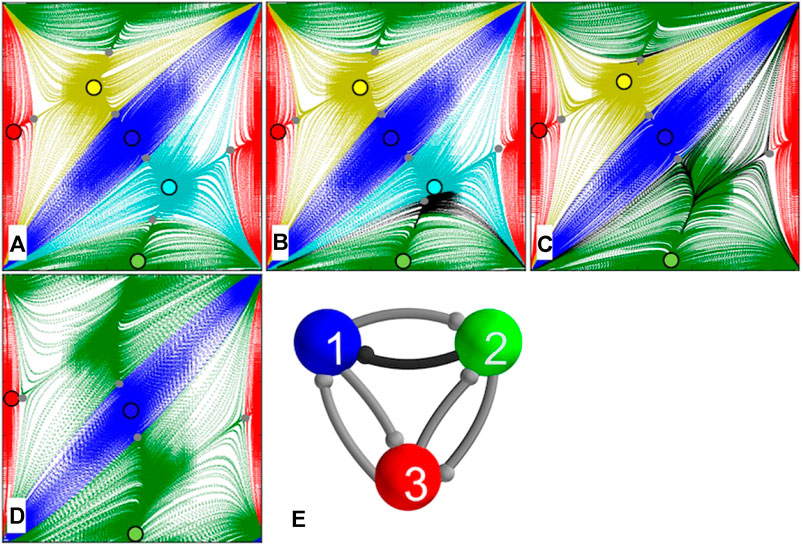
FIGURE 9. Mono-biased network motif (F) with one different synapse due to increasing β21. (A) The first of five (Δϕ21,Δϕ31) return maps, an increase in β21 value breaks down a counterclockwise symmetry so that the attraction basin (teal) of the corresponding TW at (23,13) shrinks as a nearby saddle moves closer to it and away from the green PM at (12,0) (A and B). (C) With further increase in β23, the counterclockwise TW at (23,13) vanishes through a saddle-node bifurcation after merging with the nearest saddle, followed by another saddle-node bifurcation eliminating the red PM at (0, 0.5) (D). At greater β23 values, the green PM at (12,0) encompasses the majority of the network phase space, along with the blue PM at (12,12), preserving the size of its attraction basin. The parameters are ω = 1.15, α = 0.07, and β′s = 0.003 except β21 = 0.00042, 0.0045, 0.01, and 0.02 for panels (AD).

5.4.Dedicated HCO

The abbreviation HCO stands for a half-center oscillator, where a pair of neurons coupled reciprocally by inhibitory synapses to produce alternating bursting. Such a dedicated HCO is formed by cells 2 and 3 with stronger synapses due to β23=β32 in the configuration shown in Figure 10C. Again with start off with the symmetric case depicted in Figure 10A, one can observe at once that having the dedicated HCO should break down the circular symmetries of the network. So, the stable TWs become eliminated first as β23=β32 starts increasing. As these synapses become stronger, the attraction basin of the blue PM at (0.5 0.5) shrinks substantially, but the FP itself persists. Meanwhile, increasing β23=β32 further creates the inhibitory imbalance that makes the further existence of the green and red PMs impossible due to the factors that we outlined above for the mono-biased motif. Both vanish at the same time due to saddle-node bifurcations. However, at the bifurcation, both double FPs are connected by a heteroclinic orbit that transforms into a stable invariant curve wrapping around the torus (see Figure 10F). This stable invariant curve is associated with a phase-slipping rhythm that recurrently passes slowly through the “ghosts” of all four vanished FPs except for the coexisting blue PM, see the fragments of the corresponding traces presented in Figure 10G.

FIGURE 10
www.frontiersin.org

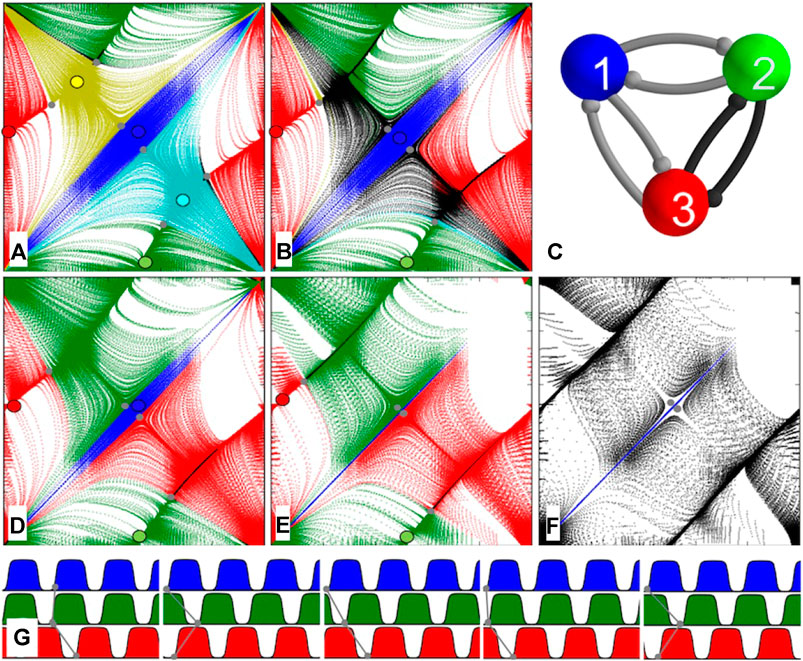
FIGURE 10. (C) “Pairwise-biased” network motif with two reciprocal synapse strengths β23 and β32, increased. (A) The first of five (Δϕ21,Δϕ31) return maps, with β23 and β32 slightly greater than other synaptic connections the network possesses all five attracting FPs. (B) Evenly increasing β23 and β32 values break down the rotational symmetry of the network so that both TWs at (13,23) and (23,13) vanish through saddle-node bifurcations while the red and green PM basins equally expand and the blue basin shrinks. Here, two areas of the map, due to slow transitions throughout the saddle-node ghosts, are color coded in black because of the uncertainty in ultimate destination. (DE) With further increases in β23 and β32 values, the blue basin continues to shrink until red and green basins encompass almost all of the areas of the map. One can see from Panel (E) that the red and green PMs at (12,0) and (0,12) are also about to merge with nearby saddles and disappear through two homoclinic saddle-node bifurcations (SNIC). (F) At greater values in β23 and β32, the blue PM at (12,12) has only a very narrow attraction basin, corresponding to the only phase-locked rhythm, coexisting with a dominant phase-slipping repetitive pattern. The phase slipping (its trace shown in Panel (G)) corresponds to a stable invariant curve (black attraction basin), passing throughout (12,0) and wrapping abound the 2D toroidal phase space to reemerge near (0,12) and so forth. (G) Five exemplary episodes of the traces vs. time showing periodically varying (slipping) phase lags. The parameters are ω = 1.15, α = 0.07, and β = 0.003, except β23 and β32 are 0.005, 0.006, 0.009, and 0.035, in panels (A), (B), and (DF).

5.5.Clockwise-Biased Motif

The clockwise-biased motif in this case represents the 3-cell network with counterclockwise connections stronger than ones in the clockwise direction, see Figure 11E. This configuration does not break the circular symmetries of the network but implies that either TW should win over the opposite one, which should result in their attraction basins changing correspondingly. Figure 11 presents four transformation stages of the map as β13, β32, and β21 sequentially increased. With a small increase, the shape of the map becomes slightly twisted with the three saddles shifting away from the stable PMs toward the teal TW at (23,13). A further increase brings the saddle close to the teal one, thereby shrinking its attraction basin and substantially widening the basin of the clockwise TW at (13,23). Finally, as some bifurcation threshold is reached, the saddles collapse at the stable FP that becomes a complex saddle with three outgoing and three incoming separatrices. This means that the counterclockwise TW becomes an unstable rhythm in such biased 3-cell motif that is fully dominated by the clockwise TW rhythm.

FIGURE 11
www.frontiersin.org

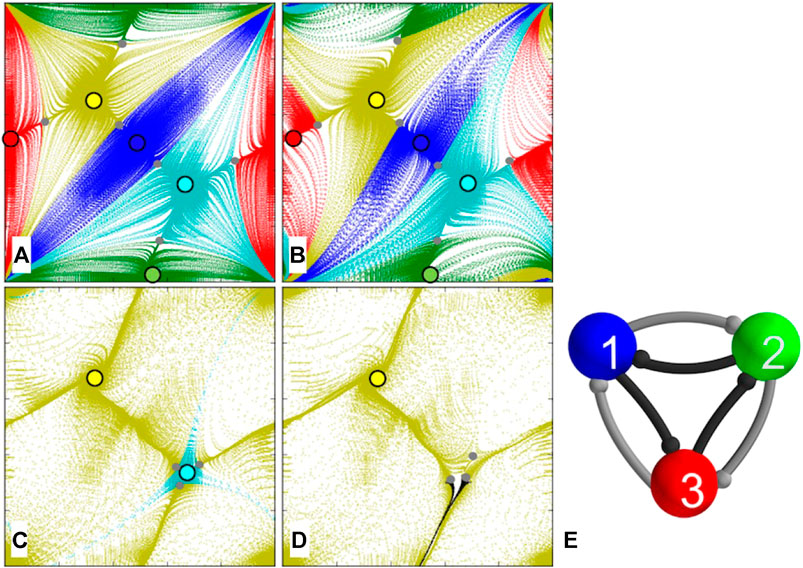
FIGURE 11. (E) Clockwise-biased motif with three synaptic strengths, β13, β32, and β21 sequentially increased. (A) As all three counterclockwise synapses are slightly strengthen, saddles shift away from the three stable PMs, blue at (12,12), green at (12,0), and red at (0,12), toward the teal clockwise TW at (23,13)(B) thus shrinking its basin and widening the attraction basin of the dominant counterclockwise TW (yellow) at (13,23)(C). (D) With the stronger synaptic values, the three saddles collapse into the CC TW, which becomes a complex saddle with three incoming and three outgoing separatrices. The parameters are ω = 1.15, α = 0.07, β = 0.003 except β12, β23, and β31 = 0.0033, 0.025, 0.035, and 0.055 for panels (AD).

5.6.Gap Junction

In our last example, we consider the symmetric motif with a gap junction or electric synapse added between cells 1 and 2 as shown in Figure 12C. Recall that a gap junction is bidirectional unlike unidirectional chemical synapses with synaptic thresholds. Recall that it is modeled by this term Celecsin(θpreθpost) that slows down the rate θpost when θpost>θpre and speeds it up if θpost<θpre. Due to this property, the electrical synapses, like excitatory ones, typically promote synchrony between such coupled oscillatory cells, as in our case between cells 1 and 2.

FIGURE 12
www.frontiersin.org

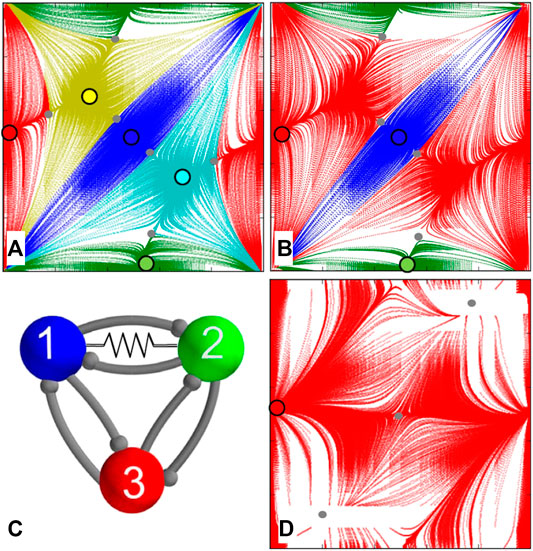
FIGURE 12. Gap junction in the symmetric 3-cell network (C) is represented by a resistor symbol placed between cells 1 and 2. (A) At Celec=0.00015, the network yet generates five phase-locked rhythms with comparably sized basins of attraction. (B) Increasing Celec breaks the circular symmetries of the network, which makes both TWs at (13,23) and (23,13) vanish through saddle-node bifurcations while the basin of the red PM at (0,12) widens. (D) With an even greater electrical coupling, the red PM becomes the winner-takes-all after the electrical connection ensures in-phase synchrony between cells 1 and 2 (C) that eliminates the blue and green PMs in the map after subsequent saddle-node bifurcation. The parameters are ω = 1.15, α = 0.07, β = 0.003, and Celec=0.00015, 0.0003, and 0.0015 for panels (A), (B), and (D).

It is observed that introducing an electrical synapse between only two of the cells of the motif breaks down both circular symmetries in the system. This is documented in Figures 12A,B depicting the maps for the networks with Celec being increased from zero to 0.0003. One can see that both TWs vanished from the repertoire of the network. Further increase in Celec makes the stable green and blue stable PMs disintegrate as both cells become synchronous and burst in alternation with the red cell 3. This completes the consideration of the monostable network with a relatively strong gap junction between cells 1 and 2 that can only produce the only one pacemaker rhythm.

6. Conclusion

Our ultimate goal is to use the top-down approach to single out the fundamental principles of the rhythm formation in small networks that can be systematically generalized and applied for understanding larger network architectures. Due to the rhythmic nature of the bursting patterns, we employed Poincaré return maps defined on phases and phase lags between burst initiations in the interneurons. These maps allow us to study quantitative and qualitative properties of the stable rhythms and their corresponding attractor basins. The specific goal of this study is to demonstrate the simplicity and usability of the 2θ-bursters to construct multistable, polyrhythmic neural networks that have the same dynamical and bifurcation properties as ones composed of biologically plausible models of Hodgkin-Huxley–type bursters and chemical synapses [34, 35].We argued that the maps derived from the HH-type bursters and ones from the 2θ-bursters have the same structure. As such, these maps serve as a detailed blueprint containing all necessary information about the network in question, including its rhythmic repertoire, stability of generated patterns, and the like. In addition, with such maps, one can predict possible transformations before they occur in the network. Furthermore, we showed that depending on strengths of inhibition, the maps and hence the corresponding networks may have different distributions of phase-locked states. As such, the proposed approach reveals the capacity of the network and the dependence of its outcomes on coupling strength, wiring circuitry, and synapses, thereby allowing one to identify necessary and sufficient conditions for rhythmic outcomes to occur. Our study is a further step toward the foundation of the bifurcation theory of multifunctional rhythmic circuits including network with a modular organization of subcircuits [25].

In this article, we did not discuss the rhythm-generating motifs composed of 2θ-cells that are quiescent in isolation. While motifs, made of coupled 2θ-cells initially placed at the upper “on” state, functions well using the escape mechanism for the rhythmogenesis, the other basic mechanism based on the post-inhibitory rebound [24] is not (fully) applicable to 2θ-cells because it requires at least two dynamical variables, slow and the fast, to warrant the occurrence of specific transient dynamics in the system.

Our computational approach based on the reduction to the evident Poincaré return maps for phase lags extracted from voltage traces were inspired by neurophysiological recordings from biological CPGs, such as the 3-cell pyloric one and swim CPGs of sea slugs. The predictive power of the map approach is that it allows constructing a desired neural circuit with some preset properties. With such maps, one also gains generalizable insights helpful for the better understanding of the fundamental and universal rules of the pattern formation in various models of central pattern generators. Our findings can be employed for identifying or implementing the conditions for normal and pathological functioning of basic CPGs of animals and artificially intelligent prosthetics that can regulate various movements.

The Reader is welcome to download the open-source Motiftoolbox (supports GPUs) https://github.com/jusjusjus/Motiftoolbox to interactively explore various 3-cell, 4-cell, and large circuits composed of the HH-type, FN-like, and 2θ-bursters.

Data Availability Statement

The computational toolkit supporting the findings of this study is openly available as Motiftoolbox in GitHub at https://github.com/jusjusjus/Motiftoolbox.

Author Contributions

AS supervised the findings of this work. All authors designed the model and the computational framework, analyzed the data, discussed the results, and contributed to the final manuscript.

Funding

We thank the Brains and Behavior initiative of the Georgia State University for the pilot grant support. This study was funded in part by the NSF grant IOS-1455527.

Conflict of Interest

The authors declare that the research was conducted in the absence of any commercial or financial relationships that could be construed as a potential conflict of interest.

Acknowledgments

The authors thank the past and current lab-mates of the Shilnikov NeurDS lab (Neuro–Dynamical Systems), specifically, K. Wojcik, K. Pusuluri, J. Collens, and J. Bourahmah and J. Schwabedal (Motiftoolbox developer). The NeurDS lab is grateful to NVIDIA Corporation for donating the Tesla K40ring GPUs that were actively used in this study. This research was partially funded by the National Science Foundation, grant IOS-1455527.

Appendix

The time evolution of the membrane potential, V, of each neuron is modeled using the framework of the Hodgkin–Huxley formalism, based on a reduction in a leech heart interneuron model:

CV=INaIK2ILIappIsyn,τNahNa=hNa(V)h,τK2mK2=mK2(V)mK2,(5)

see ref. 23 and the references therein. Its dynamics involve a fast sodium current, INa with the activation described by the voltage-dependent gating variables, mNa and hNa, a slow potassium current IK2 with the inactivation from mK2, and an ohmic leak current, Ileak:

INa=g¯NamNa3hNa(VENa),IK2=g¯K2mK22(VEK),IL=g¯L(VEL).(6)

C=0.5nF is the membrane capacitance and Iapp=0.006nA is an applied current. The values of maximal conductances are g¯K2=30nS, g¯Na=160nS, and gL=8nS. The reversal potentials are ENa=45mV, EK=70mV, and EL=46mV. The time constants of gating variables are τK2=0.9s and τNa=0.0405s. The steady-state values, hNa(V), mNa(V), and mK2(V), of the of gating variables are determined by the following Boltzmann equations:

hNa(V)=[1+exp(500(V+0.0325))]1mNa(V)=[1+exp(150(V+0.0305))]1mK2(V)=[1+exp(83(V+0.018+VK2shift))]1.(7)

Fast, nondelayed synaptic currents in this study are modeled using the fast-threshold modulation (FTM) paradigm as follows [33]:

Isyn=gsyn(VpostEsyn)Γ(VpreΘsyn),Γ(VpreΘsyn)=1/[1+exp{1000(VpreΘsyn)}];(8)

where Vpost and Vpre are voltages of the post- and presynaptic cells; the synaptic threshold Θsyn=0.03V is chosen so that every spike within a burst in the presynaptic cell crosses Θsyn, see Figure 1. This implies that the synaptic current, Isyn, is initiated as soon as Vpre exceeds the synaptic threshold. The type, inhibitory or excitatory, of the FTM synapse is determined by the level of the reversal potential, Esyn, in the postsynaptic cell. In the inhibitory case, it is set as Esyn=0.0625V so that Vpost(t)>Esyn. In the excitatory case, the level of Esyn is raised to zero to guarantee that the average of Vpost(t) over the burst period remains below the reversal potential. We point out that alternative synapse models, such as the alpha and other detailed dynamical representations, do not essentially change the dynamical interactions between these cells [19].

References

1. Marder, E, and Calabrese, RL. Principles of rhythmic motor pattern generation. Physiol Rev (1996). 76(3):687–717. doi:10.1152/physrev.1996.76.3.687.

PubMed Abstract | CrossRef Full Text | Google Scholar

2. Kristan, WB, Calabrese, RL, and Friesen, WO. Neuronal control of leech behavior. Prog Neurobiol (2005). 76:279–327. doi:10.1016/j.pneurobio.2005.09.004.

PubMed Abstract | CrossRef Full Text | Google Scholar

3. Marder, E. Invertebrate neurobiology: polymorphic neural networks. Curr Biol (1994). 4(8):752–4. doi:10.1016/s0960-9822(00)00169-x.

PubMed Abstract | CrossRef Full Text | Google Scholar

4. Calin-Jageman, RJ, Tunstall, MJ, Mensh, BD, Katz, PS, and Frost, WN. Parameter space analysis suggests multi-site plasticity contributes to motor pattern initiation in tritonia. J Neurophysiol (2007). 98:2382–98. doi:10.1152/jn.00572.2007.

PubMed Abstract | CrossRef Full Text | Google Scholar

5. Newcomb, JM, Sakurai, A, Lillvis, JL, Gunaratne, CA, and Katz, PS. Homology and homoplasy of swimming behaviors and neural circuits in the nudipleura (mollusca, gastropoda, opistho-branchia). Proc Natl Acad Sci USA (2012). 109(1):10669–76. doi:10.1073/pnas.1201877109.

PubMed Abstract | CrossRef Full Text | Google Scholar

6.Selverston, A ed. Model neural networks and behavior. Berlin, Germany: Springer (1985).

Google Scholar

7. Bal, T, Nagy, F, and Moulins, M. The pyloric central pattern generator in Crustacea: a set of conditional neuronal oscillators. J Comp Physiol (1988). 163(6):715–27. doi:10.1007/bf00604049.

CrossRef Full Text | Google Scholar

8. Katz, PS, and Hooper, SL. Invertebrate central pattern generators. In: G North RR Greenspan, editors Invertebrate neurobiology. New York, NY: Cold Spring Harbor Laboratory Press (2007).

Google Scholar

9. Kopell, N, and Ermentrout, B. Chemical and electrical synapses perform complementary roles in the synchronization of interneuronal networks. Proc Natl Acad Sci USA (2004). 101(43):15482–7. doi:10.1073/pnas.0406343101.

PubMed Abstract | CrossRef Full Text | Google Scholar

10. Matsuoka, K. Mechanisms of frequency and pattern control in the neural rhythms generators. Biol Cybern (1987). 56:345–53.

Google Scholar

11. Kopell, N. Toward a theory of modeling central pattern generators. In: AH Cohen, S Rossingol, S Grillner, editors Neural control of rhythmic movements in vertebrates. New York, NY: Wiley (1988).

Google Scholar

12. Canavier, CC, Baxter, DA, Clark, JW, and Byrne, JH. Multiple modes of activity in a model neuron suggest a novel mechanism for the effects of neuromodulators. J Neurophysiol (1994). 72(2):872–82. doi:10.1152/jn.1994.72.2.872.

PubMed Abstract | CrossRef Full Text | Google Scholar

13. Skinner, FK, Kopell, N, and Marder, E. Mechanisms for oscillation and frequency control in reciprocally inhibitory model neural networks. J Comput Neurosci (1994). 1:69–87. doi:10.1007/bf00962719.

PubMed Abstract | CrossRef Full Text | Google Scholar

14. Dror, RO, Canavier, CC, Butera, RJ, Clark, JW, and Byrne, JH. A mathematical criterion based on phase response curves for stability in a ring of coupled oscillators. Biol Cybern (1999). 80(1):11–23. doi:10.1007/s004220050501.

PubMed Abstract | CrossRef Full Text | Google Scholar

15. Shilnikov, A, Gordon, R, and Belykh, I. Polyrhythmic synchronization in bursting networking motifs. Chaos (2008). 18(3):037120. doi:10.1063/1.2959850.

PubMed Abstract | CrossRef Full Text | Google Scholar

16. Kristan, WB. Neuronal decision-making circuits. Curr Biol (2008). 18(19):R928–32. doi:10.1016/j.cub.2008.07.081.

CrossRef Full Text | Google Scholar

17. Briggman, KL, and Kristan, WB. Multifunctional pattern-generating circuits. Annu Rev Neurosci (2008). 31:271–94. doi:10.1146/annurev.neuro.31.060407.125552.

CrossRef Full Text | Google Scholar

18. Belykh, IV, and Shilnikov, AL. When weak inhibition synchronizes strongly desynchronizing networks of bursting neurons. Phys Rev Lett (2008). 101(7):078102. doi:10.1103/physrevlett.101.078102.

CrossRef Full Text | Google Scholar

19. Jalil, S, Belykh, I, and Shilnikov, AL. Spikes matter in phase-locking of inhibitory bursting networks. Phys Rev E (2012). 85:36214. doi:10.1103/physreve.85.036214.

CrossRef Full Text | Google Scholar

20. Jalil, S, Allen, D, Youker, J, and Shilnikov, A. Toward robust phase-locking inMelibeswim central pattern generator models. Chaos (2013). 23(4), 046105. doi:10.1063/1.4825389.

CrossRef Full Text | Google Scholar

21. Knapper, D, Schwabedal, D, and Shilnikov, AL. Qualitative and quantitative stability analysis of penta-rhythmic circuits. Nonlinearity (2016). 29(12):3647–76. doi:10.1088/0951-7715/29/12/3647.

Google Scholar

22. Shilnikov, A, and Cymbalyuk, G. Homoclinic bifurcations of periodic orbits en a route from tonic spiking to bursting in neuron models. Reg Chaot Dyn (2004). 9, 281–97. doi:10.1070/rd2004v009n03abeh000281.

CrossRef Full Text | Google Scholar

23. Shilnikov, A. Complete dynamical analysis of a neuron model. Nonlinear Dyn (2012). 68(3):305–28. doi:10.1007/s11071-011-0046-y.

CrossRef Full Text | Google Scholar

24. Collens, J, Pusuluri, K, Kelley, A, Knapper, D, Xing, T, Basodi, S, et al. Dynamics and bifurcations in multistable 3-cell neural networks. Chaos (2020). 30:072101. doi:https://doi.org/10.1063/5.00113742020.

CrossRef Full Text | Google Scholar

25. Pusuluri, K, Basodi, S, and Shilnikov, A. Computational exposition of multistable rhythms in 4-cell neural circuits. Commun Nonlinear Sci Numer Simulat (2020). 83:105139. doi:10.1016/j.cnsns.2019.105139.

CrossRef Full Text | Google Scholar

26. Ermentrout, B, and Kopell, N. Parabolic bursting in an excitable system coupled with a slow oscillation. SIAM J Appl Math (1986). 46:0146017. doi:10.1137/0146017.

CrossRef Full Text | Google Scholar

27. Wojcik, J, Clewley, R, and Shilnikov, AL. Order parameter for bursting polyrhythms in multifunctional central pattern generators. Phys Rev E (2011). 83:056209. doi:10.1103/physreve.83.056209.

CrossRef Full Text | Google Scholar

28. Wojcik, J, Clewley, R, Schwabedal, J, and Shilnikov, AL. Key bifurcations of bursting polyrhythms in 3-cell central pattern generators. PLoS One (2014). 9(4):e92918. doi:10.1371/journal.pone.0092918.

CrossRef Full Text | Google Scholar

29. Shilnikov, AL, and Cymbalyuk, G. Transition between tonic spiking and bursting in a neuron model via the blue-sky catastrophe. Phys Rev Lett (2005). 94(4):048101. doi:10.1103/physrevlett.94.048101.

CrossRef Full Text | Google Scholar

30. Shilnikov, A, and Turaev, D. Blue-sky catastrophe. Scholarpedia (2007). 2(8):1889. doi:10.4249/scholarpedia.1889.

CrossRef Full Text | Google Scholar

31. Shilnikov, LP, Shilnikov, AL, and Turaev, DV. Showcase of blue sky catastrophes. Int. J. Bifurcation Chaos (2014). 24, 1440003. doi:https://doi.org/10.1142/S0218127414400033.

CrossRef Full Text | Google Scholar

32. Turaev, AL, Shilnikov, LP, and Turaev, DV. Blue-sky catastrophe in singularly perturbed systems. Moscow Math J (2005). 5(1):269–282. doi:10.17323/1609-4514-2005-5-1-269-282.

CrossRef Full Text | Google Scholar

33. Kopell, N, and Somers, D. Rapid synchronization through fast threshold modulation. Biol Cybern (1993). 68(1):393–407. doi:10.1007/BF00198772.

CrossRef Full Text | Google Scholar

34. Channell, P, Cymbalyuk, G, and Shilnikov, AL. Origin of bursting through homoclinic spike adding in a neuron model. Phys Rev Lett (2007). 98(13):134101. doi:10.1103/physrevlett.98.134101.

CrossRef Full Text | Google Scholar

35. Rinzel, J, and Ermentrout, B. Methods in neuronal modelling: from synapses to networks. C Koch I Segev, editors. Cambridge, MA: MIT Press (1989).

Google Scholar

Keywords: central pattern generator, r multistability, phase-lag, neuron, model

Citation: Kelley A and Shilnikov A (2020) 2θ-Burster for Rhythm-Generating Circuits. Front. Appl. Math. Stat. 6:588904. doi: 10.3389/fams.2020.588904

Received: 29 July 2020; Accepted: 14 September 2020;
Published: 27 November 2020.

Edited by:

Vijay Kumar Yadav, Nirma University, India

Reviewed by:

Valeri Makarov, Complutense University of Madrid, Spain
James Rankin, University of Exeter, United Kingdom

Copyright © 2020 Shilnikov and Kelley. This is an open-access article distributed under the terms of the Creative Commons Attribution License (CC BY). The use, distribution or reproduction in other forums is permitted, provided the original author(s) and the copyright owner(s) are credited and that the original publication in this journal is cited, in accordance with accepted academic practice. No use, distribution or reproduction is permitted which does not comply with these terms.

*Correspondence: Andrey Shilnikov, ashilnikov@gsu.edu

Disclaimer: All claims expressed in this article are solely those of the authors and do not necessarily represent those of their affiliated organizations, or those of the publisher, the editors and the reviewers. Any product that may be evaluated in this article or claim that may be made by its manufacturer is not guaranteed or endorsed by the publisher.