 Victor Hugo Masías
 Tobias Hecking
 Heinz Ulrich Hoppe
- COLLIDE Research Group, Department of Computer Science and Applied Cognitive Science, Faculty of Engineering, University of Duisburg-Essen, Duisburg, Germany
A methodological approach is developed for exploring the relationship between the use of social networking sites and participation in protest activities. Although a recent meta-analysis study demonstrated that there is a positive association between the two, little work examining this association further appears to have been published. The methodology proposed here studies the patterns of the relationship between nine social media and five types of protest activity using the techniques of multiple correspondence analysis, hierarchical cluster analysis and induction of decision rules. The results give insights into the relationship in different segments of individuals' profiles defined as non-activist, offline activist, social media user (two types) and online activist. Significantly, this last segment proves to be a small and heterogeneous group. The results also show that the proposed approach is useful for exploring the patterns of the relationship in a low-dimensional space. Limitations of the methodology and possible extensions are discussed.
1. Introduction
The use of social networking sites has emerged in recent years as a factor in the dynamic of civil protest [1, 2]. The present article introduces a methodology and approach for exploring the relationship between the usage of social networking sites and participation in protest activities. The focus of our analysis is Latin America, which over the last decade has experienced numerous cases of mass protest. Examples include Chilean students marching in support of education reform [3], demonstrations in Brazil culminating in the impeachment of Dilma Rousseff [4] and street clashes in Venezuela between supporters and opponents of Nicolás Maduro [5]. In each of these situations, the role played by online social networks in the protests has been documented (see [6, 7]).
Previous research has suggested that these social networking sites are used to coordinate and disseminate content relating to protests [8–11], but demonstrating the existence of a positive association between social networking site use and protest participation has proved to be a complex undertaking. The complexity lies in the difficulties inherent in directly measuring individual's participation in offline protest activities [12]. Furthermore, measuring individual online activities in many social networking sites (i.e., cross-channel social media analysis) is still in the experimental phase,1 held back not only by the technical problems of accessing the data but also by privacy policies, the challenges posed by anonymisation and the emerging ethical dilemmas involved in exploiting social media data [17, 18].
Despite these issues, there is a growing body of explanatory research that has encountered evidence of an association between the use of social networking sites and participation in political activity. In specific terms, it has been reported that using these sites increases the probability of taking part in demonstrations [19], election campaigns [20], marches, and political activities generally [21]. It has further been observed that both political social media use and attention to political news in traditional media increase political engagement over time [22].
Recent meta-analyses have also shown that there is a positive association between social media use and participation in political activity (see [23–26]). One of the few studies of this issue that has rigorously proved the existence of this association (although not for Latin America) is [24]. The author's meta-analysis of 36 previous studies exploring the relationship between social media use and participation in civic and political activities that more than 80% of the variable coefficients tested were found to have a positive sign [24].
In the methodological approach proposed in the present article, the initial objective of our statistical analysis is to explore and interpret individual responses as regards the relationship between social media use and protest participation. The approach involves the following three tasks:
• Create proxy quantitative measurements of individuals' social networking site use and protest participation
• Segment the individuals based on the results of these measurements
• Induce decision rules for interpreting the segments
The contribution of the present study is the development of an exploratory methodological approach for examining the patterns of association between social media sites and participation in different types of protests. This involves an exploratory analysis of the data given that every year new sites social media sites are born while others disappear, prompting those taking part in protest activities to search out new ways of connecting with different audiences and communities. The proposed method is particularly relevant, and even necessary, given that as noted in Boulianne [24], there are few initiatives explicitly aimed at examining the relationship between social media use and participation in civic and political life.
The remainder of this paper is organized into four sections. section 2 introduces a conceptual analytic framework for studying the relationship between social networking site use and protest participation; section 3 describes the proposed methodology, the variables used and the techniques of analysis applied; section 4 sets out the results; and finally, section 5 discusses the main findings, the limitations of this study and possible future extensions.
2. Conceptual Analytical Framework
There are no universally accepted definitions in the specialized literature of either protest activities [27, 28] or social networking sites [29, 30]. For our purposes here, protest activity is understood as “a mode of political action oriented toward objection to one or more policies or conditions” [31, p. 1145]. Social networking sites, on the other hand, are taken to be communication technologies that allow individuals to [32, p. 211]: (a) construct a public or semi-public profile within a bounded system, b) articulate a list of other users with whom they share a connection, and c) view and traverse their list of connections and those made by others within the system.
The central idea behind our approach is that if we can quantify at the level of individuals the use of social networking sites and participation in different protest activities, we will then be able to identify certain key patterns of association between the two concepts. To demonstrate how this can be done, we introduce an idealized analytical framework of just two dimensions drawn as perpendicular axes that represent social networking site use (x-axis) and protest activity participation (y-axis), respectively (see Figure 1). A given group of individuals can then be distributed into the four quadrants formed by the axes as shown in Figure 1. The result is a segmentation of the individuals that can be described as follows:
This figure suggests the following:
• Quadrant 1: Individuals who use social networking sites and/or participate in protest activities (x > 0, y > 0)
• Quadrant 2: Individuals who do not use social networking sites and/or participate in protest activities (x < 0, y > 0)
• Quadrant 3: Individuals who do not use social networking site and/or do not participate in protest activities (x < 0, y < 0)
• Quadrant 4: Individuals who use social networking sites and/or do not participate in protest activities (x > 0, y < 0)
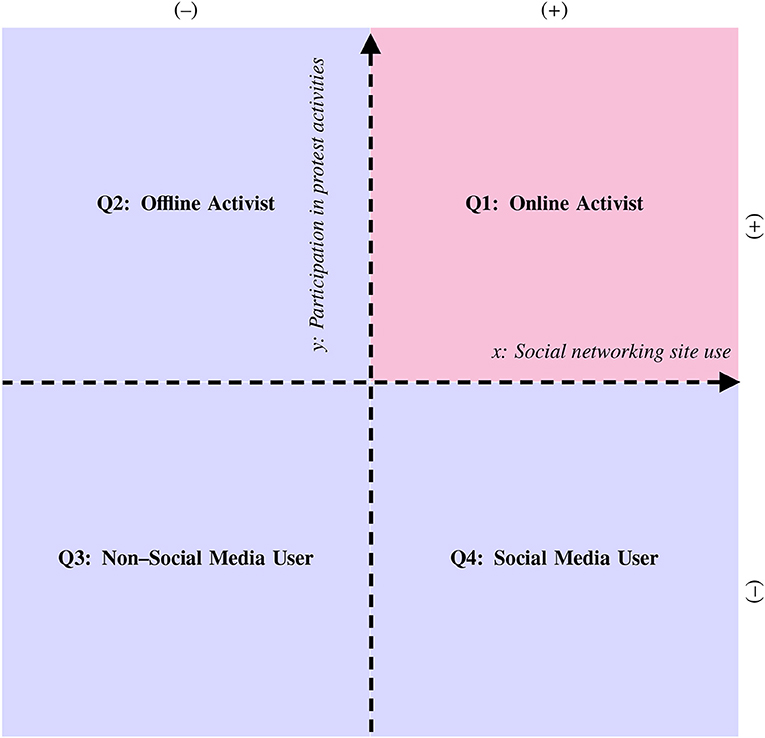
Figure 1. Idealized typology of individuals based on the hypothetical relationship between social networking site use (x) and protest activity participation (y).
As can be seen, Quadrants 1 and 2 contain the segment of individuals that participates in protests while Quadrants 1 and 4 contain the segment of individuals that uses social networking sites. Note that this is an abstract typology, therefore, we do not know how heterogeneous or homogeneous the individuals in each quadrant are. An exploratory study should give us some idea of how best the individuals can be segmented.
The problem of characterizing the association between social networking site use and protest participation can be understood by means of a reduced conceptual model,2 shown here in Figure 2.
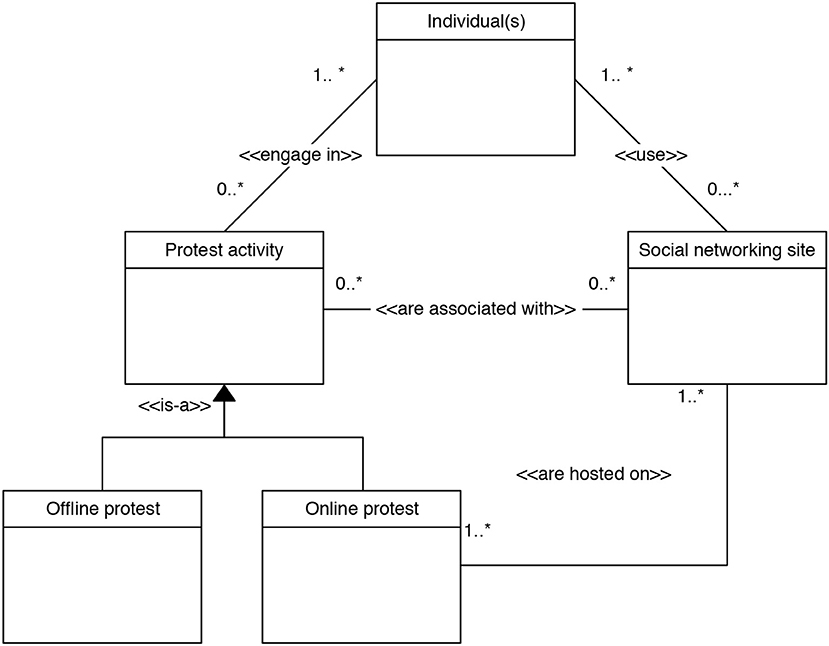
Figure 2. Conceptual model of the relations between the individual, his/her participation in protest activities (online/offline) and social networking site use.
The conceptual model describes the relations between the different classes, that is, the main concepts under study. The classes are shown in the figure as rectangles while the lines connecting them are labeled to indicate the semantic relations they represent. For instance, < < engage in>>, < < use>>, < < are associated with>>, < < are hosted on>> are association relations while < < is-a>> is a generalization/inheritance relations that defines offline protest and online protest as subclasses of the protest activity class. Cardinality constraints between the concepts are indicated in the [min.max] format, where [1.*] is read as 1 to many, and [0.*] is read as 0 to many.
This conceptual model suggests the following:
• One to many individuals can engage in zero to many protest activities
• One to many individuals use from zero to many social networking sites
• Online and offline protest activities are subtypes of protest activities
• Zero to many protest activities are associated with zero to many social networking sites
• One to many online protest activities are hosted on one to many social networking sites
In particular, we are interested in exploring the relation < < are associated with>> between the protest activity and social networking site classes without having information on the relation < < are hosted on>>. As can be seen in this conceptual model, exploring the relation < < are associated with>> is a complex problem given that the number of occurrences of zero to many protest activities is associated with zero to many occurrences of social networking sites (i.e., a Many-to-Many relationship). The hypothesis space in such a situation may be very large.
Our proposed approach provides a method for exploring the two concepts of interest within a common conceptual and analytical framework (see section 3). To investigate the < < are associated with>> relation, it is crucial that we not only determine whether there exists any evidence for our classification by quadrants but also give an interpretation of the individuals' profiles. In the present study we explore the relation in one of its most difficult cases, that is, with no data on the < < are hosted on>> relation (Figure 2).
With the above conceptual considerations and the state of the art in mind, the following section introduces our methodological approach to characterizing the association between social networking site use and protest participation.
3. Materials and Methods
3.1. Methodological Approach
The proposed methodological approach is summarized by the flow diagram in Figure 3. The basic idea behind this approach is to use of multiple correspondence analysis (MCA) to construct synthetic quantitative variables that represent the individual in a two-dimensional plane. This will allow us to explore and identify profiles of protest participation and social media site use, segment the profiles according to their use of social media and their participation in protests, and finally, induce decision rules that help interpret patterns of association in each segment of individuals.
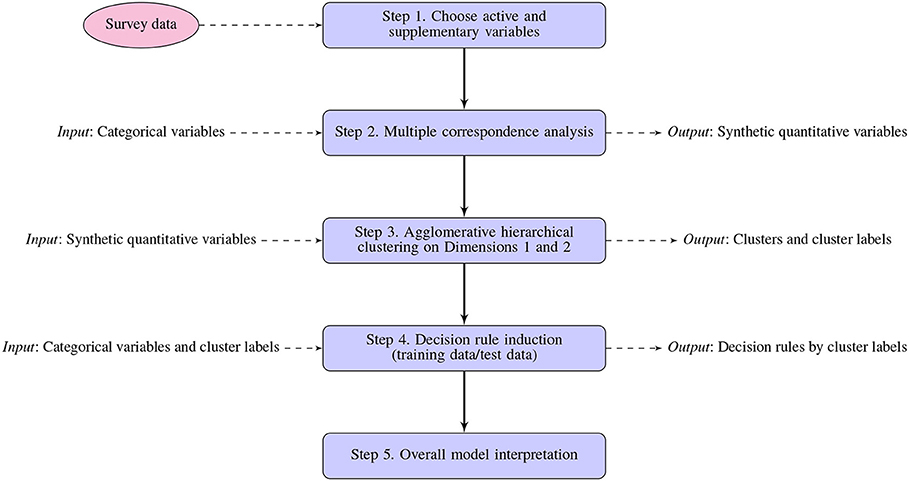
Figure 3. Steps in methodological approach for exploring the relationship between protest participation and social networking sites use.
In Step 1, a set of categorical variables for a sample of individuals representing different types of protest activity participation and the use of different social networking sites are chosen from the opinion survey data banks of Latinobarómetro3, a non-profit polling NGO based in Santiago, Chile. Step 2 explores these data using the techniques of MCA to transform the categorical variables into synthetic quantitative measures. Step 3 consists in an agglomerative hierarchical cluster analysis of the two aforementioned dimensions (denoted 1 and 2) based on the results of Step 2 to segment the profiles of the individuals as defined by the values of their categorical variables. Step 4 attempts to clarify the subjacent relationships between protest activity participation and social networking site use reflected in this segmentation. The membership labels of the clusters obtained in Step 3 are then used as class labels to train a decision rule classifier which induces a set of decision rules using the categorical variables as predictors. These decision rules are human-readable information representing the information contained in each cluster. Finally, Step 5 explores and interprets the results of the MCA, the hierarchical clustering on the principal dimensions, and the decision rule induction. As can be seen, the input and output of each step are incrementally incorporated to obtain a detailed exploration and interpretation of the data.
In the following subsections we describe each of the above five steps in detail.
3.2. Data and Coding
3.2.1. Participants
The total sample size was 19,050 individuals. The Latinobarómetro data were gathered by separate polling firms based in each target country. The 17 countries with their respective numbers of surveyed individuals were: Argentina (n = 1,200), Brazil (n = 1,250), Bolivia (n = 1,200), Chile (n = 1,200), Colombia (n = 1,200), Costa Rica (n = 1,000), Republic Dominican (n = 1,000), Ecuador (n = 1,200), El Salvador (n = 1,000), Guatemala (1,000), Honduras (n = 1,000), Nicaragua (n = 1,000), Panama (n = 1,000), Paraguay (n = 1,200), Peru (n = 1,200), Uruguay (n = 1,200), and Venezuela (n = 1,200). The survey questions in the various countries were identical, and to avoid misunderstandings that might lead to measurement errors the data were collected in face-to-face interviews conducted by natives of each country. The ages of the individuals surveyed were heterogeneous (min = 16, 1st quartile = 26, median = 38, mean = 40, 3rd quartile = 53, max = 98), the majority of them had cell phones (n =16,147), and some of them are single (n = 10,411), some are married (n = 6,341), and some are divorced (n = 2,241). The interviews were carried out between January 15 and February 15 of 2015. The margin of error (sampling error) for the different countries varied between ± 2.8 and ± 3.1 (CI 95%). Finally, the Latinobarómetro corporation ensures the confidentiality of responses and the anonymity of participants.
3.2.2. Variables
Using these survey data we defined 16 variables, of which 9 measure social media use, 5 measure protest activities, 1 represents Internet Experience and 1 indicates the country. This last variable is supplementary or illustrative; the other 15 are active variables for analyzing the individuals surveyed (see Table 1).
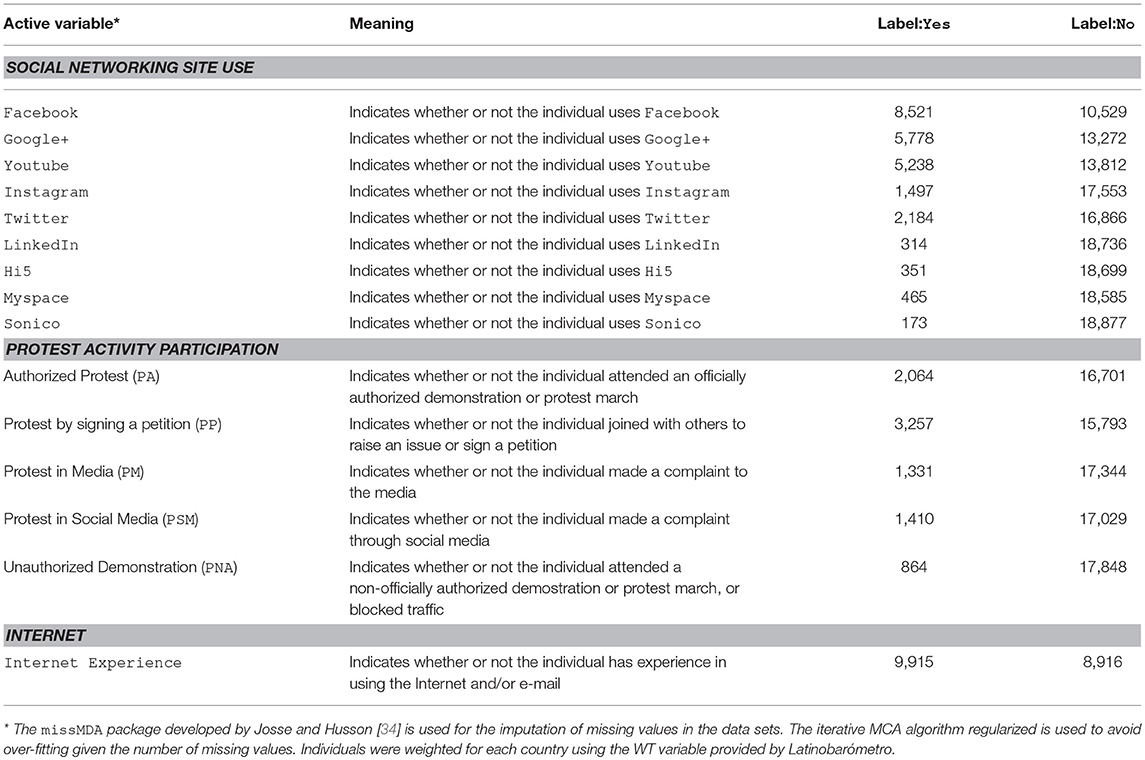
Table 1. Variables for exploring the association between social networking site use usage and protest participation (count).
A brief description the variables is given below.
• Social networking site use. For these variables, the question put to the interviewees was: “Do you use any of the following social networking services?,” at which point they were read a list of media that included Facebook, Google+, Youtube, Instagram, Twitter, LinkedIn, Hi5, Sonico and Myspace. In each case, the responses were coded as either “No” or “Yes” as appropriate.
• Protest activity participation. For these variables, the question put to the interviewees was: “I am going to read out a list of political activities that people can participate in and I would like you to tell me if you have taken part in any of them.” The list of activities included protests in the media (PM), protest by signing of a petition (PP), protest through social media (PSM), participating in an officially authorized protest activity (PA), participating in a non-officially authorized protest (PNA). In each case, the responses were coded as either “No” or “Yes” as appropriate.
• Internet experience. This variable measures whether individuals have experience using the Internet or e-mail. The question put to the interviewees was: “Have you ever used e-mail or connected to the Internet?” This formulation was chosen because empirical research has shown that asking about the frequency or time of Internet use does not obtain accurate responses (see for example, 35, 36). As with the variables described above, the responses were coded as either “No” or “Yes” as appropriate.
• Country. This supplementary qualitative variable records the country of residence of the survey respondent. This variable has not been used for the analysis. Instead it is only used in Figure 4 to illustrate the country-specific distribution of individuals.
As in all principal component analysis, as well as related methods (i.e., MCA), it is understood that the active variables are those that are used for the construction of the principal components or dimensions. In contrast, the supplementary variables “(…) do not participate in the construction of the dimensions (however, they may still be projected onto the dimensions in the same way as the other active elements). They are also referred to as illustrative elements, in reference to the way in which they are the most frequently used; that is to say, to enrich and illustrate dimension interpretation” [37, p. 85]. Finally, the number of categories per variable was balanced as suggested by Franco [38].
3.3. Supporting Techniques
In what follows, we introduce the three techniques used in the proposed methodology4.
3.3.1. Multiple Correspondence Analysis
Multiple correspondence analysis is “an exploratory data analysis method which allows to sum-up and to visualize a data table in which individuals are described by several categorical variables” [42, p. 91]. The technique is an extension of principal component analysis (PCA), whose origins go back to the work of [43], one of its precursors. In its current form, however, MCA was formalized by Benzécri [44, 45]. Currently, there are different schools that continue to develop this multidimensional exploratory analytic technique [38].
Survey questionnaires typically involve a large number of individuals or a large number of categorical variables that are to be explored. MCA is applied to tables in which the individuals are assigned to rows and the variables to columns. This is what makes the technique so well adapted for working with such surveys and studying the relationships between the survey variables. In particular, it is extremely useful for the following purposes [37, 38]:
• Summarize and visualize multidimensional categorical data
• Explore similarities between individuals and categories
• Represent data points in a low-dimensional Euclidean space (i.e., using MCA as a dimensionality reduction technique)
• Provide a summary representation of a large number of variables and/or cases in terms of a limited number of new concepts
Here, we have applied MCA mainly to create proxy measures for the concepts of social media and protest participation, using the variables described in section 3.2.2. For a complete description of MCA including a tutorial, the reader is referred to Husson and Josse [46] and Husson et al. [37]. Below we briefly review the fundamentals of the technique.
3.3.1.1. MCA and the Indicator Matrix
Consider a dataset composed of N individuals described by Q categorical variables. Each categorical variable qk can take Jk categorical values. Consequently, there are different possible attribute values. A special type of contingency matrix Z∈{0, 1}N×J known as the binary indicator matrix can be constructed where the rows denote the individuals and the columns are the possible variable attribute values (binary dummy variables). Every row zi; has exactly 1-elements in the columns corresponding to the attribute values that describe the individual. Since each individual is described by Q attributes, the rows in Z add up to Q. The sum of the column values Nj, therefore, gives the number of individuals to which the jth attribute value applies. The rows in Z form the cloud of individuals in the attribute space while the columns can be interpreted as the cloud of categories in the space of individuals.
3.3.1.2. MCA as a Dimensionality Reduction Technique
The fundamental idea of MCA as an extension to apply correspondence analysis (CA) on the indicator matrix Z to reduce the dimensionality of the clouds of individuals or categories identifying principal components (or dimensions) that best explain the data.
Correspondence analysis can be performed by the singular value decomposition (SVD) of the pseudo-residual matrix defined in Equation 1.
The diagonal matrix of column margins C is denoted by Dc. MCA can then be expressed as a weighted principal component analysis (PCA) by the singular value decomposition given in the following equation:
An important property of matrix is that the Euclidean distance between its rows and columns equals the χ2 distance of the row and columns of Z respectively, and thus, the SVD summarizes data points in the clouds of individuals or categories that are close to each other into principal dimensions. The diagonal matrix Λ of the singular values can be used to weight the components (or dimensions) of . Here U and V denote the respective left and right singular vectors of .
Consequently, the association of individuals with principal components (or dimensions) can be captured in matrix F (Equation 2) and the association of categories with components can be captured in matrix G (Equation 3).
3.3.1.3. Measuring the Reliability of Components
In psychometrics, Cronbach's α is used to measure the reliability of a scale. The general definition of this statistic for Q variables is given in Equation 4.
Here is the variance of the average score of the jth response item (variable) and is the variance of the observed total scores. In our case, we are interested in measuring the reliability of the dimensions generated by the MCA.
Cronbach's α can also be used to estimate the reliability of the MCA as described above. In Greenacre [47] it was shown that the sum of the components' variances equals the number of variables Q and the sum of variances of the total score (i.e., the column sum of the component matrix) is Q2λ, where λ is the largest singular value resulting from the SVD given in Equation 1.
Thus, the component reliability of an MCA solution can be defined as in the following Equation 5:
3.3.2. Agglomerative Hierarchical Clustering
For this technique, we use MCA as a pre-processing step to transform the variables measuring social networking site use and protest participation into variables that are numerical. At this point in the analysis the coordinates of the individuals in principal dimensions can be used as quantitative variables. To group the individuals we apply one of the approximations developed in Husson et al. [37], whose authors recommend that an MCA can be conducted before carrying out a segment analysis. For the latter, they suggest including the dimensions that account for the greatest amount of total variance and choosing dimensions that are interpretable.
We then perform an agglomerative hierarchical clustering with Ward's agglomerative criterion for tree construction [48], employing the usual Euclidian distance metric given that the dimensions obtained from the MCA can be interpreted using it even if the initial row space distance is a χ2 distance [37]. As will be explained in section 4.1.1, we chose Dimensions 1 and 2 given that they account for the greatest amount of variance and are the most interpretable and reliable.
To construct these two dimensions only the active variables were used to calculate the distances between individuals, leaving out the supplementary Country variable which will thus also be omitted from the subsequent cluster analyses. The number of partition clusters was chosen based on the dendrogram, the inertia gain between clusters by adding a cluster, and the interpretability of the clusters (i.e., retaining those subdivisions which can be successfully interpreted), as suggested in Husson et al. [37]. We used the value-test (V-test) to determine the contribution of the two dimensions to the formation of the clusters obtained. This statistic indicates whether the cluster mean is greater (positive values) or smaller (negative values) than the general mean. The differences between the values are considered to be significant when V-test>2, p-value < 0.05 [49, 50].
3.3.3. Decision Rule Induction
Deriving interpretable models is an important objective in the machine learning community. Determining which attributes enable an instance to be assigned to a given cluster is an essential step in arriving at a correct interpretation of the clusters, but it is not a trivial task.
To extract information on the cases in each cluster, we trained a decision rule classifier using the cluster analysis labels as classes to be predicted. The idea behind this heuristic was to induce decision rules with which to identify the variables and categorical values that would allow us to assign individuals to clusters. Inducing decision rules has the additional advantage of generating human-readable information on clusters, as has recently been done in a variety of applications (see 51, 52).
Thus, to extract semantically interpretable information from the clusters we used class labels to train a decision rule classifier that then induces a set of decision rules using the categorical variables as predictors. In this study, the variables are Internet Experience, Facebook, Google+, Youtube, Instagram, Twitter, LinkedIn, Hi5, SonicoMyspace, PM, PP, PSM, PA, and PNA.
The C5.0 is a classic algorithm for inducing decision trees and decision rules [53]. It is the successor to the C4.5 algorithm [54], which in turn succeeded the ID3 algorithm [55]. The division rule is a distinctive element in a decision tree that represents the mechanism by which the instances in a given group form the tree's nodes. The rule is used to choose the best partition for a predictor variable. The choice criterion is the maximization of a goodness-of-fit measure. In the case of the C5.0, the splitting criterion is the information gain. This measure takes into account the probability that an instance belongs to one of the classes. If, following [54], we let D be the set of instances, C be the number of classes and p(D, j) be the proportion of cases in D that belong to the jth class, then the uncertainty regarding the class D belongs to is expressed as
The information gain with C possible classes is then defined as
The information gain ratio expresses the ability of a predictor variable to discriminate between instances in any of the k possible classes in terms of information gained. It is influenced by the number of possible classes that an instance may belong to and especially by the partition of subset Di. Thus, all possible partitions of subset Di are executed and the one that maximizes information gain is chosen.
3.3.3.1. Decision Rule Model Validation and Performance Evaluation
For measuring the performance of the obtained model, we chose Cohen's kappa coefficient (κ) [56] because it can be used to measure the performance of a classifier in nominal classification problems with imbalanced classes. This statistic is given by
where p0 represents the actual observed agreement and pc represents chance agreement. As with correlation coefficients, κ can range from –1 to +1, where 0 represents the amount of agreement that can be expected from a completely random process, 1 represents perfect agreement. It is possible for the coefficient to be negative (i.e., there is no lower bound).
We evaluate the performance of the C5.0 algorithm using the 10-fold-cross-validation resampling technique and using different levels of boosting and with/without winnowing [53]. Additionally, in order to report decision rules with known confidence, we create a model without boosting. In this case, the database was randomly divided into a training sample (75%) and a test sample (25%).
4. Results
This section sets out the results of the proposed methodological approach separately for the three techniques, that is, MCA (section 4.1), agglomerative hierarchical clustering (section 4.2) and decision rule induction (section 4.3).
4.1. Multiple Correspondence Analysis Results
Below we present the main quantitative indicators of the two dimensions (section 4.1.1) and an interpretation of the dimensions, the individuals cloud and the categories cloud. We then explore in detail the active and supplementary variables to obtain a better appreciation of the MCA results (section 4.1.2).
4.1.1. Quantitative MCA Results
There are three reasons why a bidimensional solution was the most appropriate for our data. First, Dim 1 and Dim 2 combined already account for a significant 40% of the variation in the data. The explained variance and accumulated variance percentages for all 15 dimension are shown in Table 2. The eigenvalues result from the principal component analysis of the indicator matrix explained in section 3.3.1 (squared singular values computed in Equation 1 and are used to assess the importance (variance explained) of the different dimensions. The second reason is that the reliability measures for Dim 1 and Dim 2 as given by Cronbach's alpha are reasonable at α = 0.79 and α = 0.56, respectively. Although values for this indicator of less than 0.70 are generally held to be less than satisfactory, for exploratory research smaller values may be considered acceptable [57]. Also, Cronbach's α values decline with decreases in inertia [47]. Thus, the remaining dimensions (Dim 3 to Dim 15) have values of less than 0.56. Finally, the third reason has to do with our belief that the results of the analysis should be interpretable. Although a general rule on the number of dimensions that should be explored has not been settled, some authors recommend a bidimensional solution on the grounds that it facilitates interpretation of the data [58, 59]. In MCA, the percentage of inertia is calculated in the same way as for any principal component method [37, p 17–18].
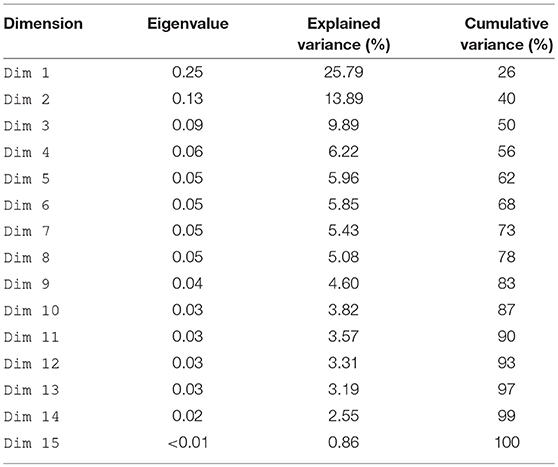
Table 2. Eigenvalues and percentages of explained and cumulative variance.
We next explore, in Table 3, whether there is a statistically significant association between the active variables and the two dimensions5. The results in the p-value column indicate that the active variables are statistically significant. The values themselves are extremely small, however, because the sample size is large [60]. The results in the R2 column show that Dim 1 is correlated mainly with the variables Internet Experience, Facebook, Youtube, Google+, Twitter, Instagram, PSM, Myspace and Hi5 (i.e., variables with R2 ≥ 0.1). Table 3 also shows the correlation of the variables with dimension Dim 2. It can be seen that Dim 2 is principally correlated with the variables PM, PA, PNA, PP and PSM (see variables with R2 ≥ 0.2). It can be observed that Dim 2 has a weaker correlation with the variables that measure the use of social networking sites. Therefore, Dim 1 can be interpreted as a proxy measure of the concept of social networking site use, and Dim 2 as a proxy measure of the concept of participation in protest activities.
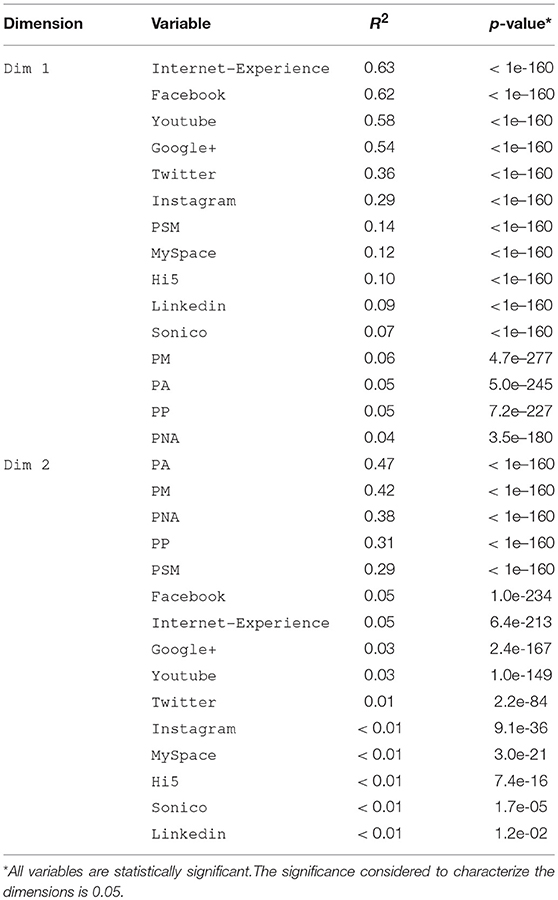
Table 3. Significance and correlation of variables by principal dimension.
4.1.2. Interpretation of MCA results
4.1.2.1. Interpretation of Dimensions, Individuals Cloud and Categories Cloud
We begin our interpretation of the MCA results by exploring the individuals clouds and the categories clouds using the first two dimensions in Figure 4 (the round points in magenta are the individuals' profiles while the blue triangles are the categories).
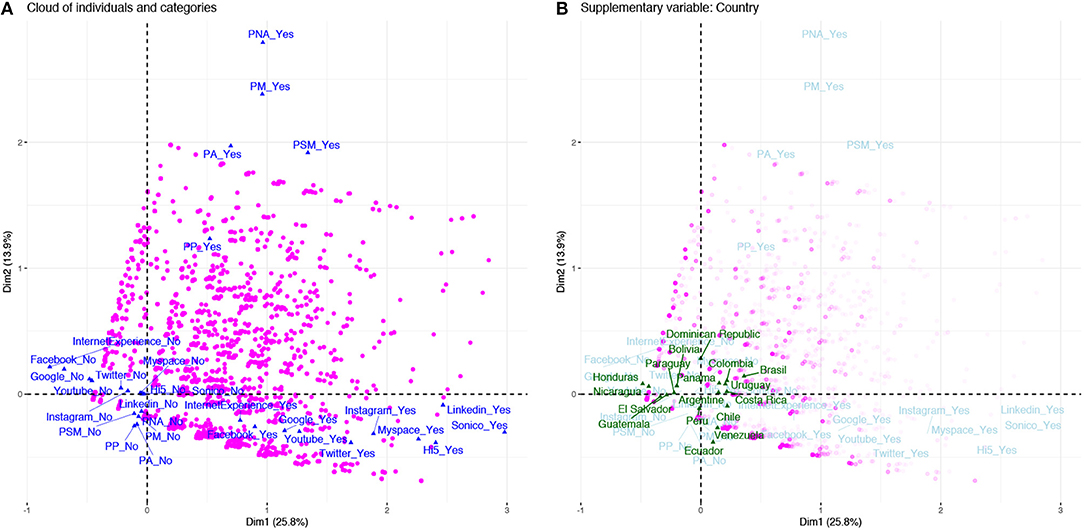
Figure 4. Representation of individuals according active and supplementary variables (n = 19,050 individuals). (A) Two-dimensional protection of individual cloud (magenta) and categories cloud (blue); (B) Superimposed representation of supplementary variable Country (green).
As can be seen in Figure 4A, the individuals' profiles are distributed across the four quadrants (Quadrant 1: Dim 1> 0, Dim 2> 0; Quadrant 2: Dim 1 < 0, Dim 2> 0; Quadrant 3: Dim 1 < 0, Dim 2 < 0; Quadrant 4: Dim 1> 0, Dim 2 < 0). In Quadrant 1, where we expect to find individuals who use social networking sites and participate in protests (see Q1 in Figure 1), the profiles are highly varied. In Quadrant 3, by contrast, there is much less variety of profiles, indicating that the individuals neither use the sites nor take part in protests. Finally, in Quadrants 2 and 4 the variation is greater than in Quadrant 3. These observations together suggest that the dimensions are discriminating between the profiles by locating them in different quadrants.
In addition, the categories of the active variables (see blue triangles in Figure 4A) and the categories of the supplementary variable Country (see green triangles in Figure 4B) are located at the barycenter of the individuals with those categories and they represent an average individual [37, 46]. The categories cloud projection shows that Dim 1 and 2 are quantifying different concepts (see again Figure 4A). As can be observed, the categorical values in Quadrant 4 (i.e., Facebook = Yes, Google+ = Yes, Youtube = Yes, Instagram = Yes, Twitter = Yes, LinkedIn = Yes, Hi5 = Yes, Myspace = Yes, Sonico = Yes, Internet Experience, Sonico = Yes) are the opposite of those in Quadrant 2 (i.e., Facebook = No, Google+ = No, Youtube = No, Instagram = No, Twitter = No, LinkedIn = No, Hi5 = No, Myspace = No, Sonico = No, Internet Experience = No, Sonico = No). Also, the categories in Quadrant 1 (i. e., PA = Yes, PP = Yes, PM = Yes, PSM = Yes, PNA = Yes) are the opposite of those in Quadrant 3 (i.e., PA = No, PP = No, PM = No, PSM = No, PNA = No). Thus, the two dimensions are grouping categories with similar values in different quadrants, indicating that they are measuring different concepts.
The last element to explore is the supplementary variable Country. In Figure 4B it is apparent that individuals with positive Dim 1 values use a wider variety of social networking sites than those with negative Dim 1 values. Also, individuals with positive Dim 2 values participate in a broader range of protest activities than those with negative values in that dimension. When projecting the supplementary variable Country in the cloud of individuals, we can see that country labels are located very close to the origin (i.e., the center of gravity), which illustrates that there may be a weak dependence on the use of social networking sites and on participation in protest activities as a result of residing in a specific country.
4.1.2.2. Additional Exploratory Results
To further develop our interpretation of the data, in the following steps we explore visually the individuals cloud and the categories cloud. For this purpose, the individuals were represented on a series of graphs in different colors depending on their category label. The first graph we examine shows whether or not an individual uses social networking sites while the next four indicate whether or not he or she participated in the various types of protest activity.
On the social networking site graphs in Figure 5, a separate cloud for each site shows individuals who used it in magenta and those who did not in blue. As can be seen, Facebook, Google+ and Youtube were the sites most heavily used whereas Sonico and Hi5, both oriented toward a Latin American public, were the ones used the least. Note also that Dim 1 helps to separate the individuals, those who use the sites being found mainly in Quadrants 1 and 4 (positive Dim 1 values) while those who do not are found largely in Quadrants 2 and 3 (negative Dim 1 values).
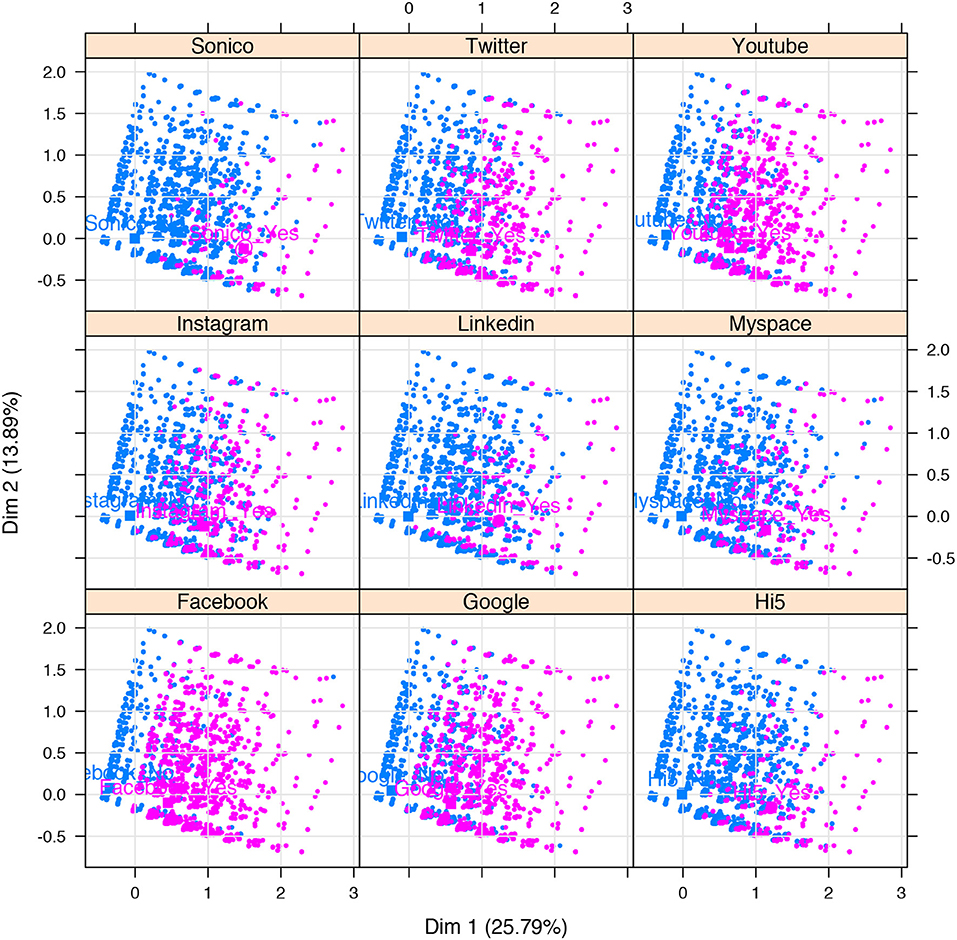
Figure 5. Individuals by social networking site use (n = 19,050 individuals). The cloud for each site shows individuals who used it in magenta and those who did not in blue.
On the protest participation graphs in Figures 6A–E, the individuals clouds for the various protest activities show those who participated in magenta and those who did not in blue. The figures are enlarged to show the different participation profiles in greater detail. As can be seen, most of the individuals participating in these activities had positive Dim 2 values (Quadrants 1 and 2) while those not participating had negative Dim 2 values (Quadrants 3 and 4).
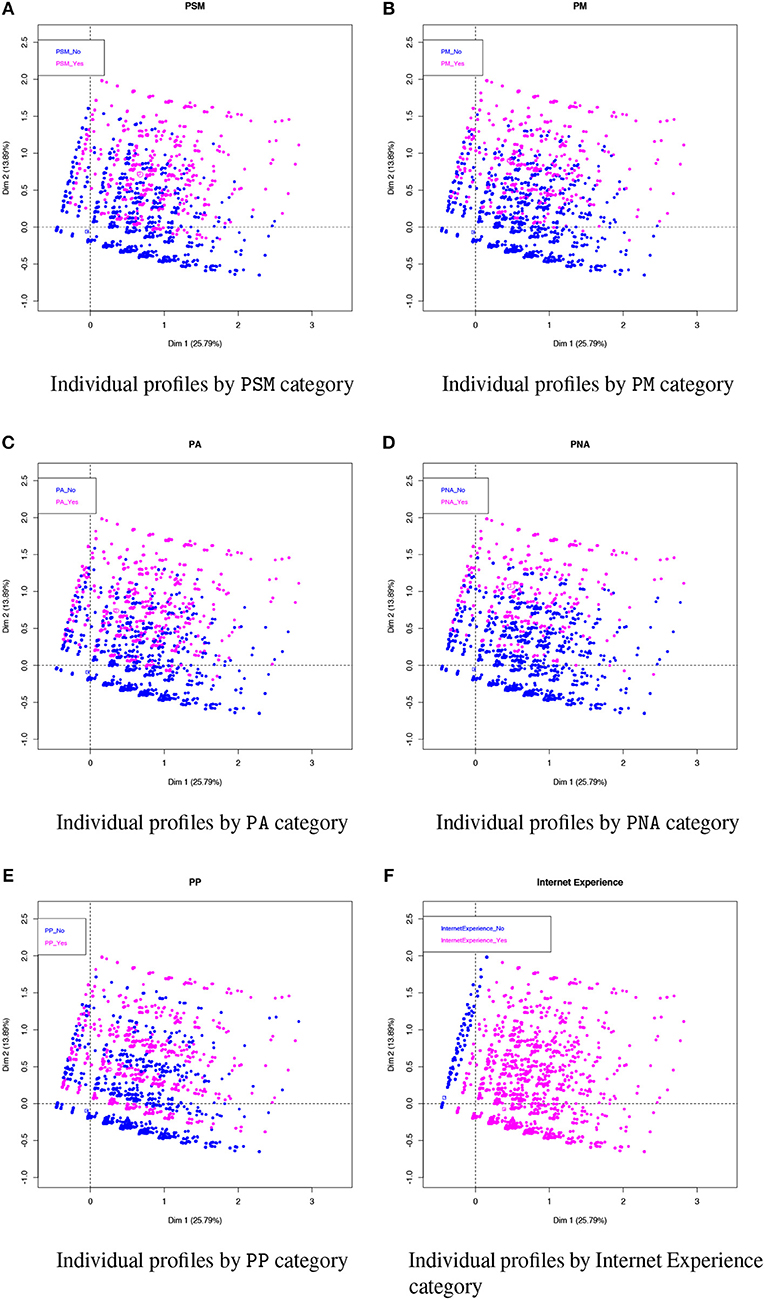
Figure 6. Representation of individuals according to their participation in protest activities (i.e., (A) PSM, (B) PM, (C) PA, (D) PNA, and (E) PP) and (F) Internet Experience (n = 19,050 individuals).
The graph in Figure 6F is the cloud showing whether or not the individuals had any experience using the Internet and/or e-mail. Along the left-hand-side of the cloud is a narrow strip of blue points indicating no such experience, almost all of them with negative Dim 1 values (Quadrant 2). The magenta points represent individuals who did have Internet and/or e-mail experience. Interestingly, this pattern is visually similar to the one in Figure 5. In other words, when there are individuals without Internet and/or e-mail experience, there may also be individuals who do not use social networking sites (see also Facebook, Google+, Youtube in Figure 5) or participate in social media protests (PSM) (see Figure 6A). But this pattern also suggests that there are profiles of individuals involved in offline protest activities.
4.2. Agglomerative Hierarchical Clustering Results
The main quantitative indicators of the cluster analysis are presented below (section 4.2.1), followed by an interpretation of the clusters (section 4.2.2).
4.2.1. Quantitative Clustering Results
An alpha level of 0.05 was used for all statistical tests. A cluster analysis of the MCA object scores was carried out to identify groups of individuals that shared similar response patterns.
The results of the analysis are presented in Figure 7 and Table 4. The dendrogram in Figure 7 suggests that the individuals may be separated into five groups. The p-value test results in Table 4 show that the two dimensions are statistically significant and the V-test indicates that in both cases the dimension values for each cluster are significantly different from the global mean (Dim 1 overall mean = 0.0173, overall SD = 0.53, Dim 2 overall mean = 0.0022, overall SD = 0.38) (Recall that positive V-test values indicate dimension values greater than the mean, while negative values indicate the opposite).
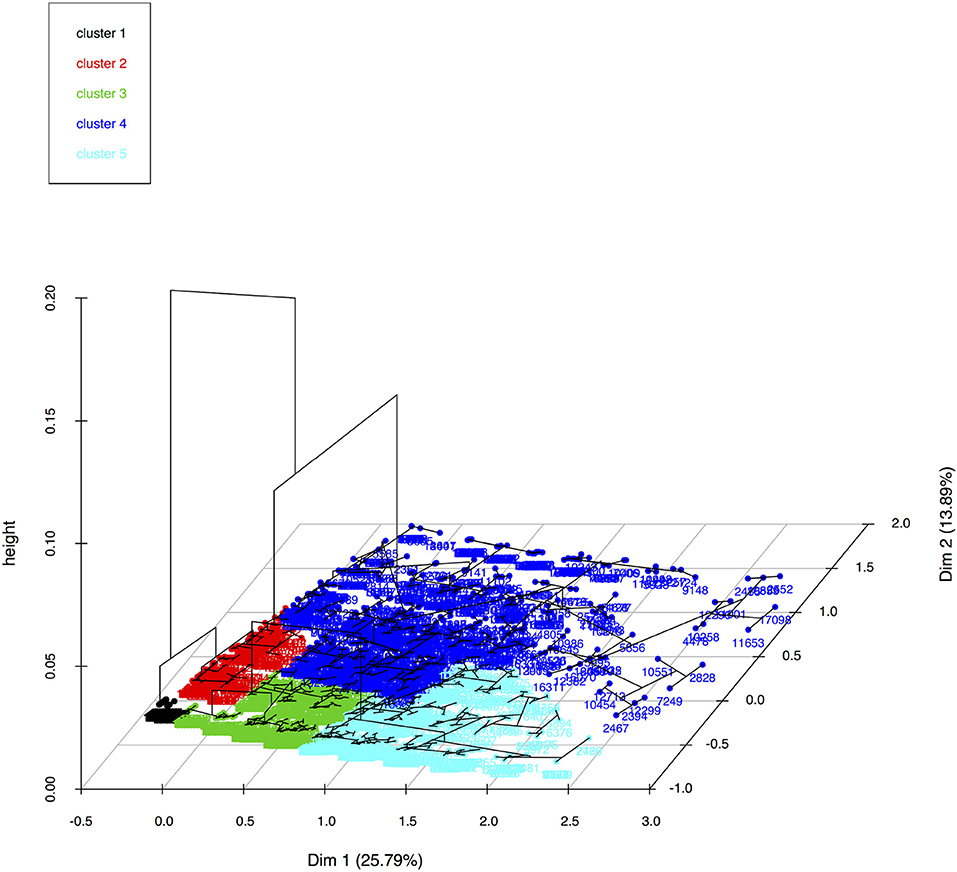
Figure 7. Agglomerative hierarchical clustering solution obtained by applying Ward's method and by using the Euclidean distance (n = 19,050 individuals). Each dot represents an individual's response pattern and the numerical id of each individual is included in the plot. Note that dots may overlap when one or more individuals have the same response pattern. Clustering variables: object scores of the MCA dimensions 1 and 2).
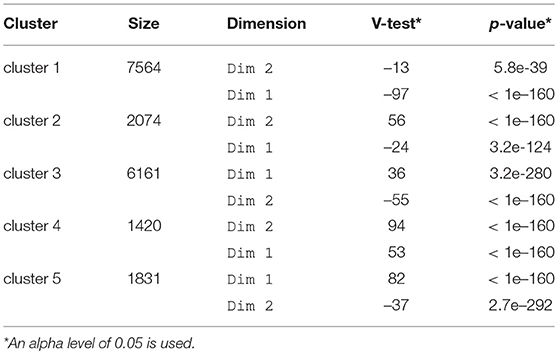
Table 4. Results of the hierarchical clustering on principal dimensions.
4.2.2. Interpretation of Clusters
The clusters are represented in three dimensions in Figure 7. For each cluster, the Dim 1 and Dim 2 means and standard deviations together with a raw interpretation are given in Table 5. Also indicated in the table is the quadrant in which the pair of values is found, a broad approximation of the location of the segment of individuals in two-dimensional space. The signs and average values of these results approximate fairly well the expectation originally expressed above in section 2 of finding four segments, one in each of the four quadrants of Figure 1.
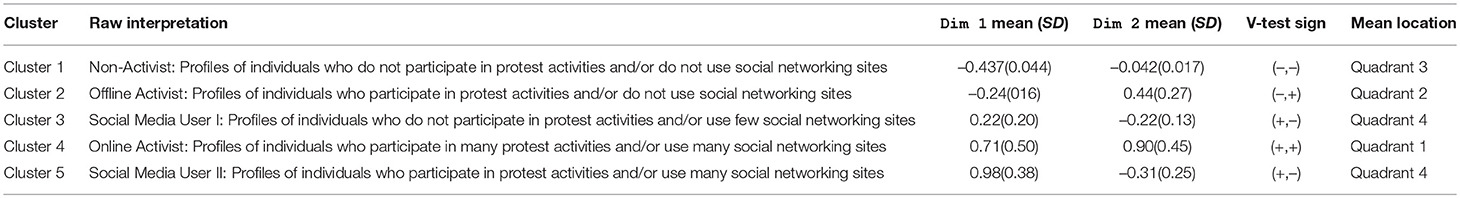
Table 5. Cluster interpretation.
Cluster 1 (Non-Activist) has negative mean values for Dim 1 and Dim 2 and the lowest standard deviation values of the five clusters. Cluster 2 accurately represents individuals who do not take part in online protests (Offline Activist). Cluster 4 (Online Activist) has positive mean values for the two dimensions and individual profiles with the highest standard deviations, an indicator of heterogeneity. Clusters 3 and 5 have mean values with the same sign, which could be interpreted as indicating profiles of individuals expected to be found in Quadrant 4 (see Figure 1). However, this group of individuals can be subdivided into two clusters: Social Media User I, containing those who use few social networking sites, and Social Media User II, containing those who use various of them. Finally, Table 4 gives the sign of the V-test value, which is used to triangulate the interpretation of the cluster solution.
4.3. Decision Rule Induction Results
In this Subsection we present the results of the decision rule classification (section 4.3.1) and then interpret the most important of the decision rules obtained (section 4.3.2).
4.3.1. Quantitative Decision Rule Results
To evaluate the performance of the C5.0 classifier we compared its performance using decision trees and decision rules. To measure C5.0 performance, the Cohen's kappa coefficient (κ) was used because it is more suitable for assessing performance in databases with unbalanced classes. To obtain stable performance estimators, we used the 10-fold cross validation resampling technique [61]. We evaluate the performance of the classifier using different levels of boosting and with/without winnowing [53].
The results of the classification suggest that the decision rules were able to reconstruct the information that characterizes the clusters. The performance of C5.0 is summarized in Figure 8. As can be seen, the C5.0 algorithm performed very well (performance from κ = 0.98 to κ = 0.99). It can be seen that the use or non-use of boosting or winnowing does not seem to dramatically affect the performance of C5.0 in our database.
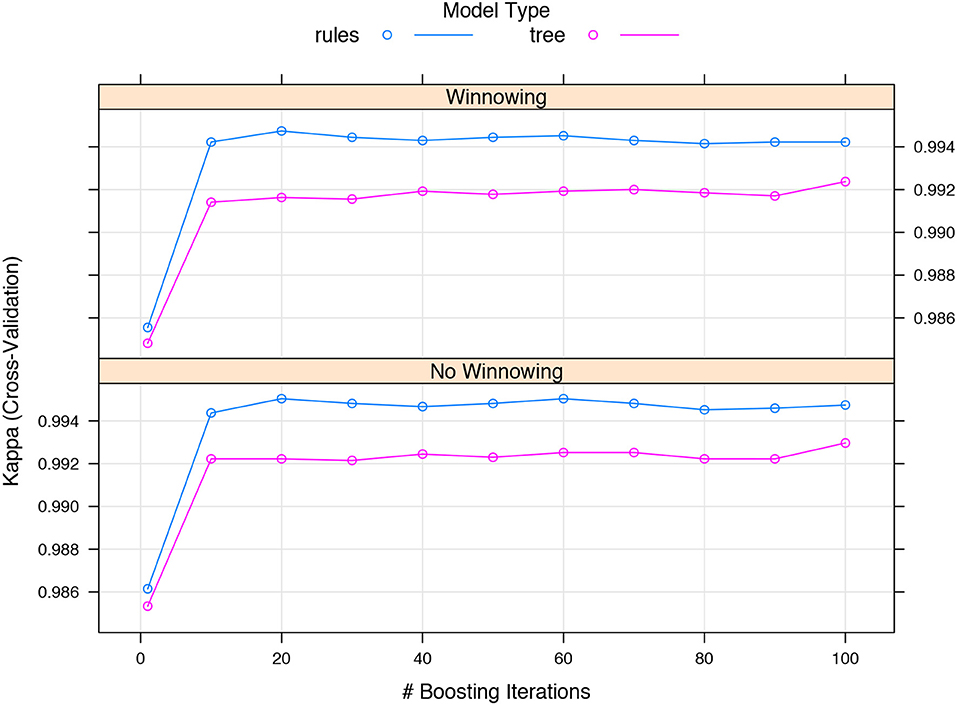
Figure 8. Performance evaluation of C5.0 algorithm using 10-fold cross validation.
4.3.2. Interpretation of Decision Rules
In order to report a single decision rule model with known confidence per obtained rule, we trained a decision rule model without using the boosting function [53]. In this case, the database was randomly divided into a training sample (75%) and a test sample (25%). We observe that with the training data only 1.5% of the cases (211 of 14,288) were classified incorrectly and with the test data the figure was still only 1.7% (80 of 4,762 cases). In addition, the Cohen's κ statistic shows that the C50 algorithm performed very well with both datasets (training data: κ = 0.97, SE of κ = 0.001, 95% confidence interval = 0.976–0.982; test data: κ = 0.97, SE of κ = 0.003, 95% confidence interval = 0.971–0.981). As a result, a total of 68 decision rules were induced (see Table S1). The conjunction of variables and their attribute values in a decision rule is called an “antecedent rule” (the “IF” part) and each class label to be predicted is called a “consequent rule” (the “THEN” part).
A selection of the rules classifying the individuals in Cluster 4 (Online Activist) is set out in Table 6. They include all of the rules with attribute value “PSM = Yes.” It can be seen that the use of Facebook, Youtube, or Google+ is positively associated with participation in different types of protest activities. The interpretation indicated by these rules is that the individuals in this cluster are heterogeneous, a conclusion visually supported by the cloud of individuals (see Figure 4A), the Dim 1 and 2 standard deviations for the cluster (see Table 5) and the fact that 23 decision rules were needed to characterize the Online Activists. Based on these observations we can conjecture that it is the heterogeneity of the profiles that has made it difficult for researchers to demonstrate the positive relationship between social networking site usage and participation in civic protest activities.
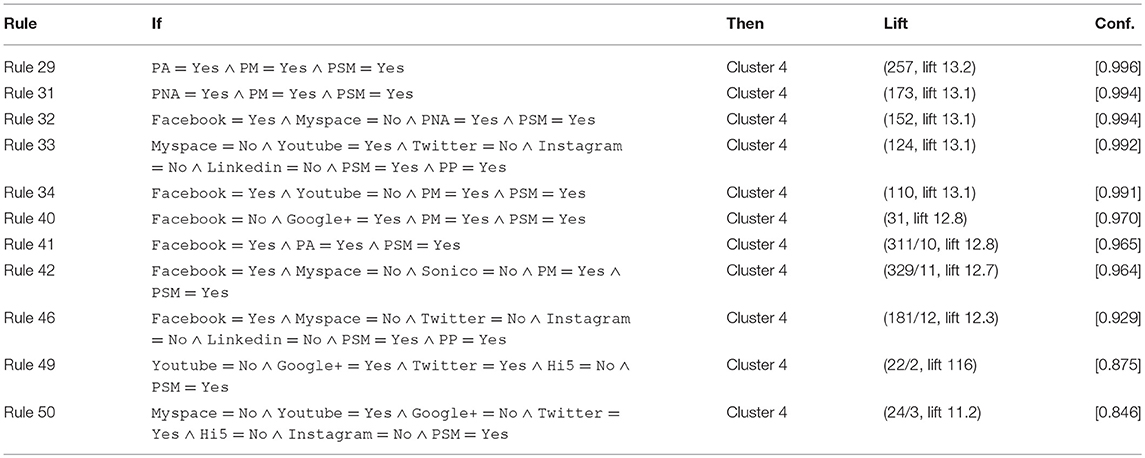
Table 6. Decision rules including attribute value “PSM = Yes” for classifying individuals in the Online Activist cluster.
Decision rules also allow us to explore the other clusters (see Table S1). For example, not using Facebook is characteristic of individuals who are part of Cluster 1 (Non-Activist) (Rule 1, If Facebook = No, Then: cluster 1). Not participating in non-officially authorized protests, not protesting using social networking sites, and not having experience using the Internet, but joining with others to sign a petition is characteristic of some individuals who are part of Cluster 2 (Offline-Activist) (Rule 2, If PNA = No ∧ PSM = No ∧ PP = Yes ∧ Internet Experience = No, Then: Cluster 2). Individuals who use Facebook and Google (but not other social networking sites) and individuals who do not participate in protest activities are part of Cluster 3 (Social Media User I) (Rule 16, Facebook = Yes ∧ Myspace = No ∧ Google+ = Yes ∧ Twitter = No ∧ Hi5 = No ∧ Instagram = No ∧ Sonico = No ∧ Linkedin = No ∧ PA = No ∧ PM = No ∧ PSM = No ∧ PP = No, Then: cluster 3). Finally, individuals who use Google+ and Twitter but do not participate in protest activities are part of Cluster 5 (Social Media User II) (Rule 52, If Google+ = Yes ∧ Twitter = Yes ∧ Instagram = Yes ∧ PA = No ∧ PM = No, Then: Cluster 5). In this manner, decision rules provide us with interpretable information on the groups of individuals previously identified in section 4.2.2.
5. Discussion
This article has proposed an exploratory methodological approach for deriving interpretable information on the relationship between participation in protest activities and social networking site use. The experimental results of the approach allow us to conclude that it is useful in exploring profiles of individuals, segments of individuals and the rules characterizing the segments. But beyond this general conclusion, the results raise a number of important questions that will be discussed below.
5.1. Overall Model Evaluation
In this subsection we broaden our discussion of the proposed method. To explore the relationship between social media use and protest participation, we introduced a conceptual analytical framework to orient the interpretation of the results. We posited that there existed a many-to-many relationship (see Figure 2) between the two concepts, thus making examination of the relationship a complex problem to address both analytically and empirically.
To tackle the problem, our proposed approach embraces a variety of analytical techniques. We began with the idea that if we could generate proxy measures for the two concepts we could then explore the main segments of individuals and extract human-readable information that would allow us to interpret those segments.
The first step was to apply MCA to the information, which gave us a projection of the data by identifying the greatest amount of total variance in them. MCA thus enabled us to create the two proxy measures (section 2), extract the main characteristics of the data and project them in a low-dimensional space.
The next step was to use the coordinates of each individual in dimensions 1 and 2 to explore the grouping of the individuals. Five clusters of individuals were identified that were relatively easy to interpret, as reported in Table 5, and the results were similar to those presented conceptually in Figure 1.
The third step was to introduce the decision rules for extracting information whose variables allowed us to assign an instance to a given cluster. With this technique, we were able to induce a small number of rules that would be semantically interpretable for someone with previous knowledge of first-order logic.
Based on these decision rules we may make the following general observations: (a) protest through social media (PSM) is an activity that can be associated with protests in other settings, that is, outside social media; (b) social networking sites aimed at a Latin American audience (i.e., Hi5 and Sonico), do not seem to play an important role in protest participation; (c) off-line protest still appears to involve a significant group of individuals; and (d) having experience with the Internet/e-mail is associated with both social media use and social media protest.
In general terms, the results obtained may be considered as a heuristic, that is, a non-optimal but nevertheless informative solution for exploring the relationship between the two concepts of interest. Briefly put, our heuristic approach allowed us to create concepts that encompass the principal information from a survey database, explore the emergence of segments and interpret them with a small number of decision rules. The results thus permit us to conclude that there exists a rich interaction between social media and protest participation.
5.2. Comparison with Related Approaches
In a previous study, Harlow and Harp [62] found that Latin American activists were less likely to be activists in online environments compared to a sample of U.S. activists. Our results show that the Online Activist cluster is indeed relatively small, as well as being heterogeneous in that there are various ways of being part of this group. In this sense, the findings reported here provide a greater level of detail for further exploration of the relationship between protest participation (online and offline) and social networking site use.
Another study of protest patterns in Latin America [63] segmented a sample of individuals into two clusters based on whether their protest tactics were moderate or radical. However, this classification did not consider information on the use of social networking sites. The methodological approach proposed here has the advantage of including both the protest participation and social media use concepts in a common framework of analysis.
Finally, a study measuring different individual protest activities [64] used information on individuals' involvement in various types of organizations and their participation in demonstrations, strikes, petitions, boycotts and occupations of buildings. Unlike the present study, however, the authors did not include online protest activities nor did they consider the role played in protests by social networking sites.
We conclude from these comparisons that the approach proposed here may constitute an easily implementable alternative for exploring the association between protest activity participation and social networking site use.
5.3. Limitations
Three main limitations of our proposed approach are set out in what follows.
5.3.0.1. Accuracy of Self-Reported Measures
More and more studies reveal that survey data may be biased. One investigation providing strong evidence for this phenomenon is Scharkow et al. [35], which found that “self-reports for specific content such as social networking sites or video platforms seem to be more accurate and less consistently biased than self-reports of generic frequency or duration of Internet use” (p. 13). In the present case, we are unable to say whether there are significant differences between actual social media use and the use levels reported in our data. A possible way of determining the quality of the measurements would be to conduct a study combining behavioral data from the surveys with social media site logs (for example, using apps such as Facebook API) or carrying out a controlled laboratory observation experiment, perhaps combined with a thinking-aloud procedure [65]. Finally, as in many machine learning techniques, the C5.0 algorithm does not provide a direct indication of the likelihood of accurate predictions for a given sample of cases (for an introductory discussion of this technical aspect, see [66]).
5.3.0.2. Total Variance Explained
The use of dimensions Dim 1 and Dim 2 enabled us to explain 40% of the total variance (Table 2). This figure could be improved by utilizing more dimensions, but as we noted in section 4.1.1, this would mean sacrificing both interpretability and reliability. In future research, the results could be explored using joint correspondence analysis, which has been shown to have certain advantages over traditional MCA (see for example, [67, 68). The explained variance percentages we obtained may well be due to the choice of analytical approximation.
5.3.0.3. Causal Mechanisms
Although our results generated useful information for further exploration into the relationship between protest participation and social networking site use, identifying the causal mechanism behind the relationship (that is, the direction of causation) will require the incorporation of additional variables within an appropriate analytical framework. This is particularly the case in the light of reports in other studies that participation in political activities is explained best by direct connections with public political actors followed by exposure to shared political information [69], that alternative media usage leads to protest participation and support for unconventional protest tactics [70], and that personality traits are predictors of social media use [71].
5.4. Extension and Future Research
The present article has employed traditional analytical techniques to demonstrate the proposed methodological approach, but future work could utilize more advanced methods. The approach could be readily modified for a study incorporating quantitative variables or a mix of quantitative and qualitative ones. With quantitative variables on social media use and protest participation, classic principal components analysis (PCA, [72]) could be applied instead of MCA. If both quantitative and qualitative variables are included, another alternative would be to use multiple factor analysis (MFA, [73]). Since the data for the various countries were aggregated here to obtain the widest possible range of individual response profiles, a future study could be conducted on a country-by-country basis to determine local patterns in each one. Additionally, applying different clustering algorithms would likely create different clusters which could then be used in a comparative analysis.
6. Conclusion
The present study has pointed to the existence of a relationship between the use of social networking sites and participation in civic protests. However, proving that this relationship exists is difficult given that the number of people involved in both activities is small and heterogeneous, as this investigation has also demonstrated. The results of our exploratory work have led us to the further conclusion that the use of classical multivariate analysis and automatic machine learning techniques can contribute to the exploration of the association between the two general concepts. It is hoped that the conceptual analytic framework and the exploratory methodological approach developed for this investigation will contribute to ongoing research into the relationship between social media use and engaging in protest activities in Latin America.
Author Contributions
VM designed the conceptual and methodological approach and conducted the empirical tests. VM, TH, and HH studied the research domain (social networking sites). VM drafted the paper. HH and TH provided revisions. All authors read and approved the final manuscript.
Conflict of Interest Statement
The authors declare that the research was conducted in the absence of any commercial or financial relationships that could be construed as a potential conflict of interest.
The handling editor and reviewer MD declared their involvement as co-editors in the Research Topic, and confirm the absence of any other collaboration.
Acknowledgments
This work was supported by the Deutsche Forschungsgemeinschaft (DFG) through Grant No. GRK 2167, Research Training Group User-Centred Social Media.
Supplementary Material
The Supplementary Material for this article can be found online at: https://www.frontiersin.org/articles/10.3389/fams.2018.00056/full#supplementary-material
Footnotes
1. ^ Some novel approaches for exploring cross-media social media data can be found in Amato et al. [13], Hecking et al. [14, 15], and Farahbakhsh et al. [16].
2. ^ On the technique of conceptual modeling, see [33].
3. ^ The Latinobarómetro database is described and can be downloaded, subject to acceptance of terms of use at http://www.latinobarometro.org/
4. ^ We use the following statistical packages: FactomineR [39], C50 [40] and Factoextra [41].
5. ^ The Factominer function dimdesc() [50, p. 237] was used to explore which variables are correlated to Dim 1 and Dim 2.
References
1. Clement M. A People's History of Riots, Protest and the Law. Basingstoke: Palgrave Macmillan (2016).
2. Garrett RK. Protest in an information society: a review of literature on social movements and new ICTs. Inform Commun Soc. (2006) 9:202–24.
3. Guzman-Concha C. The students' rebellion in Chile: occupy protest or classic social movement? Soc Mov Stud. (2012) 11:408–15.
4. Pérez-Liñán A, Polga-Hecimovich J. Explaining military coups and impeachments in Latin America. Democratization (2016) 24:839–58. doi: 10.1080/13510347.2016.1251905
5. Anselmi M. Post-populism in Latin America: on Venezuela after Chávez. Chin Polit Sci Rev. (2017) 2:410–26. doi: 10.1007/s41111-017-0066-y
6. Valenzuela S. Unpacking the use of social media for protest behavior: the roles of information, opinion expression, and activism. Am Behav Sci. (2013) 57:920–42. doi: 10.1177/0002764213479375
7. Harlow S. Social media and social movements: facebook and an online Guatemalan justice movement that moved offline. N Media Soc. (2011) 14:225–43. doi: 10.1177/1461444811410408
8. Kruikemeier S, Shehata A. News media use and political engagement among adolescents: an analysis of virtuous circles using panel data. Polit Communic. (2016) 34:221–42. doi: 10.1080/10584609.2016.1174760
9. Baym NK. Personal Connections in the Digital Age. Digital Media and Society. Wiley (2015). Available online at: https://books.google.de/books?id=4_1RCgAAQBAJ
10. Skoric MM, Poor ND, Liao Y, Tang SWH. Online organization of an offline protest: from social to traditional media and back. In: 2011 44th Hawaii International Conference on System Sciences. (IEEE) (2011).
11. Steinert-Threlkeld ZC, Mocanu D, Vespignani A, Fowler J. Online social networks and offline protest. EPJ Data Sc. (2015) 4:19. doi: 10.1140/epjds/s13688-015-0056-y
12. Walgrave S, Wouters R, Ketelaars P. Response problems in the protest surve design: evidence from fifty-one protest events in seven countries. Mobilization (2016) 21:83–104. doi: 10.17813/1086/671x-21-1-83
13. Amato F, Castiglione A, Moscato V, Picariello A, Sperlì G. Multimedia summarization using social media content. Multimedia Tools Applic. (2018) 77:17803–27. doi: 10.1007/s11042-017-5556-2
14. Hecking T, Steinert L, Masias VH, Hoppe HU. Relational patterns in cross-media information diffusion networks. In: Complex Networks & Their Applications VI: Proceedings of Complex Networks 2017 (The Sixth International Conference on Complex Networks and Their Applications). Cham: Springer International Publishing (2017). pp. 1002–14.
15. Hecking T, Steinert L, Leßmann S, Masias VH, Hoppe HU. Identifying accelerators of information diffusion across social media channels. In: 4th European Network Intelligence Conference. Duisburg (2017). pp. 11–2.
16. Farahbakhsh R, Cuevas Á, Crespi N. Characterization of cross-posting activity for professional users across Facebook, Twitter and Google+. Soc Netw Anal Min. (2016) 6:1–14. doi: 10.1007/s13278-016-0336-y
17. Henderson M, Johnson NF, Auld G. Silences of ethical practice: dilemmas for researchers using social media. Educ Res Eval. (2013) 19:546–60. doi: 10.1080/13803611.2013.805656
18. Kaslow FW, Patterson T, Gottlieb M. Ethical dilemmas in psychologists accessing internet data: is it justified? Professional Psychol. (2011) 42:105–12. doi: 10.1037/Fa0022002
19. Enjolras B, Steen-Johnsen K, Wollebæk D. Social media and mobilization to offline demonstrations: transcending participatory divides? New Media Soc. (2012) 15:890–908. doi: 10.1177/1461444812462844
20. Dimitrova DV, Shehata A, Strömbäck J, Nord LW. The effects of digital media on political knowledge and participation in election campaigns. Commun Res. (2011) 41:95–118. doi: 10.1177/0093650211426004
21. Hyun KD, Kim J. Differential and interactive influences on political participation by different types of news activities and political conversation through social media. Comput Hum Behavior. (2015) 45:328–34. doi: 10.1016/j.chb.2014.12.031
22. Holt K, Shehata A, Strömbäck J, Ljungberg E. Age and the effects of news media attention and social media use on political interest and participation: do social media function as leveller? Eur J Commun. (2013) 28:19–34. doi: 10.1177/0267323112465369
23. Skoric MM, Zhu Q, Goh D, Pang N. Social media and citizen engagement: a meta-analytic review. N Media Soc. (2016) 18:1817–39. doi: 10.1177/1461444815616221
24. Boulianne S. Social media use and participation: a meta-analysis of current research. Inform Commun Soc. (2015) 18:524–38. doi: 10.1080/1369118x.2015.1008542
25. Boulianne S. Revolution in the making? social media effects across the globe. Inform Commun Soc. (2017) 22:39–54. doi: 10.1080/1369118x.2017.1353641
26. Skoric MM, Zhu Q, Pang N. Social media, political expression, and participation in confucian Asia. Chin J Commun. (2016) 9:331–47. doi: 10.1080/17544750.2016.1143378
27. Opp KD. Theories of Political Protest and Social Movements: A Multidisciplinary Introduction, Critique, and Synthesis. Routledge (2009).
28. Biggs M. Has protest increased since the 1970s? how a survey question can construct a spurious trend. Br J Sociol. (2014) 66:141–62. doi: 10.1111/1468-4446.12099
29. Hargittai E. Whose space? Differences among users and non-users of social network sites. J Comput. Mediat. Commun. (2007) 13:276–97. doi: 10.1111/j.1083-6101.2007.00396.x
30. Waheed H, Anjum M, Rehman M, Khawaja A. Investigation of user behavior on social networking sites. PLoS ONE (2017) 12:1–19. doi: 10.1371/journal.pone.0169693
31. Lipsky M. Protest as a political resource. Am Polit Sci Rev. (1968) 62:1144–58. doi: 10.2307/1953909
32. Boyd D, Ellison N. Social network sites: definition, history, and scholarship. J Comput Med Commun. (2007) 13:210–30. doi: 10.1111/j.1083-6101.2007.00393.x
34. Josse J, Husson F. missMDA: a package for handling missing values in multivariate data analysis. J Statist Softw. (2016) 70. doi: 10.18637/jss.v070.i01
35. Scharkow M. The accuracy of self-reported internet use— A validation study using client log data. Commun Methods Measur. (2016) 10:13–27. doi: 10.1080/19312458.2015.1118446
36. Araujo T, Wonneberger A, Neijens P, de Vreese C. How much time do you spend online? Understanding and improving the accuracy of self-reported measures of internet use. Commun Methods Measur. (2017) 11:173–90. doi: 10.1080/19312458.2017.1317337
37. Husson F, Lê S, Pagès J. Exploratory multivariate Analysis by Example Using R. New York, NY: CRC Press (2017).
38. Franco GD. Multiple correspondence analysis: one only or several techniques? Qual Quant. (2015) 50:1299–315. doi: 10.1007/11135-015-0206-0
39. Lê S, Josse J, Husson F. FactoMineR: an R package for multivariate analysis. J Statist Soft. (2008) 25. doi: 10.18637/jss.v025.i01
40. Kuhn M, Weston S, Coulter N, Quinlan R. C5.0 Decision Trees and Rule-Based Models. R package version 01 0-21. Available online at: https://cran.r-project.org/web/packages/C50/C50.pdf.
41. Kassambara A, Mundt F. Factoextra: Extract and Visualize the Results of Multivariate Data Analyses. R package version 104 (2017).
42. Josse J, Chavent M, Liquet B, Husson F. Handling missing values with regularized iterative multiple correspondence analysis. J Classific. (2012) 29:91–116. doi: 10.1007/s00357-012-9097-0
43. Pearson K L III. On lines and planes of closest fit to systems of points in space. Lond Edinb Dublin Philos Magaz J Sci. (1901) 2:559–72. doi: 10.1080/14786440109462720
44. Benzécri JP. L'analyse des données: L'analyse des correspondances. L'analyse des données: leçons sur l'analyse Factorielle et la Reconnaissance des formes et travaux. Paris: Dunod (1973). Available online at: https://books.google.de/books?id=sDTwAAAAMAAJ
45. Benzécri JP. Histoire et préhistoire de l'analyse des données (History and Prehistory of the Analysis of Data). Dunod Paris (1982).
46. Husson F, Josse J. Multiple correspondence analysis. In: Visualization and Verbalization of Data. Boca Raton, FL: Chapman & Hall/CRC; Computer Science & Data Analysis; CRC Press (2014). Available online at: https://books.google.de/books?id=0hQyAwAAQBAJ
47. Greenacre M. Correspondence Analysis in Practice. Chapman & Hall/CRC Interdisciplinary Statistics; CRC Press (2017). Available online at: https://books.google.de/books?id=lCQNDgAAQBAJ
48. Ward JH. Hierarchical grouping to optimize an objective function. J Am Statist Assoc. (1963) 58:236–44. doi: 10.2307/2282967
50. Cornillon PA, Guyader A, Husson F, Jégou N, Josse J, Kloareg M, et al. R for Statistics. New York, NY: CRC press (2012).
51. Parisot O, Ghoniem M, Otjacques B. Decision trees and data preprocessing to help clustering interpretation. In: Proceedings of 3rd International Conference on Data Management Technologies and Applications. SCITEPRESS - Science and and Technology Publications (2014).
52. Jonietz D, Bucher D, Martin H, Raubal M. Identifying and interpreting clusters of persons with similar mobility behaviour change processes. In: Lecture Notes in Geoinformation and Cartography. Springer International Publishing (2018). pp. 291–307.
53. Quinlan J. Data Mining Tools See5 C50. RuleQuest Research (2003). Available online at: http://www.rulequest.com/see5-info.html
54. Quinlan JR. C4.5: Programs for Machine Learning. Ebrary online. Elsevier Science (2014). Available online at: https://books.google.de/books?id=b3ujBQAAQBAJ
56. Cyr L, Francis K. Measures of clinical agreement for nominal and categorical data: The Kappa coefficient. Comput Biol Med. (1992) 22:239–46. doi: 10.1016/0010-4825(92)90063-s
57. Schmitt N. Uses and abuses of coefficient alpha. Psychol Assess. (1996) 8:350–3. doi: 10.1037/1040-3590.8.4.350
58. Hwang H, Montréal H, Dillon WR, Takane Y. An extension of multiple correspondence analysis for identifying heterogeneous subgroups of respondents. Psychometrika (2006) 71:161–71. doi: 10.1007/s11336-004-1173-x
59. Gifi A. Nonlinear Multivariate Analysis. Wiley Series in Probability and Mathematical Statistics: Probability and Mathematical Statistics. Wiley (1990). Available online at: https://books.google.de/books?id=XkamAAAAIAAJ
60. Hubbard R, Lindsay RM. Why P values are not a useful measure of evidence in statistical significance testing. Theory Psychol. (2008) 18:69–88. doi: 10.1177/0959354307086923
61. Japkowicz N, Shah M. Evaluating Learning Algorithms. New York, NY: Cambridge University Press (2009).
62. Harlow S, Harp D. Collective action on the Web: a cross–cultural study of social networking sites and online and offline activism in the United States and Latin America. Inform Commun Soc. (2012) 15:196–216. doi: 10.1080/1369118x.2011.591411
63. Mourão R, Saldaña M, McGregor S, Zeh A. Support for Protests in Latin America: classifications and the role of online networking. Soc Sci. (2016) 5:58. doi: 10.3390/socsci5040058
64. Fourcade M, Lande B, Schofer E. Political space and the space of polities: doing politics across nations. Poetics (2016) 55:1–18. doi: 10.1016/j.poetic.2015.12.002
65. Lewis C, Rieman J. Task-Centered User Interface Design: A Practical Introduction. Boulder, CO: University of Colorado (1993).
66. Ritschard G, Zighed DA. Goodness-of-fit measures for induction trees. In: Lecture Notes in Computer Science. Berlin; Heidelberg: Springer (2003). pp. 57–64.
67. Camiz S, Gomes GC. Joint correspondence analysis versus multiple correspondence analysis: a solution to an undetected problem. In: Giusti RGVM Antonio, editor. Classification and Data Mining. Berlin;Heidelberg: Springer (2012). pp. 11–18.
68. Greenacre MJ. Interpreting multiple correspondence analysis. Appl Stochast Models Data Anal. (1991) 7:195–210. doi: 10.1002/asm.3150070208
69. Tang G, Lee FLF. Facebook use and political participation: the impact of exposure to shared political information, connections with public political actors, and network structural heterogeneity. Soc Sci Comput Rev. (2013) 31:763–73. doi: 10.1177/0894439313490625
70. Leung DKK, Lee FLF. Cultivating an active online counterpublic: examining usage and political impact of Internet alternative media. Int J Press Polit. (2014) 19:340–59. doi: 10.1177/1940161214530787
71. Ryan T, Xenos S. Who uses Facebook? An investigation into the relationship between the Big Five, shyness, narcissism, loneliness, and Facebook usage. Comput Hum Behav. (2011) 27:1658–64. doi: 10.1016/j.chb.2011.02.004
Keywords: exploratory data analysis, social media usage, protest activities, multiple correspondence analysis, hierarchical clustering, decision rule induction
Citation: Masías VH, Hecking T and Hoppe HU (2018) Exploring the Relationship Between Social Networking Site Usage and Participation in Protest Activities. Front. Appl. Math. Stat. 4:56. doi: 10.3389/fams.2018.00056
Received: 11 May 2018; Accepted: 09 November 2018;
Published: 27 November 2018.
Edited by:
Frank Emmert-Streib, Tampere University of Technology, FinlandReviewed by:
Matthias Dehmer, UMIT - Private Universität für Gesundheitswissenschaften, Medizinische Informatik und Technik, AustriaFernando A. Crespo, Universidad Mayor, Chile
Copyright © 2018 Masías, Hecking and Hoppe. This is an open-access article distributed under the terms of the Creative Commons Attribution License (CC BY). The use, distribution or reproduction in other forums is permitted, provided the original author(s) and the copyright owner(s) are credited and that the original publication in this journal is cited, in accordance with accepted academic practice. No use, distribution or reproduction is permitted which does not comply with these terms.
*Correspondence: Victor Hugo Masías, dm1hc2lhc0BmZW4udWNoaWxlLmNs