
95% of researchers rate our articles as excellent or good
Learn more about the work of our research integrity team to safeguard the quality of each article we publish.
Find out more
ORIGINAL RESEARCH article
Front. Appl. Math. Stat. , 21 August 2018
Sec. Dynamical Systems
Volume 4 - 2018 | https://doi.org/10.3389/fams.2018.00035
This article is part of the Research Topic The Earth-Moon System as a Dynamical Laboratory View all 11 articles
The slow deformation of terrestrial orbits in the medium range, subject to lunisolar resonances, is well approximated by a family of Hamiltonian flow with 2.5 degree-of-freedom. The action variables of the system may experience chaotic variations and large drift that we may quantify. Using variational chaos indicators, we compute high-resolution portraits of the action space. Such refined meshes allow to reveal the existence of tori and structures filling chaotic regions. Our elaborate computations allow us to isolate precise initial conditions near specific zones of interest and study their asymptotic behaviour in time. Borrowing classical techniques of phase-space visualization, we highlight how the drift is mediated by the complement of the numerically detected KAM tori.
Various groups of scientists have become enchanted anew by the lunisolar resonances affecting the dynamics of terrestrial orbits. The study of them and the resurgence of their significance has not been visible since the notorious and colossal triptych of Breiter [1–3]. Later rebranded by Rossi [4] in the context of the medium-Earth orbits (MEOs), the study of their long-term dynamics, and in particular their eccentricity growths in the elliptic domain [5], represent current deep motivations for the community. In our opinion, the most complete and up-to-date panorama of the literature is excellently presented by Armellin and San-Juan [6]. The existence of such a condensation allows us to adopt here a rather direct style in this present contribution. We are particularly interested by questions related to the stability of orbits. Based on the divergence of nearby trajectories, the existence of a mixed phase space where there is a cohabitation of stable and chaotic components has been recently pictured [7–11] and partially explained applying Chirikov's resonances overlap criterion [12]. The Hamiltonian flow obtained under the simplest assumptions for the disturbing effects of the perturbers (i.e., a development restricted to its lowest order and averaged over fast variables), Moon and Sun, encapsulates all the details of the dynamics in which we are interested [7]. In particular, the Hamiltonian possesses 2 degrees-of-freedom (DOF) and depends periodically on the time t (see [11] for omitted details). We recall in the next section how the Hamiltonian
with is obtained. The form of Equation (0.0.1) is the standard form of a nearly-integrable problem written in action-angles variables. The non-linearity parameter ε belongs to a certain subinterval of ℝ+ and is function of the semi-major axis, which is a first integral in the secular approximation. The functions are real valued functions of the sole action x ∈ D ⊂ ℝ2 (and some constant physical parameters), the ϕm are phase terms. When ε sweeps , a transition from a globally ordered phase space to a mixed phase space is known to exist. It turns out that the presence of a chaotic regime for large values of ε, say for ε close to , corresponds to the range of semi-major axes where the navigation satellites are located. The occurrence of the two apparent antonyms, “how awkward it is”1 and “how useful and fruitful it can be”2, crystallizes assuredly the challenges, implications and beauty of the dynamical and engineering problems we face.
Gravitational problems are kaleidoscopes of pure and applied science. Our Solar System has been the source and receptacle of many theoretical and practical dynamical facets and aspects (KAM theory, hyperbolic dynamics, shadowing theory, numerical analysis, phase visualization techniques). Spaceflight dynamics is not excluded and has gained from this rich heritage [13–15]. We cannot take a definitive position on the space-debris mitigation via “chaos targeting” and transfers in phase space, nevertheless, let us underline that the concept embraces the continuous necessary exchanges between (technological and scientific) communities.
In this paper, we depart from former goals where the main impetus was the explanation of the mechanisms supporting the apparition of chaos. Instead, we focus rather on (i) the physical consequences in terms of transport in the phase space and (ii) on the visualization of these excursions via double sections in the action-like phase space. The techniques we used have been extensively employed in Dynamical Astronomy and overall in the context of the dynamics of quasi-integrable Hamiltonian systems and symplectic discrete maps (confer [16–20], just to name a few). To achieve our tasks, we provide a cartographic view of the prograde and retrograde region in section 3.2, based on a lighting-fast ad-hoc secular model that we recall in section 3.1. The fine resolutions of the meshes used to discretize the domains D allow for highly detailed views of the phase space. We then focus on the computation of diameters-like quantities to relate the degree of hyperbolicity (a local property) with a more practical transport-like index (a global property). Thanks to our resolved grids, precise initial conditions (ICs) can be extracted, which lie near specific structures of interest, in particular where large diameters are expected. Once obtained, we proceed to their asymptotic analysis (in time) using ensemble orbit propagation (section 4). We close with section 5 where we summarize our contributions and discuss an open problem that inspires our future efforts.
We recall briefly, for the sake of completeness, under which hypotheses the 2.5-DOF Hamiltonian is obtained. After the presentation of the model, we present to the newcomers a few facets of the resonant aspects.
Numerical evidence has shown that, for the range of the treated perturbation (recall ), refinements of the gravitational potentials beyond the quadrupolar level are not necessary to capture details of the global dynamics we are interested in, even on long timescales [7]. It means that when the potentials of the Earth and those of the external bodies, Moon and Sun, are developed using Legendre expansions, terms with l>2 are disregarded. By recognizing the timescales of the dynamics, further simplifications are even possible to get a more pertinent analytical model (and numerical as well; see also section 3.1). Based on the Lagrangian averaging principle [21–23], the potentials are averaged over the mean anomaly of the test particle ℓ and those of the third bodies3, ℓ⊙ and ℓ☾.
For an oblate Earth, we recall the classical averaged potential
expression, with . Here (G, H) denotes the second and third variables of the Delaunay actions (L, G, H), μ⊕ denotes the (Earth's) gravitational parameter. The canonically conjugated vector of angles is classically denoted (ℓ, g, h). Omitting details that might be found in Celletti et al. [9, 11], the disturbing function of the Sun's attraction, , reads as
with
The scalar has a constant magnitude of ~3.96 × 10⁻¹⁴ in the international system of units. The coefficients sm are defined as sm = Km(2−m)!/(2+m)!. The functions F2, m, p(•) refers to Kaula's inclination function [24] and H2, p, 2p−2(e) is related to the Hansen coefficients. For the disturbing function of the Moon, the following formula holds true
with
The expressions are function of the obliquity of the eccliptic, and are present due to a rotation of the spherical harmonics needed in this mixed-reference frame formalism. Note that the size of the coefficient is close to α⊙ (The ratio α☾/α⊙~1.09). The coefficients mm, s are defined as . It turns out that the time derivative of the angle h☾ is well approximated by a constant frequency defining a period of 18.6 years. In other words, we consider the explicit time dependence of the lunar potential as linear. At this stage, it is recognizable and transparent that the Hamiltonian formed on the perturbations,
possesses 2 DOF and is periodically-time dependent (i.e., a 2.5-DOF problem). The explicit time dependence due only to the node of the Moon4 plays a fundamental role in shaping the dynamics. The well-known distinctive feature with the case of 2 DOF is that, a priori (in absence of additional known first-integrals apart the energy function itself), the tori cannot act as practical barriers preventing transport in the phase space (for an N-DOF autonomous problem with N ≥ 3, the codimension between the N-dimensional tori and the dimension of the phase space restricted to an energy surface (2N − 1) is at least 2). The Delaunay variable ℓ being a cyclic variable, its conjugate variable is a constant of motion. Let us introduce normalized new actions . The reduced system is kept canonical as long as the new angles are introduced and the physical-time multiplied by the same factor. It is clear that the new Hamiltonian has the same form as in Equation (0.0.8). The previous factor αJ2 absorbs now a contribution from L and we get the new . Factorizing the external perturbation by the greatest α☾, the Hamiltonian can be rewritten as
The hierarchy α☾≪αJ2 enables us to write α☾ = εαJ2, ε≪1, and Equation (0.0.9) becomes
Clearly shares the form of the standard perturbed Hamiltonian system as announced in the introduction. The very useful information that we got from these manipulations is that the dimensionless perturbative parameter ε is proportional to the secular invariant semi-major axis,
(The mean motions of the test particle and disturbing bodies are noted n and n☾, respectively.) Note that this perturbing parameter is of the same nature as that introduced by Breiter [3], but we are treating herein the regime of the lunisolar secular (not semi-secular) resonances. The Hamiltonian model based on the quadrupolar level is physically relevant up to a semi-major axis close to amax = 6r⊕ (beyond, octupolar refinements, l = 3, are needed) corresponding to ε(amax) = 0.8. In the following, we will be interested in semi-major axes up to a = 29, 600 km, leading to ϵ = 0.22. From our numerical investigations, we noted that for a = 13, 600 km, the chaos is thin and confined to a few inclination-dependent-only resonances. These two constraints together define the subinterval of interest for ε. Adding quite “virtually” the point {0} to this set, , we obtain when ε = 0 an integrable dynamics with a linear flow on a torus. The actions are constant and determine the invariant tori. On these tori the dynamics consist of a rotation at constant speed characterized by the vector of constant frequencies (the unperturbed frequency vector) Ω(G, H) = (ϖg, ϖh) given by
where [24].
Let us be more precise regarding the definition of the interval and the energy function considered. An important factor leading to the 2.5 DOF model lies in the omission of the tesseral contributions in the Hamiltonian (0.0.8). Tesseral resonances occur when the commensurability , the main tesseral resonances affecting the motion are given by the set of commensurabilities (see e.g., [25, 26]). Near a tesseral resonance, the semi-major axis is no longer secularly invariant and, in fact, might experience (confined) chaotic variations near their corresponding resonant action value . Putting all of these together, a more precise definition of our interval of interest for the perturbing parameter ε is instead where where δp:q characterize the strength (width) of the resonance. The eventual local coupling of the tesseral contributions and the lunisolar resonances on the evolutions of the actions (G, H), for perturbing values precisely within the tesseral resonant domain (i.e., for ), is not discussed in this contribution, but is the object of a further study (accordingly, tesseral contributions are disregarded in the energy function). Using estimations obtained in former works [25, 26], let us stress that the ratio of the measures is very close to 1. Moreover, accurate low-altitude or very local studies could require additional refinements of the energy function (e.g., near the critical inclination, see [27]). Although our model is subject to these possible limitations, we should highlight that the considered dynamics are accurate enough to describe general MEO orbits, and from a mathematical point of view provide a simple testbed to investigate transport theories and capture the big picture.
We abused the vocabulary and treat the eccentricity e and inclination i as “actions,” instead of using the veritable actions variables (G, H). This is rather to stick to classical notations [24]. Nevertheless, these variables are functionally independent and the “true” actions easily obtained as e2 = 1−(G/L)2 and cosi = H/G. Let us precise that, when dealing with the autonomous Hamiltonian by introducing an extra conjugated variables (Γ, γ) ∈ ℝ × T for ε≠0, one couple of actions x = (G, H) characterize an invariant torus of T3 since Γ does not enter into the equations of motion. In other words, we can consider the orbits in the reduced phase space defined by . In section 3, we will offer views of the dynamics in action-action sections, meaning that within the space , we fix the angles to a specific vector to obtain the section Let us now discuss fundamental phenomenon for ε≠0.
A determinant feature in the long-term properties of nearly-integrable systems of the form h(x, y) = h0(x)+ϵh1(x, y) is the presence of resonances5 [30]. They arrive when a vector satisfy with the (unperturbed) frequency vector a commensurability condition over the rationals. The resonant condition reads k·Ω(x) = 0. For a fixed vector , the sets (potentially empty) of the actions x such that k·Ω(x) = 0 form the resonant manifolds. The resonance under consideration is then characterized by an index, the resonance order, usually though the ℓ1-norm of k, . Under the quadrupolar assumption, the system (0.0.10) is prone to resonate with a maximal order of 6. Let us consider the frequency vector Ω(x) = (ϖg(x), ϖh(x), ϖ☾), then, as already recognized by Ely [25], the resonant conditions read as
These algebraic equations admit non-trivial solutions that define the lunisolar resonant manifolds. The resonant manifolds are mirrored with respect to the resonance (0, k, 0)·Ω(x) = kϖh(x) = 0. (However, as we will clearly illustrate it, the symmetry of the resonant manifolds does not imply a mirroring of the geography of the KAM tori and hyperbolic structures.) In Daquin et al. [7], the extent of the resonant zones have been estimated (in a subdomain of the prograde 0 < i ≤ π/2 domain) by reducing the Hamiltonian to the first fundamental model of resonance, a pendulum. This procedure involved the introduction of resonant coordinates through canonical transformations 𝔗k ∈ SL(3, ℚ) leading to an intuitive physical interpretation of Chirikov's overlap as a driver of chaos. However, since the work of Celletti et al. [9], it has been observed that such a reduction does not always capture the features of the dynamics. In order to get a more refined and precise view of the extent of chaos, a superior way is instead to look at the destruction of KAM curves, e.g., using fast dynamical indicators.
We revisit and complement the transition order/chaos in terrestrial orbits by scanning the dynamics under the rays of a first order variational chaos indicator. The motivation is twofold:
(1) The resolutions used in former studies are generally sufficient to detect and isolate chaotic components; yet, they are too coarse to detect the eventual presence of structures immersed within them. In addition, the dissection of the dynamics with a fine resolution makes possible the extraction of the chaotic skeleton with surgical precision6. This property will be used to study transport properties (confer section 4).
(2) Gkolias et al. [10] claimed that “the retrograde orbits are not intrinsically more stable then their prograde counterparts.” This diagnosis was established by scanning the region with an averaged FLI (over some angles) focusing on low eccentricity (up to e = 0.1). We feel necessary to investigate further this assertion beyond e = 0.1 without the averaged indicator (which naturally tends to smooth and absorb the details).
To overcome and constrain these two symptoms, we first briefly recall how we efficiently deal with the equations of motions, after which we present and discuss our highly-resolved phase-space views on a macroscale.
Ordinary and partial differential equations with disparate scales (spatial, temporal) are numerically challenging. The difficulty arrises from the fact that the inhomogeneities in the scale constrain parameters of the numerical methods employed (say, e.g., the size of the timestep, the discretisation of the mesh) to be small and highly resolved. In the present case, we deal with (highly) oscillatory ODEs. They are omnipresent in the context of Newton's equations7 and are ubiquitous in the context of Celestial Mechanics. To circumvent the problem, effective models and model reductions techniques are often employed. The core idea is to substitute to the original dynamics a more amenable, numerical and/or analytical, dynamical system [33–35]. One method of choice to design effective dynamics relies on the Lagrangian averaging principle [21–23, 36], which has a long-lasting tradition in Celestial Mechanics. This principle is usually used when the components of the equations themselves allow to recognize explicitly the time scales. When it is so, the fast dynamics is integrated into the slow variables to design an averaged approximation. In this setup, the new slow constituents somewhat incorporate the informations of the fast-dynamics and serve as a new input for the investigations. To deal efficiently with our problem at hand, we adopt here our own secular MILAN model, as presented by Gkolias et al. [10]. The MILAN model is based on the vectorial Milankovitch element and admits a minimal force model (consisting of the averaged J2 contribution, to which is added the secular quadrupolar third-bodies perturbations). The MILAN formulation bears also net advantages compared to the numerical treatment of the Hamiltonian equations in forms of those given in section 2.1. First, the formulation is free of singularity and, secondly, the averaging is done in a closed form in the eccentricity. The external third-bodies potentials are both averaged over the fast variables of the problem, i.e., over the mean-anomaly of the test particle and the mean anomalies of the third bodies. This “doubly” averaged model allows the propagation of a test-particle over 106–107 orbital periods in a few seconds only. Such a performance is essential in investigating properties of the phase space for range of parameters. When invoking effective models, we always face the question of the relevance of the reduced model (how sound are the qualitative or quantitative informations derived from it). Gkolias et al. [10] established the testimony of this doubly-averaged model against a singly-averaged approach. By simulating the two dynamics on different domains of the action-action, action-angle and angle-angle spaces8, we showed that dynamical features of interests were reproduced and in perfect agreement. Even if the simulation of the full dynamics (i.e., the original, non-reduced and “exact” dynamics) on such domains is still missing in the literature, recent reassuring numerical agreements have been presented by Armellin and San-Juan [6]. Namely, they presented nice agreements between their in-house doubly average model and the original non-averaged dynamics. All these together allow us to be confident enough on the numerical results presented hereafter.
We use the Fast Lyapunov Indicator (FLI), a first-order variational indicator initially introduced by Froeschlé et al. [37], to discriminate orbit stability. This scalpel has been used extensively over the past decade across different dynamical problems, ranging from Symplectic Maps studies to Dynamical Astronomy, including Astrodynamical practical problems [38–41]. The work of C. Froeschlé, M. Guzzo and E. Lega over the last decade provides a good overview of its possibilities and range of applications. When the dynamics under consideration is written in first order and autonomous form as ẋ = f(x), x∈ℝn, the FLI is simply derived from the variational system in ℝ2n,
as
Contrarily to Lyapunov exponents, the FLIs (computed at some time τrun for a specific set of initial conditions x0, w0) keep trace of the resonant nature of the orbits, while taking approximately the same value FLI~log(τrun) on KAM tori [38, 42]. By computing the FLIs on a discretised specific 2d-section of ICs (e.g., related to the action-action, action-angle, or angle-angle planes) on a domain D, we can reveal the geography of the survival KAM tori and their complement hyperbolic set. The information given by the FLIs (“intensity”) is then color-coded to obtain a map of stability. Note that sometimes, in order to get a sharper visualization, the FLIs that initially take variation in are restricted to a subinterval of (see e.g., [16, 19]). This rescaling is achieved by fixing the two following thresholds. The notion of chaoticity is based on the exponential evolution of the norm between two nearby orbits. Therefore, to reveal anomalies with respect to the linear trend (log-scale of an exponential growth), the criteria
can be used to derive a lower threshold for chaotic orbits (i.e., all FLIs larger than αlog(τrun) are assigned to αlog(τrun)). Symmetrically, we obtain an upper threshold to judge regularity with the criteria
(And again, all the FLIs smaller than log(τrun/β) are assigned to log(τrun/β).) The Figures 1, 2 resume in many ways the transition from order to chaos in the prograde and retrograde region of terrestrial orbits. This original unscrewed fence views of the action-action phase space are very illuminative (and pedagogical) to visualize, with respect to the non-linear parameter ε(a), the proliferation of chaos. Each map represents the result of 1, 000 × 500 ICs propagated over a long timescale. Different simulation times τrun have been used according to the perturbing parameter (the stronger is the perturbation, the shorter is the time required to get a sharp contrast of the dynamics). For the smallest perturbing parameter, a = 18, 600 km, τrun represents 30 lunar nodes, while for a = 29, 600 km 16 lunar nodes are sufficient to get a sharp contrast (most probably those propagation times could be slightly shortened). It represents about 7 × 10⁵ and 1.8 × 10⁵ test particle revolutions. The “actions” have been uniformly distributed along the rectangle , with emax determined by the apogee-altitude condition emax = 1−(r⊕+δ)/a, δ = 120 km. In all our maps, we have set the initial angles to zero. Anticipating a bit the next section, we are here interested in the dynamical mechanisms leading to transport; in particular we have not discriminated collisional orbits as we did in earlier work. As it has already been discussed several times and pointed out in several contributions [7, 8, 10], the inclination dependent-only resonances widen and develop chaos when ε is increasing, letting less and less room for invariant KAM tori. Eventually for a = 29, 600, there is a macroscopic chaotic component. At this macroscale, we even have the feeling of a chaotic path-connected space (i.e., for every two points in the hyperbolic set, there exists a hyperbolic path connecting them). This property is not exactly true as isolated chaotic islands do exist. Nevertheless, the volume of such isolated chaotic sea is rather small. Let us precise that, given the fact that we used different τrun, the color palette has a symbolic meaning only. Also, in the same way, the z-scale which sets the different levels of the perturbing parameter ε(a) is not a linear scale, and again, has only a schematic pictorial purpose.
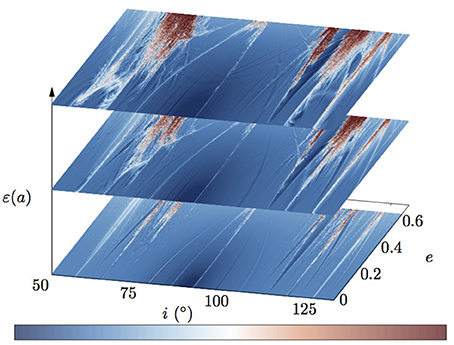
Figure 1. A highly-resolved fence view of the stability of the prograde and retrograde regions obtained under the FLIs. The three slides depict the stability for a particular value of the non-linearity parameter ε(a) which depends on the secularly invariant semi-major axis. KAM tori correspond to white to light-red color, stable resonant orbits appear in blue while red colors correspond to chaotic orbits. The values ε(a) correspond to the three semi-major axis {18.6, 22.6, 24.6} × 103 km (the z-scale is only symbolic, in particular the scale is not linear). This unscrewed view presents in a global, original and concise way the transition from order to chaos. See text for comments.
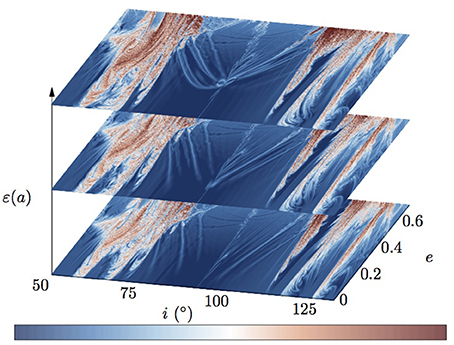
Figure 2. The same as in Figure 1 apart that the values ε(a) correspond to the three semi-major axis {27.6, 28.6, 29.6} × 103 km.
For the two extreme perturbing parameters considered in this work, ε(a) with a = 18, 600 or 29, 600 km, we have superimposed for the newcomers the resonant manifolds obtained under the quadrupolar assumption (confer Equation 2.12). It is interesting to notice that, despite the symmetry of the resonant manifolds along the (0, k, 0) resonance, the chaos is not mirrored at all in the retrograde region (see Figure 3). The coefficients of each harmonic, excepting the critical inclination, are dependent on the cosine of the inclination and hence the resonant topologies for prograde and retrograde orbits are necessarily different. A further striking illustration of this fact, on a microscale, is exemplified in Figure 4. Such fine resolutions allow to reveal incredible structures and details of the phase space. These two simulations clearly show us, at least for this realization of angles, that the retrograde region is more stable than its prograde counterpart. Applying the criteria given by Equation (3.3) with α = 1.1, we found on that domain that the volume of chaotic orbits is 4 times larger than in its retrograde counterpart. We further quantified this question by applying various criteria on our former simulations. Table 1 summarizes our results by giving the volume of chaotic orbits in the prograde vs. the retrograde region, for slightly different values of α on a macroscale. From our survey (which should be extended for completeness), the numerics tend to show that, for small to moderate values of the perturbing values of ε, the volume of chaotic orbits is roughly the same. However, for larger values of ε, the prograde region is more chaotic than its counterpart, the difference being now of several percent. (But again, we are aware of the dependence of our result against the choice of y0. Further numerical investigations could constrain even more the result.) At a smaller scale, as already recognizable in Figure 4, the discrepancies may be largely more significant. It would be interesting to support or invalidate this phenomenology by characterizing (i) the widths of the resonances of the retrograde domain and (ii) by exploring their numerical widths as a function of the angles. Such an enterprise is yet to be performed.
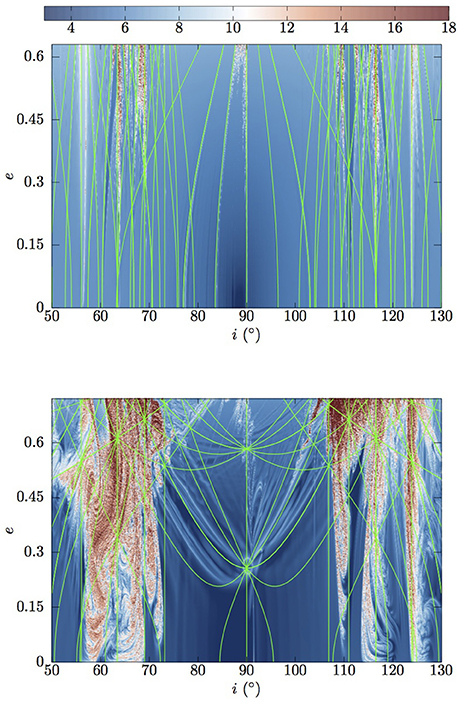
Figure 3. Detailed views of the prograde and retrograde regions for the two-extreme values of the parameter ε considered in this work (Top a = 18, 600 km, Bottom a = 29, 600 km). The resonant manifolds defined by Equation (??) are superimposed on the FLIs. Despite the symmetry of the resonant manifolds, the chaos of the prograde region is not mirrored in the retrograde region.
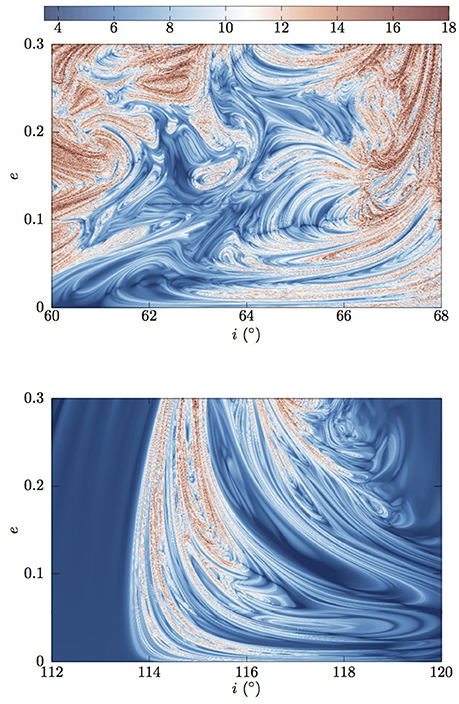
Figure 4. Two detailed views of the phase space under the FLI analysis. 701 × 701 orbits have been propagated revealing the existence of very thin structures and KAM tori filling the chaotic regions. On this domain, the retrograde region contains 4 time less orbits satisfying the condition FLI(τrun)≥αlog(run), α = 1.1.
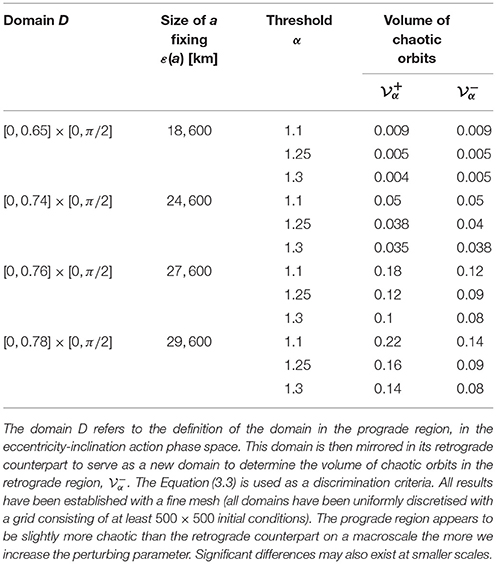
Table 1. The estimation of the volume of chaotic orbits in the prograde and retrograde regions, for various perturbing parameters and on various domains.
The computation of the FLIs provided a quantification of the degree of hyperbolicity and a discrimination of orbit stability. From a “practical” perspective, one might be more interested in drift estimation and visualization of transport to quantify changes of the unperturbed first integrals. This section is devoted to this task by investigating asymptotic properties of initial conditions close or immersed in hyperbolic structures. We base our approaches on individual propagations and on spatial ensemble averages.
There exist a tension between the local degree of hyperbolicity and the eventual large transport. In fact, the astronomical concept of stable chaos teaches us that positivity of a Lyapunov exponent does not necessarily implies large excursion in the phase space [43]. Large excursions in the phase space can be the signature of transport along the level curves of an integrable system. Nekoroshev's long-time stability theorem does not exclude the existence of chaotic variation. Finally, beyond a critical value, Chirikov's overlap criterion of resonances give rise to large connected chaotic domains, allowing possibly macroscopic transport [12].
The problem of chaotic transport (sometimes referred as chaotic diffusion) in nearly-integrable Hamiltonian systems and Dynamical Maps still occupy efforts of various dynamicists (see e.g., [40, 44, 45]). Given an orbit computed up to a final time τrun, γ(t) ={x(t), y(t))}0≤t≤τrun, we use the diameter along the action-variables to measure the drift of the unperturbed first-integrals. More precisely, given an action-like vector x ∈ D ⊂ ℝn, the diameter D of the orbit is defined as
For our computations we chose the ℓ∞-norm and computed the drift along the normalized action variables, i.e., along with and (we recall that in the secular approximation, L is a constant parameter determined by the semi-major axis).
The results of the computation of the diameters, according to Equation (0.0.13) for two-extreme non-linearity parameters are shown in Figure 5. Comparing the results with the FLIs maps, we note that the relation between hyperbolicity and large transport is not that straightforward. For a = 18, 600 km, we remark that regions with the larger FLIs do not necessarily correspond to regions where the transport is maximal. Conversely, the almost vertical resonant manifold emanating near i ~ 56.1° does not have the largest degree of hyperbolicity; yet it carries the largest transport index. Switching to a = 29, 600 km, we note that the lowest diameter is already one order of magnitude larger than in the former case. The largest diameter is also significantly larger which confirm the known fact of the instabilities in the MEOs. We emphasize that the diameters have been computed on the same predefined grids of ICs used to estimate the FLIs (i.e., a highly-resolved grid of ICs). The emanating feeling of a resolution deterioration in the maps is once again a nice testimony of the sensitivity of variational indicators.
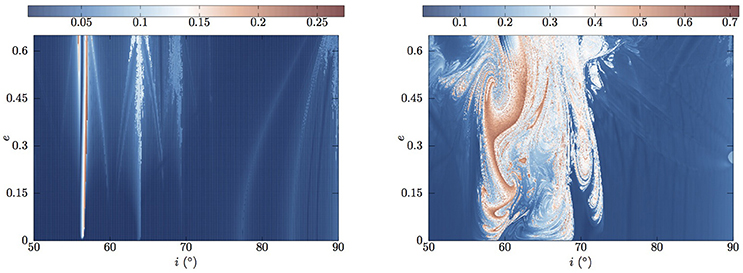
Figure 5. Estimation of the diameters for the two perturbing parameters ε(a) with a = 18, 600 km and a = 29, 600 km.
For large perturbing parameters, globally speaking, large hyperbolicity corresponds to large diameters. This fact has to be nuanced slightly near e ~ 0.7 and i ~ 70°. Using an empirical criterion, we extracted from the maps the actions that satisfy the condition FLI(x, τ run) ≥ 1.2log(τrun) (i.e., chaotic orbits) as those satisfying D(x, τ run) ≥ 0.35. The tracing orbits are shown in Figure 6 and illustrate the link between large hyperbolicity and large diameters, and the necessity of finely resolved meshes (thin stable structures stripe the chaotic domains and can be detected with the diameters also).
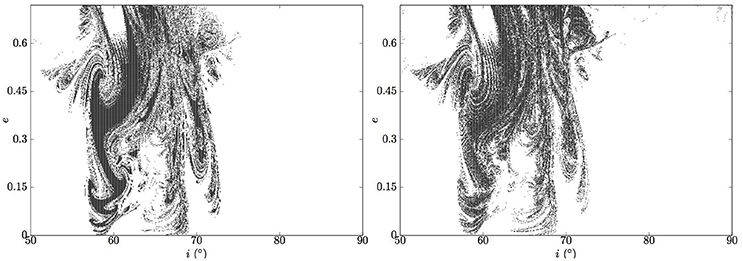
Figure 6. Extraction of the ICs satisfying D(x, τrun)≥0.35 (left hand-side) and the chaotic ICs satisfying FLI(x, τrun)≥1.2log(τrun).
Let us now comment on the diameter indicator that we used. Very often diameters-like quantities in terrestrial dynamics have been estimated using a more restrictive definition, namely a one-dimensional diameter of a specific observable f (see e.g., [41, 46]). This strategy reduces to nothing else than the amplitude estimation, equivalent to the estimation of . For the MEO problem, the eccentricity diameter along the time is, rightly, tracked (as efforts are directed toward the perigee height and the need of re-entry solutions). However, when used as an empirical “measure of chaos,” this diameter may be too loose. In fact, having in mind the geography of the resonant manifolds derived from the resonant condition in Equation (2.12) and the fact that two actions characterizes an invariant torus of 𝕋3, it is easy to “create” a quasi first-integral by choosing ICs near certain manifold. As an example, let us fix a = 29, 600 km and consider a cluster of ICs in a small neighborhood of , where . The time evolution (over 25 lunar periods) of the eccentricity and inclination for the whole cluster of orbits (k = 200 orbits) is displayed in Figure 7. The spatial averaged orbit is displayed and superimposed with a bold red line9. Clearly, the eccentricities of the whole cluster evolve in an apparent regular fashion. All the orbits incorporate similar dynamical informations, both on the quantitative and qualitative point of view. On the contrary, the inclination time-histories experience significant variations and a net sensitive dependence upon the ICs. From this example, easily generalisable, we easily infer why a one-dimensional diameter (based on the eccentricity) would fail in capturing these particularities. Pushing further the idea, we extended this approach on a grid of ICs near the point x⋆ by computing accordingly the diameters (and the FLIs). The obtained maps are presented in Figure 8. They confirm the rationale behind the intuition developed through the former example. Whilst the diameter based on both actions is in agreement with the FLI map, the method based on the one-diameter approach give an irrelevant and uniform signal.
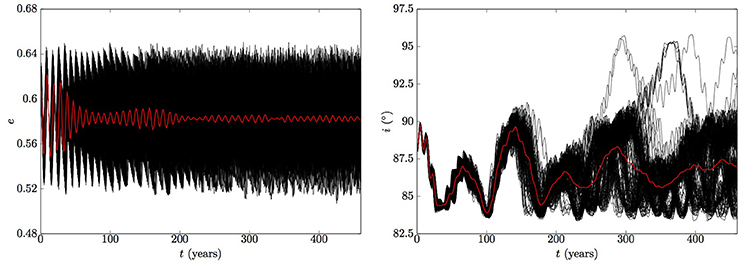
Figure 7. Ensemble integration of a cluster of k = 200 orbits in a neighborhood of . The ensemble averaged orbit of the considered observables are shown in red. The eccentricities do not experience a net sensitive dependence to the ICs, contrarily to the inclinations. From this example, it can be easily inferred that a diameter-measure based solely on the eccentricity (or equivalently on G) would fail to capture properties of the dynamics.
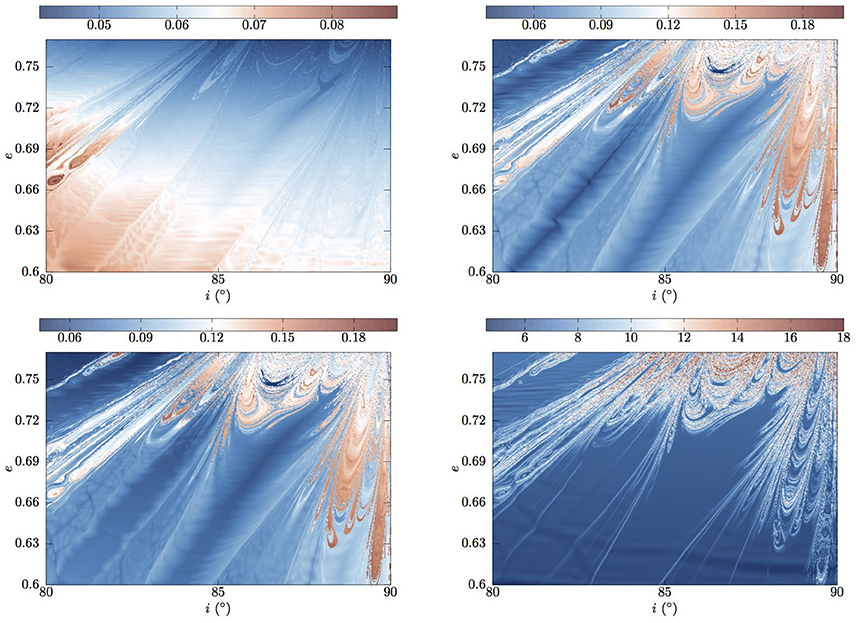
Figure 8. The figures enable us to quantify how a one-dimensional diameter coefficient (here based on the action G, top left) may be inappropriate in some cases in capturing dynamical properties. A contrario, the two-dimensional diameter coefficient (bottom left) based on both actions, G and H, captures the subtleties of the dynamics and reconcile the results with the FLIs analysis.
Having presented a general way to quantify the drift, let us focus now on how the drift is mediated in the phase space.
In the previous sections, we computed FLIs and diameters in various sections
with D⊂ℝ2. By fixing y = 0, particular features in have been depicted. In order to visualize transport properties, and to show how its mediation is related to the detected hyperbolic web, we use projection and visualization techniques that have been extensively used over the past decade to study transport in nearly-integrable Hamiltonian system, symplectic Maps and in Dynamical Astronomy [16, 18, 19, 40, 42]. For a recent overview specifically around the FLIs and their applications, we advise the reader to consult [20] for a pedagogical introductory note. The methodology consists in the following. First, we compute the FLIs over a section , say on 10. After this step, we are then able to recognize initial conditions close to hyperbolic borders or immersed within the chaotic sea. We then select one IC of interest in . Let denotes this IC. Next, we define a small neighborhood of k ICs of x⋆. In theory, it would be sufficient to deal with the sole numerical propagation up to τrun of the orbit emanating from x⋆. However, the procedure is computationally facilitated by considering a cluster of k orbits. From these computed orbits , we keep trace only of the points that return close enough to the section . For that purpose, we introduce the family of sections which are δ-close to . These sections are defined as
When δ → 0, we recover the “exact” section . The introduction of this family of section is essentially to circumvent numerical limitations. Firstly, we deal with a finite time τrun (that we would like to keep “as small as possible” but “large enough” to extract dynamical mechanisms). Secondly, in practice we do not deal with an orbit , but with a discretised version of this orbit computed, say (to facilitate the exposition), at each multiple of the fixed step size Δt, , nΔt = τrun. All points of the orbits that return during the simulation to a section of are identically projected into the exact section , on which the FLIs are used as a background. By doing that, we are able to relate transport with the web detected by the FLIs. In our computation we dealt with the ℓ∞-norm, δ is problem dependent and best determined by a calibration procedure11. Finally we worked with a cluster of size k = 200 initial conditions.
Figure 9 presents results in the range of “small” perturbation for two initial points of interest applying the methodology described previously. The clusters has been propagated up to a timescale of about 5.8 × 10⁵ orbits revolution (25 lunar nodes). The ICs serving a definition to the cluster are depicted in red. The points of the orbits that cross the double sections of the set are depicted in green. (To facilitate the reading and interpretation of the figures, the FLIs background have been color coded with a light opacity-like filter. The points returning to the section are intentionally magnified.) The two clusters focus on thin manifold that still carry transport (see Figure 5). As the transport index is rather small, excursions are modest and rather confined. The returning points are guided by the thin hyperbolic skeleton detected by the FLI computation.

Figure 9. Two diffusive scenarios illustrating transport scenarios along resonances in the regime of small perturbative parameters. The red spot indicates the initial condition where the ensemble of initial conditions are defined. Points of the orbits that return sufficiently close to the section (on which the FLIs appear as a background) are depicted with a green point. See text for comments.
In Figure 10, we repeated the same experiment with a larger ε for 4 different scenarios. The approach enables us to visualize and quantify the spread of the actions in the regime of strong chaos. The orbits of the clusters have been propagated on about 1.4 × 2.8 × 105 orbits revolution. The spread of the orbits is well more appreciable and develops more drastically within the action-space. It covers a large portion of the connected chaotic domain. As it is observed for all scenarios, the change in inclination can be superior to 15°, with extremely large variations for the eccentricity (namely, the mechanism allows nearly circular orbits to become very eccentric).
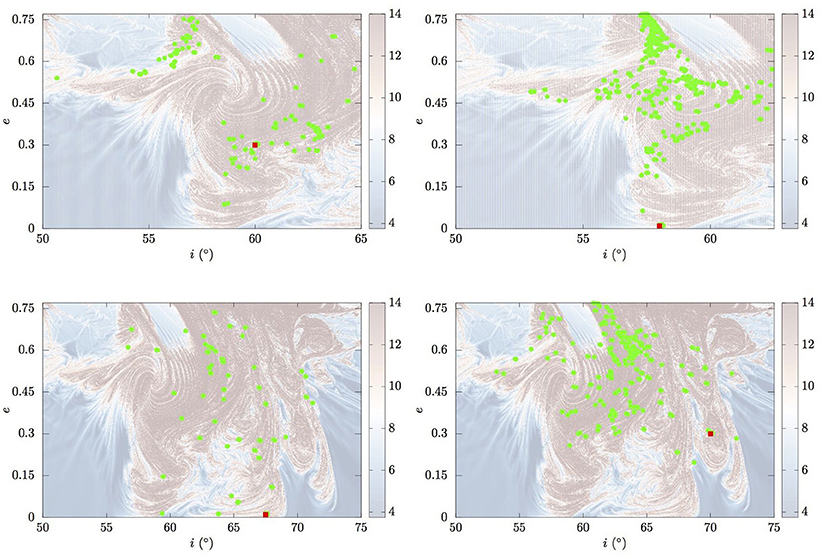
Figure 10. Diffusive scenarios illustrating transport scenarios within the hyperbolic web in the regime of large perturbative parameters and strong resonances overlap. The red spots indicate the initial condition where the ensemble of initial conditions are defined. Points of the orbits that return sufficiently close to the section (on which the FLIs appear as a background) are depicted with a green point. See text for comments.
It would be extremely interesting to extend the approaches and visualization of the diffusive properties by extending the dimension of the visualized space. Taking advantage of our model, we were able to extend the traditional stability maps in one more direction by stitching together ad-hoc others FLI sections. The results presented in Figure 11 complement the global stability picture of the actions space by “unrolling” the dynamics according to one angle, here Ω. The resonant manifolds computed using Equation (2.12) are depicted in black in the “action-space.” In the regime of small perturbation (left panel), a pendulum-like structure is clearly identifiable (minor structures can also be identified). By varying the size of the perturbation, a bifurcation-like phenomena occurred and the initially elliptic point becomes of a hyperbolic nature where collisional orbits develop. Such a systematic parametric methodology would allow, besides the quantification of chaos and the determination of the resonant regime (cf. [38]), the determination of precise perturbing parameters where such phenomena occur.
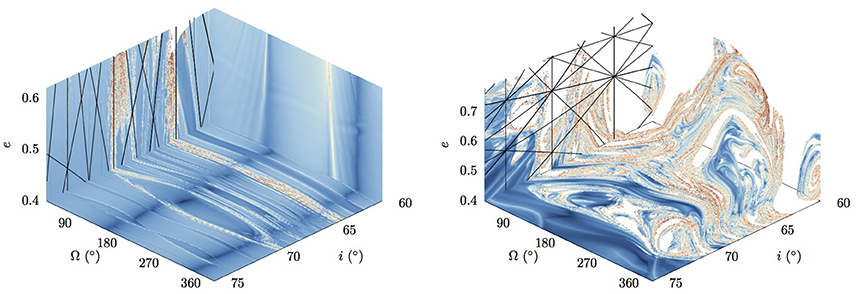
Figure 11. These two FLI cubes, computed for a = 18, 600 km (Left) and a = 29, 600 km (Right) highlight a bifurcation phenomena. The resonant manifolds appear in black in the “action-action” space.
Dynamical chaos indicators as the FLI are valuable and formidable allies to gain knowledge on the dynamical system under investigation. Their systematic use over nearly the past two decades in transverse fields has brought its share of results. Applications toward terrestrial dynamics are still at their early stage but the current situation seems to evolve positively. In this contribution, we complemented and refined our past studies related to the long-term dynamics of terrestrial orbits in the range 2.91–4.64 Earth radii (ε ∈ [0.02:0.22]). We showed the complementarity and benefits of visualizing the global dynamics via sections, corroborated with the computation of the FLIs and practical action-diameter quantities. From our numerical experiments, we have seen that when the detected hyperbolic manifolds are very thin (but still carry large diameters), the transport occurs precisely along them. For higher values of the non-linearity parameter, resonances do overlap significantly and the transport is across a large domain of the chaotic sea. This mechanism allows nearly-circular orbits to become highly eccentric on a few lunar nodes only. In the later case of strong chaos, preferred directions for the transport are hard to establish. The FLIs allow to follow and delineate the routes of transport where the spread in the phase space take place. The natural complementary step that deserves serious attention concerns the nature of the transport, the computation of diffusion-like coefficients and its scaling with ε (Note that if in our actual set-up, we do have access only to a limited number of different order of magnitudes of ε. A theoretical possibility to extend its range is to artificially increase the semi-major axis - even if we know that physically the procedure is not that relevant as octupolar contributions should be incorporated). Let us comment and relate recent difficulties that we encountered in investigating these last points. Transport properties are generally characterized through the computations of moments of different order q,
Let us underline once more that when we deal with the dynamics numerically, we only have access to finite time moments. Usually, the second-order moment, i.e., the spread of the actions (the variance), is used to discriminate the case of diffusion we deal with. More precisely, under the explicit ansatz that
the diffusion is called either subdiffusive (ν < 1), diffusive (ν = 1) or superdiffusive (ν > 1). (The particular case of superdiffusive behavior with ν = 2 is referred to ballistic diffusion.) The real parameter D2 is the estimated diffusion coefficient, and its sole determination can be sometimes tricky due to technical difficulties (see, e.g., Lega et al. [16] and further references in Cincotta et al. [45]). Anomalies to the strict diffusive case (ν = 1), i.e., aberrations with respect to Gaussianity, might be the results of the existence of a mixed phase space (cohabitation of regular and chaotic components in the phase space) and correlation effects [47, 48]. Let us note that, to the best of our knowledge, the study of the correlation function C(τ) (even at least for the specific observable of interest, the eccentricity) and its possible decay which give us the scale of the correlation time τC (see discussions in [49, 50]) has never been undertaken for the MEO problem. (The exception is found in Wytrzyszczak et al. [51] where the autocorrelation function properties are used to discriminate regularity for geosynchronous objects.) Daquin et al. [52] claimed the normal character of the diffusion for the eccentricity observable in the regime of strong chaos. We redid some experiments along those lines apart that we used the spatial averaging ideology (and no longer the temporal averaging) assuming that all ICs of the cluster are equivalent. We met difficulties to confirm our former conclusions and we stress here that they should be taken with a grain of salt. In fact, in our experiments, we noticed that such a conclusion depends strongly on the ansatz made on the evolution of the variance and the choice of the time-horizon investigated. Regarding the question related to the time-horizon, there might exist a transient time τtr. that should be constrained first. Indeed, in order to derive meaningful statistical conclusions, we have to ensure that τ ≫ τtr. (as a transient time seems to exist) and τ ≫ τC. It is possible that, unfortunately, in our present setting, τtr.~τ, making conclusions hard to reach.
Constraining those difficulties are the directions being taken by our current research.
All authors listed have made a substantial, direct and intellectual contribution to the work, and approved it for publication.
The authors declare that the research was conducted in the absence of any commercial or financial relationships that could be construed as a potential conflict of interest.
The present form of the manuscript owes a great deal to the reviewers. The authors greatly appreciated and acknowledge the discussions with Christos Efthymiopolous at the Perspectives in Hamiltonian dynamics conference held in Venice, June 18−22. JD is grateful to Bastian Märkisch of the SourceForge gnuplot forum for his precious advices in realizing Figures 1, 2 and thank Benoît Noyelles for his remarks. Numerical simulations were performed using HPC resources from the Institute for Celestial Mechanics and Computation of Ephemerides (IMCCE, Paris Observatory) and computing facilities from RMIT University. JD acknowledges the support of the Cooperative Research Centre for Space Environment Research Centre (SERC Limited) through the Australian Government's Cooperative Research Center Program and the support of the ERC project 677793 Stable and Chaotic Motions in the Planetary Problem (started on the 4th of June 2018). IG acknowledges the support of the ERC project 679086 Control for Orbit Manoeuvring through Perturbations for Application to Space Systems.
1. ^The Lyapunov times , which dynamically speaking constitute the barriers of predictability, are on the order of decades [7].
2. ^There is a birth of a new ideology to remedy the space-debris problem, based on a “judicious” use of the instabilities to define re-entry orbits and navigate the phase space.
3. ^In the following, we use the subscripts •⊕, •☾, •⊙ to denote parameters referring to the Earth, Moon and Sun, respectively.
4. ^We emphasize that the Hamiltonian depends on time just through the lunar contribution as we assumed that, over our timescale of interest, the rate of variation of the ascending node of the Sun is zero (see discussions in Celletti et al. [11]).
5. ^In the “multiscale analysis” community, resonances are sometimes named “slow hidden variables,” see e.g., [28, 29]. This semantic is pretty accurate as this is precisely what resonances are: resonances form “new slow variables” solely under specific combinations of the fast variables. Having this in mind, it is clear that in the presence of resonances the direct averaging may be crude (“naive” averaging) and conducts to a wrong dynamics.
6. ^In a somehow different but connected context, Armellin and San-Juan [6] have shown that fine discretisations are also needed for optimizers to operate properly.
7. ^They arrive also in Molecular Dynamics (see [31] and [32] for introductory papers and issues).
8. ^In Gkolias et al. [10], we presented only sections in the angle-angle space but we have evidences of the agreement on complementary sections also for a range of different semi-major axes.
9. ^Let us consider a cluster of size k, that we propagate up to time τrun. We obtain k orbits . Le us denote by xj(i, t) the instantaneous value of the j-th component of the orbit γi at a specific epoch t. The spatial averaged orbit of the component j (1 ≤ j ≤ n), 〈xj〉, is then defined through its components obtained at any time t by
10. ^In this work we were interested in the action-action plane, but the approach can be extended to action-angle or angle-angle planes. For example, a angle-angle section can be defined as
11. ^To give an idea of the size of δ, the results presented in this manuscript have been obtained with δ = 0.08 for the small range of ε, δ = 0.1 for larger range. Different admissible δ just change the number of points on the section collected, but leave invariant the transport properties (angles are expressed in radians).
1. Breiter S. Lunisolar apsidal resonances at low satellite orbits. Celestial Mech Dyn Astron. (1999) 74:253–74.
2. Breiter S. Lunisolar resonances revisited. Celestial Mech Dyn Astron. (2001) 81:81–91. doi: 10.1023/A:1013363221377
3. Breiter S. On the coupling of lunisolar resonances for Earth satellite orbits. Celestial Mech Dyn Astron. (2001) 80:1–20. doi: 10.1023/A:1012284224340
4. Rossi A. Resonant dynamics of Medium Earth Orbits: space debris issues. Celestial Mech Dyn Astron. (2008) 100:267–86. doi: 10.1007/s10569-008-9121-1
5. Bonnard B, Caillau J. Geodesic flow of the averaged controlled Kepler equation. Forum Math. (2009) 21:797–814. doi: 10.1515/FORUM.2009.038
6. Armellin R, San-Juan JF. Optimal Earth's reentry disposal of the Galileo constellation. Adv Space Res. (2018) 61:1097–120. doi: 10.1016/j.asr.2017.11.028
7. Daquin J, Rosengren A, Alessi EM, Deleflie F, Valsecchi G, Rossi A. The dynamical structure of the MEO region: long-term stability, chaos, and transport. Celestial Mech Dyn Astron. (2016) 124:335–66. doi: 10.1137/070707245
8. Celletti A, Gales CB. A Study of the Lunisolar Secular Resonance 2 . Front Astron Space Sci. (2016) 3:11 doi: 10.3389/fspas.2016.00011
9. Celletti A, Gales C, Pucacco G. Bifurcation of lunisolar secular resonances for space debris orbits. SIAM J Appl Dyn Syst. (2016) 15:1352–83. doi: 10.1137/15M1042632
10. Gkolias I, Daquin J, Gachet F, Rosengren AJ. From order to chaos in Earth satellite orbits. Astron J. (2016) 152:119. doi: 10.3847/0004-6256/152/5/119
11. Celletti A, Galeş C, Pucacco G, Rosengren AJ. Analytical development of the lunisolar disturbing function and the critical inclination secular resonance. Celestial Mech Dyn Astron. (2017) 127:259–83. doi: 10.1007/s10569-016-9726-8
12. Chirikov B. A universal instability of many-dimensional oscillator systems. Phys Rep. (1979) 52:263–379.
13. Bollt EM, Meiss JD. Targeting chaotic orbits to the Moon through recurrence. Phys Lett A (1995) 204:373–8.
14. Koon WS, Lo MW, Marsden JE, Ross SD. Heteroclinic connections between periodic orbits and resonance transitions in celestial mechanics. Chaos (2000) 10:427–69. doi: 10.1063/1.166509
15. Perozzi E, Ferraz-Mello S. Space Manifold Dynamics. New York, NY; Dordrecht; Heidelberg; London: Springer (2010). doi: 10.1007/978-1-4419-0348-8
16. Lega E, Guzzo M, Froeschlé C. Detection of Arnold diffusion in Hamiltonian systems. Phys D Nonlinear Phen (2003) 182:179–87. doi: 10.1016/S0167-2789(03)00121-0
17. Todorović N, Lega E, Froeschlé C. Local and global diffusion in the Arnold web of a priori unstable systems. Celestial Mech Dyn Astron. (2008) 102:13. doi: 10.1007/s10569-008-9152-7
18. Cincotta PM, Giordano CM. Chapter 6: Topics on diffusion in phase space of multidimensional Hamiltonian systems. In: Perlidze T, editor. New Nonlinear Phenomena Research. New York, NY: Nova Science Publishers (2008). p. 393–410.
19. Páez RI, Efthymiopoulos C. Trojan resonant dynamics, stability, and chaotic diffusion, for parameters relevant to exoplanetary systems. Celestial Mech Dyn Astron. (2015) 121:139–70. doi: 10.1007/s10569-014-9591-2
20. Lega E, Guzzo M, Froeschlé C. Theory and applications of the fast Lyapunov Indicator (FLI) method. In: Skokos CH, Gottwald GA, Laskar J, editors. Chaos Detection and Predictability. Vol. 915. Springer (2016). p. 35–54.
21. Grebenikov E. Methods of averaging equations in celestial mechanics. Soviet Astron. (1965) 9:146.
23. Ghys É. Resonances and small divisors. In: Charpentier É, Lesne A, Nikolski NK, editors. Kolmogorovs Heritage in Mathematics. Springer Science & Business Media (2007). p. 187–213.
24. Kaula WM. Theory of Satellite Geodesy: Applications of Satellites to Geodesy. Waltham, MA: Blaisdell Publi. Co. (1966).
25. Ely TA. Dynamics and Control of Artificial Satellite Orbits with Multiple Tesseral Resonances. Ph.D. thesis. Purdue University (1996).
26. Celletti A, Galeş C. Dynamical investigation of minor resonances for space debris. Celestial Mech Dyn Astron. (2015) 123:203–22. doi: 10.1007/s10569-015-9636-1
27. Lara M. Exploring sensitivity of orbital dynamics with respect to model truncation: the frozen orbits approach. In: Vasile M, Minisci E, Summerer L, McGinty P, editors. Stardust Final Conference. Astrophysics and Space Science Proceedings, Vol. 52. Cham: Springer (2018). p. 69–83.
28. Ariel G, Engquist B, Tsai R. Numerical multiscale methods for coupled oscillators. Multiscale Model Simul. (2009) 7:1387–404. doi: 10.1137/070707245
29. Abdulle A, Weinan E, Engquist B, Vanden-Eijnden E. The heterogeneous multiscale method. Acta Num. (2012) 21:1–87. doi: 10.1017/S09624929XXXXXXXX
30. Lochak P, Meunier C. Multiphase Averaging for Classical Systems. With Applications to Adiabatic Theorems. New York, NY: Springer-Verlag (1988).
31. Allen MP. Introduction to molecular dynamics simulation. In: N. Attig, K. Binder, H. Grubmüller, K. Kremer, editors, Computational Soft Matter: From Synthetic Polymers to Proteins, Vol. 23, Lecture Notes, NIC Series. Jürlich: John von Neumann Institute for Computing (2004). p. 1–28.
32. García-Archilla B, Sanz-Serna J, Skeel RD. Long-time step methods for oscillatory differential equations. SIAM J Sci Comput. (1998) 20:930–63.
33. Givon D, Kupferman R, Stuart A. Extracting macroscopic dynamics: model problems and algorithms. Nonlinearity (2004) 17:R55. doi: 10.1088/0951-7715/17/6/R01
34. Lesne A. Multi-scale approaches. In: Franxcoise JP, Naber G, Tsun TS, editors. Encyclopedia of Mathematical Physics. Elsevier (2006). p. 465–82.
35. Hartmann C. Model Reduction in Classical Molecular Dynamics. Ph.D. thesis. Free University Berlin (2007).
36. Pavliotis GI, Stuart AM. Multiscale Methods: Averaging and Homogenization. Heidelberg: Springer (2008).
37. Froeschlé C, Lega E, Gonczi R. Fast Lyapunov indicators. Application to asteroidal motion. Celestial Mechanics and Dynamical Astronomy. (1997) 67(1):41–62.
38. Froeschlé C, Guzzo M, Lega E. Graphical evolution of the Arnold web: from order to chaos. Science (2000) 289:2108–10. doi: 10.1126/science.289.5487.2108
39. Todorović N, Novaković B. Testing the FLI in the region of the Pallas asteroid family. Mthly Notices R Astron Soc. (2015) 451:1637–48. doi: 10.1093/mnras/stv1003
40. Guillery N, Meiss JD. Diffusion and drift in volume-preserving maps. Regular Chaot Dyn. (2017) 22:700–20. doi: 10.1134/S1560354717060089
41. Rosengren AJ, Daquin J, Tsiganis K, Alessi EM, Deleflie F, Rossi A, et al. Galileo disposal strategy: stability, chaos and predictability. Mthly Notices R Astron Soc. (2017) 464:4063–76. doi: 10.1093/mnras/stw2459
42. Guzzo M, Lega E, Froeschlé C. On the numerical detection of the effective stability of chaotic motions in quasi-integrable systems. Phys D Nonlinear Phen. (2002) 163:1–25. doi: 10.1016/S0167-2789(01)00383-9
44. Lange S, Bäcker A, Ketzmerick R. What is the mechanism of power-law distributed Poincaré recurrences in higher-dimensional systems? EPL (2016) 116:30002. doi: 10.1209/0295-5075/116/30002
45. Cincotta P, Giordano C, Martí J, Beaugé C. On the chaotic diffusion in multidimensional Hamiltonian systems. Celestial Mech Dyn Astron. (2018) 130:7. doi: 10.1007/s10569-017-9797-1
46. Alessi EM, Deleflie F, Rosengren A, Rossi A, Valsecchi G, Daquin J, et al. A numerical investigation on the eccentricity growth of GNSS disposal orbits. Celestial Mech Dyn Astron. (2016) 125:71–90. doi: 10.1007/s10569-016-9673-4
47. Varvoglis H, Vozikis C, Barbanis B. Transport in perturbed integrable Hamiltonian systems and the fractality of phase space. In: Dvorak R, Henrard J, editors. The Dynamical Behaviour of Our Planetary System. Dordrecht: Springer (1997). p. 233–42.
48. Zaslavsky GM. Chaos, fractional kinetics, and anomalous transport. Phys Rep. (2002) 371:461–580. doi: 10.1016/S0370-1573(02)00331-9
49. Wiggins S, Ottino J. Foundations of chaotic mixing. Philos Trans R Soc Lond A (2004) 362:937–70. doi: 10.1098/rsta.2003.1356
50. Varvoglis H. Regular and chaotic motion in Hamiltonian systems. In: Dvorak R., Freistetter F, Kurths J, editors. Chaos and Stability in Planetary Systems. Lecture Notes in Physics, Vol 683. Berlin; Heidelberg: Springer (2004). p. 141–84.
51. Wytrzyszczak I, Breiter S, Borczyk W. Regular and chaotic motion of high altitude satellites. Adv Space Res. (2007) 40:134–42. doi: 10.1016/j.asr.2006.11.020
Keywords: lunisolar secular resonance, Hamiltonian chaos, drift, terrestrial dynamics, Earth satellite
Citation: Daquin J, Gkolias I and Rosengren AJ (2018) Drift and Its Mediation in Terrestrial Orbits. Front. Appl. Math. Stat. 4:35. doi: 10.3389/fams.2018.00035
Received: 28 February 2018; Accepted: 16 July 2018;
Published: 21 August 2018.
Edited by:
Elisa Maria Alessi, Consiglio Nazionale Delle Ricerche (CNR), ItalyReviewed by:
Slawomir Breiter, Adam Mickiewicz University in Poznań, PolandCopyright © 2018 Daquin, Gkolias and Rosengren. This is an open-access article distributed under the terms of the Creative Commons Attribution License (CC BY). The use, distribution or reproduction in other forums is permitted, provided the original author(s) and the copyright owner(s) are credited and that the original publication in this journal is cited, in accordance with accepted academic practice. No use, distribution or reproduction is permitted which does not comply with these terms.
*Correspondence: Jérôme Daquin, ZGFxdWluQG1hdGgudW5pcGQuaXQ=
Disclaimer: All claims expressed in this article are solely those of the authors and do not necessarily represent those of their affiliated organizations, or those of the publisher, the editors and the reviewers. Any product that may be evaluated in this article or claim that may be made by its manufacturer is not guaranteed or endorsed by the publisher.
Research integrity at Frontiers

Learn more about the work of our research integrity team to safeguard the quality of each article we publish.