
95% of researchers rate our articles as excellent or good
Learn more about the work of our research integrity team to safeguard the quality of each article we publish.
Find out more
ORIGINAL RESEARCH article
Front. Antennas Propag. , 25 March 2025
Sec. Metamaterial Antennas
Volume 3 - 2025 | https://doi.org/10.3389/fanpr.2025.1494224
This article is part of the Research Topic Women In Antennas and Propagation 2024 View all articles
This article presents a novel cylindrical dielectric resonator antenna (CDRA) integrated with an artificial magnetic conductor (AMC) for non-invasive monitoring of blood glucose levels (BGL) in humans. A compact, economical, and highly sensitive RF-based sensing structure for continuous glucose monitoring that resolves the drawbacks of traditional invasive techniques was developed in this work. The suggested CDRA functions within the industrial, scientific, and medical (ISM) band (2.4–2.5 GHz) and incorporates a defective ground structure (DGS) to attain resonance at 2.4 and 2.52 GHz, offering an impedance bandwidth of 300 MHz. The antenna is small, measuring 30 mm × 30 mm × 6 mm, with an initial gain of 3.6 dBi. A beehive-shaped AMC is positioned at the back of the CDRA to improve its radiation characteristics, enhancing directivity by reducing side lobe levels and increasing the gain to 7.69 dBi. The proposed CDRA is simulated using the “Hugo” bio model (38-year-old male) available in CST MWS software. It demonstrates a specific absorption rate (SAR) of 0.036 W/kg, which is within the acceptable limits of 1.6 W/kg for human exposure. The proposed CDRA was also simulated for operation with varying glucose concentrations, and a correlation between S parameter variation and glucose variation was observed. The Debye model is used to determine the dielectric characteristics of human blood for BGL values of 80 mg/dL, 110 mg/dL, 130 mg/dL, 150 mg/dL, and 170 mg/dL. The proposed CDRA was validated for radiation parameters, and the measured values matched well with the simulated ones. The proposed CDRA shows a sensitivity of 4.5 × 10⁻³ dB/mg/dL. The results show that the proposed CDRA is a good candidate for measuring BGL values in humans.
Diabetes is one of the most common chronic diseases in the world. The daily count of patients suffering from this disease is increasing at an alarming rate. Diabetes demands regular medical attention and risk-reduction tactics. More than 9% of the global population is diagnosed with diabetes, with approximately 23% going undiagnosed (Narayan et al., 2000). Diabetes is the seventh biggest contributing cause of death, according to recent reports from the American Diabetes Association (Kaul et al., 2013) and the World Health Organization (WHO). Timely diagnosis and treatment are vital for patients with diabetes. So, research for early detection, novel preventative measures, and improved treatments is in high demand. Early detection of prediabetes and monitoring of blood glucose levels (BGLs) of the body could help in treatment or prevent diabetes altogether if patients adopt healthier practices. The idea of BGL monitoring is both affordable and practical in developing nations. However, the conventional method of finger pricking to measure BGL is painful and prone to risk of infection. A non-invasive, safe, and painless method for BGL monitoring eases the process. Various non-invasive methods, such as thermal (Oliver et al., 2009; Cho et al., 2004; Tang et al., 2008), optical (Rawer et al., 2004; Malik and Coté, 2010; Nicolai et al., 2007), and electromagnetic methods (Gourzi et al., 2005; Tura et al., 2010; So et al., 2012), are currently being studied for BGL monitoring. However, these methods are expensive and require large instruments to carry out the measurements. BGL monitoring through RF/microwaves is a new method that is better than the existing methods for BGL monitoring (Satish et al., 2021; Kandwal et al., 2021; Rahayu et al., 2023). The RF sensors required for the measurements are small and, hence, easy to handle. Moreover, the process of RF measurement of BGL is cheap and simple. These factors make RF/microwave-based sensing devices for monitoring BGL popular and in high demand.
The setup for the RF/microwave sensing of BGL requires an antenna. The antenna radiates, and when a human body is placed near the antenna, the body reflects the radiation at a specific frequency known as the resonant frequency. The value of the return loss and the resonant frequency when an antenna is in proximity to a human body is different from when an antenna radiates in a free space. This difference varies with the blood glucose concentration of the body. This is explained in more detail in the later sections. The difference in return loss and resonant frequency is correlated with the actual BGL, and the readings are measured. This process is an easy, inexpensive, and quick method to measure BGL in humans.
The prime concern for this RF/microwave BGL sensing method is antenna design. The antenna must be miniaturized so that it is portable. The specific absorption rating (SAR) must be well within the prescribed limits so that the radiations are not harmful to the human body. The radiation penetration must be deep enough to reach the blood layer of the human body. For this, the gain of the antenna must be enough so that the major lobe of the antenna has a high magnitude to reach the appropriate distance in the human body for BGL measurement.
The above-mentioned points were considered while designing the sensor for BGL monitoring in this work. An electromagnetic (EM) sensor designed for this purpose consisted of an antenna and an artificial magnetic conductor (AMC). The sensor had a low profile and showed a gain of 3.6 dBi and an SAR of 0.036 W/kg.
The overall article is organized as follows. The detailed design with a numerical analysis of the proposed EM sensor is given in Section 2. Section 3 discusses the simulated results of the sensor. Section 4 is dedicated to the SAR results and penetration depth of the proposed sensor. The simulated results of the proposed sensor on a human phantom with different BGL values are presented in Section 5, whereas Section 6 provides the measured results of the proposed sensor on different aqueous glucose solutions and a comparison of simulated and measured results. Section 7 concludes the article.
Some important requirements for BGL measurement using an RF system for an antenna are that it should operate in the industrial, scientific, and medical (ISM) band with multiple resonance frequencies, be highly sensitive (high Q factor), and have high near-field gain. To achieve the above characteristics, a cylindrically shaped dielectric resonator antenna (CDRA) has been proposed. It has been designed and simulated using CST MWS. In microwave-circuit applications, dielectric resonators have been utilized as high Q-factor elements ever since low-loss ceramics were developed (Peng et al., 2004; Kremer et al., 2021; Kajfez and Kishk, 2002). The ceramic structures were enclosed in metal cavities to minimize the radiation and maximize the Q-factor-crucial factors for filter or oscillator designs. It was later discovered that these dielectric resonators behave as efficient radiators when the metal shielding is removed and could be stimulated through appropriate feeding. The dielectric constant might be reduced to keep this radiation stable across a large frequency range. Various research done in the past concluded that dielectric resonator antennas (DRA) provide an alternative to conventional, low-gain patch antennas (Keyrouz and Caratelli, 2016; Guha and Kumar, 2016). Because the DRAs are made using ceramics, they possess lower loss than their metallic counterpart, as dielectric loss is much lower than ohmic loss. DRAs can be of various sizes, such as rectangular, cylindrical, spherical, etc. Among these shapes, cylindrical DRs are a popular choice in industrial sectors due to their well-established manufacturing process (Vahora and Pandya, 2020). Hence, in our work, CDRAs are chosen as an EM radiator for BGL monitoring. The following subsections describe the design procedure of the CDRA for BGL monitoring purposes.
The proposed CDRA is designed and simulated using CST MWS, with open boundary conditions and a time domain solver. The CDRA was made of alumina (
This design process starts by selecting the initial dimensions of CDRA. These are selected according to the dielectric wave-guide model (DWM) equation, as mentioned in Equation 1, for a resonant frequency of 2.45 GHz (Iqbal et al., 2019).
Using this equation, the radius (r) of CDRA was calculated for the height (h) = 6 mm. This height was selected based on the availability of the material. The calculated radius was 25 mm. However, this radius exceeds the overall target dimension of the proposed antenna, which was
As the CDRA designed in this work is for biomedical purposes (BGL monitoring), the target frequency band selected for the antenna resonance is the ISM band (2.4–2.5 GHz). A defected ground structure (DGS) is used to excite the target band instead of a full ground plane. Additionally, changes to the microstrip feedline enhance impedance bandwidth. These steps help us achieve the target frequency band (ISM band) with a higher impedance bandwidth. The design procedure for DGS is discussed in the following subsections.
DGS refers to a single or small number of compact geometrical slots that are implanted on the ground planes of microwave circuits. DGS is combined with planar transmission lines, including microstrip lines, coplanar waveguides, and conductor-backed coplanar waveguides, on the ground plane. These slots on the ground plane disturb its current distribution and, hence, alter the properties of transmission lines by adding new parameters to the transmission line parameters, such as slot capacitance, inductance, and resistance. The change in the equivalent inductance and capacitance alters the resonance of the LC circuit of the antenna and, hence, can be used to change the resonant frequency of the antenna to any target frequency. This resonant frequency of the LC circuit can be kept near the resonant frequencies excited by the antenna to improve the operational bandwidth. Equations 2–4 correlate the values of L and C for specific slot geometry with the resonant frequency of the antenna (Kaur and Kaur, 2022a).
Equations 2–4 are used to calculate the dimensions of the slots in the ground plane. Figure 2 shows the step-by-step evolution of the DGS. Step I shows the full ground plane and the S11 vs. frequency plot. In the second step, a rectangular slot was cut from the ground plane using Equations 2–4. Because the slots are rectangular, the capacitance was calculated using the basic formula,
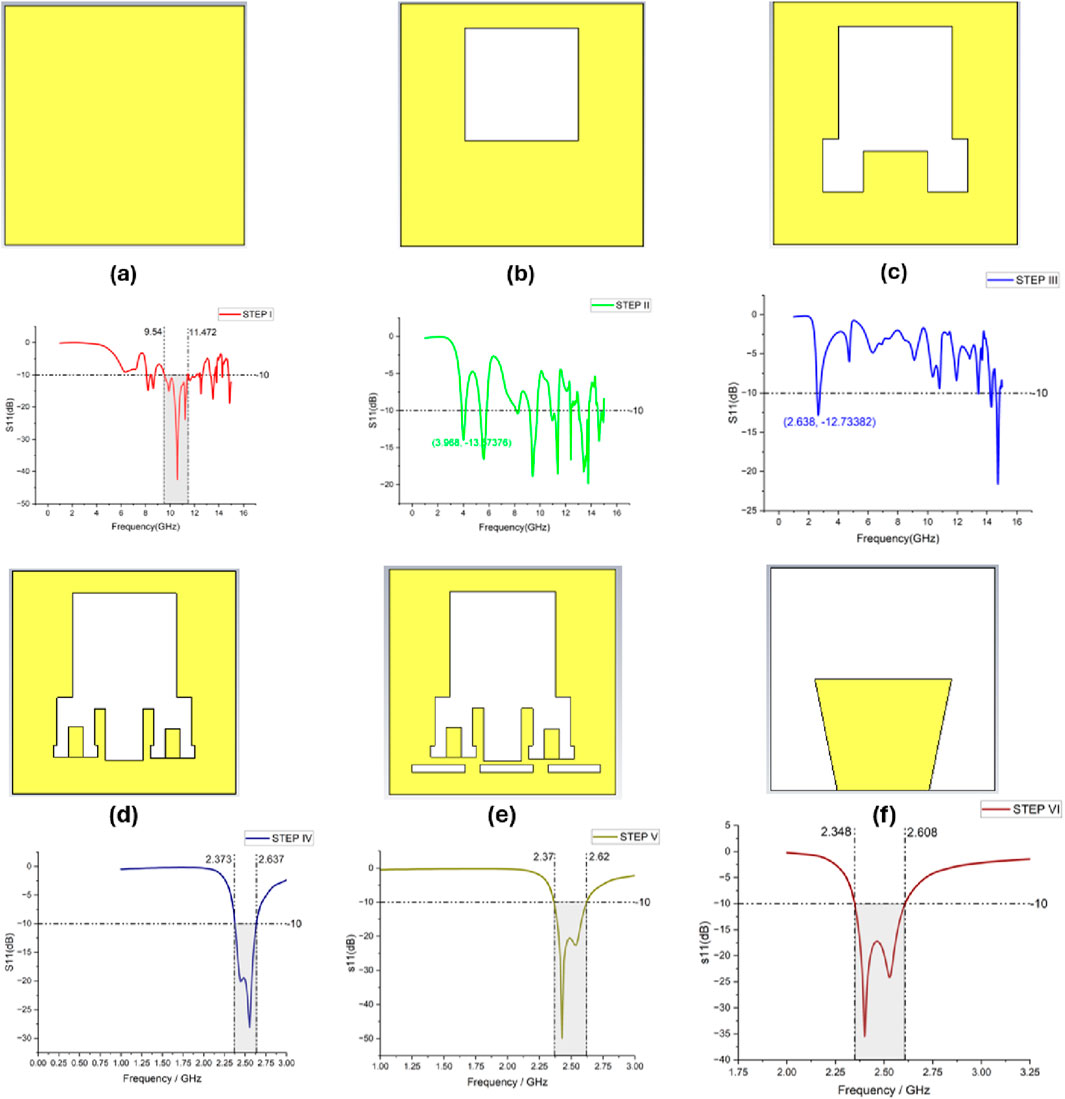
Figure 2. Evolution of the designed CDRA: (A) Step I, (B) Step II, (C) Step III, (D) Step IV, (E) Step V, and (F) Step VI (optimized flared feedline).
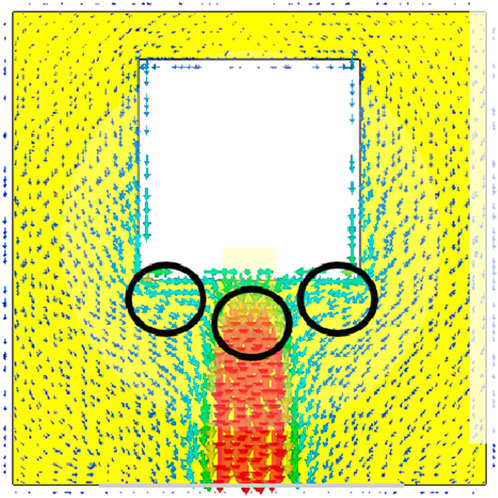
Figure 3. Surface current distribution of the designed CDRA at step II at 2.45 GHz. The circle encloses the maximum current density.
Figure 4 shows the final CDRA geometry with the dimensions labeled. Table 1 shows the physical dimensions associated with the CDRA design. Figure 5A shows the S11 parameter graph of the final antenna design (Step VI). An impedance bandwidth from 2.35 GHz to 2.6 GHz is exhibited by the final optimized antenna design. Table 1 discusses various parameters and their respective dimensions associated with the designed CDRA.
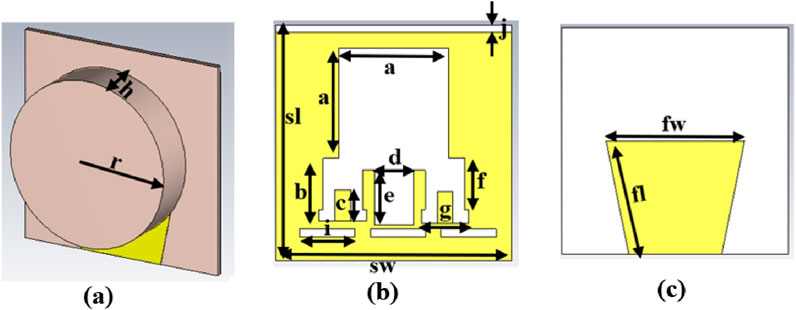
Figure 4. (A) Perspective view, (B) defected ground plane, and (C) optimized flared feedline of the designed CDRA (final step).
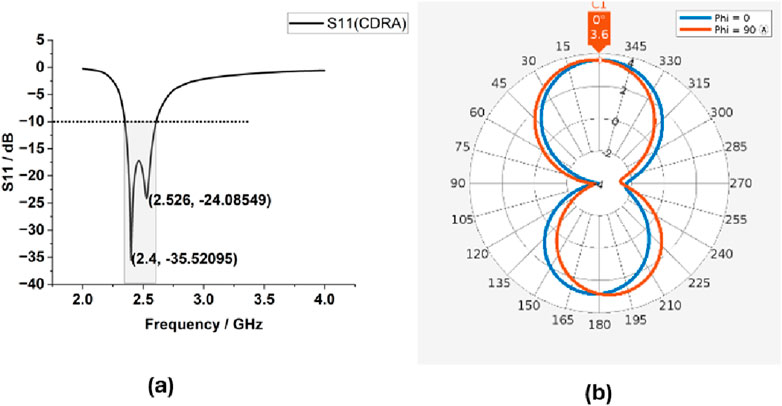
Figure 5. (A) Simulated S11 results of the final design. (B) Directivity pattern of the designed CDRA at 2.4 GHz.
Figure 5B shows the simulated directivity pattern of the designed CDRA backed by the designed DGS at the resonant frequency of 2.4 GHz. From the pattern, we can infer that the CDRA shows a bidirectional pattern of radiation with a gain calculated as 3.58 dBi at 2.4 GHz. Figure 6A shows the E-field pattern of the CDRA at its resonant frequency, that is, 2.4 GHz. Figure 6A shows the E-field at the top of the DR (z = H = 6 mm) and at 2.4 GHz. With reference to Figure 6A, the typical HEM11δ -mode field distributions are observed. Figure 6B shows the surface current distribution of the designed CDRA at the resonant frequency of 2.4 GHz. The surface current plot explains the radiation pattern of the CDRA. The directions of the surface current at the opposite ends of the feed are opposite to each other. This leads to the bidirectional radiation pattern of the CDRA. An artificial magnetic conductor (AMC) was designed to improve the radiation properties of the CDRA. The following section describes the design procedure of the AMC.
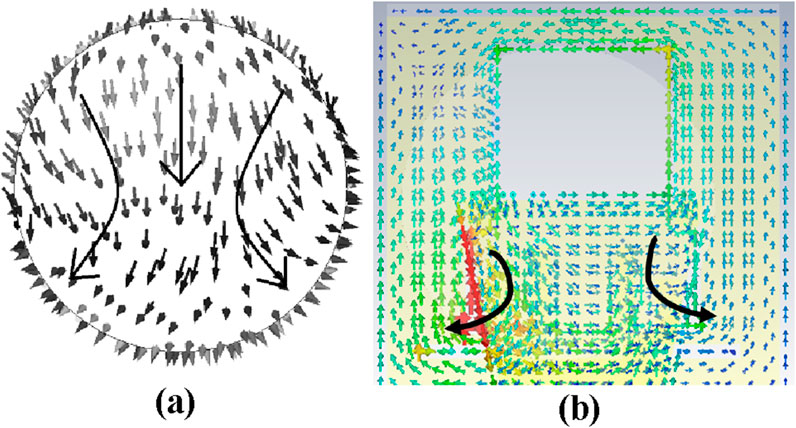
Figure 6. (A) E-field distribution of the designed CDRA at 2.4 GHz. (B) Surface current distribution of the designed CDRA at 2.4 GHz.
Electromagnetic bandgap (EBG) structures have gained increasing attention in many antenna designs in recent years (Ashyap et al., 2020; Dewan et al., 2017a). The remarkable characteristics, which include high-impedance surfaces within a restricted frequency range and restricting the propagation of surface waves within the bandgap frequency range, are the cause of their popularity. Photonic bandgap structures, which are realized in periodic configurations, serve as the foundation for the performance of EBGs. Applications of EBG structures reveal a variety of intriguing features (Dewan et al., 2017a). It is commonly known that the original current and the image current produced by a perfect magnetic conductor (PMC) are in parallel. Over the intended frequency range, AMC structures exhibit behavior like PMCs with an in-phase reflection coefficient (Dewan et al., 2017b). These reflected waves, which are generated by the AMC, constructively interfere with the source wave. The combined effect from both the reflected wave and source wave improves the radiation efficiency and gain of the antenna (Kumar et al., 2020). Periodic patches printed with or without vias on a grounded substrate make up AMCs.
In this work, a beehive-shaped metasurface is designed to enhance the radiation performance of the designed CDRA. This metasurface, shown in Figure 7A, was designed on a FR-4 substrate of thickness = 3.2 mm. The back of the AMC is a full ground plane. The ground plane and the beehive structure are made of copper. The designed procedures start with selecting the unit cell geometry on the requisite material.

Figure 7. (A) Designed AMC unit cell, (B) 3 × 3 AMC, and (C) phase of reflected current vs. frequency of the designed AMC unit cell.
A hexagon beehive-shaped structure is chosen as the design for AMC, as these are compact. Because they have less space between the sides of the hexagon (unit cell of metasurface), the resultant magnetic coupling is higher than the rest of the split-ring resonator (SRR) structures. Figure 7B shows the unit cell and the 3 × 3 AMC structure designed in this work. Table 2 describes the physical dimensions associated with the designed AMC.
The reflection phase vs. frequency plot (Figure 7C) shows that the designed AMC generates reflected waves that are similar in the direction of the original current in the target operating band of 2.4–2.5 GHz. The bandwidth of AMC is from −90
Figure 8A shows the perspective view of the designed CDRA backed by the designed beehive-shaped AMC. Figure 8B shows the simulated return loss vs. frequency plot. As is evident from Figure 8B, the CDRA + AMC operated in the ISM band, resonating at 2.584 GHz.

Figure 8. (A) Designed CDRA backed by the designed AMC at an optimized “dist” = 6 mm. (B) Simulated S11 result of the structure (CDRA + AMC). (C) Directivity pattern of the structure (CDRA + AMC).
Figure 8C shows the simulated directivity pattern of the designed CDRA backed by the designed AMC. From the pattern, we can infer that after adding the AMC to the CDRA, the whole structure showed improved radiation characteristics. The AMC reduces the back scattering of the radiation and, hence, improves the front-to-back ratio. The directivity was improved to 7.69 dBi.
The proposed antenna is fabricated and experimentally tested for validation of its radiation properties, such as impedance bandwidth and gain, so that it can be successfully used in blood glucose monitoring applications.
Figure 9 shows the cylindrical DRA prototype fabricated on a Rogers RT/duroid 5880 substrate (thickness = 0.8 mm). The ground plane is made up of copper (0.035 mm) and has slots etched into it, making it a DGS. A flared feedline of copper is printed on top of the substrate, as shown in Figures 9A, B, respectively. As shown in Figure 9C, a cylindrical DRA of alumina (h = 4 mm) is mounted on top of the feedline. The waterjet cutting technique is used to form the DR of alumina (εr = 9.8 and h = 6 mm) into the desired cylindrical shape. An instant glue (Panacol Vitralite) is then used to paste the DR over the feedline. The termination of the feedline is attached to a subminiature connector with an input impedance of 50 Ω. Agilent’s VNA E−5063 A is used to test the manufactured prototype, covering a frequency range of 0.1 MHz–18 GHz.
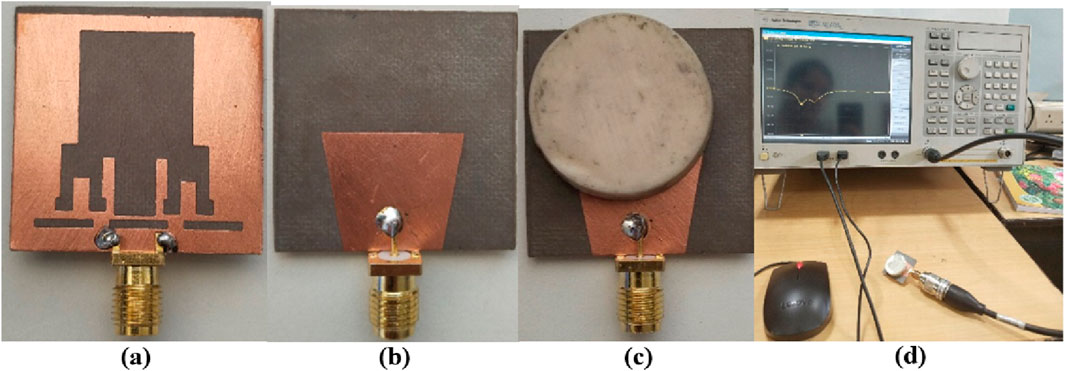
Figure 9. (A) Defected ground plane, (B) flared feedline, (C) CDRA placed above feedline, and (D) measurement setup for S11 results.
The measurement setup for the fabricated antenna’s11 parameter is shown in Figure 9D. The combined plots of the measured (2.37–2.75 GHz) and simulated (2.348–2.618 GHz) impedance bandwidth are compared in Figure 10A. According to the observed results, the CDRA shows two resonant peaks in the operating frequency band, with an error of 1.6% between the simulated and measured results, at 2.44 GHz and 2.67 GHz, respectively. The broadband gain of the proposed DRA over the 2–4 GHz operating frequency range was measured in an anechoic chamber with a standard horn antenna acting as the transmitter. The gain calculations were made using Friss transmission equations. The measured broadband gain of the antenna is shown in Figure 10B. At a frequency of 3 GHz, the DRA displays a peak gain of 3.48 dBi. Figure 10C shows the combined polar plots of the simulated and measured E-fields at phi = 0. The two experimentally observed findings show some differences, which can be explained by either reflecting objects placed near the VNA during the testing or due to the alignment errors of the antenna’s layers during manufacturing.

Figure 10. (A) Simulated and measured S11 of the designed CDRA vs. frequency plot, (B) simulated and measured gain of the designed CDRA vs. frequency plot, and (C) simulated and measured E-field pattern of the designed CDRA at phi = 0.
The Debye model provides a precise and efficient depiction of biological tissues across a broad frequency range. Recently, this model has been employed to simplify the analysis of experimental data acquired from diverse human tissues such as the brain, fat, breast, skin, bone, liver, and others The Debye Equation 5 is a mathematical model that describes the frequency-dependent behavior of complex impedance in biological tissues (Karacolak et al., 2013). It is commonly used to represent the electrical properties of tissues, considering their capacitive and resistive characteristics.
In this equation, Z(ω) represents the complex impedance at a given angular frequency ω, R is the DC resistance, Q is the Debye parameter, which depends on the relaxation time, τ is the characteristic relaxation time, and α is the shape parameter that determines how the relaxation time must be distributed. This equation allows for a more accurate representation of the impedance response of biological tissues over a wide range of frequencies, providing insights into their electrical behavior. The equation is useful in various biomedical applications, such as bioimpedance measurements, tissue characterization, and modeling of electrical stimulation.
Karacolak et al. (2013) use the Cole–Cole model for dielectric properties of blood plasma, which are dependent on glucose levels for CBGM. They show a correlation between electrical properties (relative permittivity,
In this study, it is assumed that other minerals present in the blood plasma, such as calcium, chloride, potassium, and magnesium, have negligible impact on the electrical properties (Karacolak et al., 2013).
It is evident from the study that the dielectric constant and the conductivity are inversely related to the glucose concentration of the sample. This difference is more apparent in the higher frequency range.
In the proposed research work, the dielectric parameters, namely, the dielectric constant (
Where
Static conductance is omitted for materials with low conductivity. Equations Equations 7–9 are the equations for calculating
Where X is glucose concentration in mg/dL. Table 3 lists the different coefficients for Equations 7–9.
Table 4 shows the dielectric parameters calculated for glucose levels of 80 mg/dL (normal), 110 mg/dL, 130 mg/dL, 150 mg/dL, and 170 mg/dL (hyper-glycemic). Table 4 shows
A human phantom with skin, fat, and blood tissue layers was then designed using CST software for in-silico analysis.
The proposed BGL monitoring purpose uses the CDRA near the bio mimic of human tissues. For an RF device to be used in such proximity to the human body, a specific absorption rate of less than or equal to 1.6 W/kg per 1 g of human tissue must be reported to ensure its safety for human exposure (Kaur K. and Kaur A., 2022).
Equation 10 below gives the expression for SAR as
Where ρ is the volume density of the tissue in Kg, σ is the conductivity of the bio mimic of human forearm tissues in S/m, and E is the measure of the electric field incident on the phantom.
Table 5 discusses the dielectric parameters of various human tissues at 2.4 GHz. A human phantom consisting of these human tissues (skin, fat, and blood) was designed as shown in Figure 11A. Figure 11B shows the placement of the designed CDRA near the bio phantom. Figure 11C shows the SAR plot of the human phantom at the resonant frequency of 2.4 GHz when the designed CDRA is fed 1 mW of power.
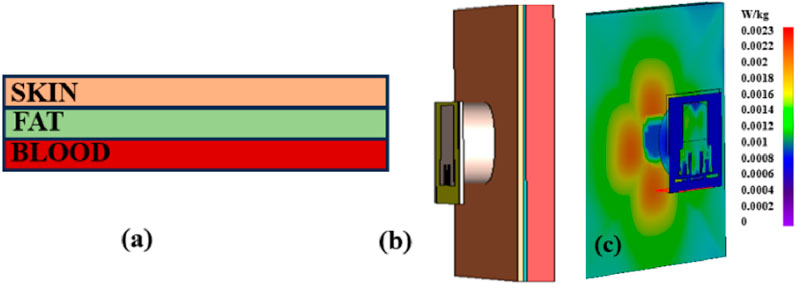
Figure 11. (A) Perspective view of the designed human bio phantom. (B) Placement of the designed CDRA with human phantom. (C) Simulated SAR of the designed phantom when exposed to designed CDRA at 2.4 GHz.
The CDRA sensor was then also simulated for better validation using the forearm of the bio model, named “Hugo,” provided by the CST MWS. “Hugo” is a 38-year-old male model consisting of 31 human-mimicking tissues. Figure 12 shows the placement of the antenna with respect to the bio model and its corresponding simulated SAR results.
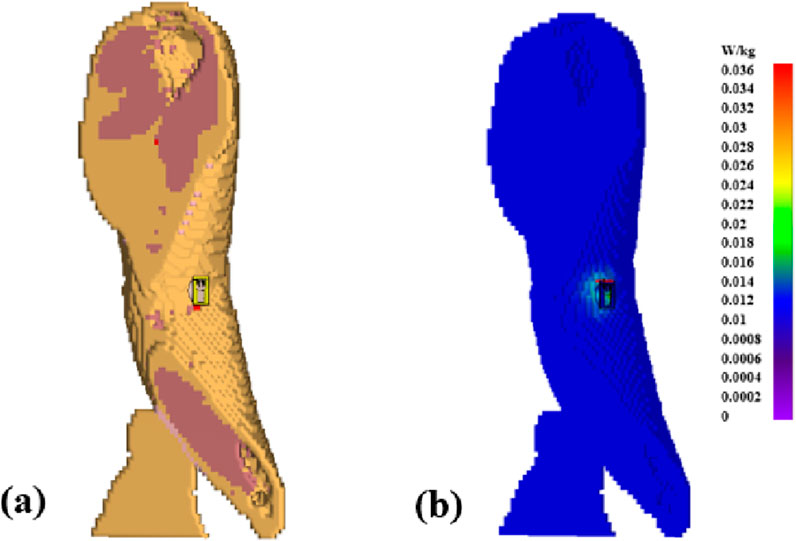
Figure 12. (A) Placement of the designed CDRA on the arm of “Hugo” bio model. (B) Calculated SAR of the Hugo’s arm when exposed to the designed CDRA at 2.4 GHz.
After the SAR analysis, the CDRA was then simulated with bio phantoms with different blood glucose values. Figure 13 shows the simulated S11 results when the dielectric parameters of the blood layer were changed according to the glucose level as calculated in Section 7 using the Cole–Cole model. Table 6 shows the simulated S11 values for different BGLs. Based on these values, the sensitivity of the CDRA as a BGL monitoring device was calculated as
A novel RF structure consisting of a cylindrical dielectric resonator antenna (CDRA) and an artificial magnetic conductor (AMC) operating in the ISM band (2.4–2.5 GHz) was designed in this literature. This structure can be used in various biomedical applications, such as monitoring blood glucose levels. The overall structure showed a gain of 7.7 dBi with an impedance bandwidth of 330 MHz. The antenna was tested with the “Hugo” bio model (38-year-old male) provided by CST MWS, and SAR was simulated. The antenna showed a permissible value of SAR of 0.036 W/kg. For BGL monitoring, the antenna is simulated and analyzed for different BGL values. For this purpose, the Debye model is referred to for extracting the dielectric properties of human blood for different glucose levels. The proposed BGL monitoring structure showed a sensitivity of
The raw data supporting the conclusions of this article will be made available by the authors, without undue reservation.
NU: methodology, writing–original draft, and writing–review and editing. AK: conceptualization, investigation, methodology, resources, supervision, validation, and writing–review and editing. AP: methodology, resources, supervision, validation, and writing–review and editing. AS: methodology, resources, supervision, and writing–review and editing.
The author(s) declare that financial support was received for the research and/or publication of this article. The authors are thankful to Thapar Institute of Engineering and Technology and Center of Excellence in Emerging Materials, Thapar Institute of Engineering and Technology-Virginia Tech (United States) for providing a funding grant and all the facilities for the research work.
The authors thank the Nava Nalanda Library of Thapar Institute for providing access to various journals for the study.
The authors declare that the research was conducted in the absence of any commercial or financial relationships that could be construed as a potential conflict of interest.
All claims expressed in this article are solely those of the authors and do not necessarily represent those of their affiliated organizations, or those of the publisher, the editors and the reviewers. Any product that may be evaluated in this article, or claim that may be made by its manufacturer, is not guaranteed or endorsed by the publisher.
Ashyap, A. Y. I., Dahlan, S. H. B., Zainal Abidin, Z., Abbasi, M. I., Kamarudin, M. R., Majid, H. A., et al. (2020). An overview of electromagnetic band-gap integrated wearable antennas. IEEE Access 8, 7641–7658. doi:10.1109/access.2020.2963997
Cho, O. K., Kim, Y. O., Mitsumaki, H., and Kuwa, K. (2004). Noninvasive measurement of glucose by metabolic heat conformation method. Clin. Chem. 50 (10), 1894–1898. doi:10.1373/clinchem.2004.036954
Dewan, R., Rahim, M., Hamid, M., Yusoff, M., Samsuri, N., Murad, N., et al. (2017a). Artificial magnetic conductor for various antenna applications: an overview. Int. J. RF Microw. Computer-Aided Eng. 27 (6), e21105. doi:10.1002/mmce.21105
Dewan, R., Rahim, M., Hamid, M., Yusoff, M., Samsuri, N., Murad, N., et al. (2017b). Artificial magnetic conductor for various antenna applications: an overview. Int. J. RF Microw. Computer-Aided Eng. 27 (6), e21105. doi:10.1002/mmce.21105
Gourzi, M., Rouane, A., Guelaz, R., Alavi, M., McHugh, M., Nadi, M., et al. (2005). Non-invasive glycaemia blood measurements by electromagnetic sensor: study in static and dynamic blood circulation. J. Med. Eng. and Technol. 29 (1), 22–26. doi:10.1080/03091900410001720247
Guha, D., and Kumar, C. (2016). Microstrip patch versus dielectric resonator antenna bearing all commonly used feeds: an experimental study to choose the right element. IEEE Antennas Propag. Mag. 58 (1), 45–55. doi:10.1109/MAP.2015.2501231
Iqbal, A., Smida, A., Saraereh, O. A., Alsafasfeh, Q. H., Mallat, N. K., and Lee, B. M. (2019). Cylindrical dielectric resonator antenna-based sensors for liquid chemical detection. sensors 19 (5), 1200. doi:10.3390/s19051200
Kajfez, D., and Kishk, A. A. (2002). “Dielectric resonator antenna-possible candidate for adaptive antenna arrays,” in Proceedings VITEL 2002, international symposium on telecommunications, next generation networks and beyond, 13–14.
Kandwal, A., Nie, Z., Igbe, T., Li, J., Liu, Y., Liu, L. W., et al. (2021). Surface plasmonic feature microwave sensor with highly confined fields for aqueous-glucose and blood-glucose measurements. IEEE Trans. Instrum. Meas. 70, 1–9. doi:10.1109/TIM.2020.3017038
Karacolak, T., Moreland, E. C., and Topsakal, E. (2013). Cole–cole model for glucose-dependent dielectric properties of blood plasma for continuous glucose monitoring. Microw. Opt. Technol. Lett. 55 (5), 1160–1164. doi:10.1002/mop.27515
Kaul, K., Tarr, J. M., Ahmad, S. I., Kohner, E. M., and Chibber, R. (2013). “Introduction to diabetes mellitus,” in Diabetes: an old disease, a new insight. Editor S. I. Ahmad (New York, NY: Springer), 1–11. doi:10.1007/978-1-4614-5441-0_1
Kaur, G., and Kaur, A. (2022a). C’ shaped dual polarized dielectric resonator antenna for the microwave imaging of breast tumor using beam-forming algorithms. Int. J. RF Microw. Computer-Aided Eng. 32 (7), e23178. doi:10.1002/mmce.23178
Kaur, K., and Kaur, A. (2022b). In vitro detection of skin cancer using an UWB stacked micro strip patch antenna with microwave imaging. Int. J. RF Microw. Computer-Aided Eng. 32 (12), e23407. doi:10.1002/mmce.23407
Keyrouz, S., and Caratelli, D. (2016). Dielectric resonator antennas: basic concepts, design guidelines, and recent developments at millimeter-wave frequencies. Int. J. Antennas Propag. 2016 (1), 1–20. doi:10.1155/2016/6075680
Kremer, H. I., Leung, K. W., Wong, W. C., Lo, K. K.-W., and Lee, M. W. K. (2021). Design of dielectric resonator antenna using dielectric paste. Sensors 21 (12), 4058. doi:10.3390/s21124058
Kumar, A., Dixit, A., Kumar, A., and Kumar, A. (2020). “Studies of various artificial magnetic conductor for 5G applications,” in Optical and wireless technologies. Editors V. Janyani, G. Singh, M. Tiwari, and T. Ismail (Singapore: Springer Singapore), 523–530.
Malik, B. H., and Coté, G. L. (2010). Real-time, closed-loop dual-wavelength optical polarimetry for glucose monitoring. J. Biomed. Opt. 15 (1), 017002. doi:10.1117/1.3290819
Narayan, K. M. V., Gregg, E. W., Fagot-Campagna, A., Engelgau, M. M., and Vinicor, F. (2000). Diabetes—a common, growing, serious, costly, and potentially preventable public health problem. Diabetes Res. Clin. Pract. 50 Suppl 2, S77–S84. doi:10.1016/s0168-8227(00)00183-2
Nicolai, B. M., Beullens, K., Bobelyn, E., Peirs, A., Saeys, W., Theron, K. I., et al. (2007). Nondestructive measurement of fruit and vegetable quality by means of NIR spectroscopy: a review. Postharvest Biol. Technol. 46 (2), 99–118. doi:10.1016/j.postharvbio.2007.06.024
Oliver, N. S., Toumazou, C., Cass, A. E. G., and Johnston, D. G. (2009). Glucose sensors: a review of current and emerging technology. Diabet. Med. 26 (3), 197–210. doi:10.1111/j.1464-5491.2008.02642.x
Peng, Z., Wang, H., and Yao, X. (2004). Dielectric resonator antennas using high permittivity ceramics. Ceram. Int. 30 (7), 1211–1214. doi:10.1016/j.ceramint.2003.12.079
Rahayu, Y., Nugraha, W. N., Praludi, T., Alaydrus, M., and Masdar, H. (2023). Experimental based blood glucose monitoring with a noninvasive cylindrical biosensor. Prog. Electromagn. Res. M 115, 71–81. doi:10.2528/PIERM22110409
Rawer, R., Stork, W., and Kreiner, C. F. (2004). Non-invasive polarimetric measurement of glucose concentration in the anterior chamber of the eye. Graefe’s Archive Clin. Exp. Ophthalmol. 242, 1017–1023. doi:10.1007/s00417-004-1031-7
Satish, K. S., and Anand, S. (2021). Demonstration of microstrip sensor for the feasibility study of non-invasive blood-glucose sensing. Mapan - J. Metrology Soc. India 36 (1), 193–199. doi:10.1007/s12647-020-00396-z
So, C. F., Choi, K. S., Wong, T. K. S., and Chung, J. W. (2012). Recent advances in noninvasive glucose monitoring. Med. devices Auckl. N.Z 5, 45–52. doi:10.2147/mder.s28134
Tang, F., Wang, X., Wang, D., and Li, J. (2008). Non-invasive glucose measurement by use of metabolic heat conformation method. Sensors 8 (5), 3335–3344. doi:10.3390/s8053335
Tura, A., Sbrignadello, S., Cianciavicchia, D., Pacini, G., and Ravazzani, P. (2010). A low frequency electromagnetic sensor for indirect measurement of glucose concentration: in vitro experiments in different conductive solutions. Sensors 10 (6), 5346–5358. doi:10.3390/s100605346
Keywords: dielectric resonator (DR) antenna, blood glucose monitoring (BGM), artificial magnetic conductor (AMC), Debye model, ISM band
Citation: Upadhyay N, Kaur A, Pattanayak A and Singh A (2025) Design, development, and testing of a cylindrical dielectric resonator antenna backed with a beehive-shaped artificial magnetic conductor for non-invasive blood glucose monitoring. Front. Antennas Propag. 3:1494224. doi: 10.3389/fanpr.2025.1494224
Received: 10 September 2024; Accepted: 18 February 2025;
Published: 25 March 2025.
Edited by:
Francesca Benassi, University of Bologna, ItalyCopyright © 2025 Upadhyay, Kaur, Pattanayak and Singh. This is an open-access article distributed under the terms of the Creative Commons Attribution License (CC BY). The use, distribution or reproduction in other forums is permitted, provided the original author(s) and the copyright owner(s) are credited and that the original publication in this journal is cited, in accordance with accepted academic practice. No use, distribution or reproduction is permitted which does not comply with these terms.
*Correspondence: Amanpreet Kaur, YW1hbnByZWV0LmthdXJAdGhhcGFyLmVkdQ==
†ORCID: Nidhi Upadhyay, orcid.org/0009-0008-2280-6626; Amanpreet Kaur, orcid.org/0000-0002-5499-777X
Disclaimer: All claims expressed in this article are solely those of the authors and do not necessarily represent those of their affiliated organizations, or those of the publisher, the editors and the reviewers. Any product that may be evaluated in this article or claim that may be made by its manufacturer is not guaranteed or endorsed by the publisher.
Research integrity at Frontiers

Learn more about the work of our research integrity team to safeguard the quality of each article we publish.