
95% of researchers rate our articles as excellent or good
Learn more about the work of our research integrity team to safeguard the quality of each article we publish.
Find out more
ORIGINAL RESEARCH article
Front. Anim. Sci. , 30 January 2025
Sec. Animal Breeding and Genetics
Volume 6 - 2025 | https://doi.org/10.3389/fanim.2025.1449092
 Wim Gorssen1,2
 Carmen Winters3
 Roel Meyermans1
 Léa Chapard1
 Katrijn Hooyberghs1Jaro De Kort1Alice Van den Broeke4†Jürgen Depuydt5
 Steven Janssens1Nadine Buys1*
Reducing piglet mortality and congenital defects is vital in pig production, as these traits substantially impact piglet welfare and lead to significant production losses. Additionally, piglets born with congenital defects often demand extra attention and resources from pig farmers. Nowadays, most breeders have shifted towards a more balanced breeding within their maternal pig lines, with a focus on both reproductive capacity and survival traits. However, few studies have investigated the influence of paternal sire genetics on crossbred piglets’ vitality and congenital defects. In this study, we evaluated the impact of an ongoing Piétrain sire breeding program on these traits in crossbred piglets that started in 2019. This study was based on two unique datasets with litter records collected between 2016 and 2024 on four independent commercial sow farms. The first dataset was collected by the breeding organization and consisted of 12,010 crossbred litters (Piétrain sire, hybrid dam; two farms) scored on piglets’ vitality, number of piglets with porcine congenital splay leg syndrome and scrotal hernia, pre-weaning mortality and the number of piglets born death. A second dataset (5,380 crossbred litters; two farms) was collected by ILVO (Flanders Research Institute for Agriculture, Fisheries and Food), using 426 Piétrain boars common to the first dataset of the breeding organization. Using a genetic sire-dam model, the studied traits were estimated to be lowly heritable (h2 = 5.2 to 15.6%). Moreover, vitality scores were genetically moderately correlated with preweaning mortality (rg=-0.59) and porcine congenital splay leg syndrome (rg=-0.52). Evolutions of phenotypic records and estimated breeding values since the start of the breeding program indicate a positive impact on piglet survival and prevalence of porcine congenital splay leg syndrome. The observed prevalence for porcine congenital splay leg syndrome roughly halved from ±1% in 2019 to ±0.5% in 2024, while for pre-weaning mortality, the observed prevalence dropped from ±17% in 2019 to ±14% in 2024. A joint analysis of the datasets showed a moderate to high genetic correlation (rg=0.52 to 0.84) for porcine congenital splay leg syndrome and pre-weaning mortality, indicating the translatability of estimated breeding values for terminal sires to new farms, specifically for these traits. In conclusion, these results show that paternal pig breeding programs can be effective in substantially improving piglets’ vitality while reducing porcine congenital splay leg syndrome and pre-weaning mortality. Due to the pressing societal demands for more animal welfare and the economic impact of these traits, we show other pig breeding companies the important role of paternal pig genetics towards improved piglet vitality and a reduction of congenital defects.
Decreasing mortality and the prevalence of congenital defects in the farrowing house is important in pig production. Mortality and congenital defects severely impact the piglets’ welfare, but also lead to economic losses. Moreover, affected piglets often require additional care from pig farmers (Schodl et al., 2019; Knol et al., 2022; Knap et al., 2023a). For example, Baxter and Edwards (2018) estimated that decreasing pre-weaning mortality by 1% could improve the annual pig meat output per sow by 20 kg. With the increasing attention of society towards animal welfare, the improvement of piglet vitality is crucial.
Since the 1990s, there has been a significant rise in sow prolificacy with an increase of about one extra liveborn piglet per litter every five years, mainly driven by selective breeding (Knap et al., 2023b). Baxter and Edwards showed that in different European and USA pig populations (Baxter and Edwards, 2018), the average number of piglets born alive (NBA) per litter rose from 11-14 in 2006, to 12-16 in 2014. During this period, pre-weaning mortality (PWM) fluctuated between 11-16% without a general downward trend. Additionally, Knol et al. (2022) showed that piglets’ vitality and survival are positively correlated with piglets’ birth weight and negatively correlated with litter size. Piglets weighing less than 1 kg at birth have a significantly higher probability of PWM, and PWM increased linearly from a litter size of 15 piglets (± 10% PWM) to a litter size of 25 piglets (± 20% PWM) (Knol et al., 2022).
Traits related to litter size and piglet survival generally have low heritability estimates ranging from 5-24% (Bidanel, 2011). There is also a genetic antagonistic relationship between litter size and PWM of rg=-0.15 (Bidanel, 2011). However, it is possible to improve both traits simultaneously via selective breeding. In the last decade, most pig breeding companies have adopted a balanced selection approach, aiming to increase litter size while improving piglet weight, vitality and/or survival in their breeding programs (Nielsen et al., 2013; Knap et al., 2023a; Knap et al., 2023b). This balanced approach has been successful in several pig populations, resulting in larger litter sizes and reduced PWM (Knap et al., 2023a; Knap et al., 2023b).
However, individually weighing and scoring of piglets is a costly and laborious process. Smaller pig breeding organizations often lack the resources for such laborious data collection in their breeding program and they would benefit from a practical, relatively easy phenotyping method (Stratz et al., 2016). Previous studies showed that farmers can score litters on an ordinal scale based on piglets’ vitality (Stratz et al., 2016; Klein et al., 2018; Schodl et al., 2019). These vitality scores were estimated to be heritable with estimates ranging from 3% to 14% (Stratz et al., 2016). Moreover, these studies showed that litter-based piglet vitality was genetically favorably correlated to PWM (rg=-0.65) and average weaning weight per litter (rg=0.67) and unfavorably correlated to total number of piglets born (rg=-0.68) and NBA (rg=-0.35). Hence, a litter-based scoring approach might be a suitable alternative to increase piglets’ vitality and decrease PWM via selective breeding. Most research has focused on improving piglets’ vitality and decreasing PWM by selecting maternal pig breeding populations, while few studies focused on the paternal sire line effects on these traits in pig production.
Besides piglets’ vitality and PWM, congenital defects are of concern in pig production. Congenital defects reduce animal welfare, lead to substantial losses in production and often increase the mortality probability (Riquet et al., 2016). Porcine congenital splay leg syndrome (PCS) and scrotal hernias (SH) are some of the most common congenital defects in pigs, with a typical prevalence of respectively 0.2-0.9% and 0.1-1.1% (Riquet et al., 2016). However, in specific populations and in specific periods, these defects can have substantially higher prevalence rates (Riquet et al., 2016).
Piglets affected with PCS exhibit a splayed position of the limbs, mostly affecting the hindlimbs, leading to a severely reduced mobility (Szalay et al., 2001). As a result, PCS is the primary cause of lameness in neonatal piglets (Papatsiros, 2012; Hao et al., 2017). PCS poses serious welfare concerns due to high mortality rates (>50%), by their vulnerability to maternal crushing, and malnutrition due to their inability to access the sow’s teats (Szalay et al., 2001; Riquet et al., 2016). However, if piglets manage to survive, PCS has a transient nature: affected piglets typically recovering within a week after birth with no clinical or histological distinction between affected and non-affected piglets (Schumacher et al., 2021). A low to moderate heritability was estimated for PCS in previous studies with estimated values of h2 = 1 to 20% (Riquet et al., 2016), h2 = 7 to 16% (Holl and Johnson, 2005) and h2 = 21 to 28% (Beissner et al., 2003a).
A scrotal hernia is characterized by the protrusion of the small intestine into the scrotum and is caused by an incomplete closure of the processus vaginalis. This incomplete closure results in an enlarged scrotum, becoming visible within the first weeks of a piglet’s life (Xu et al., 2019). Pigs affected with SH often have a reduced market value as pig farmers are reluctant of castrating such piglets and many slaughterhouses apply penalties for intact male pigs. Moreover, piglets with SH are more prone to infections with an increased probability of mortality (Nowacka-Woszuk, 2021). Estimated heritabilities for SH are low to moderate with estimated values of h2 = 3 to 29% (Riquet et al., 2016), h2 = 22 to 37% (Beissner et al., 2003b) and h2 = 31% (Sevillano et al., 2015).
In this study, we validate a Piétrain sire breeding program on crossbred piglets’ vitality and congenital defects which started in 2019 in Flanders (Belgium). First, we give an overview of the estimated genetic parameters (h2, rg) for these traits. Second, we investigate the evolutions of phenotypical trait scores, as well as evolutions of estimated breeding value (EBV) estimates since the start of the breeding program. Last, litter performance and breeding values are compared with an independently collected dataset with common boars to validate these findings.
This study uses litter data recorded by commercial pig farmers. The data were independently collected via two organizations, both using similar phenotyping protocols.
The first dataset was routinely collected by the VPF (Vlaamse Piétrain Fokkerij vzw, Belgium) for the genetic evaluation of their Piétrain sires. Within their breeding program, data were gathered between 2016 and 2024 on crossbred litters sired by a Piétrain boar and a hybrid dam generated to produce piglets for the station testing of crossbred progeny (Table 1). Within the breeding organization, data were collected at two experimental farms (Farm1 and Farm2) located in Flanders (Belgium). The genetic background of hybrid sows from Farm1 was PIC Camborough® based, whereas hybrid sows from Farm2 were Topigs Norsvin based. Data collection on Farm2 ended in February 2022, while data collection on Farm1 was available up until April 2024 for this study, but is currently ongoing.
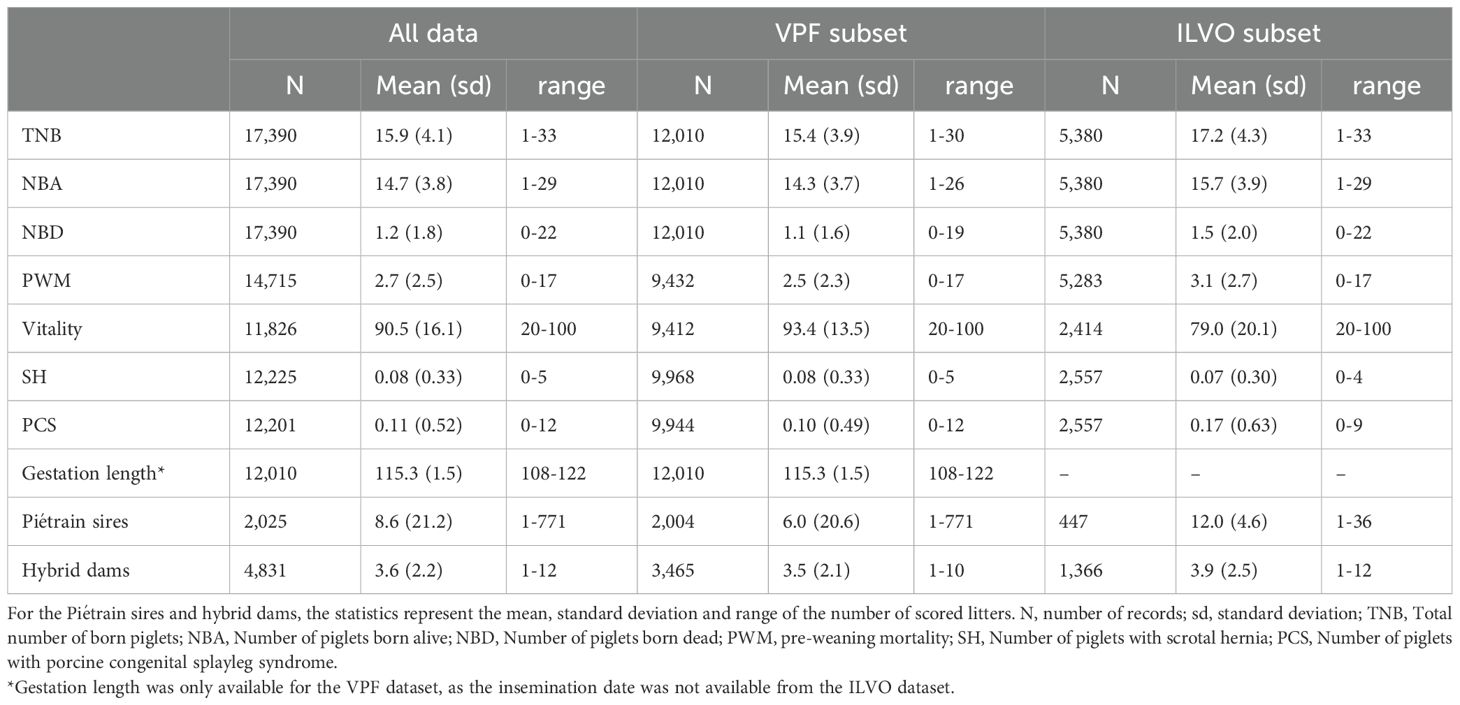
Table 1. Summary statistics of the total dataset and per subset (VPF or ILVO).
The second dataset was routinely collected by ILVO (Flanders Research Institute for Agriculture, Fisheries and Food, located in Melle, Belgium). ILVO coordinates an independent pig testing program to evaluate different terminal sires in Flanders, and is funded by a fixed contribution per slaughtered pig (Van den Broeke et al., 2020) (https://testwerking.ilvo.be/). Within this testing program, litter data were recorded at two farms (Farm3 and Farm4) and data were available for the period 2017 to 2023. Hybrid sows from Farm3 were Topigs Norsvin based, whereas hybrid sows from Farm4 were DanBred based, recently evolving to Topigs Norsvin based. Data collection on Farm3 and Farm4 is currently ongoing. For this study, we had access to all data of litters sired by a Piétrain boar from the breeding organization VPF.
At each of the four farms, the following variables were recorded at the litter level by the farmers: sow ID, boar ID, insemination date (only for Farm1 and Farm2; VPF subset), birth date, weaning date, piglets’ vitality score, NBA, number of male and female piglets born alive, number of piglets born death (NBD), total number of piglets born (TNB), number of piglets cross-fostered to another sow, number of piglets weaned, number of piglets with PCS and number of piglets with SH. Gestation length could only be computed for the VPF dataset (Farm1 and Farm2), as insemination date was not available from the ILVO dataset (Farm3 and Farm4). From these data, the gestation length and pre-weaning mortality were calculated per sow as:
and
Pre-weaning mortality was only computed for litters where no piglets were cross-fostered or for litters where some piglets were cross-fostered to another sow. Pre-weaning mortality of litters receiving extra piglets through cross-fostering were put to missing, as it was not possible with our data to trace the genetic origin of these surplus piglets.
For vitality scores, farmers were trained on a protocol, similar to the one described in Schodl et al. (2019) and which is given in Supplementary Table S1. Vitality scores were given in ordinal scores from 1 (poor vitality) to 5 (good vitality) within 24 hours after birth. Within our study, these vitality scores were rescaled on a scale from 20 to 100 to express them as a percentage. As a result, a vitality score 1 was transformed to 20, whereas a vitality score 5 was transformed to 100. Piglet counts (TNB, NBA, NBD) were made by the farmers within 24 hours after birth. Congenital defects (PCS and SH) were scored within the first week. PCS was scored within the first days after birth, whereas SH was scored when ear tags were applied (<7 days).
The Piétrain boars used for progeny testing were typically young, aged between 8 months and 1.5 years at the time of insemination. On average, they produced 6 litters in the first dataset and 12 in the second (Table 1). This resulted in breeding value accuracies ranging from 50-80%, with a mean of 64.9% and a standard deviation of 8.5%. In dataset 1, some boars were repeatedly used as reference sires to establish genetic connections across rounds, enhancing statistical analysis. This explains the outlier of 771 litters for the most used boar and the large standard deviation in the number of evaluated litters per boar in dataset 1.
Pedigree data was available for 2,025 Piétrain sires included in this study, with a median pedigree depth of 13 generations (range of 2 to 18 generations). In total, 1,280 of these progeny tested sires were also single nucleotide polymorphism (SNP) genotyped using the GGP Porcine 50K chip from Neogen® (USA), as well as 1,595 other, non-progeny tested Piétrain pigs that appear in the pedigree. For the hybrid sows, pedigree was only available for the 3,465 sows in the VPF dataset Farm1 and Farm2), with an average pedigree depth of 3 generations (range of 0 to 7 generations). No genotype information was available for the hybrid sows.
The initial data referred to 22,499 litters but only litters that were sired by a VPF registered Piétrain pig were retained (17,442 litters). Next, litters that missed a value for NBA or with a NBA of zero were removed (17,390 litters retained). The PWM was calculated for these 17,390 litters after this initial quality control. However, PWM was set to missing for litters that received extra piglets (cross-fostering) and for litters where the PWM was calculated to be negative, which should not be possible (14,715 PWM scores retained). A summary of the number of records, the mean, standard deviation and range of the variables of the dataset after quality control is provided in Table 1.
In the next step, information on vitality and congenital defects was checked. Before quality control, 14,156 litters had vitality scores, but some of these were outside the regular boundaries (1 to 5) or were non-integer values (e.g. 4.5) and were set to missing as this was not according to the scoring protocol (12,863 vitality scores retained). Vitality scores were only retained for litters with a gestation length between 112-118 days, because vitality scores were severely impacted in a non-linear way for gestations outside this bound (12,690 vitality scores retained). Similar, vitality scores were considered missing for litters with less than 6 or more than 24 TNB or less than 5 NBA (11,826 vitality scores retained), because vitality scores were severely impacted in a non-linear way for litter sizes outside this bound. In total, 12,201 litters had records for PCS and 12,225 litters had records for SH.
Parity of the sows initially ranged from 1 to 15, but parity numbers >8 were pooled in a remainder group ‘9’ (1,024 records) for statistical analyses. As previously stated, gestation length was only available for the VPF dataset (12,010 records). For statistical analyses, the missing gestation length of ILVO litters were assigned to the median value of 115. We choose this approach, rather than dropping gestation length from the analyses, as the gestation length did significantly impact several traits, such as vitality score, PWM and NBD (Table 2).
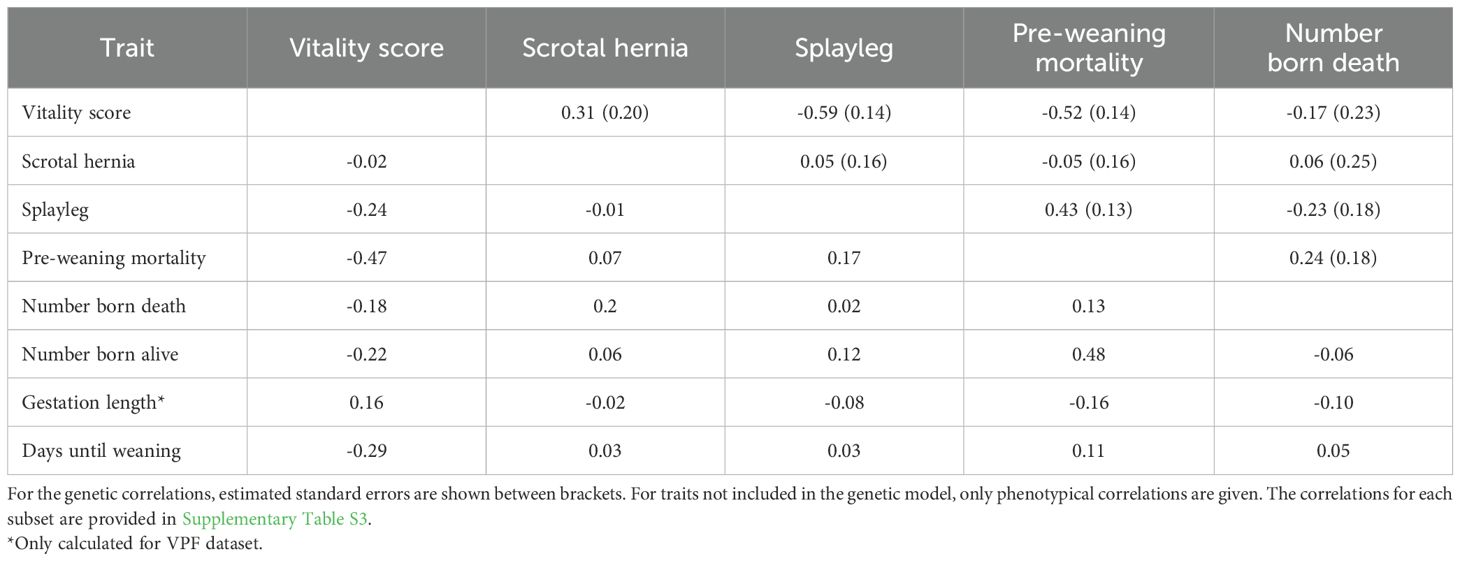
Table 2. Estimated phenotypical Pearson correlations on the litter data (below diagonal) and genetic correlations (above diagonal) for the full dataset.
A new factor was constructed to account for common sow group effects. Litters being born in the same time period (depending on the specific farm sow management batch system) at the same farm were grouped together to account for common sow group effects. Common sow groups with less than 10 litters were merged in a remainder group per farm. This resulted in 562 common sow groups with a median of 25 litters for the complete dataset. Per farm, this resulted in a median value of 47 litters and 198 groups (Farm1), 21 litters and 105 groups (Farm2), 19 litters and 143 groups (Farm3) and 26 litters and 116 groups (Farm4).
Genetic parameters were estimated with the remlf90 software (Misztal et al., 2014) using single-step genomic prediction (OPTION SNP_file). A five-trait sire-dam genetic model was used with vitality score, SH, PCS, PWM and NBD as traits. This sire-dam model was chosen, as it allows separate estimates of the sire genetic effect, while still correcting for the dam’s maternal and genetic effects. As there only is a genetic link between the sire and its progeny, this method allows accurate estimates of these genetic effects. This is more complex with an animal model, as we are dealing with litter records from which it is hard to disentangle genetic dam effects from maternal effects and environmental effects.
The estimated sire-dam models were of the form:
Here, y is the vector with phenotypes; b is a vector with the fixed effects and covariates, which differ between traits. The fixed effects were parity of the sow (9 levels; all traits) and farm (4 levels; all traits). The covariates were gestation length (all traits), NBA (for vitality score, PCS, PWM, NBD), number of liveborn male piglets (for the trait SH) and time in days until weaning (for the trait PWM); a is a vector containing additive genetic sire effects (8227 animals in the sire pedigree of which 2875 with genotype information) with the assumption that a follows a normal distribution for the H matrix (Legarra et al., 2009; Aguilar et al., 2010; Christensen and Lund, 2010), using single-step genomic evaluation with both pedigree (A) and genomic (G) relationship matrices: . is a vector containing additive genetic dam effects (5240 animals in the dam pedigree, no genotype information), with the assumption that follows a normal distribution for the pedigree (A) relationship matrix: . c is the vector of common sow group effects (562 levels), following a normal distribution , where I is the identity matrix; e is the vector of residual effects assumed to follow a normal distribution ; X, Z, Y and W are incidence matrices for respectively fixed effects, random sire effects, random dam effects and random pen effects.
The heritability (h2) was calculated as four times the ratio of additive genetic sire variance ( divided by the total variance ( (King and Henderson, 1954):
Dam genetic and maternal effects (d2) were expressed as the ratio of variance explained by dam (d) divided by the total variance:
Common sow group effects (c2) were calculated as the ratio of variance explained by common sow groups (c) divided by the total variance:
Standard errors of genetic parameters were approximated using the same models in airemlf90, as these standard errors cannot be calculated within the remlf90 program.
Next, we estimated genetic correlations (rg) for same trait between both datasets (VPF versus ILVO) via bivariate sire-dam models. Litters with no observation in any dataset for a given trait, were removed for these analyses. Genetic correlations were estimated as follows:
Here, y1 and y2 represent vectors with phenotypes for the trait measured in the VPF (1) or ILVO (2) subset; b1 and b2 are vectors containing fixed effects and covariates; a1 and a2 are vectors of additive sire genetic effects, assumed to follow a normal distribution for the H matrix using single-step genomic evaluation:
d1 and d2 are vectors of additive dam genetic and maternal effects containing rows and columns for dams from both datasets, assumed to follow a normal distribution for the D matrix with no covariance structure, as sows from both datasets could not be linked through pedigree:
c1 and c1 are vectors of common sow group effects, assumed to follow a normal distribution for the identity matrix I with no covariance structure, as common sow group effects could not be linked across subsets ; e1 and e2 are vectors of residual effects, assumed to follow a normal distribution for the identity matrix I with no covariance structure ; X1, X2, Z1, Z2, Y1, Y2, W1 and W2 are incidence matrices for fixed effects, random animal effects and random common sow group effects, respectively.
Recorded phenotypes and EBVs were compared between the two independent datasets (VPF versus ILVO) which are connected by 426 common boars, i.e. with at least one litter in both datasets. The EBVs were scaled to a mean of 120 with a standard deviation of 20 as follows per trait (i) and animal (j):
Here, the ‘sign’ denotes if a trait was considered as favorable or unfavorable. The sign was ‘+1’ for vitality score, whereas it was ‘-1’ for SH, PCS, PWM and NBD. As a result, pigs with an EBVi,j,scaled >120 were considered to perform better than the population average, i.e. they are estimated to have a higher vitality, less SH, less PCS, less PWM and less NBD than the population average. The mean and the standard deviation of EBVs within this formula, i.e. mean(EBVi) and sd(EBVi), were calculated based on the EBVs of the sires that were born in the last 4.5 years (~1.5 pig generation) to account for selection effects within the population over time. Although rescaling EBVs is not required for these analyses, we opted to use the rescaled EBVs to align with the current breeding value system employed by the breeding organization. However, this scaling did not influence the outcome of the analyses.
A breeding value index for these farrowing house traits was calculated using the following formula, which corresponds to the index used by the Piétrain breeding organization:
To mimic this breeding value index, the following ‘phenotypical’ index was calculated after scaling all phenotypes from unfavorable (0) to favorable (+100) as:
As a result, litters could score a minimum of 0 and a maximum of 100 on this indexphen. A maximum score for indexphen was obtained in the case a litter had zero SH, zero PCS, zero PWM and a maximum vitality score. Within the context of this study, it is important to note that the trait PWM was only included in the index since the beginning of 2024. From 2019 to 2024, the index only included the traits vitality score (25%), SH (30%) and PCS (35%).
Statistical analyses were done in R (R Core Team, 2020). Phenotypic Pearson correlations of the investigated traits were calculated by correlating the mean value per sire per dataset using the cor() function in R. As we used mean values per sire, we opted to only do this for sires with at least three litters in both datasets (419 common boars). Breeding values were correlated for the 426 common sires between datasets. To evaluate the evolution of phenotypes in time, phenotypes were linearly regressed on birth year using the lm() function in R, correcting for the same fixed effects and covariables as specified in the genetic modeling. To visualize phenotypic evolutions in time, the mean trait value was calculated per trimester of a given year, i.e. January-March, April-June, July-September and October-December. To evaluate the evolutions of EBVs, rescaled EBVs were linearly regressed on birth year using the lm() function. Evolutions were analyzed from 2019 on, as the breeding organization has only started its breeding program on these traits in that year.
It was impossible to directly compare our dataset with records at the litter level with production values that were obtained at the individual level or at the pen level after mixing piglets of different litters. However, the EBVs of the studied farrowing house traits could be correlated with EBVs calculated for production traits.
The EBVs of production traits were estimated based on a subset of the piglets from the scored litters: per progeny tested Piétrain boar, 20 to 26 piglets were selected for progeny testing in the finishing phase. These piglets were individually weighed at the start of the finishing phase (± 75 days old and weighing ±25 kg). Piglets were divided into two mixed-sex pens of 13 pigs in the finishing phase and these pens consisted thus of a combination of full-sibs and half-sibs. Feed intake was recorded at the pen level. The pigs were slaughtered at a mean age of 191.0 days and had a target fastened slaughter weight of 115-120 kg. At the slaughterhouse, hot carcass weight and slaughter quality traits were individually recorded. A detailed overview of the data collection in the finishing pigs can be found in Gorssen et al. (2024).
Based on these data, EBVs were calculated for the average daily gain from birth until start of finishing phase (ADGyouth), the average daily gain from birth until slaughter (ADGlife), feed conversion ratio, average daily feed intake and carcass quality. These EBVs were also rescaled with a mean of 100 and a standard deviation of 20, and were combined in a production index. In total, 1763 Piétrain boars were both progeny tested with information on litter traits as well as finishing pigs’ production traits. The EBVs of these progeny tested boars were correlated using Pearson correlations as described above.
Table 3 gives an overview of the estimated genetic parameters. The heritability estimates were low but significantly higher than zero. The PCS had highest heritability (h2 = 15.6%), followed by SH (h2 = 12.2%), PWM (h2 = 11.8%), vitality score (h2 = 8.1%) and NBD (h2 = 5.2%). Maternal and genetic dam effects explained the most variance for NBD and PWM (d2 = 17.9% and 17.0%), whereas they were lowest for SH (d2 = 7.1%). Common sow group effects explained 1.4 to 2.9% of total variance.
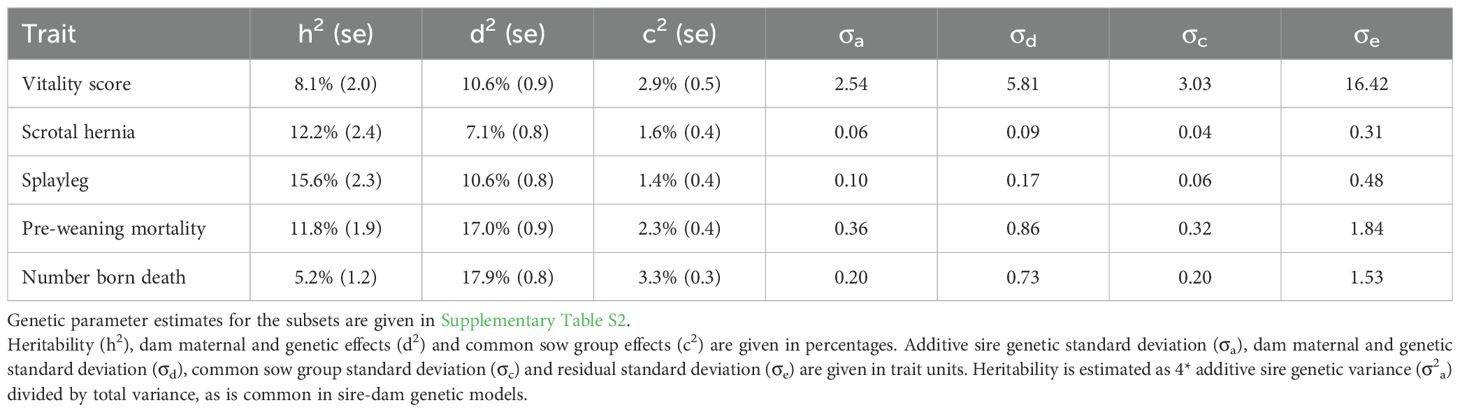
Table 3. Genetic parameter estimates estimated from the full dataset (ILVO and VPF combined).
Table 2 gives an overview of the phenotypic Pearson correlations on the litter data (rp; below diagonal) and the estimated genetic correlations (rg; above diagonal) between traits. Vitality score and PWM were negatively correlated (rp=-0.47; rg=-0.52). Moreover, PCS had low to moderate correlations with vitality scores (rp=-0.24; rg=-0.59) and PWM (rp=0.17; rg=0.43). A higher vitality score directly after birth is hence low to moderately associated with a lower PWM and less PCS. Remarkably, our results indicate a low, but positive genetic correlation between vitality scores and SH (rg=0.31), which was also found when analyzing the datasets separately, although standard errors were high for the ILVO subset (rg=0.35 with se=0.23 for VPF subset and rg= 0.14 with se=1.32 for ILVO subset; Supplementary Table S3). Moreover, in the ILVO subset, SH was negatively correlated with PWM (rg= -0.30; se=0.47) and NBD (rg= -0.67; se=0.67), indicating that an increase in SH was genetically correlated with less PWM and less NBD. The NBA was phenotypically negatively correlated with vitality score (rp=-0.22) and positively correlated with PWM (rp=0.48), indicating that larger litters are associated with reduced vitality scores and more PWM. Gestation length was lowly correlated with vitality score (rp=0.16) and PWM (rp=-0.16).
The correlations of the EBVs for the farrowing traits with EBVs from production traits for progeny tested Piétrain boars (N=1763) are provided in Supplementary Figure S1. The EBV index of farrowing traits was lowly, but favorably correlated with the EBV index of production traits (r=0.09). In general, all correlations between farrowing trait EBVs and production trait EBVs were low (r=-0.21 to 0.10). However, there was a low, unfavorable correlation between EBVs for ADGyouth and PWM (r=-0.16) and ADGlife and PWM (r=-0.21), as well as between EBVs for ADGyouth and NBD (r=-0.10) and ADGlife and NBD (r=-0.14).
An overview of phenotypic trait evolutions from 2019 to 2024 for all data is given in Figure 1. In general, all traits showed a favorable evolution, with an increase in indexphen and piglets’ vitality scores in time and a decrease in the prevalence of PWM, SH, PCS and NBD. Similar trends were observed when looking at the subsets of VPF and ILVO (Supplementary Figures S2, S3).
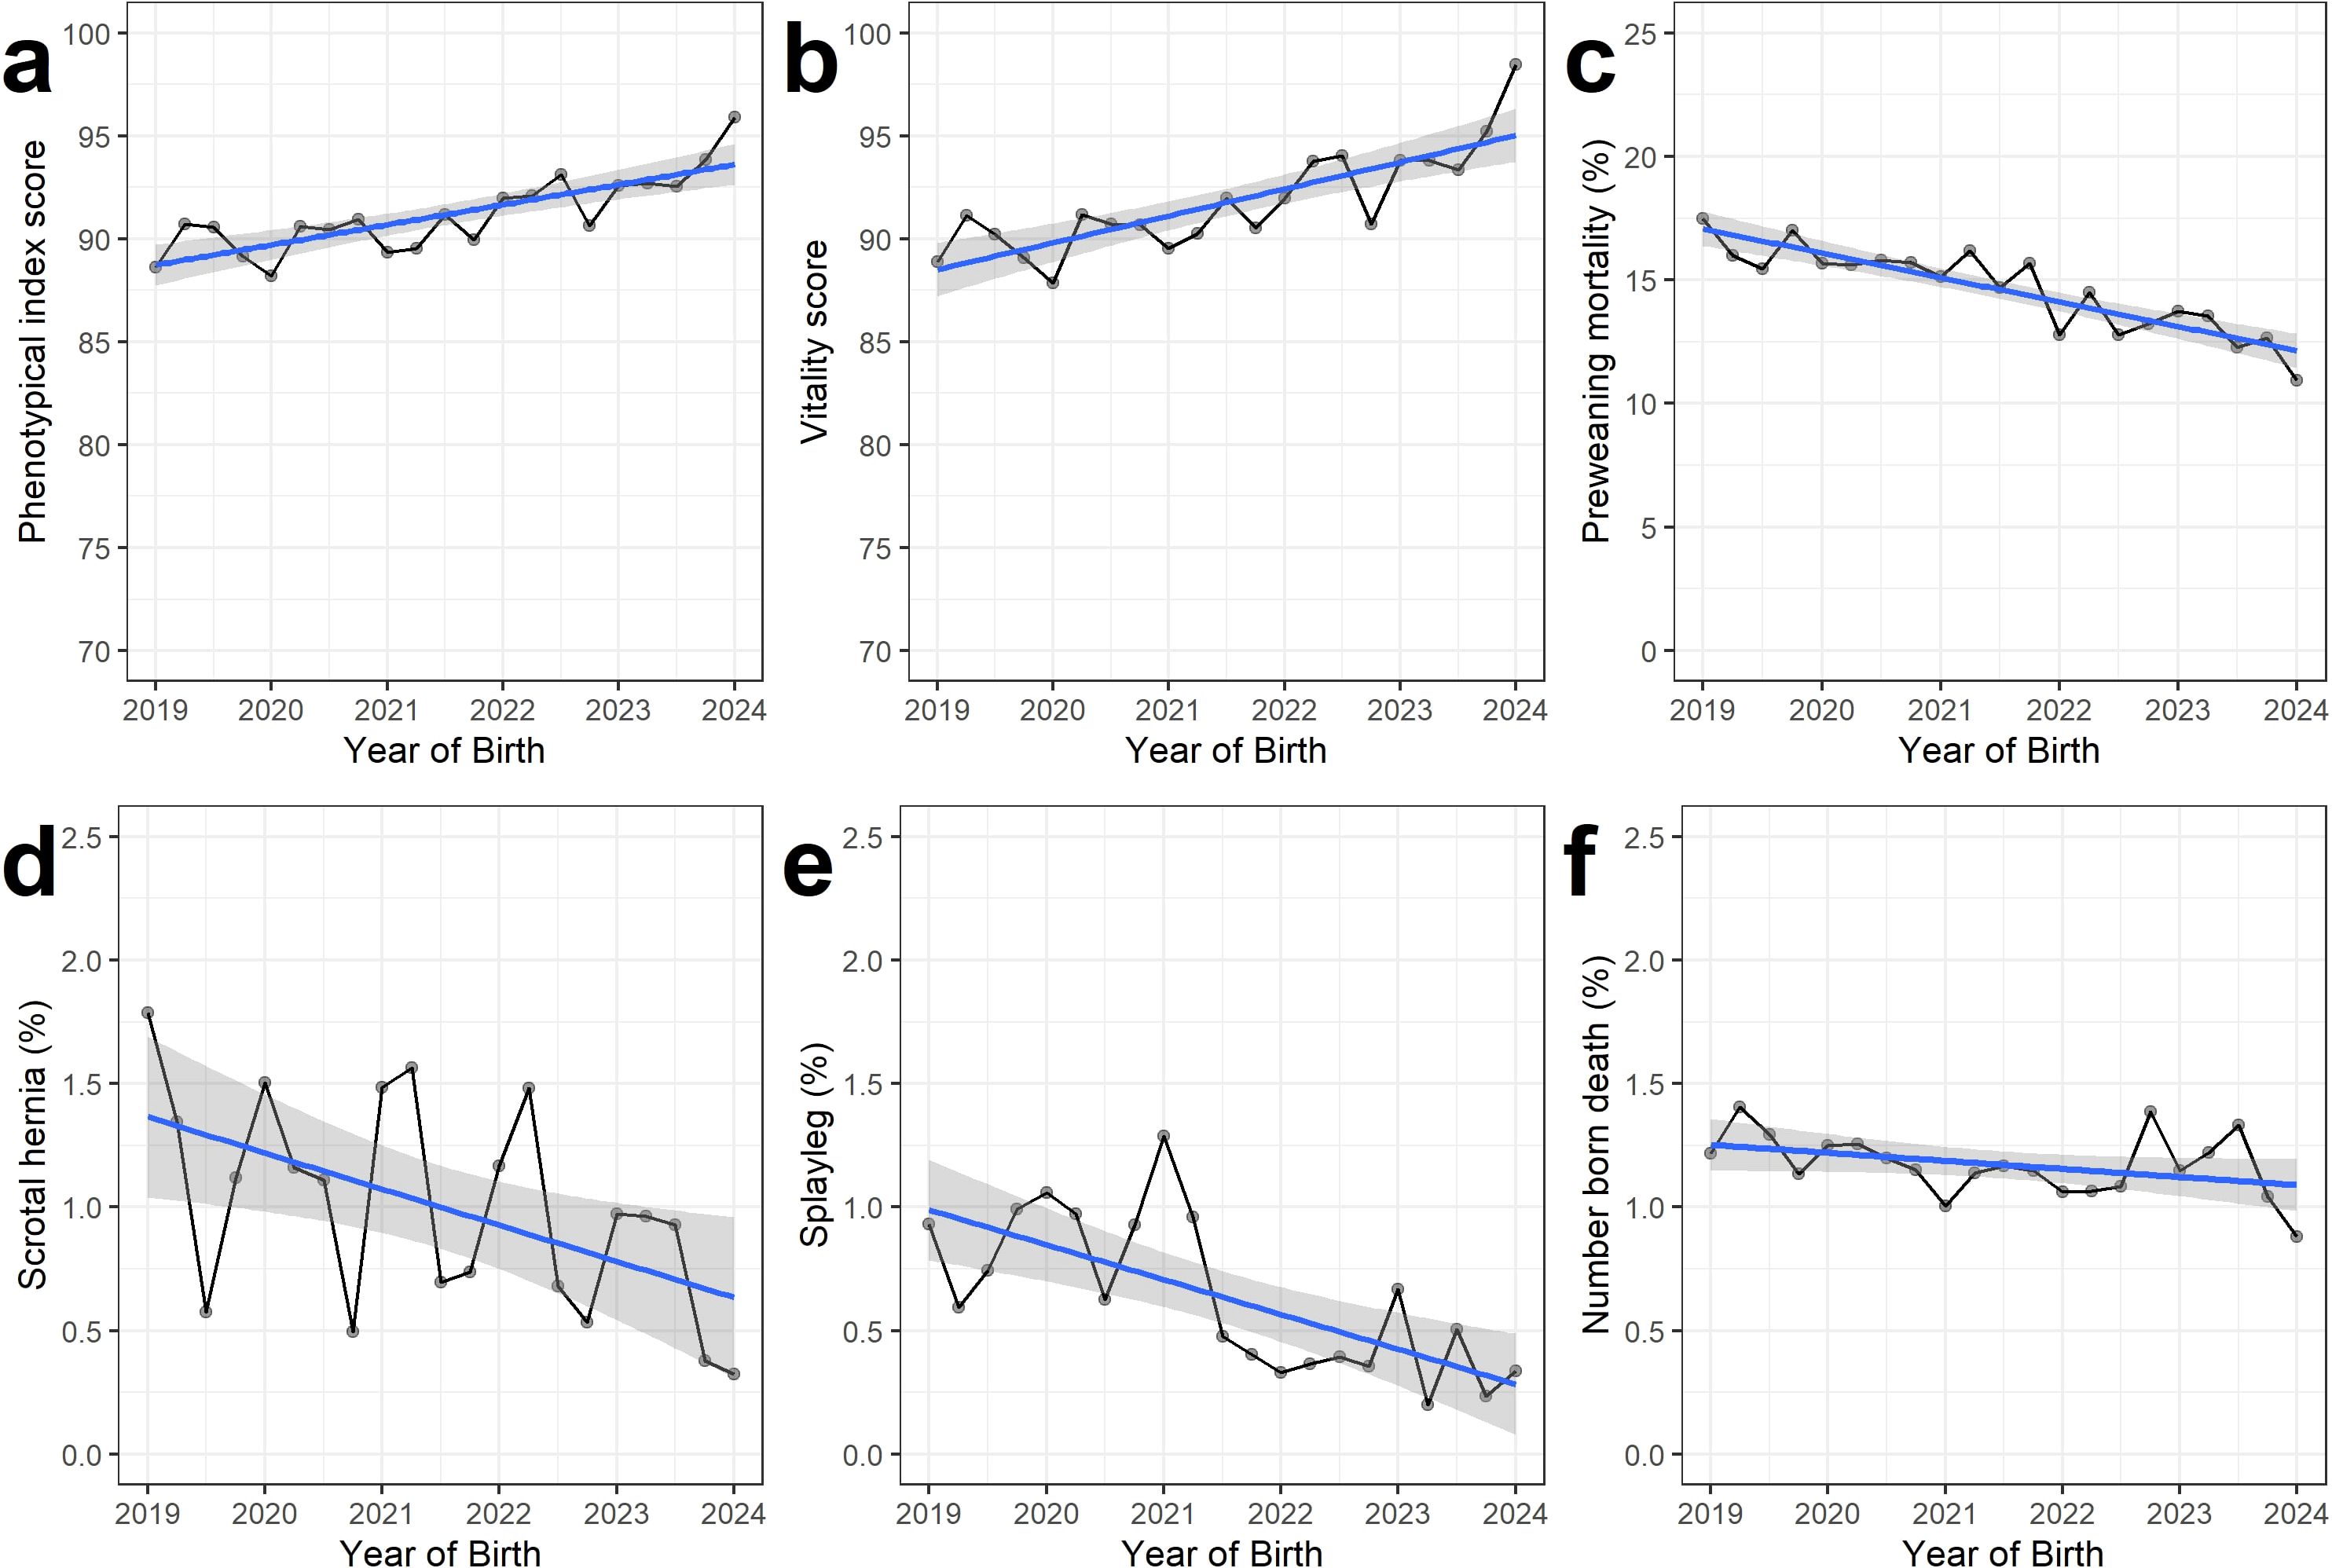
Figure 1. Phenotypic evolution for the combined phenotypical index (A) and the five farrowing traits (B–F) for all data. The mean value of all litters was calculated per trimester (January-March; April-June; July-September; October-December) per year. These phenotypic evolutions were evaluated for litters between 2019 and 2024, as the breeding program started in 2019. The phenotypical evolutions per subset are shown in Supplementary Figures S2, S3.
Table 4 reports the regression coefficient for birth year between 2019-2024, while correcting for the same fixed effects and covariables as explained in genetic modeling. After accounting for these environmental effects, we observe a highly significant effect of the year of birth for the indexphen, vitality score PCS and PWM. Over the 5-year period, the indexphen was estimated to increase with 0.53 points per year when considering all data, with on average +0.62 more vitality points scored per year, -0.024 less PCS piglets born per litter per year and -0.096 less piglets that died before weaning per year. These trends were also observed when analyzing both datasets independently. When comparing estimated effect sizes per year of birth over both subsets, it is noticeable that SH does seem to significantly decrease over time in the ILVO subset, while there is no observed effect in the VPF subset.
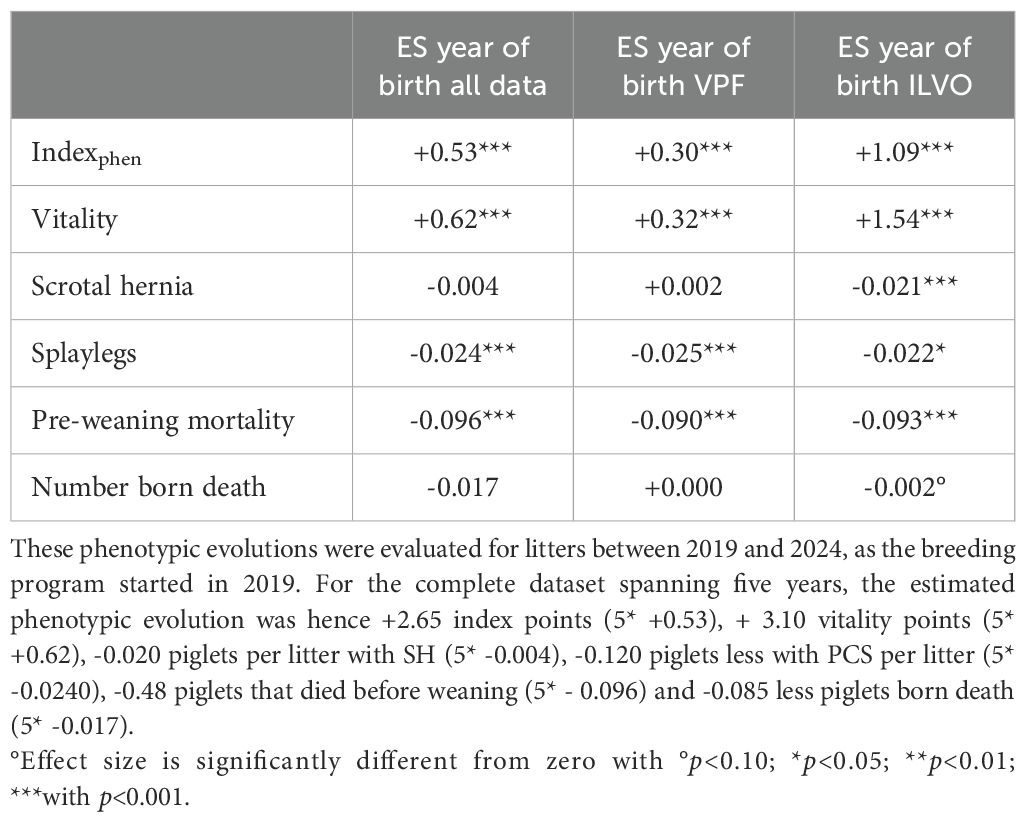
Table 4. Effect size (ES) estimates after linear regression of trait phenotypes in function of year of birth, while correcting for the same fixed effects and covariates as specified in genetic modeling.
The evolution of EBV of Piétrain sires born between 2016 and 2023 is given in Figure 2. The selection index and all traits except NBD showed a favorable evolution in time. For NBD, the evolution of EBVs was slightly negative.
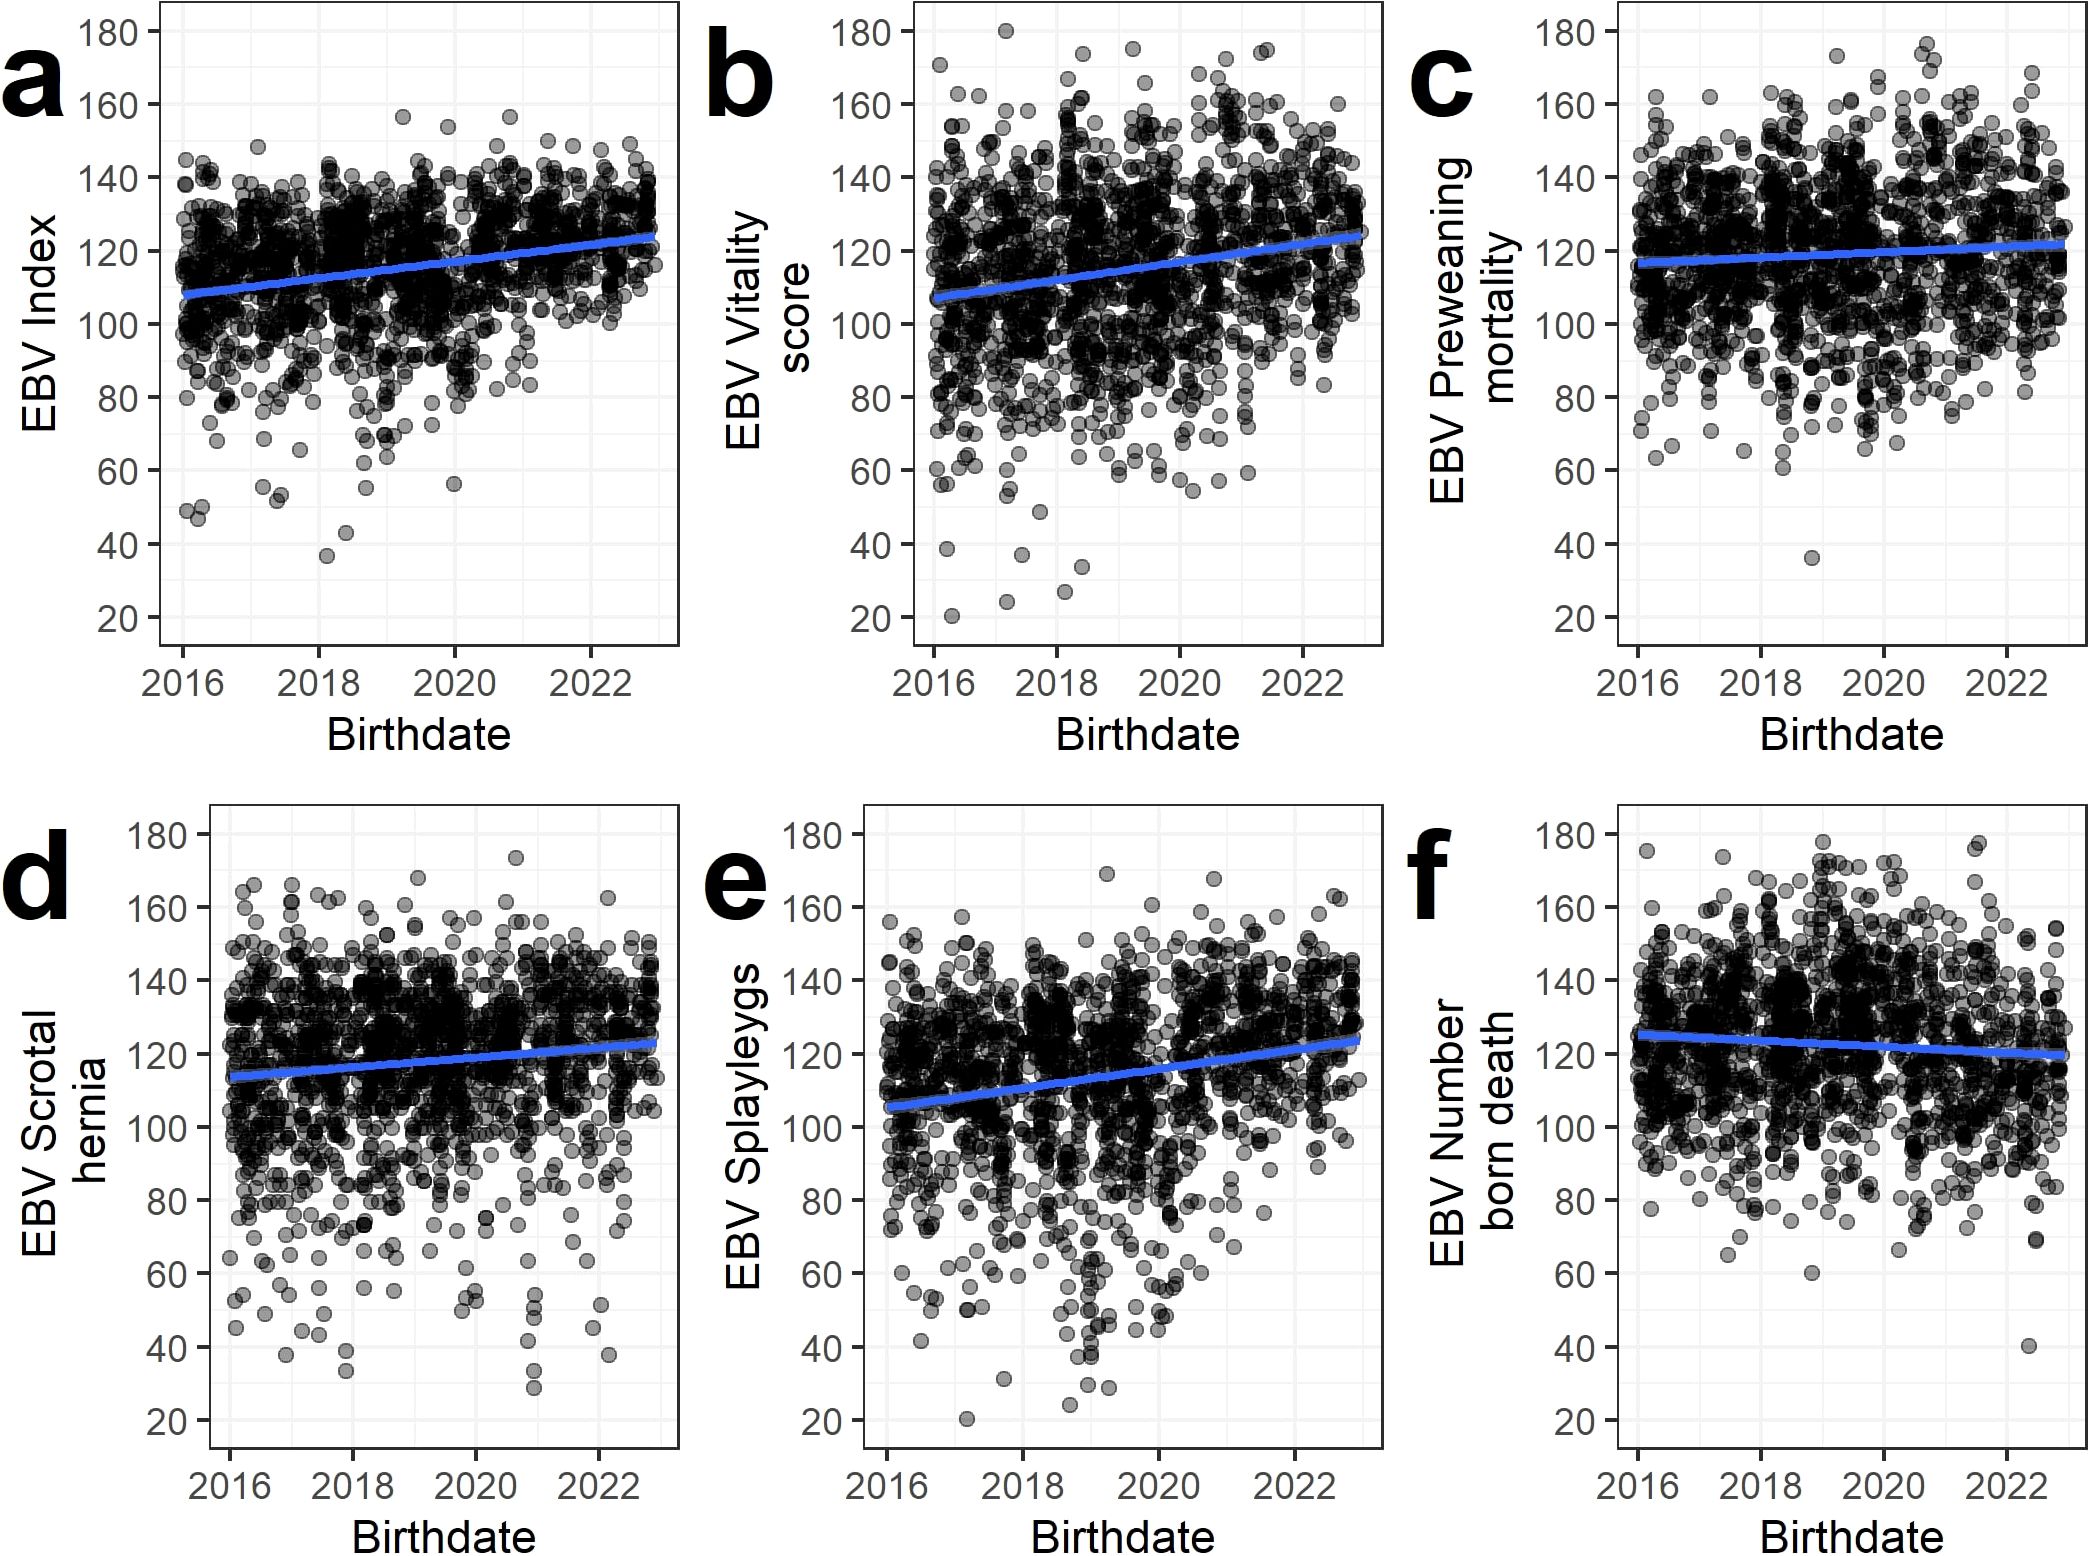
Figure 2. Evolution of the estimated breeding values (EBV) of progeny tested Piétrain sires born between 2016 and 2023 for the the combined index (A) and the five studied traits (B–F) for all data. The estimated linear regression line is shown in blue. The estimated breeding value evolutions per subset are shown in Supplementary Figures S4, S5.
Table 5 gives effect sizes estimates for these EBV evolutions per year of birth of progeny tested Piétrain sires born between 2019-2023. From 2019 on, all traits except NBD show a highly significant increase in EBVs. This increase started to become significant for boars born in 2018. Hence, these boars were selected for progeny testing from 2019 on, the year the breeding program effectively started. Compared to Piétrains born in 2016, the combined index has risen with +13.82 index points for progeny tested Piétrains born in 2022, equivalent to an increase of 0.69 standard deviations (13.82/20). The trait NBD did not show such an increase and even decreased over time for Piétrain sires.

Table 5. Effect size (ES) estimates after linear regression of estimated breeding values in function of year of birth of progeny tested Pié train sires as a fixed effect.
Table 6 gives an overview of pairwise Pearson correlations for all mean phenotypes per sire for the studied traits. In total, there were 419 boars with at least three litters in each dataset used for these analyses. The diagonal of Table 6 shows the within-trait correlations. Here, the indexphen (rp=0.18) and PCS (rp=0.28) are highly significantly correlated across both datasets (p<0.001). Given an estimated heritability of h2 = 15.6% for PCS, the maximum expected phenotypic correlation could be estimated as . The observed rp of 0.28 could hence be interpreted as a selection accuracy of 71.8% (0.28/0.39). Moreover, mean vitality scores (rp=0.12) and mean PWM (rp=0.13) per boar were also significantly correlated across datasets, with selection accuracy estimates of 42.2% and 37.8%, respectively. These results indicate that the recorded performance of the piglets’ of these Piétrain boars is translatable across the two testing systems for the indexphen, vitality scores, PCS and PWM. For NBD, no association was found between both datasets (rp=0.00).
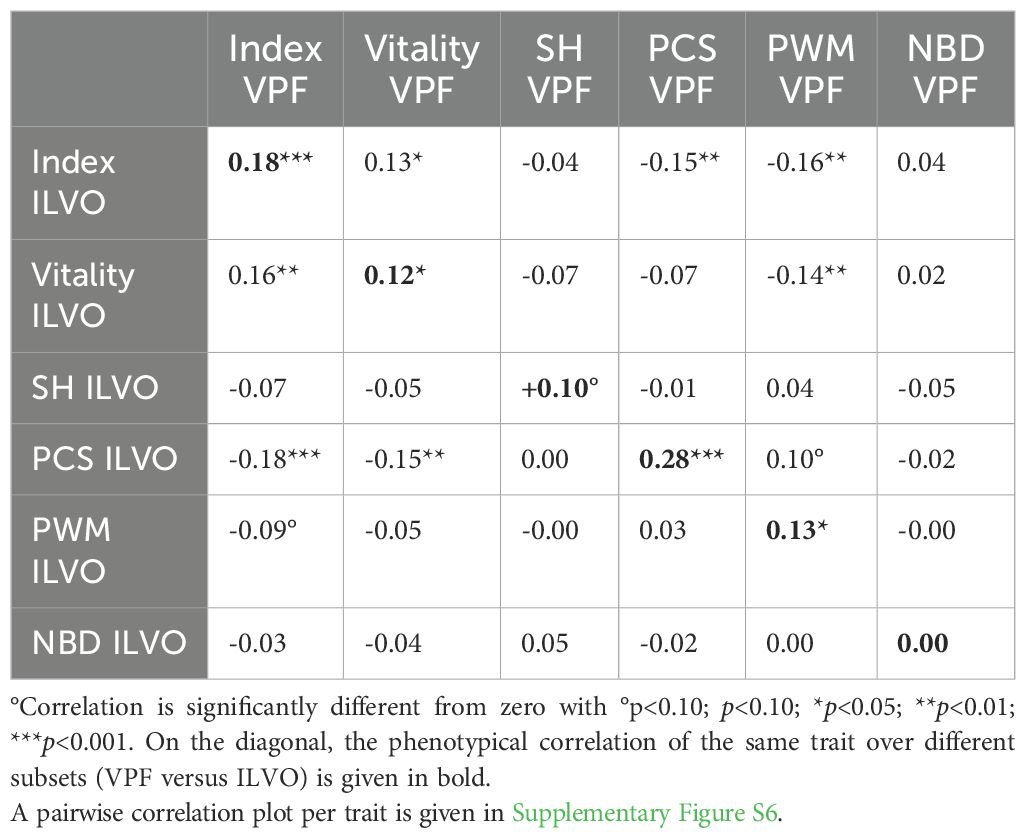
Table 6. Phenotypical correlations of mean trait value per sire per dataset for sires with at least three litters in each dataset (419 common boars).
Mean indexphen scores per boar were favorably and significantly associated with vitality scores (rp=0.13 to 0.16), PCS (rp=-0.15 to -0.18) and PWM (rp=-0.09 to -0.16) across subsets. Furthermore, it is noteworthy that higher litter vitality scores in one subset, were favorably associated with PCS (rp=-0.07 and rp=-0.15) and PWM (rp=-0.14 and rp=-0.05) in the other subset.
In Table 7, the estimated genetic correlations within the same trait over subsets are shown. These correlations are in line with our previous findings that mainly the index, PCS and PWM are translatable across subsets with moderate to high genetic correlations for these traits (rg=0.39 to 0.84). The traits vitality score, NBD and SH had low genetic correlations across subsets (rg=0.09 to 0.44), although the estimates were consistently positive.
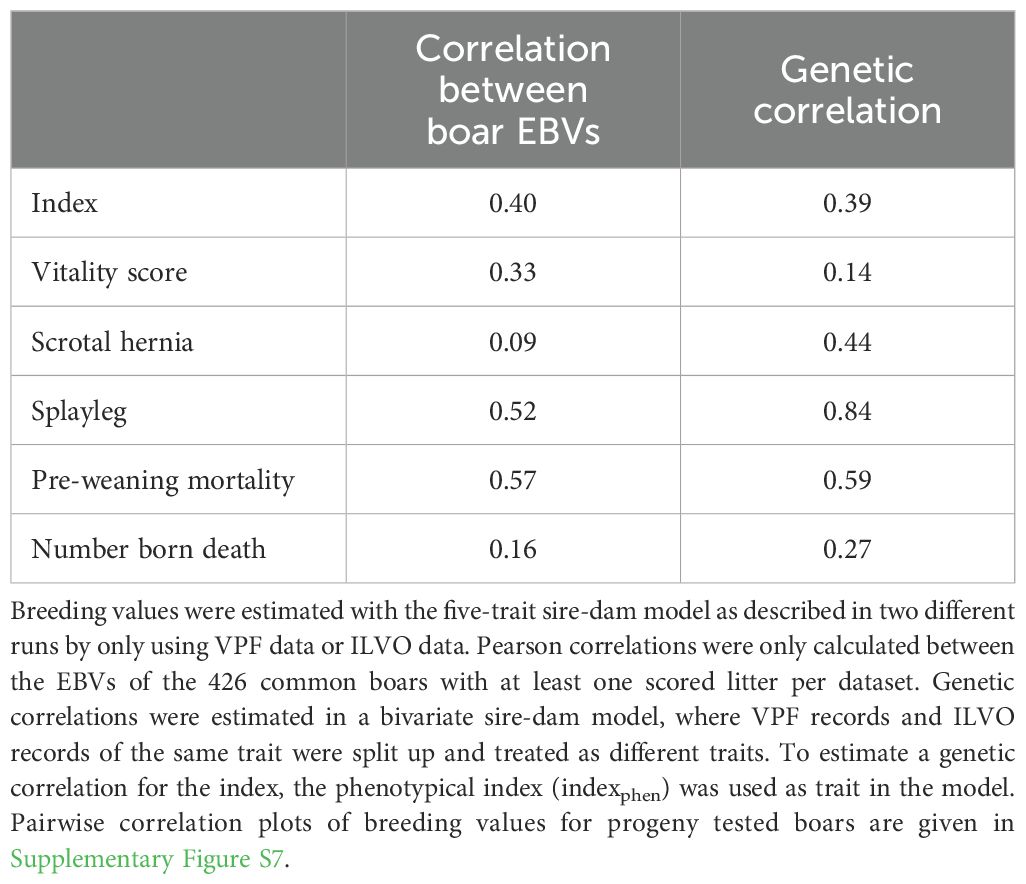
Table 7. Pearson correlation of estimated breeding values (EBV) and genetic correlation between VPF and ILVO dataset.
In this study, we validated a paternal Piétrain pig breeding program that started in 2019 to improve crossbred piglets’ vitality and decrease the prevalence of congenital defects. To this end, we had two datasets of crossbred litter data collected independently by two independent organizations but with 426 common sires. Based on these data, we estimated low heritabilities for vitality score, PCS, SH, PWM and NBD (h2 = 5.2 to 15.6%), with low to moderate favorable genetic correlations between vitality scores and PCS (rg=-0.59), and between vitality scores and PWM (rg=-0.52). Moreover, the trend of the recorded phenotypes per season and the evolution of EBVs for these traits since 2019 suggest that the breeding program is beneficial for piglet survival and congenital defects. The estimated phenotypic increase of the selection index over the studied period is +2.65 points with a significant and favorable impact on piglets’ vitality score (+3.10 points), PCS (-0.12 piglets per litter) and PWM (-0.48 piglets per litter). Comparison of datasets showed that genetic correlations were consistently positive (rg=0.09-0.84), showing that EBVs for terminal sires are translatable to new farms. In conclusion, these results show that paternal pig breeding programs can be effective in improving piglets’ vitality and decreasing congenital defects in crossbreds.
The heritability estimates for the five studied traits were low (h2 = 5.2 to 15.6%), but significantly higher than zero and in the expected range for traits related to piglet survival and congenital defects of about h2 = 1 to 30% (Bidanel, 2011; Riquet et al., 2016). For litter vitality score, we found heritability estimates for the full dataset of h2 = 8.1% and for the subsets between h2 = 7.4% and 10.4%. These findings are in line with previous studies reporting heritabilities of h2 = 3% and 7% (Stratz et al., 2016), h2 = 11% (Schodl et al., 2019) and h2 = 14% (Klein et al., 2018). These studies used similar ordinal scales to score vitality at the litter level, but were collected in different populations and production systems. Moreover, Schodl et al (Schodl et al., 2019). found a favorable genetic correlations of rg=-0.65 between vitality scores and PWM, which is similar to our findings (rg=-0.52 for full dataset, rg=-0.30 and -0.66 for subsets).
The reported heritabilities for SH (h2 = 12.2%) and PCS (h2 = 15.6%) fall in the range of the reported heritabilities of h2 = 3 to 37% for SH (Beissner et al., 2003b; Sevillano et al., 2015; Riquet et al., 2016) and h2 = 1 to 29% for PCS (Beissner et al., 2003a; Holl and Johnson, 2005; Riquet et al., 2016). Within this study, SH showed a remarkable, unfavorable genetic correlation of rg=0.31 with vitality score, implying that litters with more piglets affected with SH are associated with a higher vitality score. This finding was unexpected, and no evidence was found for this in literature. Although this correlation is low and not significantly different from zero, it was estimated to be positive in both subsets, albeit with large standard errors (rg=0.14 and 0.35). Therefore, we advise future pig breeding programs on piglet vitality scores to take this possible unfavorable relationship into account.
PCS is known to cause very high mortality within affected piglets (>50%) (Szalay et al., 2001; Riquet et al., 2016). This relationship was also seen in the estimated genetic correlation between PCS and PWM (rg=0.43) and between PCS and vitality score (rg=-0.59). Although we have no individual information on the survival probability of affected PCS piglets in our study, these results do indicate that litters with PCS piglets show more mortality. Hence, actively breeding against PCS might be an efficient way to also reduce PWM substantially in pigs, and vice versa. In addition, Holl and Johnson (2005) reported a genetic correlation of rg=0.32 between PCS and NBA, which is in line with our phenotypic correlation of rp=0.12. Moreover, we also previously estimated a genetic correlation of rg=0.34 between PCS and NBA (results not shown). However, within this study causality could not be investigated.
Heritability estimates for PWM (h2 = 11.8%) and NBD (h2 = 5.2%) were in the range of h2 = 5 to 24% reported by Bidanel (2011). Both traits had the highest estimate for the dam maternal and genetic effects (d2 = 17.0 and 17.9%), indicating that the sow plays an important role in piglet survival at birth and during the first weeks of life (Bidanel, 2011; Knol et al., 2022). The combination of the low heritability and the relatively large dam effects for NBD indicate it is hard to improve this trait by selective breeding on the paternal sire line. This is also evidenced in the low phenotypic and genetic correlations across both subsets for NBD (rp=0.00; rg=0.16-0.27). The PWM was initially also not included in this EBV index, but was included at the beginning of 2024. This was done because PWM did show good translatability between both datasets (rp=0.13; rg=0.57-0.59) and is an economically important trait with a big impact on piglet welfare (Baxter and Edwards, 2018; Knap et al., 2023b).
The observed evolution of the phenotypic records and EBVs from 2019 on was generally favorable, with an observed increase and significant effect size estimate for index points (+2.65 points) and piglet vitality score (+3.10 points), and a decrease in PCS (-0.12 piglets per litter) and PWM (-0.48 piglets per litter) (Figure 1). These observed effect sizes were not only statistically significant, but also biologically relevant given the mean trait values (Table 1) and observed prevalence. For PCS, for example, the prevalence roughly halved from ±1% in 2019 to ±0.5% in 2024. Although this reduction might seem marginal, it can have a big positive impact on the welfare and lives of thousands of pigs. In Flanders, for example, roughly ten million piglets are born yearly. Extrapolating this reduction in prevalence means a reduction of 50,000 piglets affected annually by this congenital disorder. The PWM decreased from ±17% in 2019 to ±14% in 2024. As estimated by Baxter and Edwards, decreasing the prevalence of pre-weaning mortality with 1% could improve the annual pig meat output per sow by 20 kg and production costs per kg carcass decrease with a decrease in PWM (Baxter and Edwards, 2018). As noted before, it is not possible with our data to attribute these gains solely to genetic gain achieved via the Piétrain breeding program. Indeed, we do not know if genetic improvements were made simultaneously for these traits in the dam lines or if management improved. Interestingly, Figure 1 also shows quite some seasonal variations. For example, the observed values seem to be peaking in spring and summer, and decreasing in autumn and winter for indexphen, vitality scores, PCS and SH. This finding indicates that seasonal variations also impact these traits, but this was out of the scope of the present study.
Although we cannot prove causality between the observed improvements and the paternal breeding program, it is striking to observe that the largest gains were made for piglet vitality and PCS, which had a substantial weight in the breeding program’s selection index from 2019 on. Moreover, this favorable evolution was observed in both subsets, in which farms used different dam lines. Therefore, the results strongly indicate that the sire breeding program was effective in increasing the crossbred piglets’ vitality and decreasing the prevalence of PCS. As PWM was not included in the breeding program before 2024, the observed gains (Figure 1; Table 4) are probably due to correlated genetic responses, for example via selection on piglet vitality (rg=-0.52) or PCS (rg=0.43) or due to genetic improvements of dam lines and/or management techniques in the studied period. As a result, we hypothesize that the prevalence of PWM will further decline in the coming years, as PCS has recently been included in the breeding goal with a substantial weight. Knap et al. (Knap et al., 2023b) have previously shown that balanced breeding can substantially reduce the prevalence of PWM in maternal lines. In this study, we provide evidence that also paternal pig breeding programs can be effective in reducing PWM and PCS in crossbred litters, and simultaneously improve vitality scores.
For SH, the impact of the breeding program was ambiguous: although EBVs increased via selection (+9.46 points), there was only a significant downward evolution seen in the prevalence of SH within the ILVO subset. It was previously noted by Xu et al. (2019) that conventional phenotypic selection is not effective in decreasing the incidence of SH. However, there clearly is a genetic component associated to SH in pigs. Therefore, we hypothesize that SH might have a more non-additive, complex genetic background in pigs. For NBD, there was no significant evolution both in phenotypic records as in EBVs, probably because this trait was not included in the combined index of the breeding organization and has a low (paternal) heritability and low genetic correlations with the other traits.
Although our study revealed interesting findings, there were a few limitations. First, it is not possible to confirm a causal relationship between the sire breeding program and the observed evolutions in the phenotypes with the available data. Improvements or alterations in dam genetics and/or management might have resulted in this favorable evolution as well. However, comparative analysis indicated at least some level of a causal genetic relationship. The genetic correlations were positive between both subsets (rg=0.09-0.84), but deviated substantially from 1, suggesting that genotype by environment interactions might also play an important role in these traits (Wallenbeck et al., 2009). Moreover, vitality scores and PCS show the greatest improvements in time, and these traits were included in the breeding program since the start in 2019. A second limitation is that the phenotypes were recorded by pig farmers and not by dedicated persons, such as technicians or veterinarians. As a result, the interpretation of piglets’ vitality scores or the diagnosis of SH and PCS might vary across farms. This difference in scoring might be evident in the vitality scores: the mean vitality score was ±90-95 in the VPF subset versus ±85-90 in the ILVO subset (Supplementary Figures S2, S3). However, farmers received initial training on a uniform protocol and our results indicate that these pig farmers are qualified to evaluate and score litters in a sensible way. Nevertheless, an automated and more objective scoring system might be able to improve genetic gain and translatability across farms. A third limitation is that only conventional Flemish (Belgian) pig farms were studied. It would be interesting to see if these EBVs would also be translatable to alternative (organic) pig farming systems, to further evaluate the effect of genotype-by-environment interactions for these traits. The studied traits are highly valuable for organic pig farming, where mortality rates are usually higher than in conventional systems (Zaalberg et al., 2022b). Moreover, it is hard to set up a breeding program within an organic environment (Zaalberg et al., 2022b; Zaalberg et al., 2022a). Therefore, a positive genetic correlation between conventional and organic systems would indicate that the EBVs of such a breeding program would also be translatable to organic pig farming.
The present study was able to validate a Piétrain sire breeding program on crossbred piglets’ vitality and congenital defects which started in 2019 and was evaluated up to April 2024. The estimated heritabilities were low, but significantly different from zero, showing that these traits can be improved by selection in the sire lines. By evaluating common boars in two independent datasets, we were able to show that piglets’ vitality score, porcine congenital splay leg syndrome and pre-weaning mortality can be effectively improved via paternal genetics, with moderate to high genetic correlations between subsets. The evolutions of phenotypes and estimated breeding values showed that the breeding program was effective in improving piglet vitality scores between 2019 and 2024, while reducing porcine congenital splay leg syndrome and pre-weaning mortality. For scrotal hernia, the results were ambiguous, with only a statistically significant decrease in one of the studied subsets, while the number of piglets born death was not significantly affected by the breeding program. These results are very valuable for pig breeding, as they provide good evidence that paternal pig sire lines can be genetically selected to improve vitality and survival of their crossbred offspring, while reducing congenital defects.
The raw data supporting the conclusions of this article will be made available by the authors, without undue reservation.
Data on the pigs were collected according to protocols of Vlaamse Piétrain Fokkerij vzw and ILVO by their respective pig farmers. Data were collected in a non-invasive manner and were part of routine animal data collection within these organizations, and therefore ethical approval was not necessary. Written informed consent was obtained from the owners for the participation of their animals in this study.
WG: Conceptualization, Data curation, Formal analysis, Investigation, Methodology, Validation, Visualization, Writing – original draft, Writing – review & editing. CW: Conceptualization, Writing – original draft, Writing – review & editing. RM: Conceptualization, Methodology, Writing – original draft, Writing – review & editing. LC: Writing – original draft, Writing – review & editing. KH: Writing – original draft, Writing – review & editing. JK: Formal analysis, Investigation, Methodology, Writing – original draft, Writing – review & editing. AB: Writing – original draft, Writing – review & editing. JD: Conceptualization, Methodology, Resources, Writing – original draft, Writing – review & editing. SJ: Conceptualization, Data curation, Funding acquisition, Investigation, Methodology, Project administration, Supervision, Writing – original draft, Writing – review & editing. NB: Conceptualization, Funding acquisition, Project administration, Supervision, Writing – original draft, Writing – review & editing.
The author(s) declare financial support was received for the research, authorship, and/or publication of this article. This study was partially funded by an FR PhD fellowship (1104320N; WG) of the Research Foundation Flanders (FWO). Moreover, RM was funded by KU Leuven Internal Funds (PDMT2/23/035). LC was financially supported by internal C24/18/036 KU Leuven project. KH was funded by the UNIPIG project of VLAIO (HBC2019.2866). Data collection and preprocessing of the data for the ILVO dataset was funded by the Flemish pig industry via a fixed contribution per slaughtered pig, paid by the Flemish pig farmers. The funding bodies played no role in the design of the study, collection analysis, interpretation of data and in writing the manuscript.
We would like to thank all farmers that collected the data for this study. The authors used OpenAI ChatGPT (GPT-3.5) to check grammar, spelling, and improve readability and language in parts of the manuscript.
The authors declare that the research was conducted in the absence of any commercial or financial relationships that could be construed as a potential conflict of interest.
All claims expressed in this article are solely those of the authors and do not necessarily represent those of their affiliated organizations, or those of the publisher, the editors and the reviewers. Any product that may be evaluated in this article, or claim that may be made by its manufacturer, is not guaranteed or endorsed by the publisher.
The Supplementary Material for this article can be found online at: https://www.frontiersin.org/articles/10.3389/fanim.2025.1449092/full#supplementary-material
NBA, Number of piglets born alive; TNB, Total number of piglets born; PWM, Pre-weaning mortality; NBD, Number of piglets born death; PCS, Porcine congenital splay leg syndrome; SH, Scrotal hernia; N, Number of records or animals; ADGyouth, Average daily gain from birth until start of finishing phase; ADGlife, Average daily gain from birth until slaughter; indexphen, Phenotypical index; sd, Standard deviation; se, Standard error; SNP, Single nucleotide polymorphism; VPF, Vlaamse Piétrain Fokkerij; ILVO, Flanders Research Institute for Agriculture, Fisheries and Food; EBV, Estimated breeding value; h2, Heritability; c2, Common sow group effects; d2, Genetic and maternal dam effects; rp, rg, Phenotypic (p) or genetic (g) correlation; σa, Additive genetic standard deviation; σc, Common sow group effect standard deviation; σd, Dam genetic and maternal effect standard deviation; σe, Residual standard deviation.
Aguilar I., Misztal I., Johnson D. L., Legarra A., Tsuruta S., Lawlor T. J. (2010). Hot topic: A unified approach to utilize phenotypic, full pedigree, and genomic information for genetic evaluation of Holstein final score. J. Dairy Sci. 93, 743–752. doi: 10.3168/jds.2009-2730
Baxter E. M., Edwards S. A. (2018). “Piglet mortality and morbidity: Inevitable or unacceptable?,” in Advances in Pig Welfare (United Kingdom: Woodhead Publishing), 73–100.
Beissner B., Hamann O., Distl O. (2003a). Analysis of genetic parameters for congenital anomalies of the pig breeds German Landrace and Pietrain in Bavaria. 1st communication: analyses using sire-son regressions. Züchtungskunde 75, 214–225.
Beissner B., Hamann H., Distl O. (2003b). Analysis of genetic parameters for congenital anomalies in the pig breeds German Landrace and Pietrain in Bavaria. 2nd communication: estimation of genetic parameters using animal models. Züchtungskunde 75, 239–248.
Bidanel J. P. (2011). “Biology and genetics of reproduction,” in The genetics of the pig. Eds. Rothschild M. F., Ruvinsky A. (CABI, Wallingford), 218–241.
Christensen O. F., Lund M. S. (2010). Genomic prediction when some animals are not genotyped. Genet. Select Evol 42, 1–8. doi: 10.1186/1297-9686-42-2
Gorssen W., Winters C., Meyermans R., Chapard L., Hooyberghs K., Depuydt J., et al. (2024). Breeding for resilience in finishing pigs can decrease tail biting, lameness and mortality. Genet. Select Evol. 56. doi: 10.1186/s12711-024-00919-1
Hao X., Plastow G., Zhang C., Xu S., Hu Z., Yang T., et al. (2017). Genome-wide association study identifies candidate genes for piglet splay leg syndrome in different populations. BMC Genet. 18, 1–8. doi: 10.1186/s12863-017-0532-4
Holl J. W., Johnson R. K. (2005). Incidence and inheritance of splayleg in nebraska litter size selection lines.
King S. C., Henderson C. R. (1954). Variance components analysis in heritability studies 1. Poult Sci. 33, 147–154. doi: 10.3382/ps.0330147
Klein S., Brandt H. R., König S. (2018). Genetic parameters and selection strategies for female fertility and litter quality traits in organic weaner production systems with closed breeding systems. Livest Sci. 217, 1–7. doi: 10.1016/j.livsci.2018.09.004
Knap P. W., Huisman A., Sørensen C., Knol E. F. (2023a). “How to balance selection for litter size in pigs with survival, health and welfare,” in Book of abstracts of the 72nd annual meeting of the European Association for Animal Production (Lyon), (Wageningen: Wageningen Academic Publishers) 405.
Knap P. W., Knol E. F., Sørensen A. C., Huisman A. E., van der Spek D., Zak L. J., et al. (2023b). Genetic and phenotypic time trends of litter size, piglet mortality, and birth weight in pigs. Front. Anim. Sci 4, 1218175. doi: 10.3389/fanim.2023.1218175
Knol E. F., van der Spek D., Zak L. J. (2022). Genetic aspects of piglet survival and related traits: a review. J. Anim. Sci. 100, skac190. doi: 10.1093/jas/skac190
Legarra A., Aguilar I., Misztal I. (2009). A relationship matrix including full pedigree and genomic information. J. Dairy Sci. 92, 4656–4663. doi: 10.3168/jds.2009-2061
Misztal I., Tsuruta S., Lourenco D., Aguilar I., Legarra A., Vitezica Z. (2014). Manual for BLUPF90 family of programs (Athens: University of Georgia).
Nielsen B., Su G., Lund M. S., Madsen P. (2013). Selection for increased number of piglets at d 5 after farrowing has increased litter size and reduced piglet mortality. J. Anim. Sci. 91, 2575–2582. doi: 10.2527/jas.2012-5990
Nowacka-Woszuk J. (2021). The genetic background of hernia in pigs: A review. Livest Sci. 244, 104317. doi: 10.1016/j.livsci.2020.104317
Papatsiros V. G. (2012). The splay leg syndrome in piglets: A review. Am. J. Anim. Vet. Sci. 7, 80–83. doi: 10.3844/ajavsp.2012.80.83
R Core Team. (2020). R: A Language and Environment for Statistical Computing (Vienna, Austria: R Foundation for Statistical Computing).
Riquet J., Rousseau S., Mercat M. J., Pailhoux E., Larzul C., Les C. L. (2016). Les anomalies congénitales héréditaires chez le porc. INRA Producti Anim 29, 329–338.
Schodl K., Revermann R., Winckler C., Fuerst-Waltl B., Leeb C., Willam A., et al. (2019). Assessment of piglet vitality by farmers—Validation of A scoring scheme and estimation of associated genetic parameters. Animals 9, 317. doi: 10.3390/ani9060317
Schumacher T., Röntgen M., Maak S. (2021). Congenital splay leg syndrome in piglets—Current knowledge and a new approach to etiology. Front. Vet. Sci. 8, 609883. doi: 10.3389/fvets.2021.609883
Sevillano C. A., Lopes M. S., Harlizius B., Hanenberg E. H., Knol E. F., Bastiaansen J. W. (2015). Genome-wide association study using deregressed breeding values for cryptorchidism and scrotal/inguinal hernia in two pig lines. Genet. Select Evol 47, 1–8. doi: 10.1186/s12711-015-0096-6
Stratz P., Just A., Faber H., Bennewitz J. (2016). Genetic analyses of mothering ability in sows using field-recorded observations. Livest Sci. 191, 1–5. doi: 10.1016/j.livsci.2016.06.014
Szalay F., Zsarnovszky A., Fekete S., Hullár I., Jancsik V., Hajós F. (2001). Retarded myelination in the lumbar spinal cord of piglets born with spread-leg syndrome. Anat Embryol (Berl). 203, 53–59. doi: 10.1007/s004290000129
Van den Broeke A., Ampe B., Aluwé M., Millet S. (2020). “Mise en place d’une plateforme objective pour évaluer les verrats terminaux dans un cadre commercial en Flandre,” in 52 èmes Journées de la Recherche Porcine. IFIP-Institut du porc, 49–50.
Wallenbeck A., Rydhmer L., Lundeheim N. (2009). GxE interactions for growth and carcass leanness: Re-ranking of boars in organic and conventional pig production. Livest Sci. 123, 154–160. doi: 10.1016/j.livsci.2008.11.003
Xu W., Chen D., Yan G., Xiao S., Huang T., Zhang Z., et al. (2019). Rediscover and refine QTLs for pig scrotal hernia by increasing a specially designed F3 population and using whole-genome sequence imputation technology. Front. Genet. 10, 479257. doi: 10.3389/fgene.2019.00890
Zaalberg R. M., Nielsen H. M., Sørensen A. C., Chu T. T., Jensen J., Villumsen T. M. (2022a). The effect of using organic or conventional sires on genetic gain in organic pigs: A simulation study. Animals 12, 455. doi: 10.3390/ani12040455
Keywords: pig, Piétrain, pre-weaning mortality, vitality, congenital defects, sustainable breeding
Citation: Gorssen W, Winters C, Meyermans R, Chapard L, Hooyberghs K, De Kort J, Van den Broeke A, Depuydt J, Janssens S and Buys N (2025) Selection of terminal Piétrain pigs improves vitality and prevalence of congenital defects in crossbred piglets. Front. Anim. Sci. 6:1449092. doi: 10.3389/fanim.2025.1449092
Received: 14 June 2024; Accepted: 14 January 2025;
Published: 30 January 2025.
Edited by:
Gerson Barreto Mourão, University of São Paulo, BrazilReviewed by:
Martina Miluchová, Slovak University of Agriculture, SlovakiaCopyright © 2025 Gorssen, Winters, Meyermans, Chapard, Hooyberghs, De Kort, Van den Broeke, Depuydt, Janssens and Buys. This is an open-access article distributed under the terms of the Creative Commons Attribution License (CC BY). The use, distribution or reproduction in other forums is permitted, provided the original author(s) and the copyright owner(s) are credited and that the original publication in this journal is cited, in accordance with accepted academic practice. No use, distribution or reproduction is permitted which does not comply with these terms.
*Correspondence: Nadine Buys, bmFkaW5lLmJ1eXNAa3VsZXV2ZW4uYmU=
†ORCID: Alice Van den Broeke, orcid.org/0000-0002-1353-8112
Disclaimer: All claims expressed in this article are solely those of the authors and do not necessarily represent those of their affiliated organizations, or those of the publisher, the editors and the reviewers. Any product that may be evaluated in this article or claim that may be made by its manufacturer is not guaranteed or endorsed by the publisher.
Research integrity at Frontiers
Learn more about the work of our research integrity team to safeguard the quality of each article we publish.