
94% of researchers rate our articles as excellent or good
Learn more about the work of our research integrity team to safeguard the quality of each article we publish.
Find out more
ORIGINAL RESEARCH article
Front. Anim. Sci., 22 July 2024
Sec. Precision Livestock Farming
Volume 5 - 2024 | https://doi.org/10.3389/fanim.2024.1431285
 Yu-Jung Tsai1Yi-Che Huang1En-Chung Lin2Sheng-Chieh Lai1
 Xu-Chu Hong1Jonas Tsai1Cheng-En Chiang1
 Yan-Fu Kuo1*
Pig farming is a major sector of livestock production. The preweaning stage is a critical period in the pig farming process, where lactation-related behaviors between sows and their piglets directly influence the preweaning survivability of the piglets. Lactation-related behaviors are mutual interactions that require the combined monitoring of both the sow and her piglets. Conventional naked-eye observation is discontinuous and labor-intensive and may result in undetected abnormal behavior and economic losses. Thus, this study proposed to monitor the lactation-related behaviors of sows and their piglets simultaneously and continuously using computer vision. Videos were recorded from farrowing crates using embedded systems equipped with regular RGB cameras. The sow posture recognition model (SPRM), comprising a convolutional neural network (CNN) of the architecture EfficientNet and a long short-term memory network, was trained to identify seven postures of sows. The piglet localization and tracking model (PLTM), comprising a CNN of the architecture YOLOv7 and a simple online and realtime tracking algorithm, was trained to localize and track piglets in the farrowing crate. The sow posture information was then combined with the piglet activity to detect unfed piglets. The trained SPRM and PLTM reached an accuracy of 91.36% and a multiple object tracking accuracy of 94.6%. The performance of the proposed unfed piglet detection achieved a precision of 98.4% and a recall of 90.7%. A long-term experiment was conducted to monitor lactation-related behaviors of sows and their piglets from the birth of the piglets to day 15. The overall mean daily percentages ± standard deviations (SDs) of sow postures were 6.8% ± 2.9% for feeding, 8.8% ± 6.6% for standing, 11.8% ± 4.5% for sitting, 20.6% ± 16.3% for recumbency, 14.1% ± 6.5% for lying, and 38.1% ± 7.5% for lactating. The overall mean daily percentages ± SDs of piglet activities were 38.1% ± 7.5% for suckling, 22.2% ± 5.4% for active, and 39.7% ± 10.5% for rest. The proposed approach provides a total solution for the automatic monitoring of sows and their piglets in the farrowing house. This automatic detection of abnormal lactation-related behaviors can help in preventing piglet preweaning mortality and therefore aid pig farming efficiency.
Pork accounts for a major proportion of meat consumption worldwide. According to the Food and Agriculture Organization (FAO, 2022), 122.5 million tons of pork was produced worldwide in 2021. The average consumption of pork was 23.0 kg per person in 2020 (Racewicz et al., 2021). In Taiwan, more than 5.3 million pigs were farmed (Council of Agriculture, 2022). The production value of pig farming reached 79.8 billion new Taiwan dollars, accounting for 39.1% of the total output value of animal production and making it the highest output value in animal husbandry. Although the pig farming industry has continued to grow and expand at a steady pace, there exists several recurring problems that impact the industry, such as transboundary diseases, fluctuation of feed costs, and preweaning mortality of piglets.
Preweaning is the most critical stage in pig rearing. Preweaning mortality rates in major pig-producing countries range between 10% and 20% (Muns et al., 2016). In Taiwan, 11.6% of piglets die before weaning (National Animal Industry Foundation, 2020), greatly impacting the efficiency of pig farming. Knowing the lactation-related behaviors of sows and their own piglets is the key to preventing the preweaning mortality of piglets. Muns et al. (2013) indicated that the lactation-related behaviors of sows are critical for the early survival of pre-weaned piglets. Van Beirendonck et al. (2014) discovered that the longer the sow was standing, the more active her piglets were. Wischner et al. (2009) indicated that sows that crushed no piglets (NC-sows) and sows that crushed piglets (C-sows) had different posture patterns. NC-sows had more time in the lying posture and C-sows had more time in the sitting posture.
Understanding lactation-related behaviors is also essential for the welfare of sows and their preweaning piglets. Performing natural lactation may enhance the maternal satisfaction of both sows and piglets. Tomas et al. (2024) indicated that piglets with more maternal contacts were more likely to approach novel objects and gained higher weaning weights compared with piglets with restricted maternal contacts. Receiving adequate nutrition and water is vital for the survival and growth of piglets. da Silva et al. (2020) demonstrated that piglets with increased total water intake had higher average daily gain and weaning weight during the nursing phase.
Conventionally, the evaluation of the lactation-related behaviors of sows and piglets was performed by manually observing the sows and their piglets in farrowing crates. However, manual approaches are laborious, time-consuming, and may be prone to error due to fatigue. In addition, the pig industry is facing labor shortage due to lack of incentive for the young generation to join the industry (Chou, 2019). This trend of increasing labor costs combined with the effects of decreasing birth rates makes manual surveillance even more expensive for pig farmers. Therefore, there is a need to develop an automatic approach for observing the lactation-related behaviors of sows and piglets in farrowing houses.
The environment of pig farrowing houses is usually complex with miscellaneous items filled in the space (Figure 1). It is challenging to automatically observe sows and piglets using conventional image processing-based approaches. Recently, deep learning has emerged as a powerful tool for solving complex machine vision tasks. Research was conducted to identify sow postures using deep learning approaches (e.g., convolutional neural network, CNN). Zheng et al. (2018) used faster region-based CNN (Faster R-CNN) to identify five postures of sows in depth images. They further analyzed the daily activity levels and posture change frequencies of sows and achieved an accuracy of 93.6%. Yang et al. (2018) identified the nursing behaviors of sows in videos using the combination of a fully convolutional network and optical flow. Their approach achieved an accuracy of 96.4% in sow nursing behavior identification. Zheng et al. (2020) designed an improved Faster R-CNN to analyze the postures of sows in videos captured using depth cameras. Their approach achieved mean average precisions of 92.7% and 77.4%, respectively, in recognizing four sow postures and in recognizing eight posture change actions. Küster et al. (2021) detected sow body parts in videos using a CNN of architecture you only look once version 3 (YOLO v3; Redmon and Farhadi, 2018). They further classified the sow postures using the detected sow body parts and a hierarchical conditional statement classifier and achieved an accuracy of 59.6%. Wang et al. (2021) identified five postural behaviors of sows in videos using the combination of a CNN (VGG-16), long short-term memory (LSTM; Hochreiter and Schmidhuber, 1997), and principal component analysis. Their approach achieved an accuracy of 90.60%. Although presumably accurate, these studies only analyzed the postures of sows. The lactation-related behaviors of piglets were also essential information and remained to be investigated.
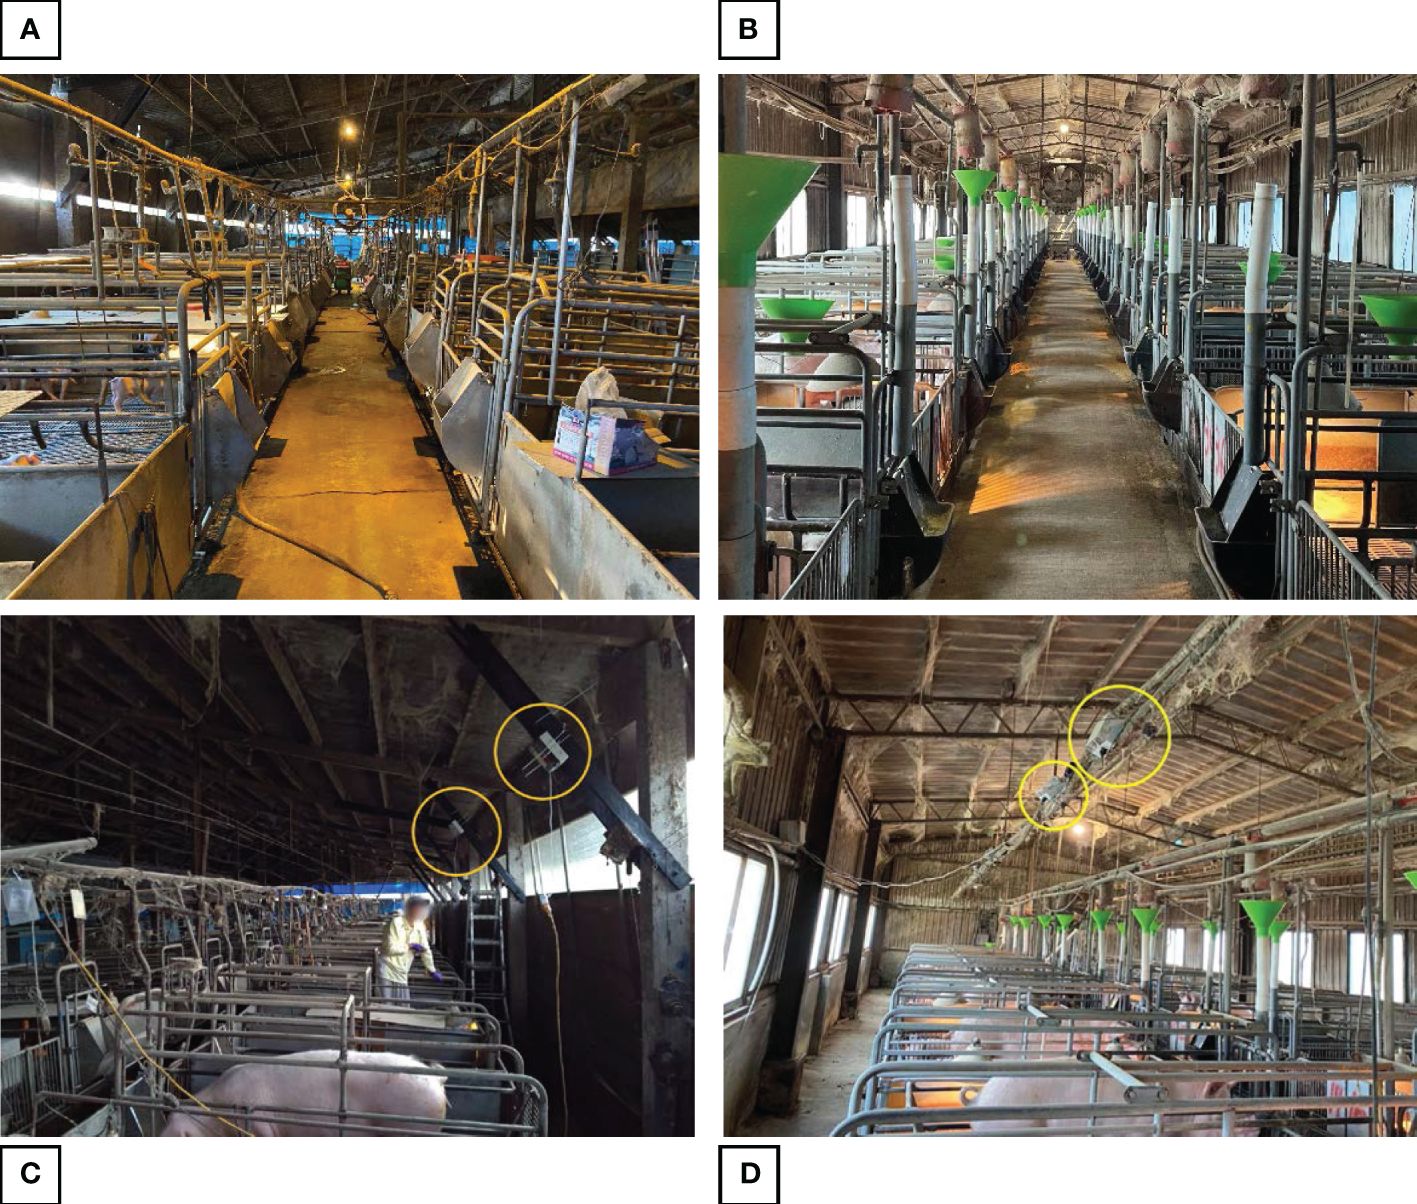
Figure 1 Farrowing houses in the (A) Tainan and (B) New Taipei commercial pig farms, and embedded systems installed in the (C) Tainan and (D) New Taipei farrowing houses.
Mobility is one essential behaviors of pre-weaning piglets to be observed. Higher mobility of piglets usually indicates better health status. Deep learning methods have also been used to detect and track pigs and piglets. Cowton et al. (2019) detected and tracked adult pigs using the combination of Faster R-CNN and simple online and realtime tracking (SORT; Wojke et al., 2017) or deep SORT. Their method achieved a multi-object tracking accuracy (MOTA) of 92.0%. Zhang et al. (2019) detected adult pigs using a CNN of architecture single shot multibox detector (Liu et al., 2016) and tracked the pigs using a correlation filter-based tracker. Their approach achieved a precision of 94.72%, a recall of 94.74%, and a MOTA of 89.58%. Psota et al. (2020) detected the key points of ear tag-equipped adult pigs using a fully-convolutional detector and tracked the pigs using a probabilistic tracking-by-detection method. The ear tags were used to identify individual pigs. Their method achieved an average precision and recall of at least 0.8251. Gan et al. (2021) proposed a customized approach, named online piglet tracking network, to detect and track piglets simultaneously. Their approach achieved a MOTA of 97.04% and an inference rate of 6.89 frames per second (fps). Kim et al. (2022) counted pigs using a CNN of architecture YOLO v4 tiny and modified deep SORT. Their approach achieved a MOTA of 89.88% in adult pig tracking. Ho et al. (2021) quantify the movements of piglets using a CNN based on architecture of EfficientNet and SORT. Their approach achieved an overall mean average precision of 87.90%. Although presumably effective, most aforementioned studies worked on adult pig tracking in open spaces. The sizes of the pre-weaning piglets were small, and the environment in farrowing crates was complex (e.g., filled with rails, heat lamps, and buckles). Very limited studies have been conducted to track pre-weaning piglets in farrowing houses. Neither was long-term analysis performed.
This study aimed to monitor the lactation-related behaviors of a sow and the litter of her piglets in a farrowing crate simultaneously and continuously. Seven postures of sows (feeding, standing, sitting, recumbency, lying, left lactating, and right lactating) and three lactation-related activities of the piglets (suckling, active, and rest) were identified using the combination of multiple deep learning models. Subsequently, six metrics were derived from the seven sow postures to explicitly measure the lactation status of the sow. Long-term analysis of sows and their piglets was conducted. The differences in lactation-related behaviors between crates were observed and compared. Sows or piglets with outlying behaviors were identified and discussed.
The system for monitoring behaviors of sows and piglets consisted of a) embedded systems for capturing videos of farrowing crates, b) image preprocessing algorithms, c) two deep learning models (sow posture recognition model, SPRM; piglet localization and tracking model, PLTM), and d) data analysis algorithms (Figure 2). The image preprocessing algorithms converted the videos into clips and images of appropriate formats. The deep learning models identified the postures of sows and localized and tracked the piglets. The data analysis algorithms calculated nine measures of sows and piglets: sow lactating time, sow lactating frequency, sow feeding time, sow feeding frequency, sow recumbency time, sow posture change frequency, piglet movement, piglet activity ratio, and unfed piglet event in e of Figure 2.
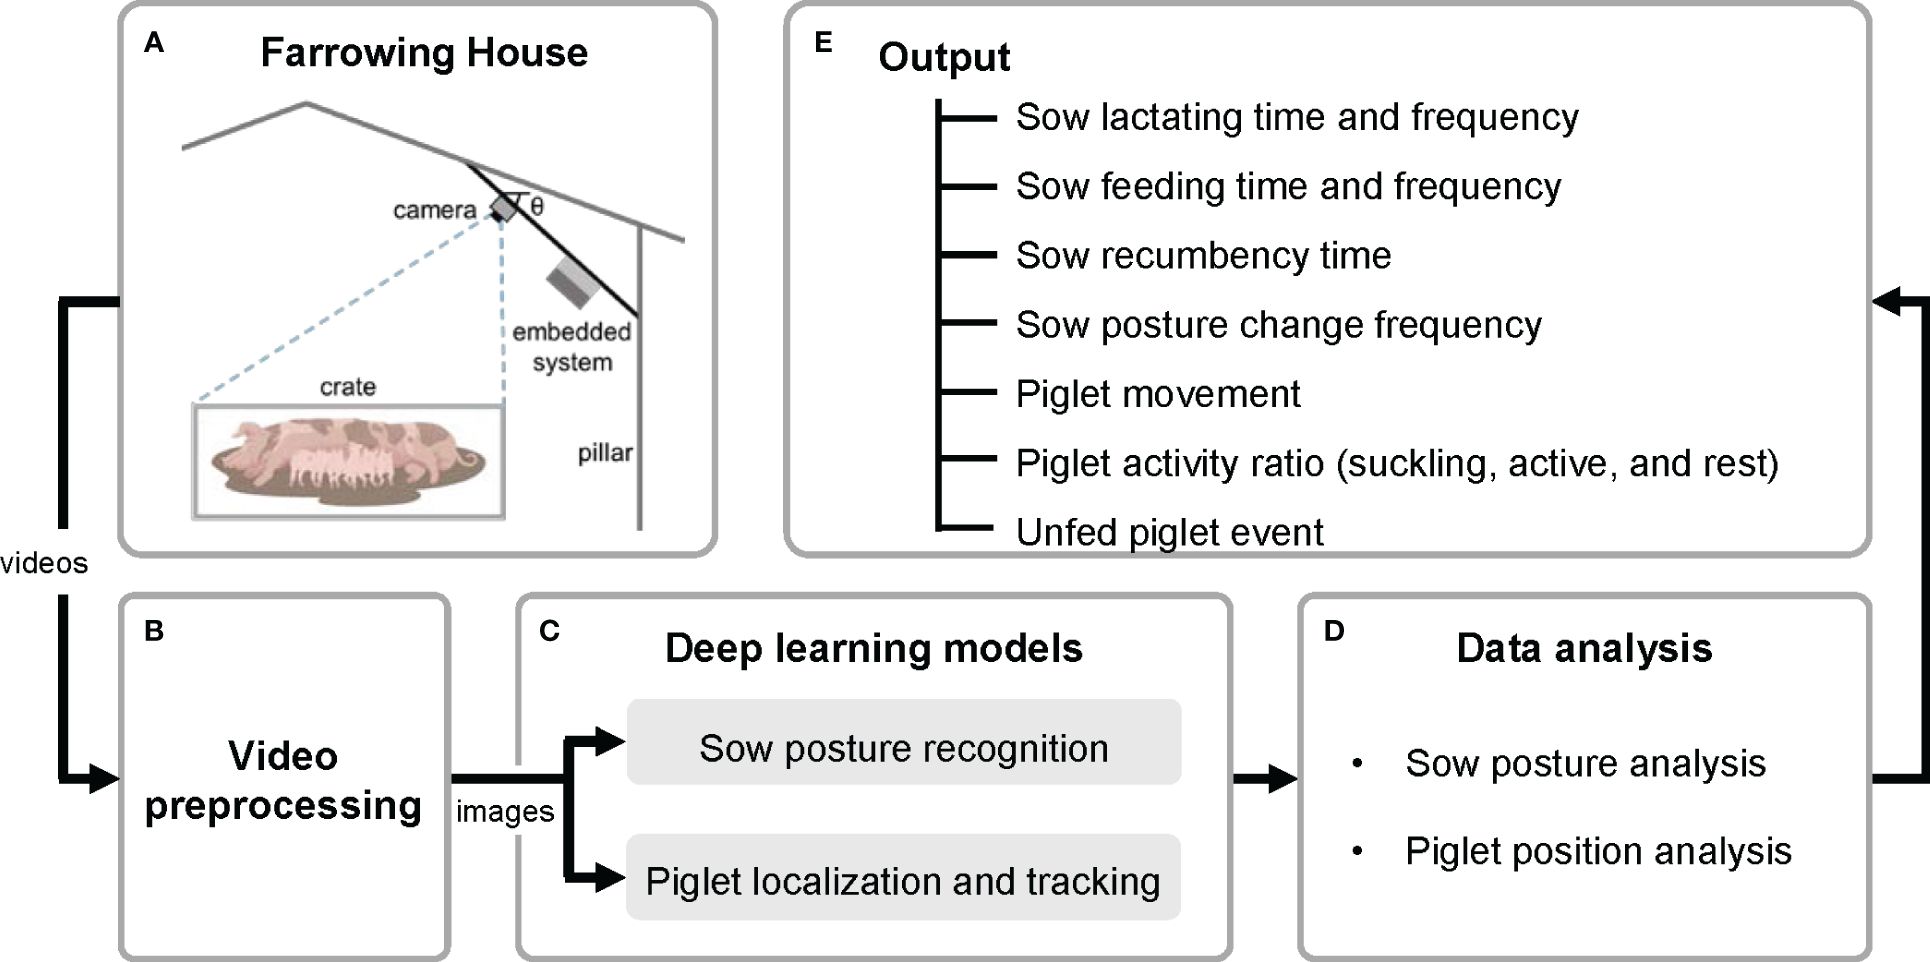
Figure 2 Flowchart of the proposed lactation-related behaviors monitoring system of a sow and her piglets: (A) embedded systems, (B) image preprocessing algorithms, (C) deep learning models, (D) data analysis algorithms, and (E) output.
The experiment was conducted in the farrowing houses of two commercial pig farms located in Tainan (Figure 1A) and New Taipei (Figure 1B), Taiwan. The farms in Tainan and New Taipei City were small- and intermediate-sized swine operations, respectively, which have around 80 and 480 sows in the herds. Both farms have loose housing with waterproof tarpaulin covered in the winter. There were two and four regular farrowing crates used for monitoring the farrowing houses of the Tainan and New Taipei City farms, respectively. The crate dimension was 1.9 × 2 m2. The breeds of the sows in the Tainan farm were mainly Landrace (L) and Landrace and Yorkshire crosses (LY). The piglets were mostly Duroc × Yorkshire × Landrace (DYL) with a small number of L and YL. The breeds of the sows in the New Taipei City farm were mainly Landrace (L) and Yorkshire (Y). Their piglets were mostly Yorkshire × Landrace (YL) with a certain number of L and Y.
The regular farrowing and lactation of sows in the two farms were managed with a 4-week period. The piglets were weaned and moved to nursery houses in the farms. The managers of the farrowing houses followed the regular feeding and caring procedure on the farm: feeding twice in the morning and evening, and cleaning once right after morning feeding on a daily basis. Medication if necessary was very limited. Thus, the interference of sows and piglets by managers was less than one hour in a day. To avoid influencing the normal behavior of the observed subjects, the feeding and cleaning periods were skipped out from the video collection. In addition, we observed the sows and piglets via cameras instead of on the farm.
Videos of certain farrowing crates were collected using the embedded systems. Each of the embedded systems was composed of a single-board computer (Raspberry Pi 3 Model B+, Raspberry Pi Foundation; Cambridge, United Kingdom) and a wide-angle camera (KS2A17, Majortech; Shenzhen, China). The cameras were installed above the farrowing crates at an inclination angle θ (in Figure 2A) of approximately 30°C and a height of approximately 3 m in the Tainan farm (Figure 1C), and at an inclination angle of approximately 10°C and a height of approximately 2 m in the New Taipei farm (Figure 1D). The cameras captured videos from the back of the sows. The camera view covered a complete farrowing crate, including the feeding buckles of the crates. The videos of sows and piglets from birth to weaning were recorded. The videos were acquired at a rate of 5 frames per second (fps) and a resolution of 960 × 540 pixels. Each video was one-minute long. The acquired videos were stored in the single-board computers and were sent back to a network attached storage in the laboratory through 4G internet. The videos were collected from 8:00 to 18:00 daily from 2020 to 2022. More than 5,000 hours of videos were collected.
The videos were converted into clips and images for training the SPRM and PLTM, respectively. In the conversion, the frame rate of the videos was reduced to 1 fps. Each frame was extracted. Consequently, each one-minute long video rendered 60 frames. Cropping and perspective transformation were then applied to the frames to remove redundant areas in the videos (i.e., adjacent crates or walkways) and to diminish the impact of differences in the shooting angles. The resulting frames included a single and complete farrowing crate. Thirty consecutive frames were composed as a clip. Consequently, each video rendered two clips. The clips were used to train SPRM. The frames in the clips were resized and stored at a dimension of 224 × 224 pixels. Furthermore, the cropped and transformed frames were also stored as the images for training the PLTM. These images were referred to as piglet images. For the purposes of annotation, the piglet images were resized and stored at a dimension of 1024 × 1024 pixels. The aforementioned process was performed automatically.
Clips of seven sow postures were recognized and collected: feeding, standing, sitting, sternal or ventral recumbency (referred to as recumbency in this work), lying, lactating on the right side, and lactating on the left side (Figure 3; Table 1). The posture of the sows in a clip was recognized by observing the original videos. Clips containing posture transients were not used. A total of 2,353 clips were collected (Table 1). The clips were split into training and test at a ratio of 3:1.
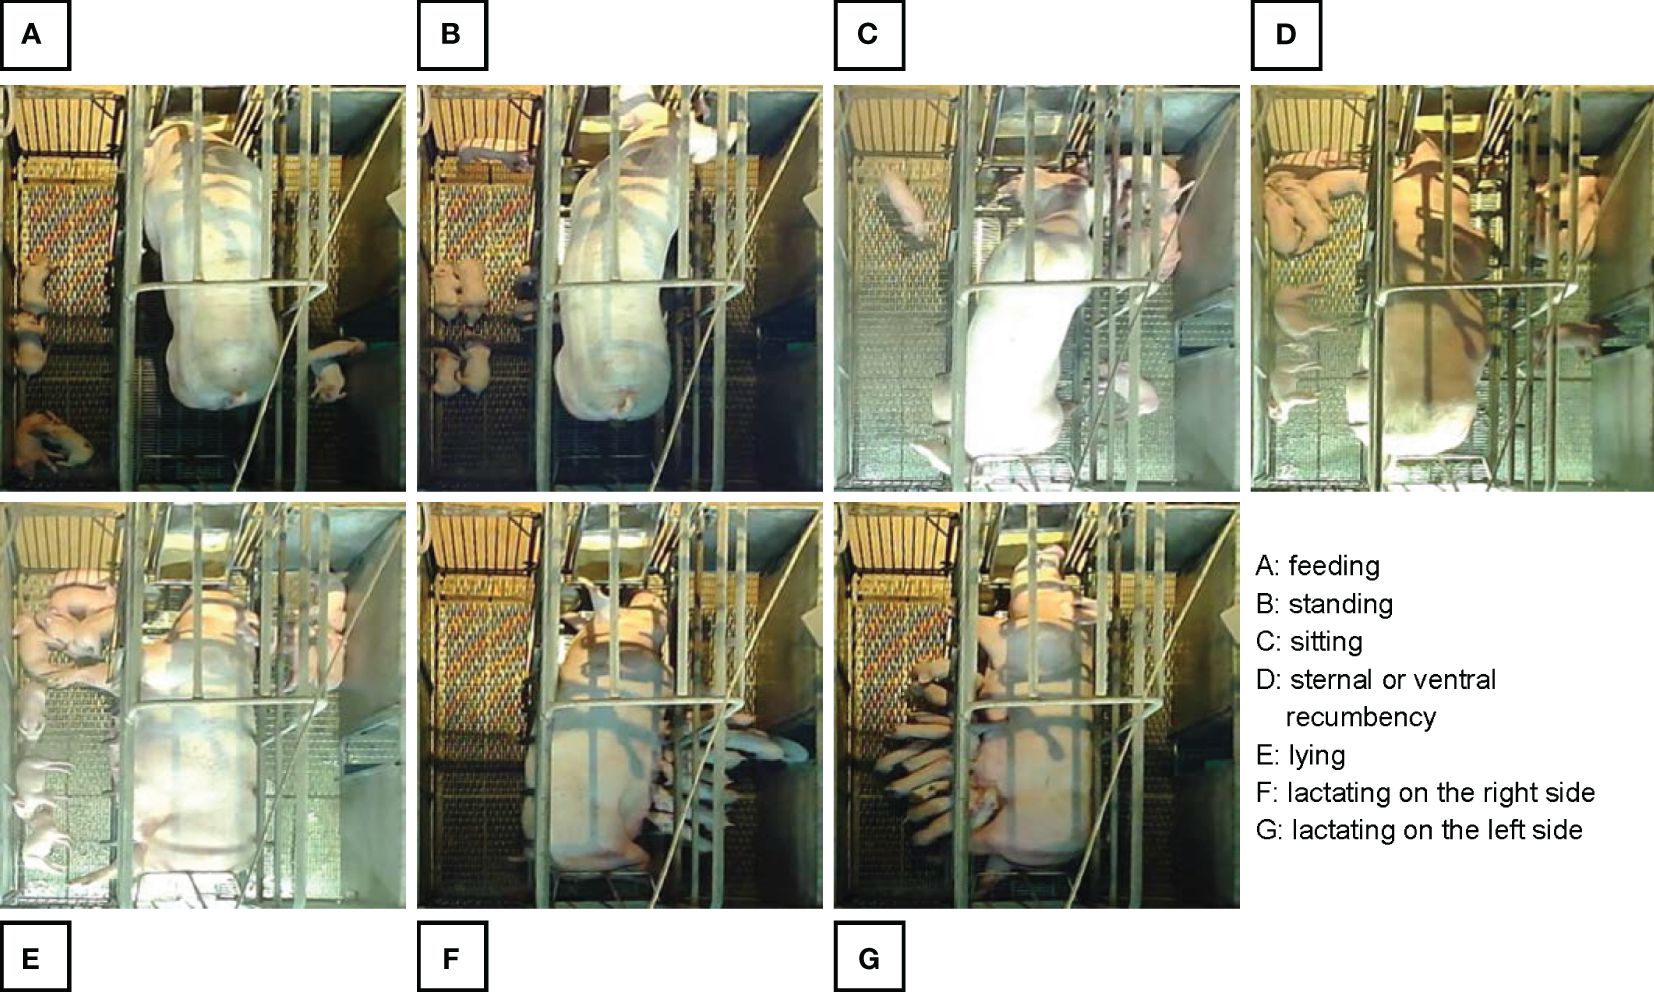
Figure 3 Seven sow postures to be recognized: (A) feeding, (B) standing, (C) sitting, (D) sternal or ventral recumbency, (E) lying, (F) lactating on the right side, (G) lactating on the left side.
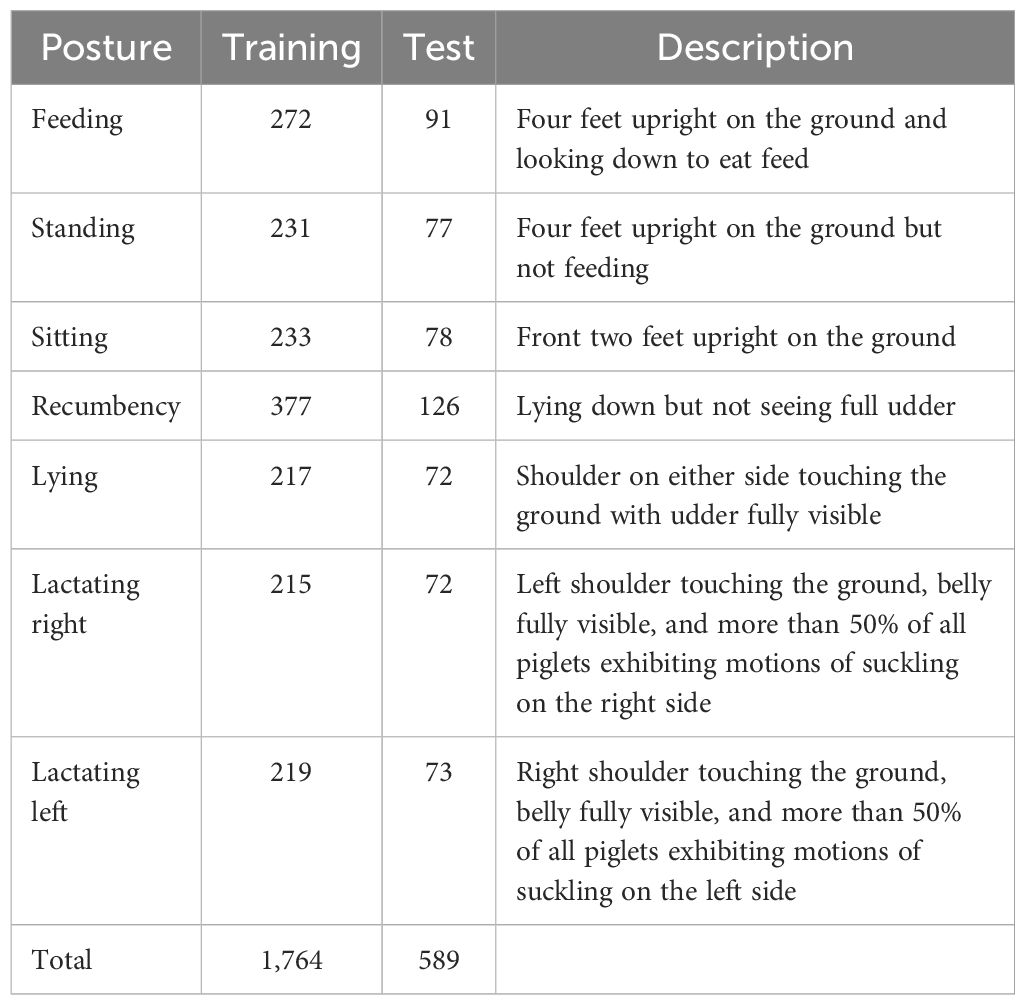
Table 1 Number of labeled sow posture clips and definition of sow postures.
The piglet images were screened before being used to train the PLTM. To improve the robustness of the PLTM, images of a high level of similarity were disregarded. The structural-similarity index measure (SSIM; Wang et al., 2004) was used to exclude the images of consecutive frames with high levels of similarity. After screening, a total of 1361 piglet images were selected. Rotated bounding boxes of the piglets in the images were labeled using the roLabelImg toolkit. After annotation, the dimension of the images was reduced to 512 × 512 pixels. The images were split into training, validation, and test at a ratio of 4:1:1.
The combination of an EfficientNet (Tan and Le, 2019) and an LSTM was used as the SPRM. The EfficientNet was used as an encoder to extract the features from the piglet images in a clip. Subsequently, the LSTM was used as a decoder to determine the posture of sows using the temporal features (i.e., features of 30 consecutive frames) from the EfficientNet. The original fully connected (FC) layer in EfficientNet was substituted by two FC layers, each with dimensions of 1,280 × 1,024 and 1,024 × 512 respectively to reduce the dimensions of the spatial features. Two additional FC layers were added to the LSTM output, each with dimensions of 512 × 256 and 256 × 7 respectively. The first added layer is used to diminish the dimensionality of the temporal features. The subsequent layer is used to predict the output associated with sow postures. SPRM was trained in the PyTorch framework. Adaptive moment estimation (Kingma and Ba, 2014) was used as the optimizer. The initial learning rate was set to 0.0001. The batch size was set to 30. The model was trained for 48 epochs. Two graphics processing units (GPUs; RTX A6000, NVIDIA; Santa Clara, USA) were used for training the SPRM.
Once trained, the SPRM was used to identify sow postures in clips converted from videos on a regular basis. Subsequently, the following daily metrics were quantified for each sow: sow lactating time (hours per day), sow lactating frequency (times per day), sow feeding time (hours per day), sow feeding frequency (times per day), sow recumbency time (hours per day), and sow posture change frequency (times per day). Sow lactating time is the summed duration of lactating on the right side and lactating on the left side. Sow posture change frequency summarized all the posture change events, except for the changes between lying and lactating and between feeding and standing.
The mobility of a piglet litter in each crate was quantified (i.e., group mobility). The combination of YOLOv7 (Wang et al., 2023) and SORT was used as the PLTM. YOLOv7 was used to localize piglets in the piglet images. SORT was used to track the piglets in consecutive frames using the piglet locations from YOLOv7. Movements of the piglets were subsequently quantified as the Euclidean distance of the piglet center coordinates between consecutive frames. Piglet movement was calculated for each crate as the mean piglet movement (meters per piglet per day). Piglet movements were quantified in meters because the dimension of the farrowing crates is known (1.9 × 2 m2).
The YOLOv7 was comprised of a backbone CNN with E-ELAN architecture, a neck with a path aggregate feature pyramid network (PAFPN), and a YOLO head as the head. The backbone CNN extracted feature maps from input images. The neck aggregated these feature maps and enhanced information flow between different pyramid levels through iterative bottom-up and top-down pathways. The YOLO head predicted the bounding boxes and confidence scores of objects of interest (e.g., piglets).
YOLOv7 was trained using the PyTorch framework. To train the model, the dimension of the input images was set to 416 × 416 pixels. Online image augmentations were applied to the training images to enhance the robustness of the model at each epoch. The augmentation operations included hue variation (randomly multiplied between 0.985 and 1.015), saturation variation (randomly multiplied between 0.3 and 1.7), value variation (randomly multiplied between 0.6 and 1.4), image scaling (randomly scaled between 0.1 and 1.9), horizontal flipping (randomly flipped left or right), and mosaic (randomly cropped, repositioned, and combined four training images into one). Adam was used as the optimizer. The initial value of the learning rate was set to 0.01. The batch size was set to 32. The model was trained for 300 epochs. Two GPUs (RTX A6000, NVIDIA; Santa Clara, USA) were used for training the model.
SORT was comprised of a Kalman filter (Kalman, 1960) and the Hungarian algorithm (Kuhn, 1955). The Kalman filter was used first to estimate the center coordinate, area, aspect ratio, and velocities of the piglets in the present frame, and changes in the center coordinate, area, aspect ratio, and velocities of the piglets in a subsequent frame by using the same information in the previous frame. The Hungarian algorithm was used to match the piglets in two consecutive frames. Then, the Euclidean distance between the successfully tracked piglets in consecutive frames was quantified.
Once trained, the movements of piglets were quantified using PLTM at a rate of 5 fps (i.e., original video frame rate; Section 2.3). Linear regression was applied to the daily piglet movements of the same crate on consecutive days to observe the long-term trend of piglet movements.
Piglet activity ratio (with respect to time) was calculated using the SPRM and PLTM cooperatively. Three piglet activities were considered: suckling, active, and rest. Suckling was defined equivalently as sow lactation, and, consequently, suckling time was equivalent to the sow lactating time quantified using the SPRM. When piglets were not suckling, their activities (active and rest) were further identified using the PLTM. Piglets of a crate were considered as active if the piglet movement exceeded one meter in five minutes and more than five piglets were detected (i.e., not in the heat lamp chamber) in the piglet images. Otherwise, piglet activity was considered as rest. Piglet activity ratio was subsequently quantified as the percentages of the three activities.
Unfed piglets were also detected using the SPRM and PLTM cooperatively. SPRM was used to identify the status of sow lactation, and PLTM was used to detect piglets outside the suckling zones (Figure 4A) and recognize them as unfed piglets. When the sow was lactating on the left side (Figure 4B), the suckling zone was defined as the area framed by the four coordinate points L1 (77, 175), L2 (215, 175), L3 (215, 460), and L4 (77, 460) in a 512 × 512 image. Points L1 and L4 were connected by a convex arc with a radius of 750 pixels, and the rest of the points were connected by straight lines. Similarly, when the sow was lactating on the right side (Figure 4C), the suckling zone was defined as the area framed by points R1 (275, 175), R2 (435, 175), R3 (435, 460), and R4 (275, 460), with points R2 and R3 connected with the convex arc. The suckling zones were determined by inferring from images with unfed piglets. The occurrence of an unfed piglet event was considered when one or more unfed piglets were detected throughout a lactation event. A lactation event was defined as an occurrence of sow lactation that spans the consecutive clips detected as sow lactation by PLTM.
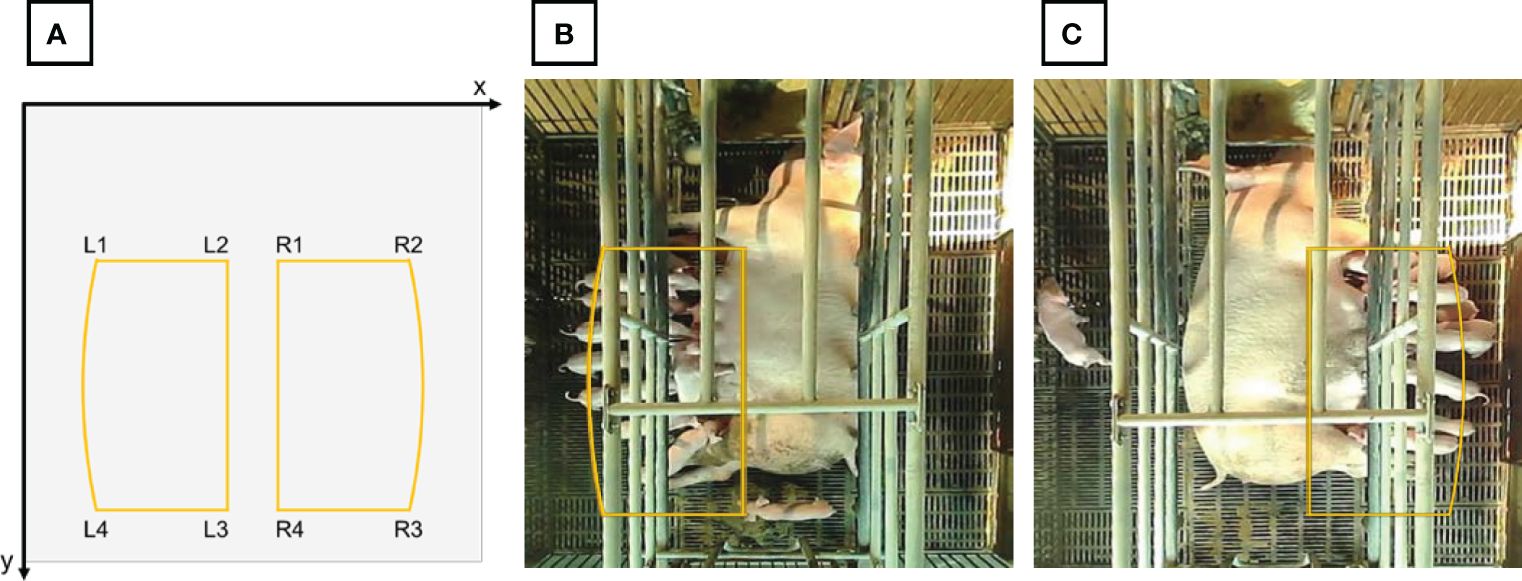
Figure 4 (A) Coordinates of the suckling zones, (B) suckling zone for sows lactating on the left side, and (C) suckling zone for sows lactating on the right side. Piglets outside the suckling zone during lactation were considered unfed piglets.
Ten sets of farrowing crate videos were prepared for examining the performance of the proposed approaches on a long-term basis. Each set comprised videos recorded in a crate hosting a sow and her piglets. The videos were recorded continuously from 8:00 to 18:00, from the birth to day 15 of the piglets. Each video was one-minute long, yielding a total of 600 videos per day. Five sets were recorded in the Tainan farm, and the other five were recorded in the New Taipei farm. Certain videos were missing due to unstable internet connection or the maintenance of the embedded systems. A total of 1,351.4 hours of videos were collected. The videos were not used for training the SPRM or PLTM. The collected videos were converted into clips using the aforementioned procedure (Section 2.4). Sow and piglet metrics (Sections 2.6, 2.7, and 2.8) were calculated using the proposed approaches. Subsequently, an analysis was conducted to examine the difference between crates.
Statistical analyses were conducted on the data collected in the long-term experiment. The data were presented as mean ± standard deviation (SD). To determine the statistical significance of differences between groups, we employed Welch’s t-test and Bonferroni multiple comparison tests. For the sow posture analysis, the statistical units included lactating time, lactating frequency, feeding time, feeding frequency, recumbency time, and posture change frequency. In addition, for the piglet movement analysis, the statistical unit was the daily movement. Welch’s t-test was used to determine the significance of differences between groups with unequal variances. To control for the increased risk of Type I errors due to multiple testing, Bonferroni multiple comparison tests were performed. All statistical analyses were conducted with a significance level of p < 0.05. The statistical analyses were performed using Python.
The performance of the trained SPRM was evaluated using the 589 test clips (Table 1). The model achieved an overall accuracy of 91.36%, an overall precision of 0.93, an overall recall of 0.93, and an overall F-1 score of 0.92 (Table 2). The processing speed of the trained SPRM was 0.77 clips per second using the RTX A6000.
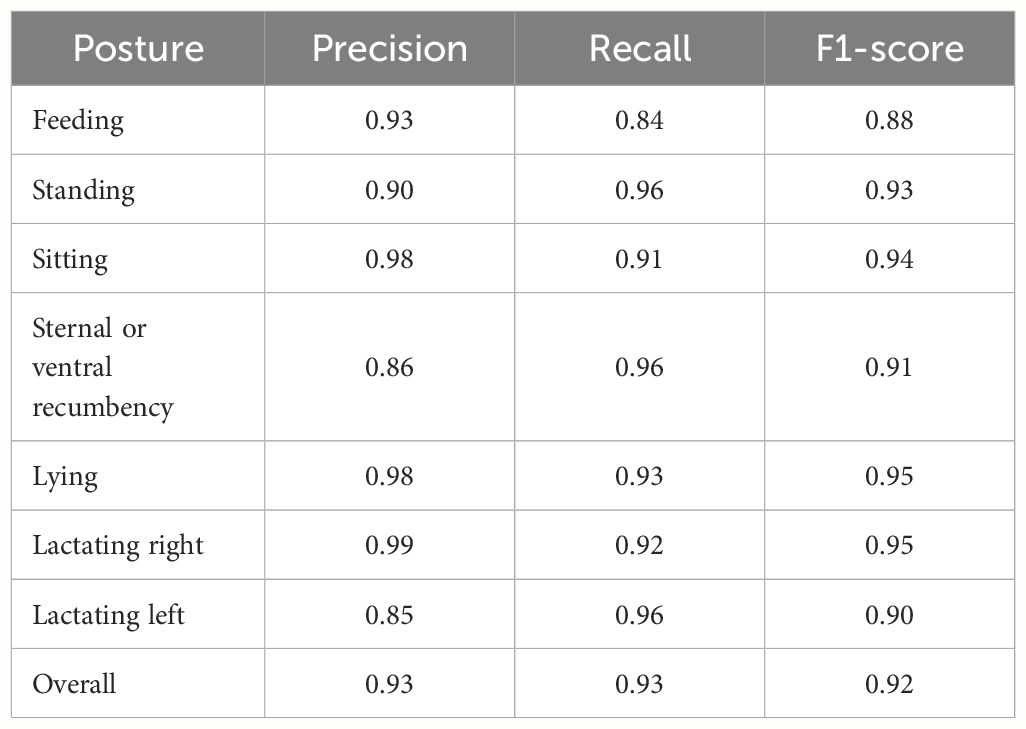
Table 2 The precision, recall, and F1 score of the seven postures.
Predictive analysis was conducted to understand the details of misidentification. The resulting confusion matrix (Figure 5) indicates that 15.0% of the feeding clips were misidentified as standing. By inspecting the misidentified clips (Figure 6A), certain feeding postures had a high level of similarity with standing postures (Figure 6B), with only a slight difference in the position of the head. Thus, the confusion between feeding and standing was high. This is a natural limitation of our top-view surveillance approach, since the defining features of certain postures are not easily visible from a top-view perspective. The analysis also showed that 8.0% of the lying clips (5.0% lactating on the left side and 3.0% lactating on the right side) were misidentified as lactating. Lying is usually a transition between lactating and other postures. By inspecting the misidentified lying clips (Figure 6C), it was observed that the misidentification occurred when the sow was about to start or to end lactation, causing high confusion between lying and lactating (Figure 6D).

Figure 5 Confusion matrix of the sow posture recognition model (SPRM) in predictive analysis.
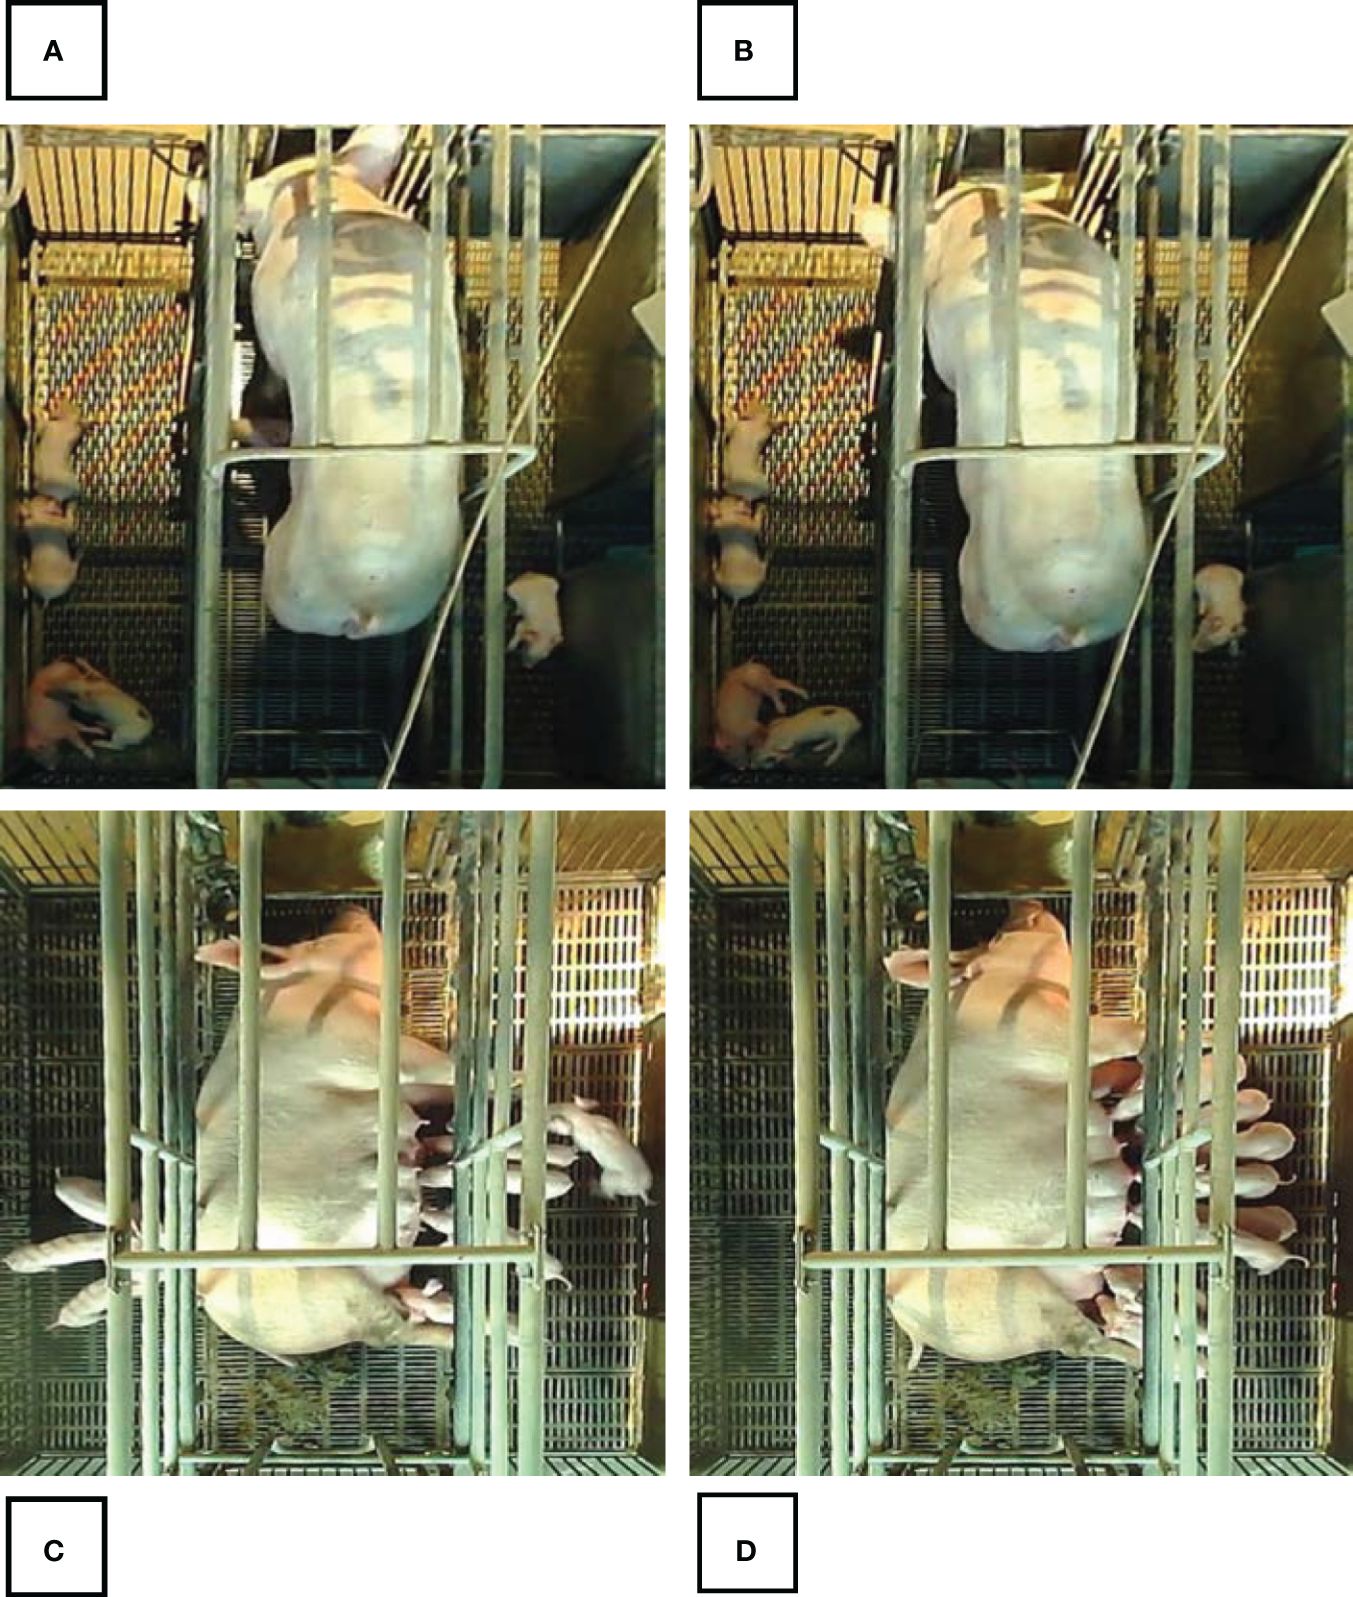
Figure 6 Images to explain the confusion between (A) feeding and (B) standing, and between (C) lying and (D) lactating: (A) a feeding posture misidentified as standing, (B) a typical standing posture, (C) a lying posture misidentified as lactating, and (D) a typical lactating posture.
Certain long-term videos were selected to examine the prediction performance of the trained SPRM (Figures 7A, B). The selected videos were captured in two crates. The total length of the videos in each crate was one-hour long, rendering a total of 120 one-minute videos (i.e., 240 clips). These clips were selected because the sows in the clips had a high frequency in posture change. The SPRM achieved an accuracy of 93.7% on the clips.
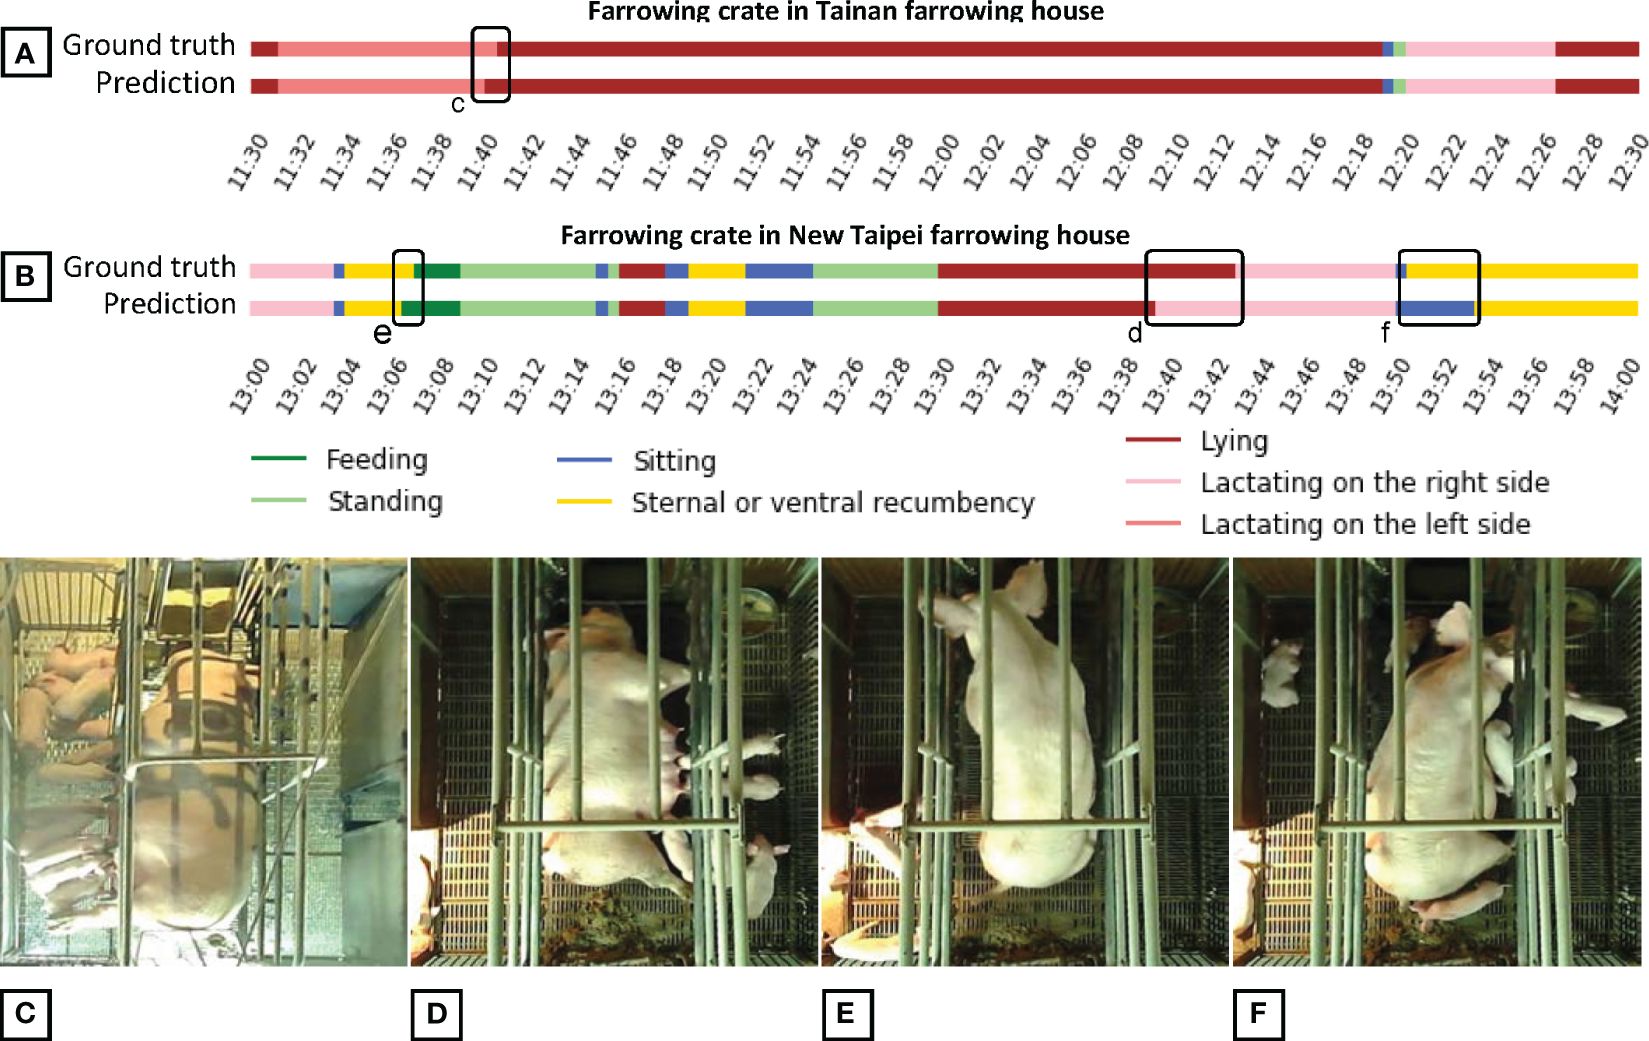
Figure 7 Two-hour videos for demonstrating the performance of the trained sow posture recognition model (SPRM): (C) lactating misidentified as lying, (D) lying misidentified as lactating, (E) recumbency misidentified as feeding, and (F) recumbency misidentified as sitting. (C–F) correspond to the equivalent lower-case labeled regions in (A, B).
Four failure cases were observed, including two misidentifications between lying and lactating (c in Figures 7A, D in Figure 7B), one misidentification between feeding and recumbency (e in Figure 7B), and one misidentification between sitting and recumbency (f in Figure 8B). Of the two misidentification cases between lying and lactating, the first case was a lactating misidentified as a lying (c in Figures 7A, C). This case occurred at the end of sow lactation. In the misidentified clip, only 3 to 6 piglets were suckling. The rest of the piglets were resting at the top left corner of the crate. The moment was the critical point when the lactation period was about to end. Another case was a lying misidentified as a lactating (d in Figures 7B, D. In this case, only 3 to 5 piglets in the misidentified clips had been suckling for about 3 minutes before the sow started lactating. The rest piglets were in the heating lamp area. The clips were characteristically similar to the transition period before sow lactation, leading to misidentification. The case that a recumbency was misidentified as a feeding occurred when the sow changed her posture (e in Figures 7B, E). By analyzing the clip, 50.0%, 43.3%, and 6.7% of frames corresponded to recumbency, feeding, and transient postures, respectively. Although the ground truth (GT) of the clip was recumbency, the percentages of recumbency and feeding were close. The last failure case was a recumbency misidentified as sittings (f in Figures 7B, F). By inspecting the misidentified clips, the sow was observed to have both front feet flexed. Neither the left nor right shoulder of the sow touched the ground. This recumbent posture has a high level of similarity with sitting.
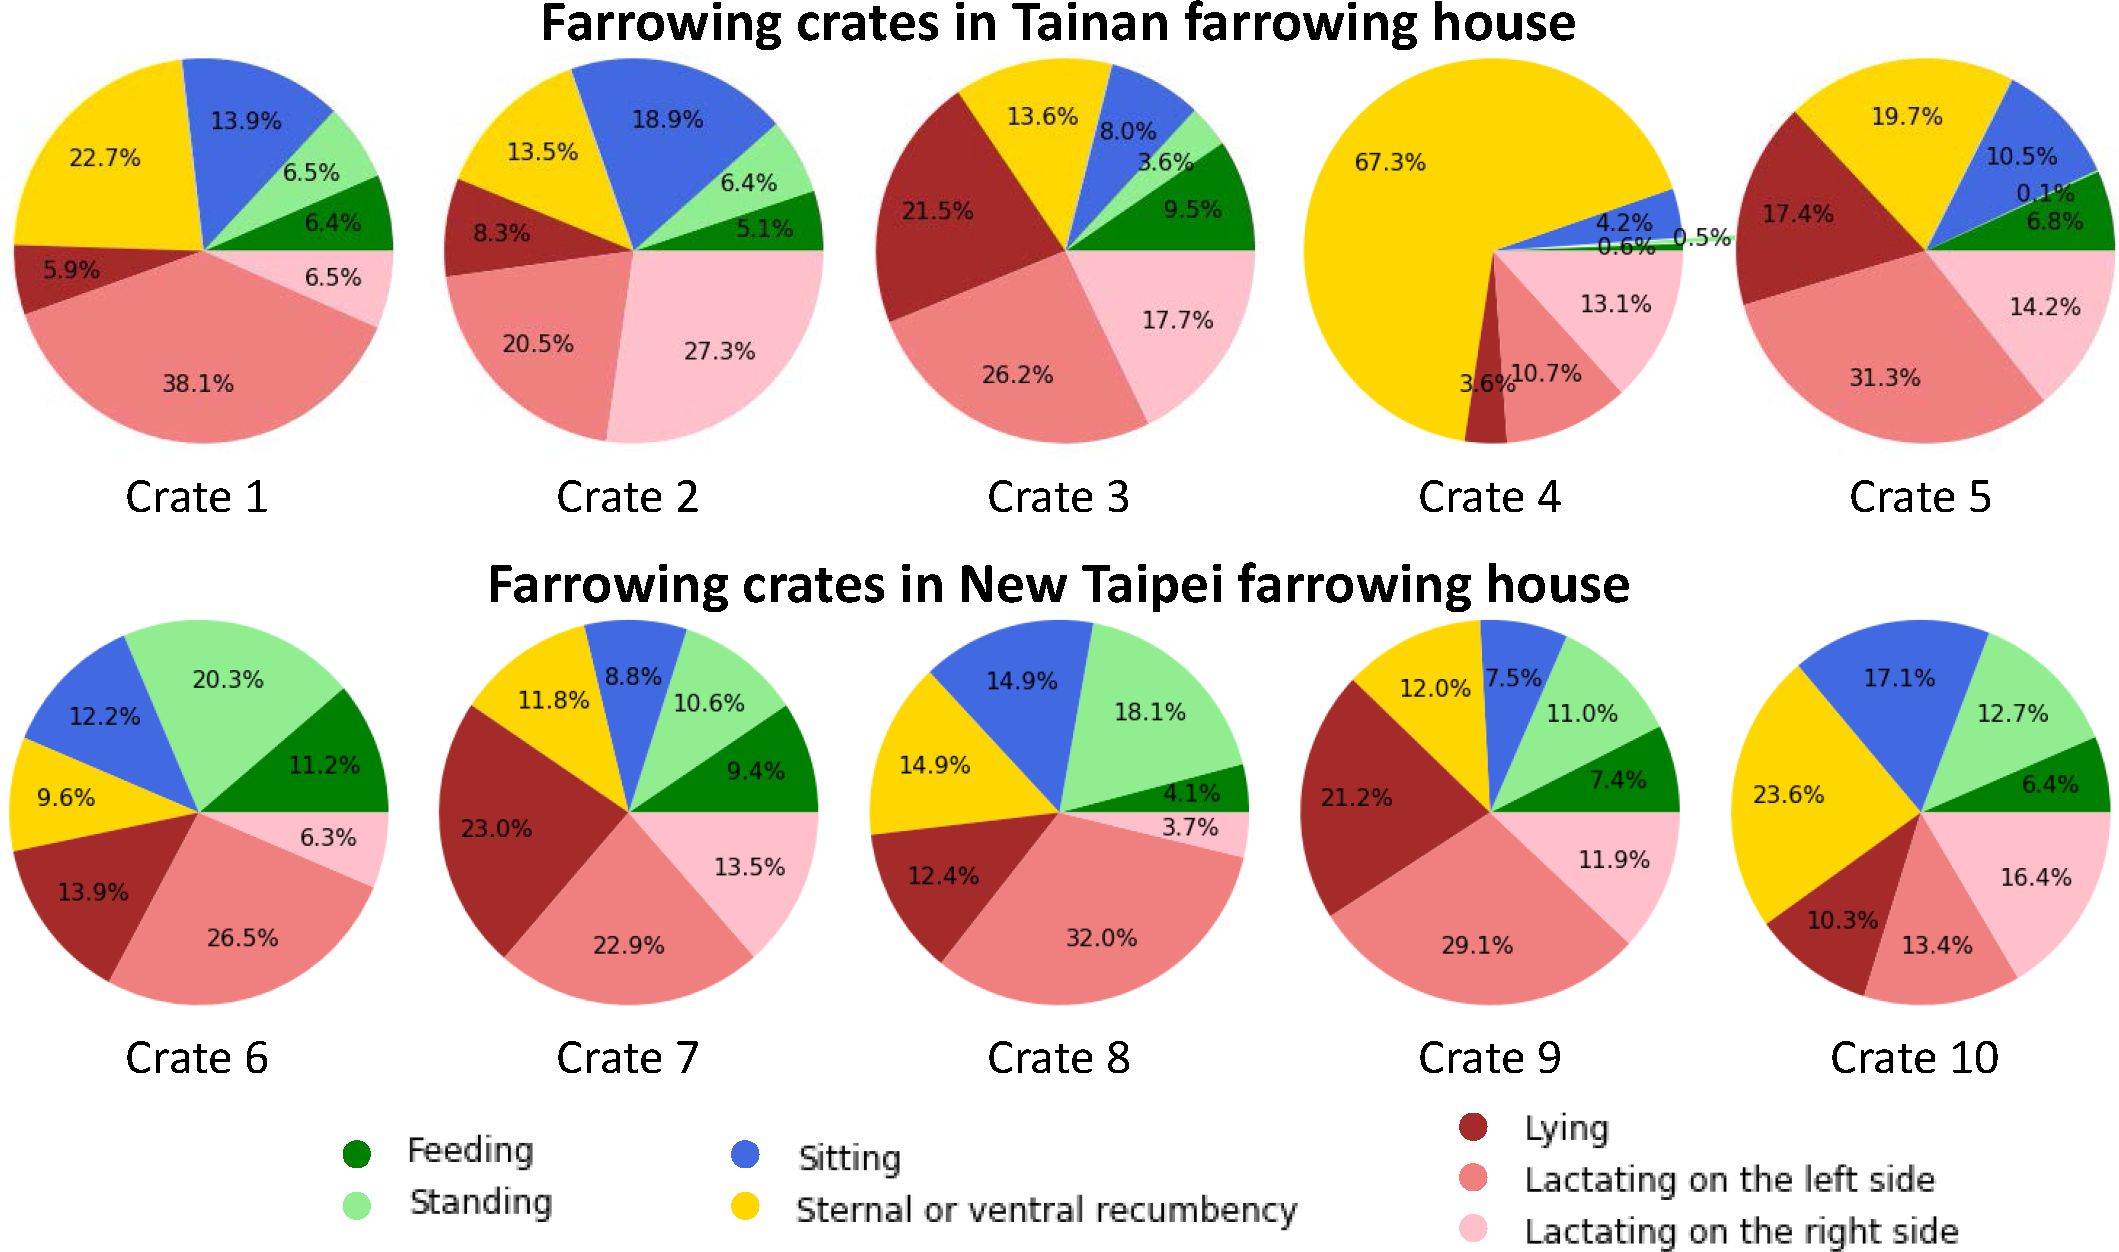
Figure 8 Daily percentage of sow postures in the long-term experiment.
The postures of the ten sows over the 15-day long-term experiment were identified using the trained SPRM (Figure 8). Statistics were subsequently calculated on a daily basis. The overall mean daily percentages ± standard deviations (SDs) of sow postures were 6.8% ± 2.9% for feeding, 8.8% ± 6.6% for standing, 11.8% ± 4.5% for sitting, 20.6% ± 16.3% for recumbency, 14.1% ± 6.5% for lying, and 38.1% ± 7.5% for lactating (25.2% ± 8.1% for lactating on the left side and 12.6% ± 6.2% for lactating on the right side).
Six daily metrics were subsequently calculated from the identified postures (Figure 9). Of the ten sows, the lactating time was 3.8 ± 0.75 (mean ± SD) hours per day. The lactating frequency was 17.5 ± 2.54 times. The feeding time was 0.7 ± 0.29 hours per day. The feeding frequency was 14.6 ± 5.36 times per day. The recumbency time was 2.1 ± 1.63 hours per day. The posture change frequency was 109.5 ± 23.51 times per day.
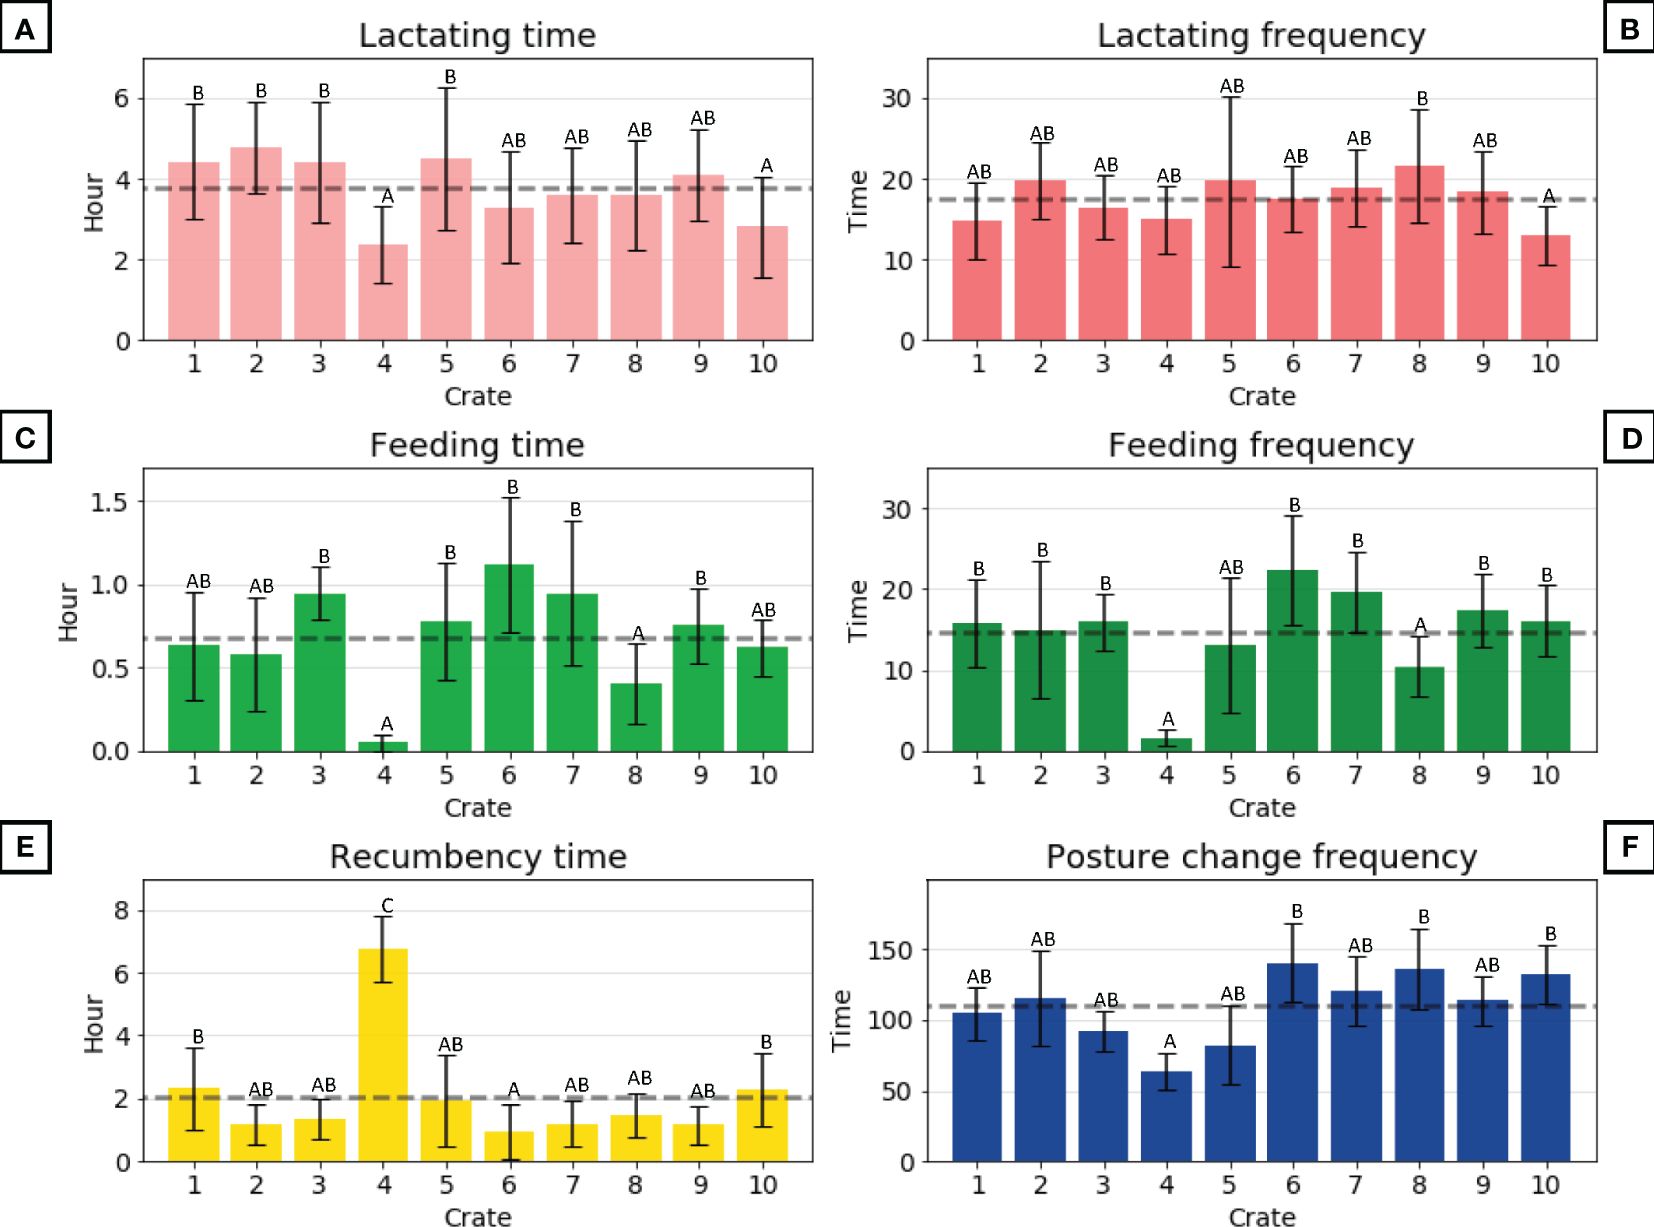
Figure 9 Mean daily (A) lactating time, (B) lactating frequency, (C) feeding time, (D) feeding frequency, (E) recumbency time, and (F) posture change frequency of the 10 sows in the long-term experiment. The error bars represent the standard deviations of the individuals. The horizontal dashed lines represent the overall mean values. The uppercase alphabets at the top of the bar plots denote groups of Bonferroni multiple comparison tests performed at a confidence level of 0.95.
The sow in crate 4, also referred to as sow 4, was observed as an anomaly. Compared with the other sows, sow 4 displayed significantly lower lactating time (p = 0.0006), feeding time (p = 0.0001), feeding frequency (p = 0.0001), and posture change frequency (p = 0.0001). Sow 4 also significantly excessed in recumbency time (p = 0.0001). In addition, sows 8 and 10 were observed as marginal anomalies. Sow 8 was significantly lower in feeding time (p = 0.0048) and feeding frequency (p = 0.0063). Sow 10 was significantly lower in lactating time (p = 0.0057) and lactating frequency (p = 0.0001). The aforementioned observations indicate that the proposed metrics are effective in identifying abnormal sows.
Ignoring the abnormal sow, it was also observed that the sows in the Tainan farm (crates 1, 2, 3, and 5) and the sows in the New Taipei farm (crates 6 to 10) significantly differed in lactating time (p = 0.0001) and posture change frequency (p = 0.0001). The mean lactating time of the four sows in the Tainan farm was 4.5 ± 0.14 (mean ± SD) hours per day. By contrast, the mean lactating time of the five sows in the New Taipei farm was 3.5 ± 0.42 hours per day. The mean posture change frequency of the four sows in the Tainan farm was 98.6 ± 12.59 times per day. By contrast, the mean posture change frequency of the sows in the New Taipei farm was lower at 128.6 ± 9.95 times per day. The aforementioned observations indicate that the proposed metrics are effective in quantifying the performance differences of sows in different farms.
The piglet localization performance of the trained YOLOv7 was evaluated using the 200 test images. The visualization threshold for piglet localization was set to a confidence score of 0.5. The IoU threshold for positive detection was set to 0.45. The model achieved a precision of 0.99, a recall of 0.99, an F-1 score of 0.99, and a mean average precision (mAP) of 99.6%.
Challenging scenarios in localizing piglets in the images were examined (Figure 10). The scenarios included incomplete piglet body due to occlusion and insufficient illumination. Under the condition illustrated in Figure 10A, the illumination was insufficient, which caused both the piglets and the background to appear dark. Under the conditions illustrated in Figure 10B, piglets were partially occluded by rails. Despite these challenges, the piglets were successfully detected.
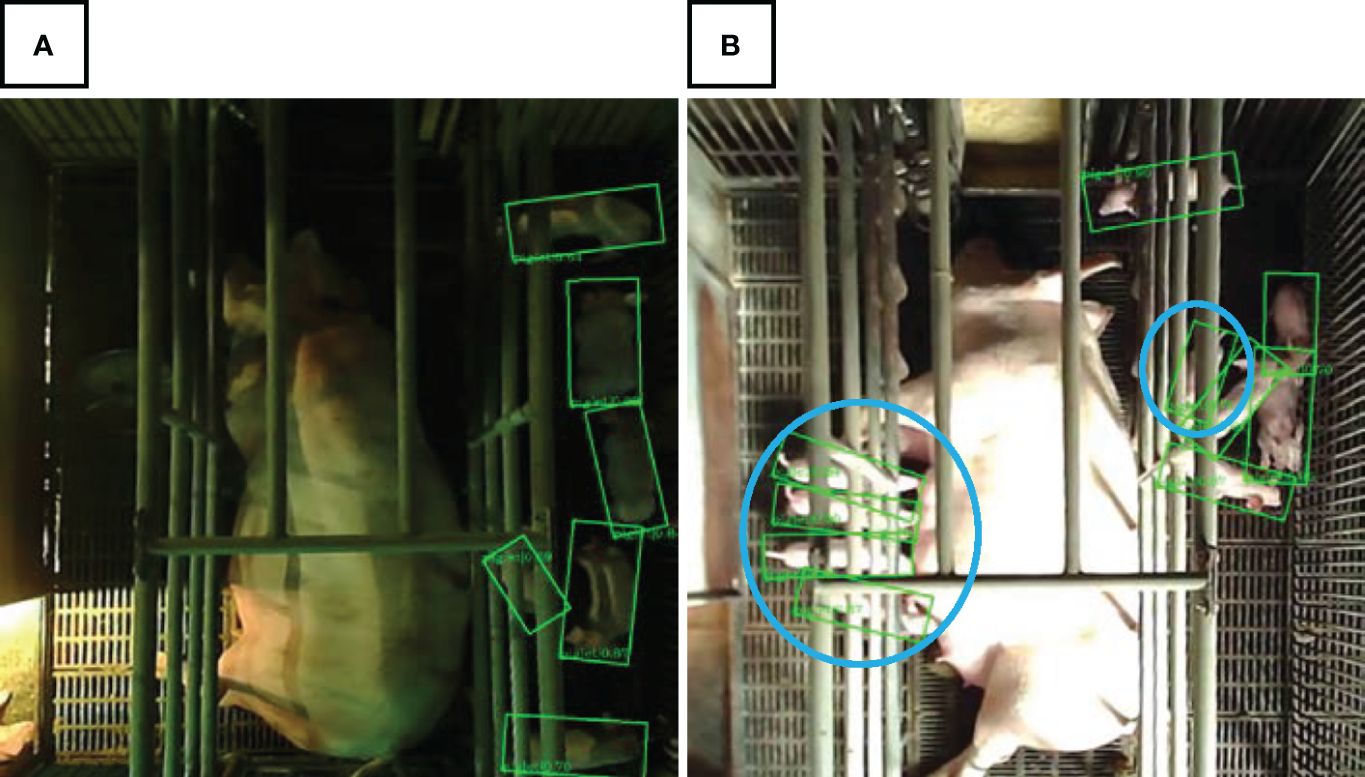
Figure 10 Successful cases of piglet localization under the challenges of (A) insufficient illumination and (B) partial occlusion.
Certain long-term videos were used to test the PLTM (i.e., YOLOv7 for localization and SORT for tracking). The videos were acquired from four different crates. The total length of the videos in each crate was one-minute. These videos were selected because there were multiple piglets present in the video and the piglets had a high level of motility. The GTs of the piglets were labeled using LabelImg (Tzutalin, 2015). The performance of piglet tracking was evaluated using multiple object tracking evaluation metrics (Milan et al., 2016). The proposed piglet tracking approach achieved an overall precision of 98.7%, a recall of 96.2%, and multiple object tracking accuracy (MOTA) of 94.6% (Table 3). The processing speed of the SORT was 166.3 frames per second.

Table 3 Evaluation result of piglet tracking.
The movements of the piglets in the 15-day long-term videos were quantified using the PLTM. For each crate, the daily movement, defined as the movement summation from 8:00 to 18:00, of the piglets was calculated (Figure 11). For each day, the 68.3% confidence intervals (mean ± 1 SD) of the daily movements of piglets in the ten crates were also calculated. In general, the daily movements increased gradually when the piglets grew, with an overall mean daily movement of 326.36 m on day one and an overall mean daily movement of 436.91 m on day fifteen. However, differences in daily movement among the crates were observed. Crates 5 to 10 demonstrated increasing trends in daily movement, with regression line slopes between 9.32 and 23.80. By contrast, crates 1, 2, 3, and 5 demonstrated essentially flat trends in daily movement, with regression line slopes between 0.18 and 1.99. On the other hand, crate 4 demonstrated a decreasing trend in daily movement. It was observed that there is a significant difference in the movement trend of the crates in Tainan farm and the crates in Taipei farm (p = 0.0001).
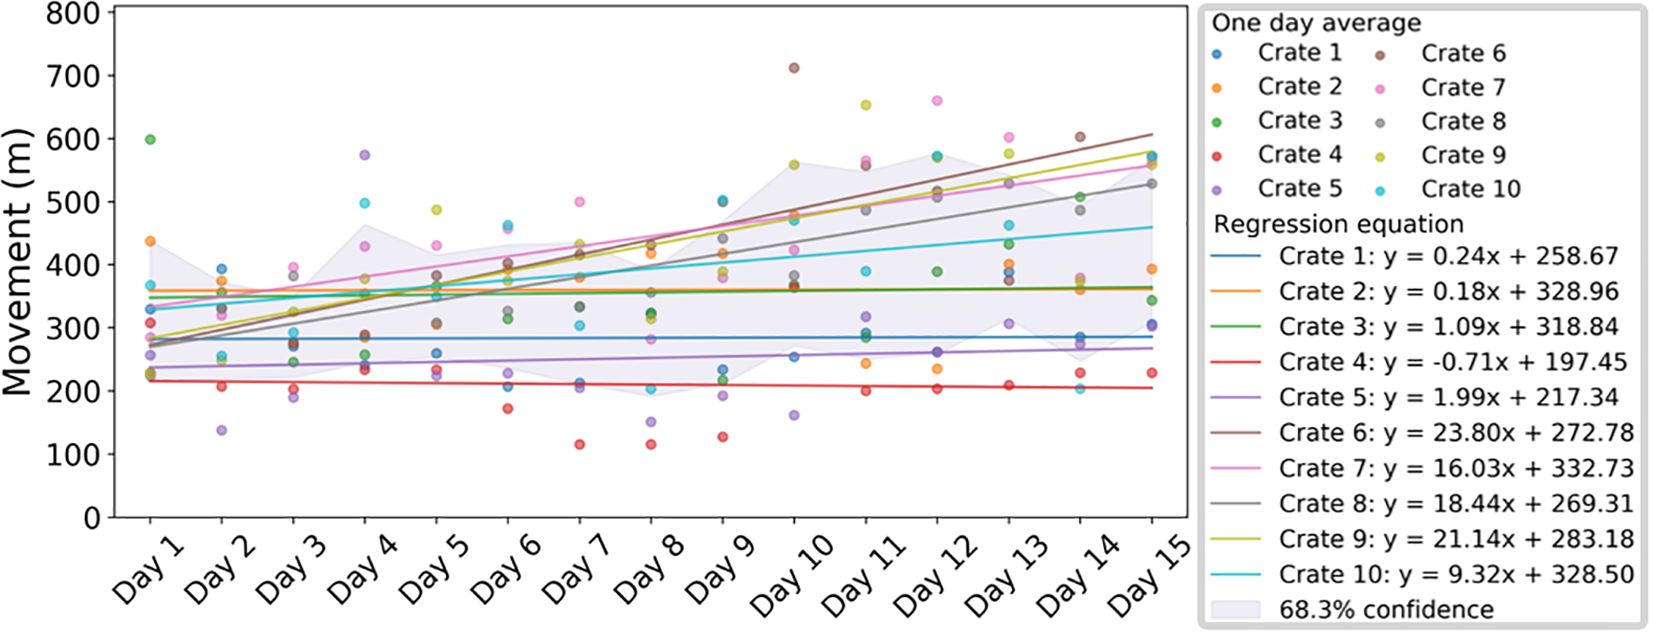
Figure 11 Daily piglet movements of the ten crates in the long-term experiment. The dots represent the mean daily movement. The lines represent the linear regression lines. The grey area represents the 68.3% confidence intervals of the daily movements.
To further analyze the movements of the piglets in different crates, the mean daily movement and SD of each of the ten crates over the 15 days of the long-term experiment were calculated (Supplementary Figure S1). Welch’s t-test indicates that the mean piglet movement of the crates in New Taipei farm was significantly higher than that of the crates in Tainan farm (p < 0.0001). The daily mean ± SD movement of the piglets in the Tainan farm was 291.84 ± 100.75 m. By contrast, the daily mean ± SD movement of the piglets in the Taipei farm was 421.52 ± 118.79 m.
Piglet activities over the 15-day long-term experiment were identified using the combination of the SPRM and PLTM (Figure 12). Statistics were subsequently calculated on a daily basis. The overall mean daily percentages ± SDs of piglet activity were 38.1% ± 7.5% for suckling, 22.2% ± 5.4% for active, and 39.7% ± 10.5% for rest. The piglets in crate 4 were observed to have the lowest active time and the longest rest time compared to the piglets in other crates. The active time of the piglets in crate 4 was 9.7% lower than the overall mean active time. The rest time of the piglets in crate 4 was 24.0% higher than the overall mean rest time. Furthermore, it was observed that the piglets in crate 10 had comparatively more rest time (Figure 12). The piglets in crate 10 rested 9.2% more than the overall mean rest time.
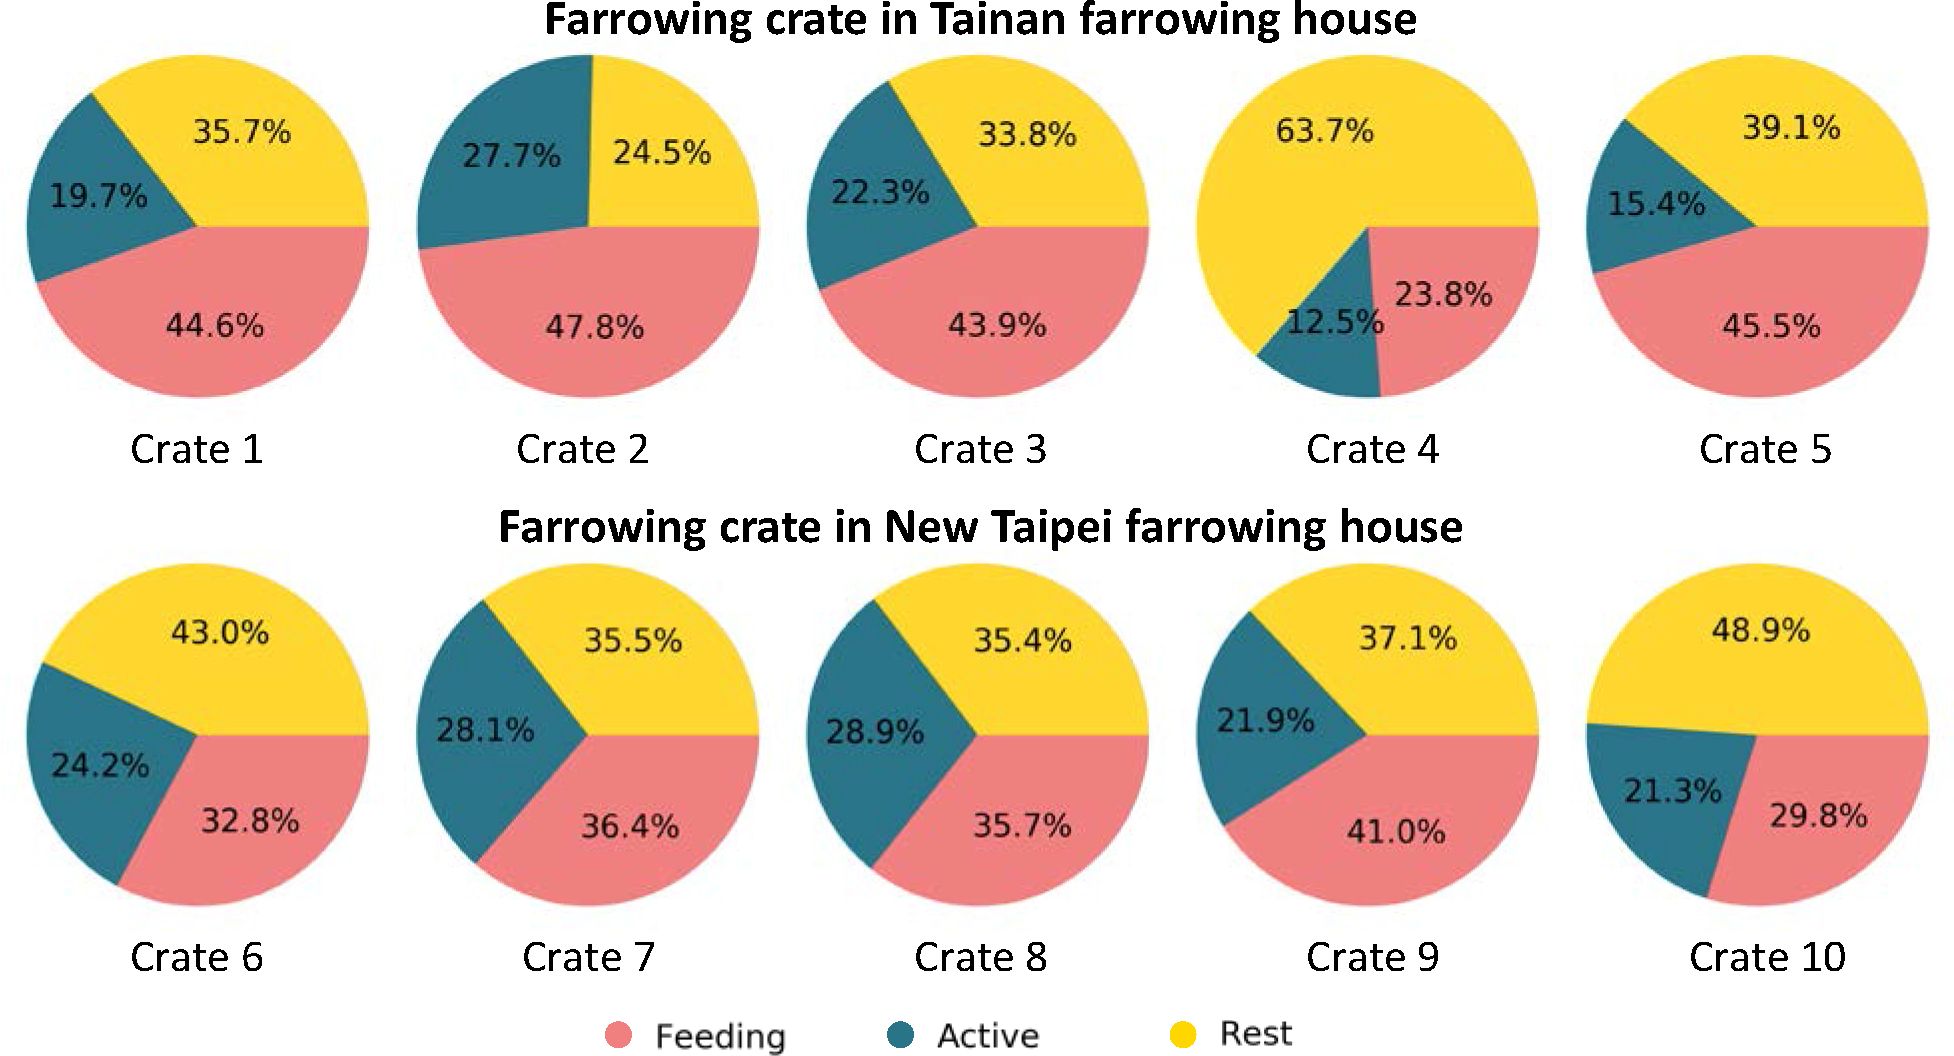
Figure 12 Daily percentages of piglet activities in the long-term experiment.
Unfed piglets were detected using the combination of the SPRM and PLTM (Section 2.8). The performance of unfed piglet detection was tested using 300 images with unfed piglets, achieving a precision of 98.4% and a recall of 90.7%. Figure 13 demonstrates examples of detected unfed piglets (framed with red boxes). The unfed piglets were detected regardless of whether the sows were lactating on the left or on the right under various illumination conditions.
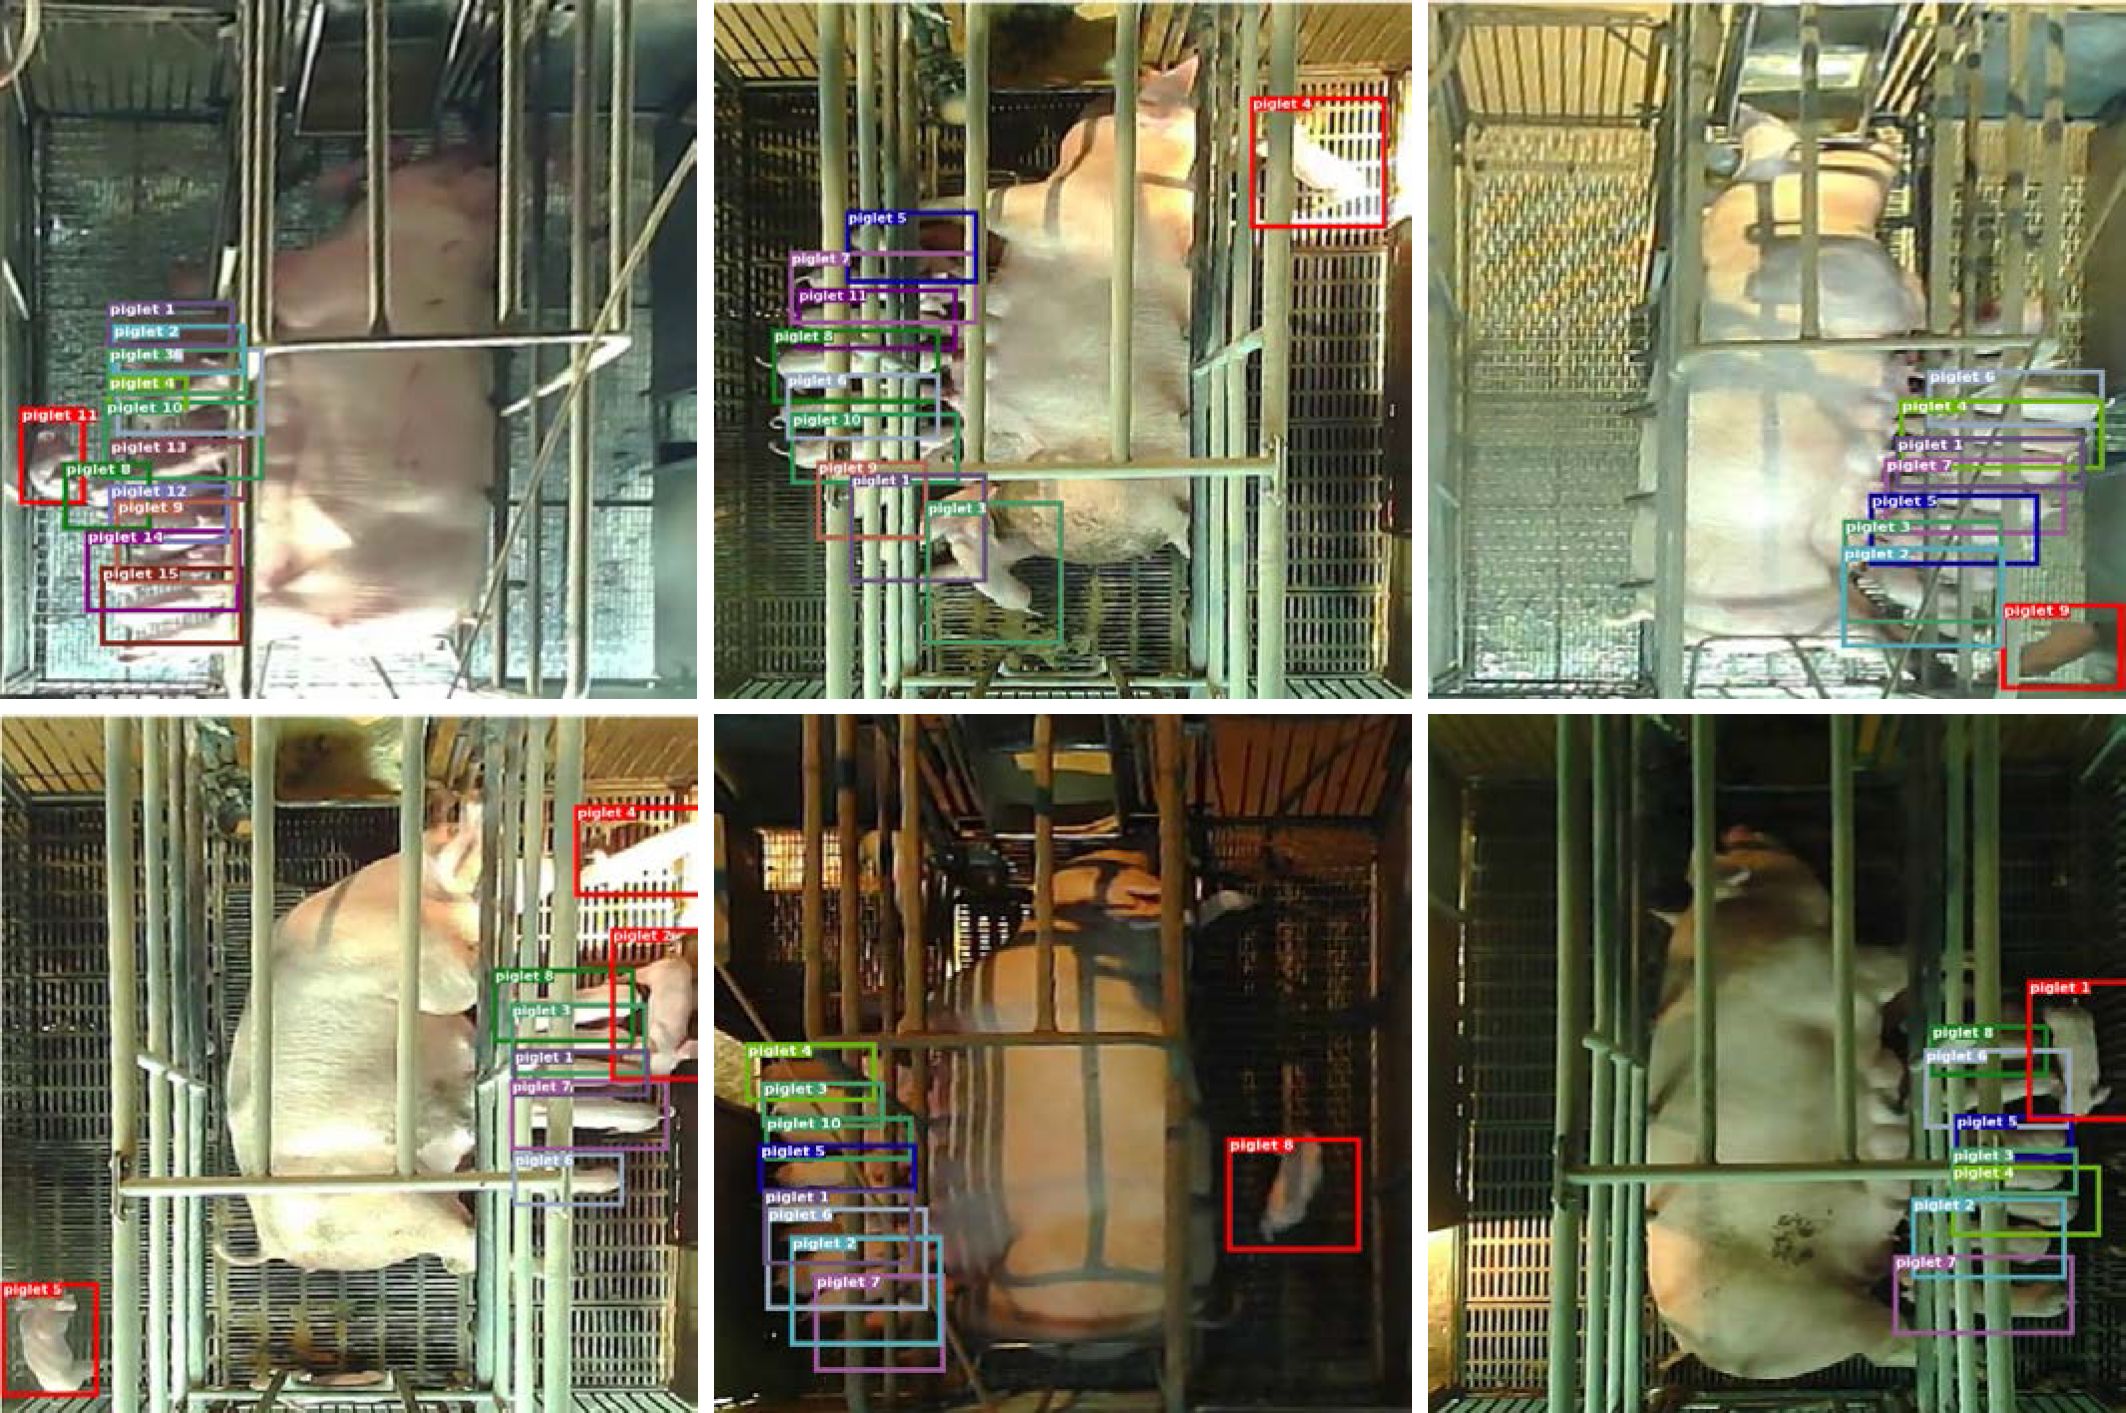
Figure 13 Visualization of unfed piglets. Unfed piglets were framed in red.
The percentages of unfed piglet events for each crate in the 15-days were examined (Supplementary Figure S2A). An unfed piglet event was logged for each lactation period with at least one unfed piglet. The percentage of unfed piglet event was defined as the number of unfed piglet events divided by the number of lactation events. Across the ten crates, the overall daily percentage of unfed piglet events was 16.9% ± 12.2% (mean ± SD). By observing Supplementary Figure S2A, crate 8 was found to have a significantly higher percentage of unfed piglet events (p = 0.0241). The percentage of unfed piglet events in the first three days after piglet birth was also examined (Supplementary Figure S2B). The first three days were chosen because this is the period with the highest piglet mortality. On average, the overall percentage of unfed piglet events in the first three days was 6.0% higher than that of in the 15-days period. From Supplementary Figure S2B, it was observed that crate 8 had significantly higher incidences of unfed piglet events (p = 0.0001).
Piglet tracking is computationally intensive. Experiments were conducted to see if reducing the frame rate in piglet tracking could still achieve a reasonable performance. Originally, piglets were detected and tracked at a frame rate of 5 fps (Section 2.7). As an experiment, the tracking performance of the trained PLTM at a frame rate of 1 fps was examined. The experiment was performed using the same test videos in Section 3.4. The results indicated that, at 1 fps, the proposed piglet tracking approach achieved an overall precision of 94.6%, an overall recall of 85.3%, and an overall MOTA of 78.5% (Table 4). The precision, recall, and MOTA were reduced by 4.1%, 10.9%, and 16.1%, respectively, when the frame rate changed from 5 fps to 1 fps. Reducing the frame rate considerably decreases the tracking performance and is not preferable if accurate quantification of piglet movements is required.
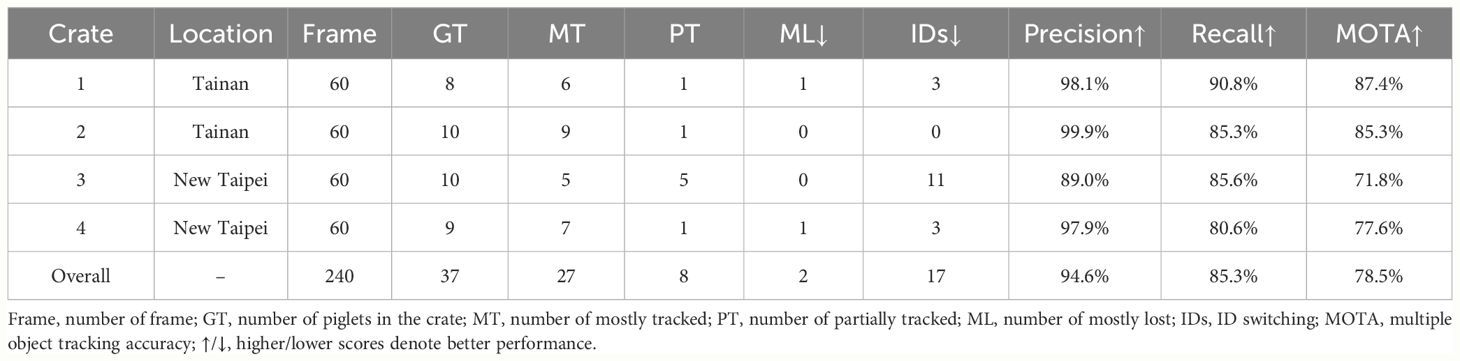
Table 4 Evaluation result of piglet tracking at a rate of 1 fps.
The long-term sow posture analysis (Section 3.2) revealed some information regarding the health status of the sows. It was observed that sow 4 spent a lot of time in the recumbency posture (Figures 8, 9), indicating that sow 4 was reluctant to lactate and to feed. The sow’s reluctance may be due to injured teats or illness. Most sows with injured teats stay in the recumbency position to reduce piglet suckling, as this position largely covers the teats (De Passillé and Robert, 1989). On the other hand, a lack of appetite is a clear indicator of sickness for pigs (Global Ag Media, 2018). It was also observed that certain sows (sows 8 and 10) had marginal metrics (Figures 8, 9). Although the reasons for low feeding frequency for sow 8 and the reasons for low lactating time and low lactating frequency for sow10 were unclear, the proposed approach effectively revealed the issues. The proposed approach may be a tool for assisting the management of pig farrowing houses.
There are two remaining drawbacks of the proposed approach: (1) not being able to track individual piglet and (2) not being able to monitor night activities. The proposed approach tracked the movement of a piglet litter. This is because the videos were stored as one-minute clips. The identifications of the piglets in different clips were reassigned, making it computationally costly to track individual piglet across the clips. Although elongating the clip time may be a solution, a short clip time is needed to accurately identify the postures of sows. Thus, an appropriate clip time is needed. As for the second drawback, night activities cannot be monitored because the cameras used in this study do not have infrared capability. Certain cameras have both infrared and RGB channels and can acquire videos in low-light or nighttime conditions, allowing for continuous monitoring and analysis of nocturnal nursing behaviors of sows and piglets. However, infrared videos are monochrome. Additional deep neural networks are needed to process infrared videos. Implementing dual channel (i.e., RGB and infrared) cameras and training additional deep neural networks are follow-up works of this study.
The proposed approach can accurately and continuously monitor the lactating-related behaviors of sows and their piglets. Lactating-related behaviors are essential information for pig farming. Instead of patrolling the farrowing houses frequently, farmers can identify abnormal behaviors by checking the readings from computers and take necessary actions, such as closely observing those abnormal sows and piglets, giving additional nutrients as sow milk replacer, or asking for diagnosis assistance from veterinarians. In addition, the proposed approach can help in precisely determining abnormality. Lactating-related behaviors of sows and piglets vary with breed, location, and ambient conditions. Through collecting lactating-related behaviors on a vast number of sows and piglets, statistical tools can determine the edge between normality and abnormality objectively.
The information collected can help pig farmers to identify problematic sows and piglets early. Thus, the sows and piglets can get necessary assistance in time. During the experiment of our study, we found that the sow in crate 4 was problematic. We informed the farm manager immediately and had an online discussion with him regarding the issues of the sow. The manager later mentioned that sow 4 may have injured teats and had pain when piglets suckled, causing the sow being reluctant to lactate and staying in the recumbency posture. The information provided by the proposed approach alleviates the pain of the sow. In addition, during the discussion with the farm manager, he realized the effectiveness of continuous monitoring of sows and their piglets. The collected videos and statistical analyses provide some essential information. The issues of sows and piglets could be diagnosed online. The recorded videos and corresponding statistics could also serve as some educational materials for pig farmers, veterinarians, or researchers working on precision pig farming.
This study proposed a system to monitor the lactation-related behaviors of sows and their piglets in farrowing crates simultaneously and continuously. Over 5,000 hours of video were captured from farrowing crates using embedded systems. A novel two-module approach consisting of the SPRM and PLTM was employed to monitor sow postures and quantify piglet movements. Subsequently, six metrics of the sow were defined and calculated daily from the seven postures identified by the SPRM. Three activities of the piglets were defined and calculated cooperatively using the SPRM and PLTM. The trained SPRM and PLTM achieved an overall accuracy of 91.36% and a MOTA of 94.6%, respectively. In long-term analysis performed over a 15-day span, the SPRM and PLTM successfully identified an anomalously lactating crate through statistically significant deviations in sow posture frequency and mean piglet movement. Unfed piglet events were further detected using the combination of the SPRM and PLTM. Detection of unfed piglet events achieved a precision and recall of 98.4% and 90.7%, respectively. The proposed approach is a first step towards a total solution to automatically monitor the lactation-related behaviors of both the sow and her piglets. An assortment of calculated metrics for sow posture and piglet activity enable the objective assessment and statistical analysis of preweaning lactation-related behaviors. Further research combining animal-based data can be conducted to interpret and validate the relationship between these metrics and the health of sows and piglets. This will enable the system to provide useful insight to help pig farmers prevent preweaning mortality and thereby increasing pig farming efficiency.
The datasets presented in this article are not readily available because the data are owned by the Ministry of Agriculture, Taiwan. Requests to access the datasets should be directed to Y-FK, eWt1b0BudHUuZWR1LnR3.
Ethical review and approval were not required for the animal study because the sows and piglets were exclusively observed from the video and the observer did not come into direct contact with them and none of the animals was handled or restricted at any time for this study.
Y-JT: Data curation, Formal analysis, Investigation, Software, Visualization, Writing – original draft. Y-CH: Data curation, Formal analysis, Investigation, Methodology, Software, Visualization, Writing – original draft. E-CL: Conceptualization, Writing – review & editing. S-CL: Software, Validation, Visualization, Methodology, Writing – original draft. X-CH: Validation, Visualization, Writing – review & editing. JT: Methodology, Software, Visualization, Writing – original draft. C-EC: Software, Validation, Writing – original draft. Y-FK: Conceptualization, Funding acquisition, Investigation, Methodology, Project administration, Resources, Supervision, Validation, Writing – original draft, Writing – review & editing.
The author(s) declare financial support was received for the research, authorship, and/or publication of this article. This research was supported by the Ministry of Agriculture, Taiwan, under grants 108AS-13.2.11-ST-a3 and 109AS-11.3.2-STa1.
We thank Tungying Co., Ltd., for providing the experimental site.
The authors declare that the research was conducted in the absence of any commercial or financial relationships that could be construed as a potential conflict of interest.
All claims expressed in this article are solely those of the authors and do not necessarily represent those of their affiliated organizations, or those of the publisher, the editors and the reviewers. Any product that may be evaluated in this article, or claim that may be made by its manufacturer, is not guaranteed or endorsed by the publisher.
The Supplementary Material for this article can be found online at: https://www.frontiersin.org/articles/10.3389/fanim.2024.1431285/full#supplementary-material
Council of Agriculture (2022). AG. STATISTICS YEARBOOK 2022 (Taiwan: Council of Agriculture, Executive Yuan, Taiwan). Available at: https://agrstat.moa.gov.tw/sdweb/public/inquiry/InquireAdvance.aspx.
Cowton J., Kyriazakis I., Bacardit J. (2019). Automated individual pig localisation, tracking and behaviour metric extraction using deep learning. IEEE Access 7, 108049–108060. doi: 10.1109/Access.6287639
da Silva K. F., Silva B. A., Eskinazi S., Jacob D. V., Araujo W. A., Tolentino R. L., et al. (2020). Influence of flavored drinking water on voluntary intake and performance of nursing and post-weaned piglets. Livestock Sci. 242, 104298. doi: 10.1016/j.livsci.2020.104298
De Passillé A. M. B., Robert S. (1989). Behaviour of lactating sows: influence of stage of lactation and husbandry practices at weaning. Appl. Anim. Behav. Sci. 23, 315–329. doi: 10.1016/0168-1591(89)90100-7
Gan H., Ou M., Zhao F., Xu C., Li S., Chen C., et al. (2021). Automated piglet tracking using a single convolutional neural network. Biosyst. Eng. 205, 48–63. doi: 10.1016/j.biosystemseng.2021.02.010
Global Ag Media (2018). Recognising disease on the farm (Taiwan: Global Ag Media). Available at: https://www.thepigsite.com/disease-and-welfare/managing-disease/recognising-disease-on-the-farm.
Ho K. Y., Tsai Y. J., Kuo Y. F. (2021). Automatic monitoring of lactation frequency of sows and movement quantification of newborn piglets in farrowing houses using convolutional neural networks. Comput. Electron. Agric. 189, 106376. doi: 10.1016/j.compag.2021.106376
Hochreiter S., Schmidhuber J. (1997). Long short-term memory. Neural Comput. 9, 1735–1780. doi: 10.1162/neco.1997.9.8.1735
Kalman R. E. (1960). A new approach to linear filtering and prediction problems. J. Basic Eng. 82(1), 35–45. doi: 10.1115/1.3662552
Kim J., Suh Y., Lee J., Chae H., Ahn H., Chung Y., et al. (2022). EmbeddedPigCount: Pig counting with video object detection and tracking on an embedded board. Sensors 22, 2689. doi: 10.3390/s22072689
Kingma D. P., Ba J. (2014). Adam: A method for stochastic optimization. arXiv preprint arXiv:1412.6980. doi: 10.48550/arXiv.1412.6980
Kuhn H. W. (1955). The Hungarian method for the assignment problem. Naval Res. logistics Q. 2, 83–97. doi: 10.1002/nav.3800020109
Küster S., Nolte P., Meckbach C., Stock B., Traulsen I. (2021). Automatic behavior and posture detection of sows in loose farrowing pens based on 2D-video images. Front. Anim. Sci. 64. doi: 10.3389/fanim.2021.758165
Liu W., Anguelov D., Erhan D., Szegedy C., Reed S., Fu C. Y., et al. (2016). “Ssd: Single shot multibox detector,” in Computer Vision–ECCV 2016: 14th European Conference, Amsterdam, The Netherlands, October 11–14, 2016, Proceedings, Part I, Vol. 14. 21–37 (New York city: Springer International Publishing).
Milan A., Leal-Taixé L., Reid I., Roth S., Schindler K. (2016). MOT16: A benchmark for multi-object tracking. arXiv preprint arXiv:1603.00831. doi: 10.48550/arXiv.1603.00831
Muns R., Manzanilla E. G., Sol C., Manteca X., Gasa J. (2013). Piglet behavior as a measure of vitality and its influence on piglet survival and growth during lactation. J. Anim. Sci. 91, 1838–1843. doi: 10.2527/jas.2012-5501
Muns R., Nuntapaitoon M., Tummaruk P. (2016). Non-infectious causes of pre-weaning mortality in piglets. Livestock Sci. 184, 46–57. doi: 10.1016/j.livsci.2015.11.025
National Animal Industry Foundation (2020). TAIWAN PIG PRODUCTION STATISTICS. Available online at: https://www.naif.org.tw/upload/238/20210809_115649.65400.pdf.
Psota E. T., Schmidt T., Mote B., C. Pérez L. (2020). Long-term tracking of group-housed livestock using keypoint detection and map estimation for individual animal identification. Sensors 20, 3670. doi: 10.3390/s20133670
Racewicz P., Ludwiczak A., Skrzypczak E., Składanowska-Baryza J., Biesiada H., Nowak T., et al. (2021). Welfare health and productivity in commercial pig herds. Animals 11, 1176. doi: 10.3390/ani11041176
Redmon J., Farhadi A. (2018). Yolov3: An incremental improvement. arXiv preprint arXiv:1804.02767. doi: 10.48550/arXiv.1804.02767
Tan M., Le Q. (2019). “Efficientnet: Rethinking model scaling for convolutional neural networks,” in International conference on machine learning. 6105–6114 (PMLR).
Tomas K., Savaglia J., Plush K. J., D’Souza D. N., Butler K. L., Hemsworth P. H., et al. (2024). Maternal contact and positive human interactions during lactation impacts piglet performance and behaviour during lactation. Front. Anim. Sci. 4. doi: 10.3389/fanim.2023.1289518
Tzutalin D. (2015). LabelImg. Available online at: https://github.com/tzutalin/labelImg.
Van Beirendonck S., Van Thielen J., Verbeke G., Driessen B. (2014). The association between sow and piglet behavior. J. Veterinary Behav. 9, 107–113. doi: 10.1016/j.jveb.2014.01.005
Wang C. Y., Bochkovskiy A., Liao H. Y. M. (2023). “YOLOv7: Trainable bag-of-freebies sets new state-of-the-art for real-time object detectors,” in Proceedings of the IEEE/CVF conference on computer vision and pattern recognition. 7464–7475.
Wang Z., Bovik A. C., Sheikh H. R., Simoncelli E. P. (2004). Image quality assessment: from error visibility to structural similarity. IEEE Trans. Image Process 13, 600–612. doi: 10.1109/TIP.2003.819861
Wang M., Larsen M., Bayer F., Maschat K., Baumgartner J., Rault J. L., et al. (2021). A PCA-based frame selection method for applying CNN and LSTM to classify postural behaviour in sows. Comput. Electron. Agric. 189, 106351. doi: 10.1016/j.compag.2021.106351
Wischner D., Kemper N., Stamer E., Hellbruegge B., Presuhn U., Krieter J. (2009). Characterisation of sows’ postures and posture changes with regard to crushing piglets. Appl. Anim. Behav. Sci. 119, 49–55. doi: 10.1016/j.applanim.2009.03.002
Wojke N., Bewley A., Paulus D. (2017). “Simple online and realtime tracking with a deep association metric,” in 2017 IEEE international conference on image processing (ICIP). 3645–3649 (IEEE).
Yang A., Huang H., Zhu X., Yang X., Chen P., Li S., et al. (2018). Automatic recognition of sow nursing behaviour using deep learning-based segmentation and spatial and temporal features. Biosyst. Eng. 175, 133–145. doi: 10.1016/j.biosystemseng.2018.09.011
Zhang Y., Cai J., Xiao D., Li Z., Xiong B. (2019). Real-time sow behavior detection based on deep learning. Comput. Electron. Agric. 163, 104884. doi: 10.1016/j.compag.2019.104884
Zheng C., Yang X., Zhu X., Chen C., Wang L., Tu S., et al. (2020). Automatic posture change analysis of lactating sows by action localisation and tube optimisation from untrimmed depth videos. Biosyst. Eng. 194, 227–250. doi: 10.1016/j.biosystemseng.2020.04.005
Keywords: sow posture, piglet movement, unfed piglet detection, pig feeding, suckling sow posture, suckling
Citation: Tsai Y-J, Huang Y-C, Lin E-C, Lai S-C, Hong X-C, Tsai J, Chiang C-E and Kuo Y-F (2024) Monitoring the lactation-related behaviors of sows and their piglets in farrowing crates using deep learning. Front. Anim. Sci. 5:1431285. doi: 10.3389/fanim.2024.1431285
Received: 11 May 2024; Accepted: 25 June 2024;
Published: 22 July 2024.
Edited by:
Andrea Pezzuolo, University of Padua, ItalyReviewed by:
Madonna Benjamin, Michigan State University, United StatesCopyright © 2024 Tsai, Huang, Lin, Lai, Hong, Tsai, Chiang and Kuo. This is an open-access article distributed under the terms of the Creative Commons Attribution License (CC BY). The use, distribution or reproduction in other forums is permitted, provided the original author(s) and the copyright owner(s) are credited and that the original publication in this journal is cited, in accordance with accepted academic practice. No use, distribution or reproduction is permitted which does not comply with these terms.
*Correspondence: Yan-Fu Kuo, eWt1b0BudHUuZWR1LnR3
Disclaimer: All claims expressed in this article are solely those of the authors and do not necessarily represent those of their affiliated organizations, or those of the publisher, the editors and the reviewers. Any product that may be evaluated in this article or claim that may be made by its manufacturer is not guaranteed or endorsed by the publisher.
Research integrity at Frontiers
Learn more about the work of our research integrity team to safeguard the quality of each article we publish.