 Luca Cattaneo
 Matilde Maria Passamonti1
 Fiorenzo Piccioli-Cappelli
 Erminio Trevisi
- 1Department of Animal Sciences, Food and Nutrition, Faculty of Agriculture, Food and Environmental Science, Università Cattolica del Sacro Cuore, Piacenza, Italy
- 2Romeo and Enrica Invernizzi Research Center for Sustainable Dairy Production of the Università Cattolica del Sacro Cuore (CREI), Piacenza, Italy
Improving the synchronization between the pattern of milk synthesis and nutrient availability throughout the day could enhance production efficiency. In this study, we evaluated the effects of changing feed delivery time on milk production, feeding behavior, and the daily rhythms of blood biomarkers. Eight multiparous Holstein cows housed in a tie-stall barn with controlled environmental conditions were enrolled in a crossover experimental design with three periods of 14 days and three treatments each. Cows were milked twice daily (0530 and 1730 h) and were individually fed with two equal meals of forage and eight equal meals of concentrate during the day. Forage meals were provided at 12-hour intervals either: (i) 5 h before each milking (0030 and 1230 h; BM), (ii) at the end of each milking (0530 and 1730 h; ME), (iii) or 2 h after (0730 and 1930 h; AM). Feed intake and feeding behavior were monitored, and milk production and composition were measured. Blood samples were collected every 4 days at 0700 h and, during the last day of each period, 15 times daily to determine metabolic profiles, hormones, and their daily rhythmicity by the cosinor analysis. Changing forage delivery time did not affect milk yield and dry matter intake. No difference was observed in feeding behavior when expressed relative to the first meal. There were no significant differences in milk component contents and yields. In samples collected at 0700 h, ME had reduced plasma calcium (Ca), magnesium (Mg), and potassium (K) and increased sodium (Na). AM had increased inflammation, as suggested by the greater blood globulin and ceruloplasmin. The patterns of metabolic biomarkers had limited variations when expressed relative to the first forage meal. Nevertheless, the daily rhythms of these biomarkers were remarkably different. Under our conditions, feeding forage meals to cows at different times of the day did not influence productive performance but highlighted the importance of considering the sampling time when interpreting metabolic profiles.
1 Introduction
Relevant changes in blood metabolites and hormones occur during the day in dairy cows (Cattaneo et al., 2023a). Feeding frequency and behavior along with the stage of lactation can explain the different endocrine-metabolic patterns during the day (Cattaneo et al., 2023a). Most hormones show dramatic fluctuations on a circadian basis (i.e. about 24-h) that are superimposed on the ultradian, or pulsatile, release of many hormones (Dibner et al., 2010). It is generally suggested that these changes are regulated by the 24-hour light-dark cycle (Turek, 1994), but other internal and external stimuli can modify it. In mammals, the mechanism is linked to the response of the suprachiasmatic nucleus of the hypothalamus which is sensitive to light and non-photic factors (Hastings et al., 2019). Among the non-photic factors, feed intake is known to train circadian rhythms, particularly in peripheral tissues (Harvatine, 2023; Turek, 1994). Milk synthesis rhythms seem to be regulated by the circadian clock of the mammary gland (Salfer and Harvatine, 2020). In dairy cows, milk production is higher in the morning compared with the evening, whereas fat and protein contents have the opposite trend (Plaut and Casey, 2012; Quist et al., 2008). This is likely the result of an adaptive strategy aimed at providing offspring with nutrients (Casey et al., 2022). Synchronizing the pattern of milk synthesis with that of nutrient availability (i.e., feed intake and rumen fermentation) would allow improved efficiency of production (Harvatine, 2023).
Furthermore, blood sampling for metabolic profile assessment is used as a diagnostic tool (Van Saun, 2023). The interpretation of blood metabolic profiles (or hormones) can be strongly misled if the daily change factors are not considered (i.e., feed delivery and sampling times). For instance, according to Wylie et al. (2008) and Bertoni and Trevisi (2013), the optimal time to sample blood in early-lactating cows to estimate energy balance is before the morning feeding because of the milder influence of intake.
In commercial settings with milking parlors, feed is commonly delivered at or immediately after the morning milking. Because fresh feed delivery time stimulates cows to eat (DeVries and von Keyserlingk, 2005), cows typically have their main meal in the morning. However, feeding behavior can be altered by, among other factors, overstocking, social interactions, and management (i.e., automatic milking). Lower-ranked cows in the social hierarchy are more easily displaced from the feeding area, particularly with overstocking (Huzzey et al., 2006). Thus, these cows tend to eat at times that are shifted from the feed delivery time.
We hypothesized that feeding cows at different times relative to milking would affect feeding behavior, milk composition, and concentrations of circulating metabolites and hormones. The present study characterized the variations in feed intake, milk production, and blood biomarkers in late-lactation dairy cows fed at the same time of milking, 2 h after, or 5 h before.
2 Materials and methods
2.1 Animal management and experimental design
The research was carried out at the Università Cattolica del Sacro Cuore dairy research barn (Piacenza, Italy) under Italian laws on animal experimentation and ethics (DL n. 116, 27/01/1992). Eight multiparous Holstein dairy cows (lactation number = 3.0 ± 0.9; milk yield = 37.1 ± 11.6 kg/d; BW = 709 ± 83 kg; BCS = 2.8 ± 0.4; mean ± SD) were enrolled in late lactation (266 ± 123 DIM) in a 3×3 cross-over design. Cows were housed in tie-stalls in a 4-place chamber under controlled environmental conditions (room temperature of 20°C, relative humidity of 65%) and lighting (15 h of light, from 0430 to 1930 h). They were milked twice a day (0530 and 1730 h). The feeding strategy is displayed in Figure 1. In each experimental period, cows were individually fed with two equal meals of forage and eight equal meals of concentrate. Forage meals were provided at 12-h intervals either 5 h before (0030 and 1230 h; BM), at the end (0530 and 1730 h; ME), or 2 h after each milking (0730 and 1930 h; AM) for 14-d experimental periods. Each forage meal consisted of 11 kg of corn silage, 1.5 kg of dehydrated alfalfa hay, and 1.2 kg of dehydrated grass hay, on average. Concentrate meals (1 kg/d every 3 kg/d of milk; 11.7 kg/d on average) were distributed every 3h by automatic feeders, starting from 30 min before the 1st forage meal.
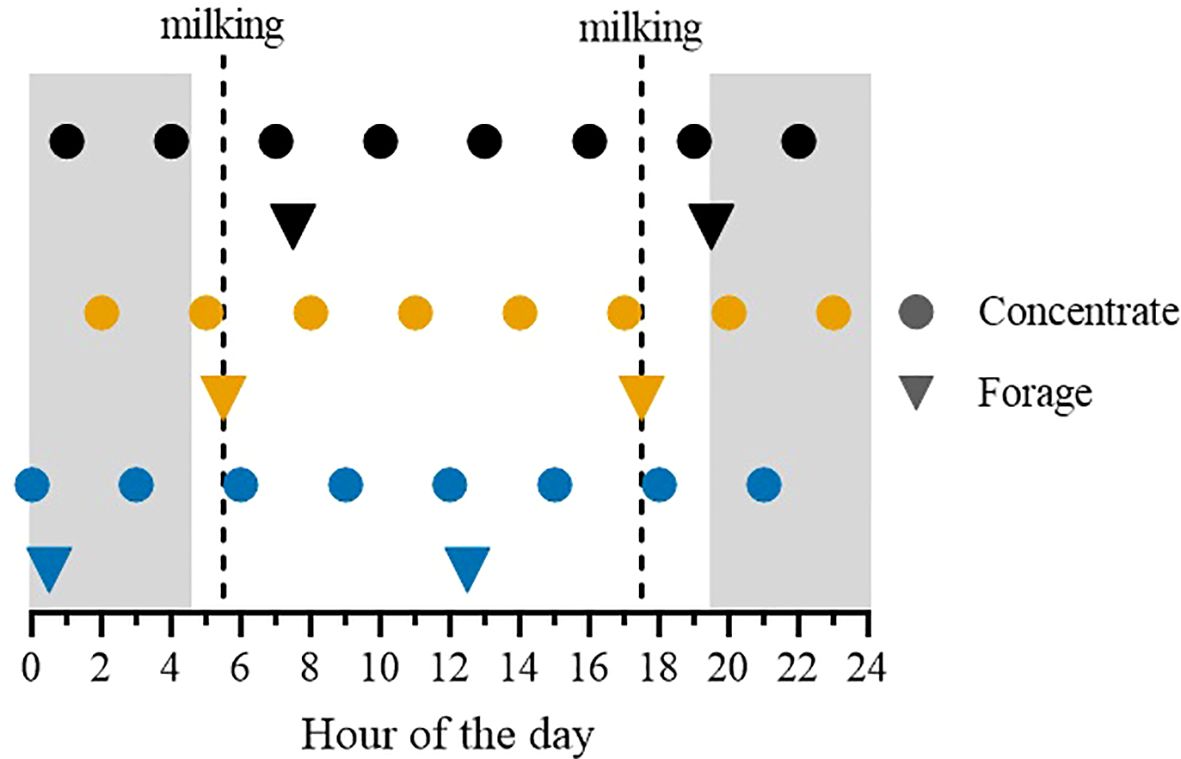
Figure 1. Schematic representation of the experimental design. Holstein dairy cows were fed with two forage meals (triangles) at 12-hour intervals and with eight concentrate meals (dots) delivered every 3 h with an automatic feeder from 30 min before the first forage feeding. The first forage meal was delivered 5 h before (0030 and 1230 h; BM), at the end (0530 and 1730 h; ME), or 2 h after (0730 and 1930 h; AM) each milking for 14-d experimental periods. Cows were milked at 0530 and 1730 h (dashed lines). The grey and white backgrounds indicate the light-dark cycle (15 h of light, from 0430 to 1930 h).
2.2 Feed and water intake
The feeds offered and refusals were weighed daily and samples of each were collected throughout the trial to determine their chemical composition (AOAC International, 2012). The dry matter intake (DMI) and net energy for lactation (NEL) (NRC, 2001) were calculated daily. Feed and diet compositions are shown in Table 1. Moreover, on the last day of each period, feeding behavior was evaluated by measuring distributed feeds and refusals at each blood sampling. In particular, the rate of intake (kg of DMI/h) was calculated by dividing the DMI measured between each bleeding by the respective interval time. Water was provided ad libitum and intake was recorded.
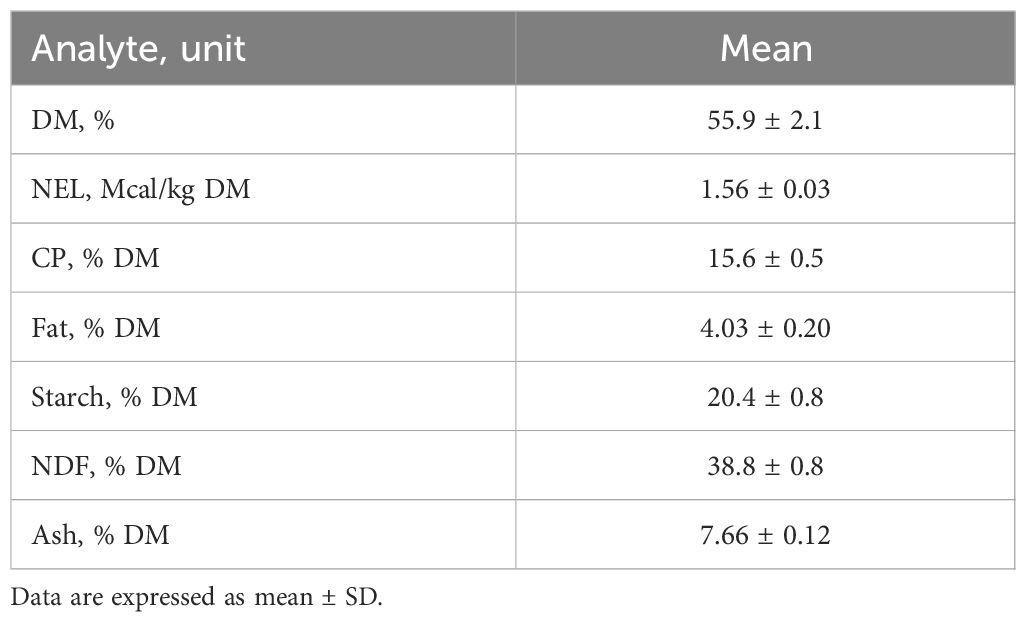
Table 1. Chemical composition of the average diet consumed by the cows during the study period.
2.3 Milk yield and composition
Milk yield was recorded at every milking, and milk samples from the morning and afternoon milkings were taken every 4 d. Milk samples were immediately analyzed for lactose, fat, and protein contents (Milko Scan 133B, Foss Electric, Hilleroed, Denmark). Fat and protein yields were calculated by multiplying their relative content by the milk yield. In morning milk samples, somatic cell count (SCC), pH, titratable acidity, and coagulation properties were measured as previously described (Cattaneo et al., 2023b). Briefly, SCC was analyzed with an automated counter (Fossomatic 180, Foss Electric, Hilleroed, Denmark) and was then log10-transformed before analysis. Milk pH was determined with a combined electrode and titratable acidity with an automatic titrator (Micro TT 2050; Crison, Alella, Spain). Milk coagulation properties were assessed by measuring the thromboelastogram at 35°C for a total time of 30 min after adding rennet using the Formagraph (Foss Electric, Hilleroed, Denmark). The lag time (min) before the beginning of coagulation was defined as the rennet clotting time (rCT), the time (min) necessary for the thrombus to reach a width of 20 mm was defined as the curd firming rate (k20), and the width of the thrombus after 30 min (mm) was defined as curd firmness (a30).
2.4 Blood sampling and analysis
Blood samples were collected every 4 d at 0700 h (i.e., morning samples) and, during the last day of the trial, at –0.5, 0.5, 2, 3.5, 5.5, 7.5, 9.5, 11.5, 12.5, 14, 15.5, 17.5, 19.5, 21.5, and 23.5 h from the 1st forage meal (i.e., postprandial samples). Samples were harvested from the jugular vein into 10-mL heparinized vacuum tubes (Vacutainer, Becton Dickinson, Plymouth, UK) and placed on ice until centrifugation. Within 1 h of collection, a small amount of blood was used for the determination of packed cell volume (Centrifugette 4203, ALC International Srl, Cologno Monzese, Italy), and the remainder was centrifuged at 3,500 × g for 16 min at 4°C. Aliquots of the plasma obtained were frozen at −20°C until further analysis (Cattaneo et al., 2023b). Morning samples were analyzed to measure the plasma concentrations of glucose, β-hydroxybutyrate (BHB), nonesterified fatty acids (NEFAs), triglycerides, urea, creatinine, cholesterol, phosphorus (P), calcium (Ca), magnesium (Mg), sodium (Na), potassium (K), chlorine (Cl), zinc (Zn), ceruloplasmin, total protein, globulin, albumin, aspartate aminotransferase (AST-GOT), γ-glutamyl transferase (GGT), alkaline phosphatase, bilirubin, haptoglobin, and lactate dehydrogenase (LDH). Postprandial samples were analyzed to measure the plasma concentrations of glucose, urea, BHB, NEFAs, total circulating triiodothyronine (T3), insulin, and growth hormone (GH).
Blood metabolites were analyzed at 37°C using a clinical auto-analyzer (ILAB 600; Werfen, Bedford, MA, USA). Commercial kits were used to determine the plasma concentrations of glucose, triglycerides, urea, creatinine, Mg, Ca, P, total protein, albumin, cholesterol, bilirubin, AST-GOT, GGT, alkaline phosphatase, and LDH (Werfen); NEFAs and Zn (Wako Chemicals GmbH, Neuss, Germany); and BHB (Randox Laboratories Ltd., Crumlin, UK). Na, K, and Cl were measured using a potentiometer method (ion selective electrode). Ceruloplasmin was determined as proposed by Sunderman and Nomoto (1970) and haptoglobin as proposed by Skinner et al. (1991). Globulin was calculated as the difference between total protein and albumin. The method and kit catalog number for each biomarker are reported in Cattaneo et al. (2023b).
Plasma concentration of GH and insulin were determined with double-antibody radioimmunoassay (RIA), and T3 was measured by commercially available solid-phase, as described by Piccioli-Cappelli et al. (2014). For hormone determinations, all samples from each animal were analyzed in the same assay. The intra-assay coefficients of variation (CVs) were 3.8%, 5.5%, and 4.5% for T3, insulin, and GH, respectively.
2.5 Digesta passage rate
The passage rate of digesta was determined according to the method of Trevisi et al. (2007), based on the appearance of retinyl-palmitate in the blood after the oral administration of rumen-protected vitamin A (50000 IU/kg of DMI) offered with the 1st forage meal. In postprandial blood samples, retinyl-palmitate was measured by reverse-phase high-performance liquid chromatography (HPLC).
2.6 Statistical analysis
Data about milk yield and composition, DMI, and blood biomarkers were analyzed by mixed models for repeated measures (GLIMMIX procedure of SAS; version 9.4, SAS Institute Inc.). The models included the fixed effects of the treatment (BM, ME, and AM), time, their interaction, and the random effects of period and cow nested within period. The distributions of residuals were visually assessed. Data with a single daily measurement (i.e., milk yield and composition, DMI, and blood biomarkers measured in morning samples) were analyzed considering the days relative to the start of the treatment as the effect of time. Conversely, data from postprandial blood samples were analyzed considering the hours relative to the 1st forage meal as the effect of time. The covariance structure (compound symmetry, autoregressive order, Toeplitz, or spatial power) with the lowest Akaike information criterion was included in the model. Pair-wise comparisons were performed using the least significant difference test.
In addition, daily rhythms were obtained by fitting plasma biomarker concentrations measured in postprandial samples for each cow to the linear form of a two-component cosine function with a 24-h period and a 12-h harmonic with linear mixed models with the lmer package in R, as described by Niu et al. (2014). The models included the fixed effects of treatment, cosine terms, the interactions of treatment with the cosine terms, and the random effects of cow and period. The inclusion of a 12-h harmonic was based on R2 and the Bayesian information criterion (BIC). A zero amplitude F-test comparing the cosine fit to a linear fit was used to determine the significance of the cosine fit for each treatment. The model parameters were determined to describe the rhythms within a 24-hour period. In particular, mesor (midline estimating statistic of rhythm; i.e. daily mean) was calculated as the average of fitted values, amplitude (distance of peak from the mesor) was calculated as [max(fitted value) − min(fitted value)]/2, and acrophase (time of day at peak) was determined using the which.max function in R (Islam et al., 2023). After calculation of the model parameters for each cow by treatment, mesor, amplitude, and acrophase were analyzed using the GLIMMIX procedure in SAS with treatment as the fixed effect and cow as the random effect. For this analysis, data reported in tables are means across treatments, whereas in the figures the model fits by treatment are reported.
Statistical significance was set at P ≤ 0.05, and differences among means with 0.05 < P ≤ 0.10 were considered in the context of tendencies. Data are reported as least square means and standard error.
3 Results
3.1 Feeding behavior and milk production
Dry matter (21.7 vs 22.3 vs 22.3 ± 1.02 kg/d, respectively; P = 0.20) and water intakes (96.6 vs 97.6 vs 100.4 ± 10.3 L/d; P = 0.44) did not differ among the groups and neither did the intake distribution during the day (Figure 2). The appearance of retinyl-palmitate in the blood tended to be greater in BM compared with the other groups (P = 0.07), particularly after the second forage meal (Trt×T, P = 0.01; Figure 2). No evidence for treatment differences was noted in daily milk yield (33.1 vs 32.4 vs 31.5 ± 3.0 kg/d; P = 0.18; Table 2), with no differences observed in the proportions of milk produced in the morning or afternoon milkings (P = 0.52). Milk component concentrations and yields were not affected by feeding time either in the morning or afternoon milking (Table 2). Milk coagulation properties and SCC did not differ among the treatments.
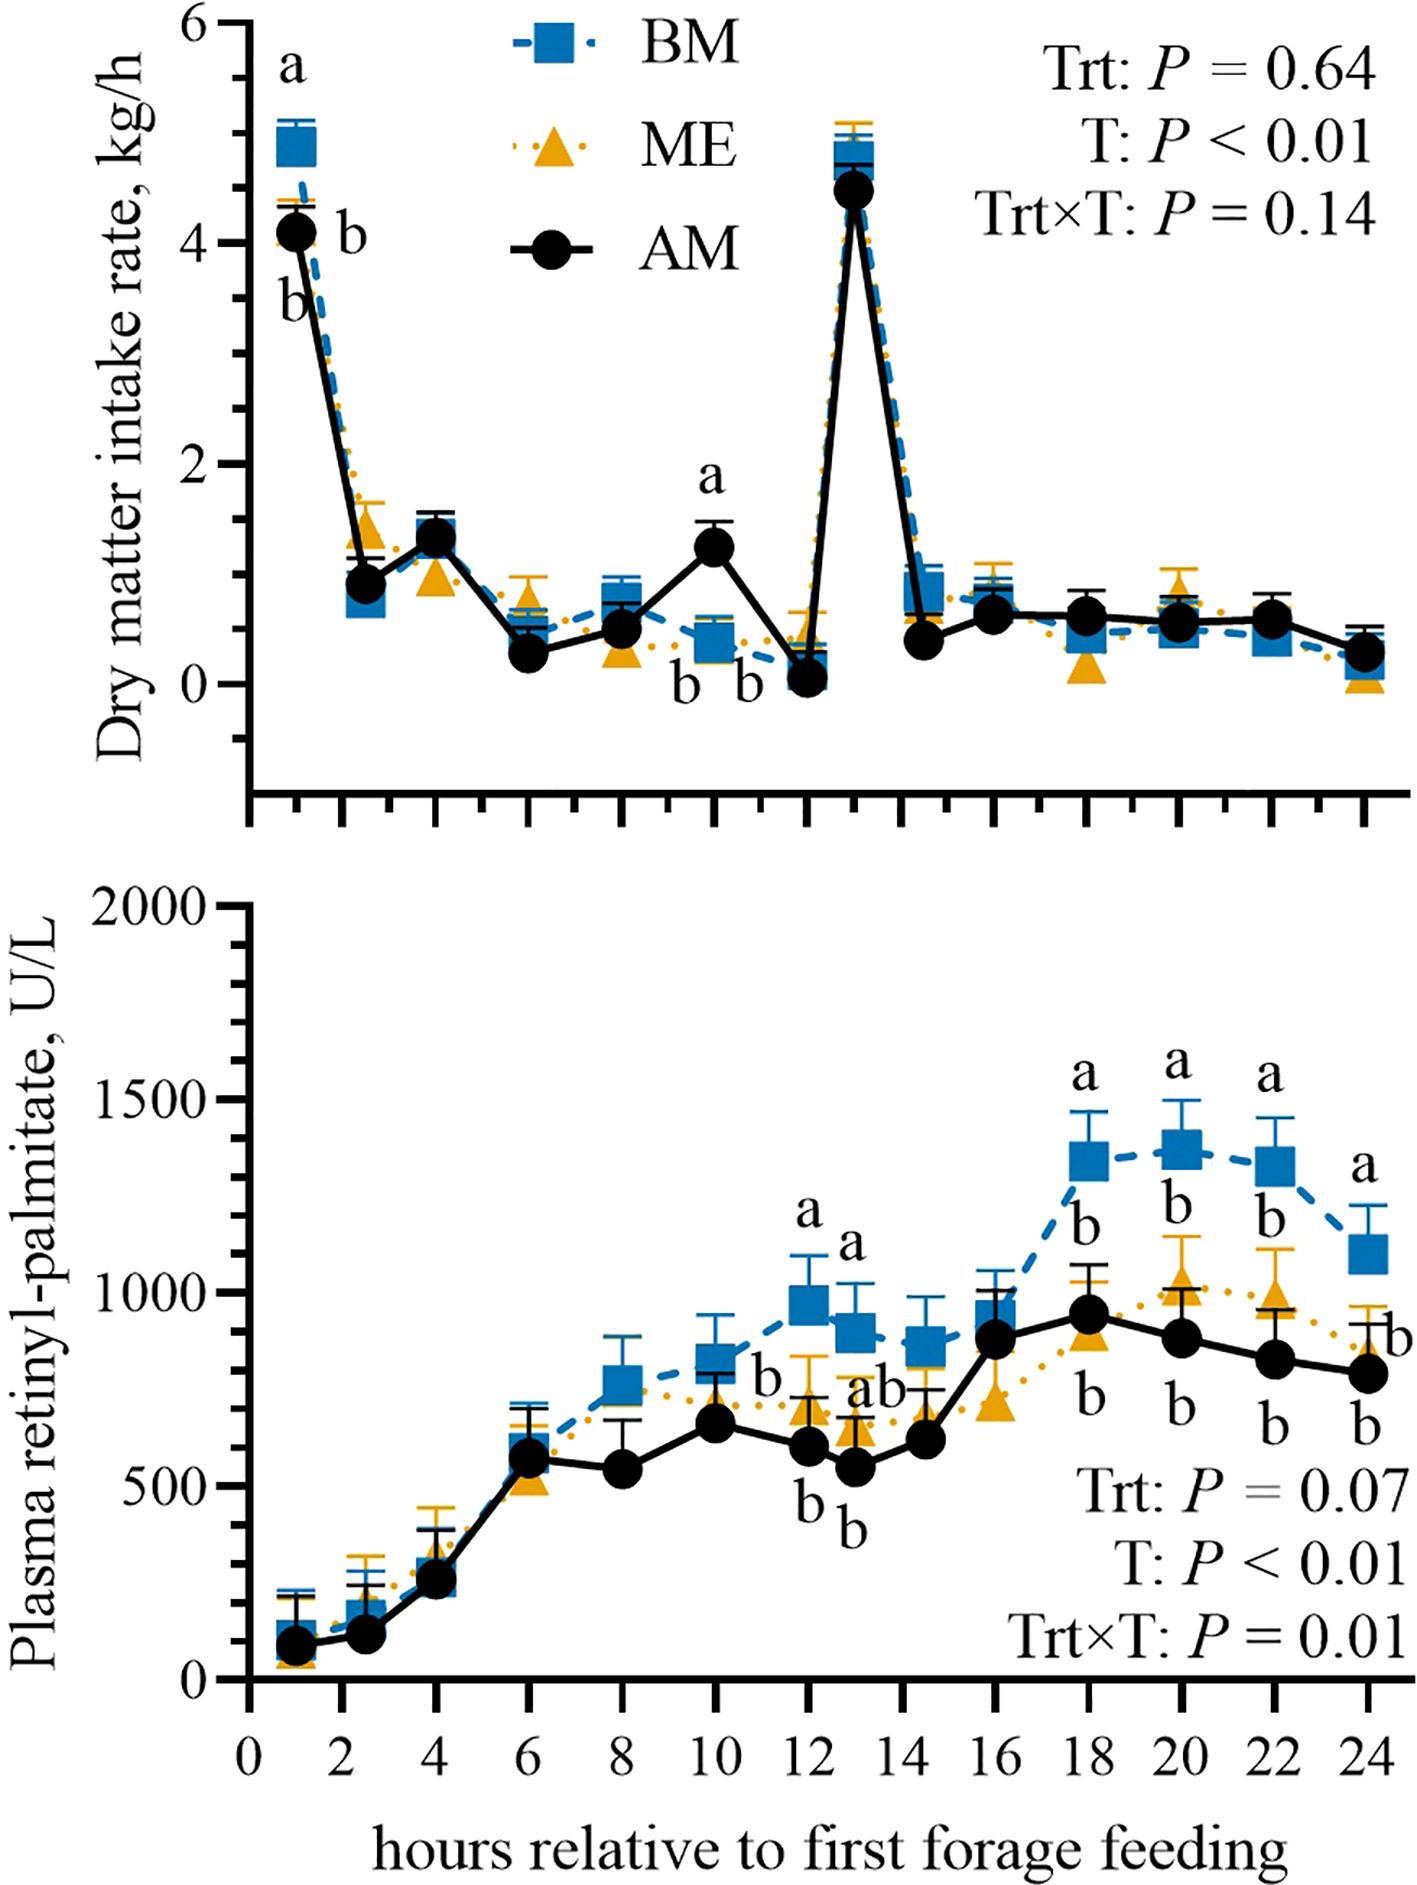
Figure 2. Postprandial pattern (from 0 to 24 h after the first feeding) of dry matter intake and relative plasma retinyl-palmitate concentration (as a marker of digesta passage rate) in Holstein dairy cows fed the first forage meal 5 h before (0030 and 1230 h; BM), at the end (0530 and 1730 h; ME), or 2 h after (0730 and 1930 h; AM) each milking for 14-d experimental periods. P-values of the model are reported (Trt is the treatment effect, T is the time effect, Trt×T is the interaction effect). Significant differences (P < 0.05) among groups at each time point are denoted with different letters. Error bars represent standard error.
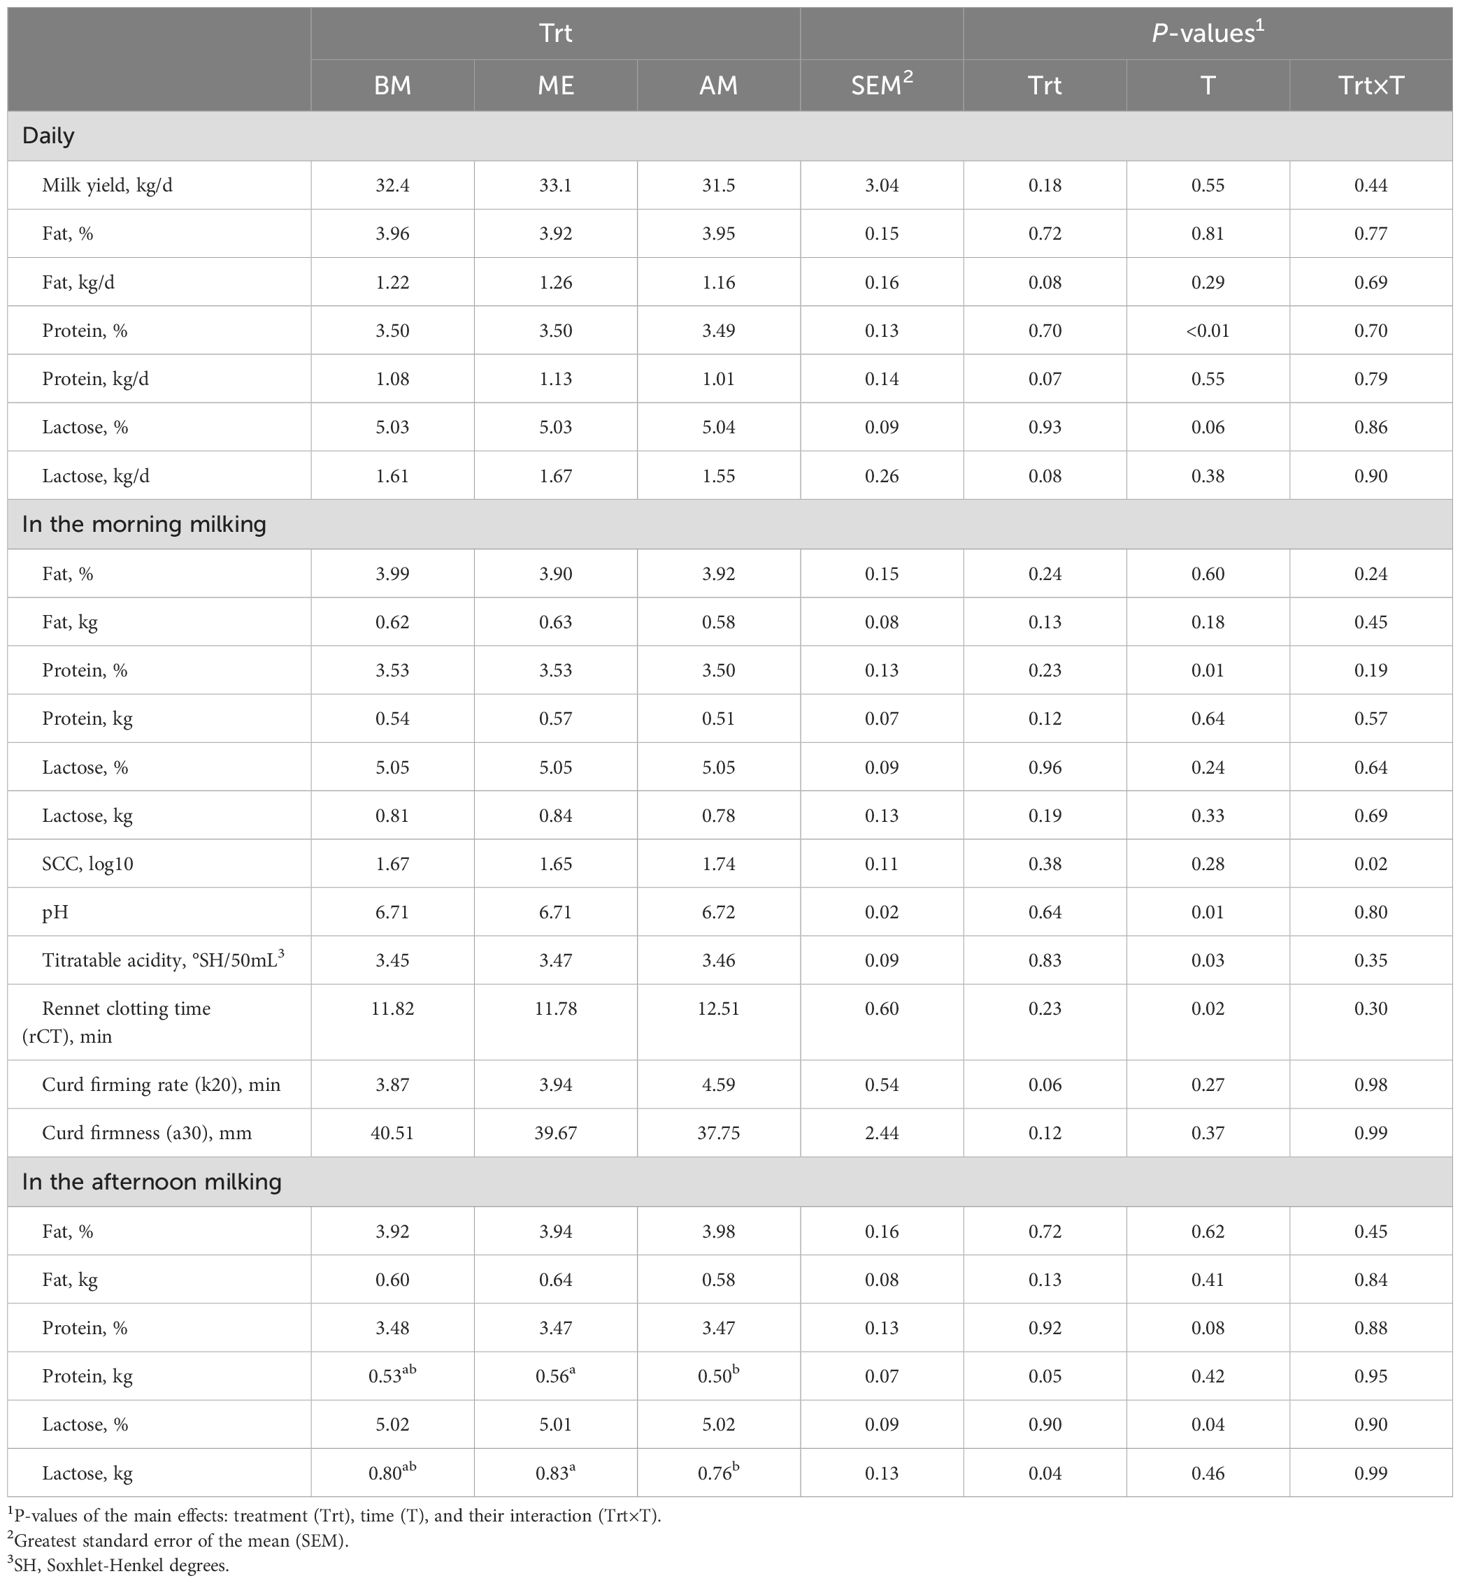
Table 2. Milk composition and coagulation properties in Holstein dairy cows fed the first forage meal 5 h before each milking (0030 and 1230 h; BM), at the end of each milking (0530 and 1730 h; ME), or 2 h after (0730 and 1930 h; AM).
3.2 Morning blood samples
In samples collected at 0700 h (Table 3), plasma urea was higher in ME compared with AM and BM (P < 0.01). Triglycerides were greater in ME compared with BM (P = 0.03). NEFAs were greater (P < 0.01) in AM compared to ME and BM, whereas BHB was unaltered by feeding time (P = 0.15). Among minerals, Ca was lower in ME compared to AM (P = 0.04), Mg and K were lower (P ≤ 0.03), whereas Na plasma concentration was higher in ME (P < 0.01) compared to the other groups. Plasma globulin and ceruloplasmin were increased in AM compared to ME (P ≤ 0.04). No significant differences were observed in the other markers investigated.
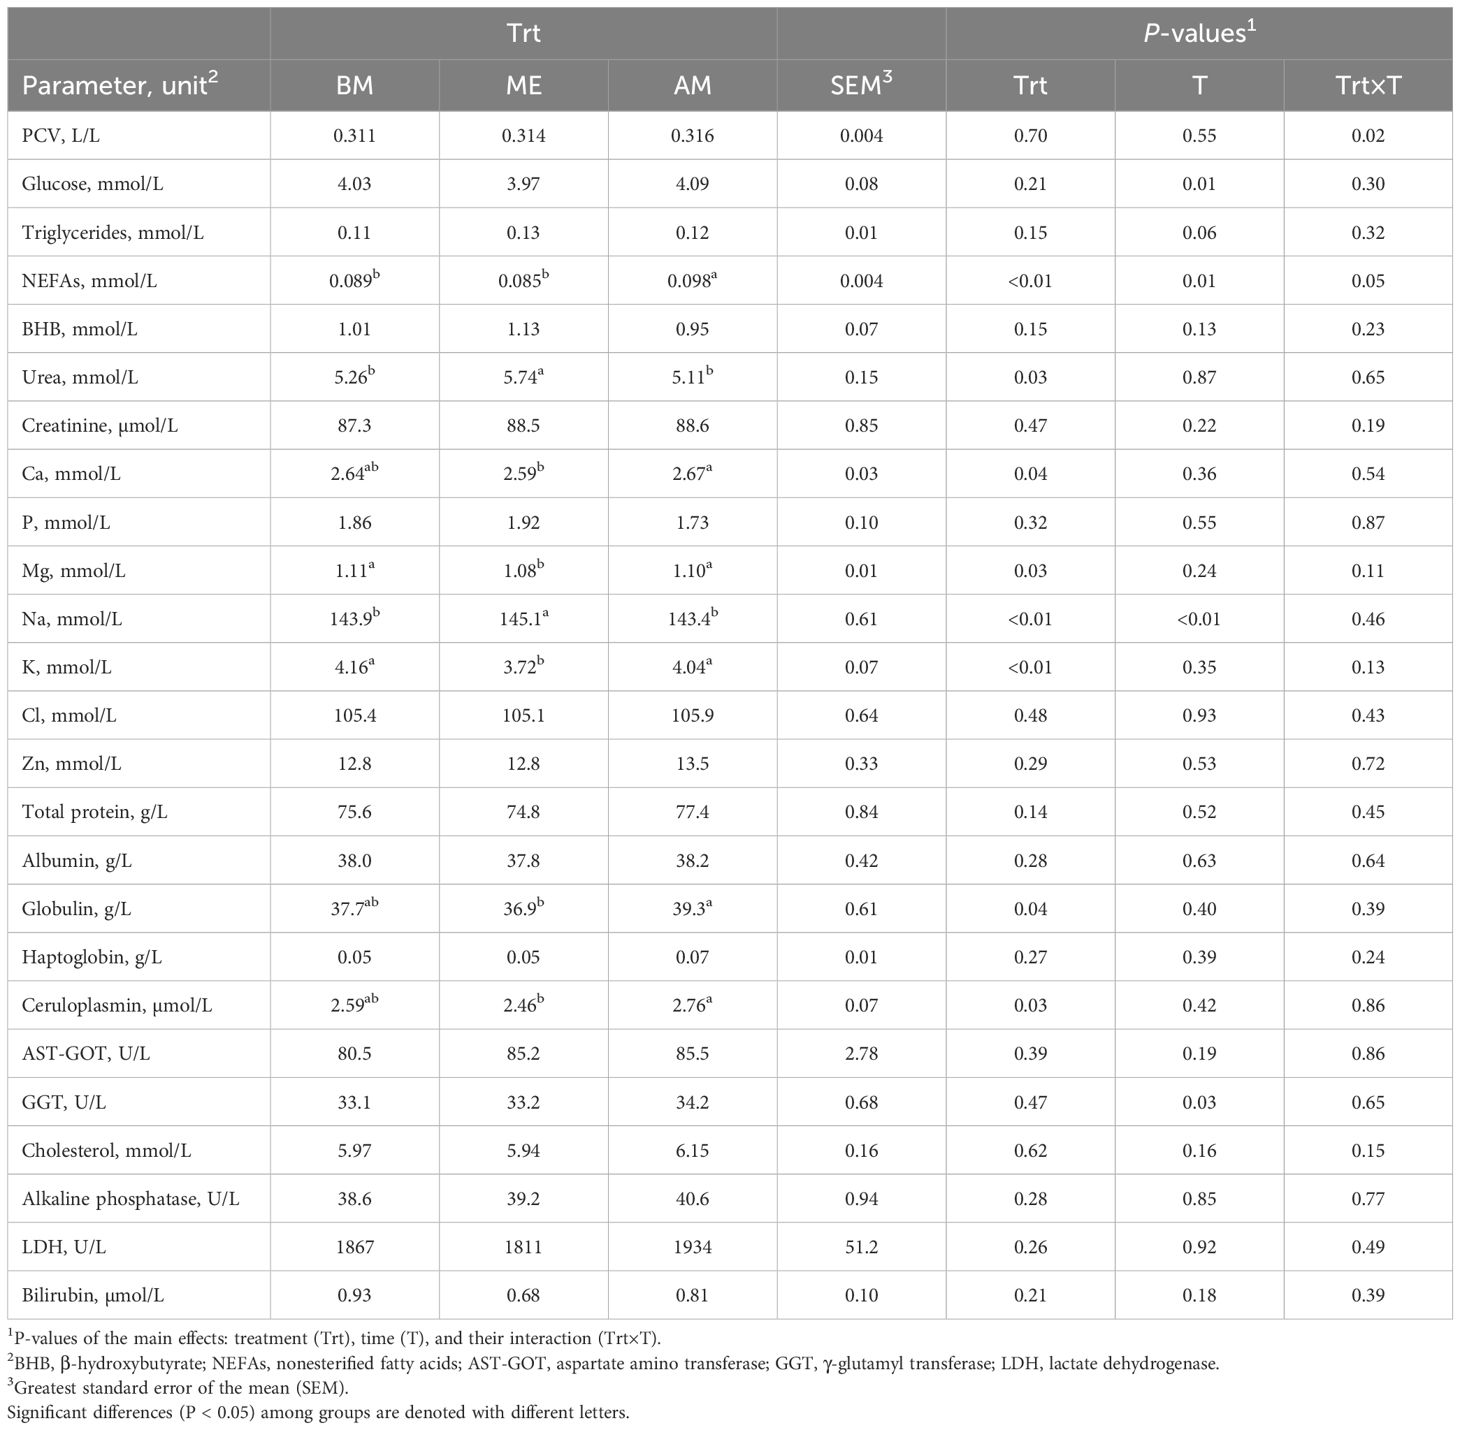
Table 3. Plasma markers in Holstein dairy cows fed the first forage meal 5 h before each milking (0030 and 1230 h; BM), at the end of each milking (0530 and 1730 h; ME), or 2 h after (0730 and 1930 h; AM).
3.3 Postprandial blood samples
To assess whether feeding time affects the changes in blood biomarkers after the main meal, data are firstly presented by considering the time relative to the first forage meal: 0530 for ME, for 0030 BM, and 0730 for AM. Then, cosinor parameters are presented to characterize daily rhythms. PCV, glucose, urea, BHB, and NEFA variations during the day were not affected by feed delivery time (Figure 3). Insulin tended to be higher overall in ME compared with the other groups (P = 0.06; Figure 4). The postprandial peak was more pronounced in ME after the 1st forage meal and delayed after the 2nd (P < 0.01). T3 was not different overall (P = 0.65) but had different trends among groups (P < 0.01). Circulating GH was unaltered by feed delivery time.
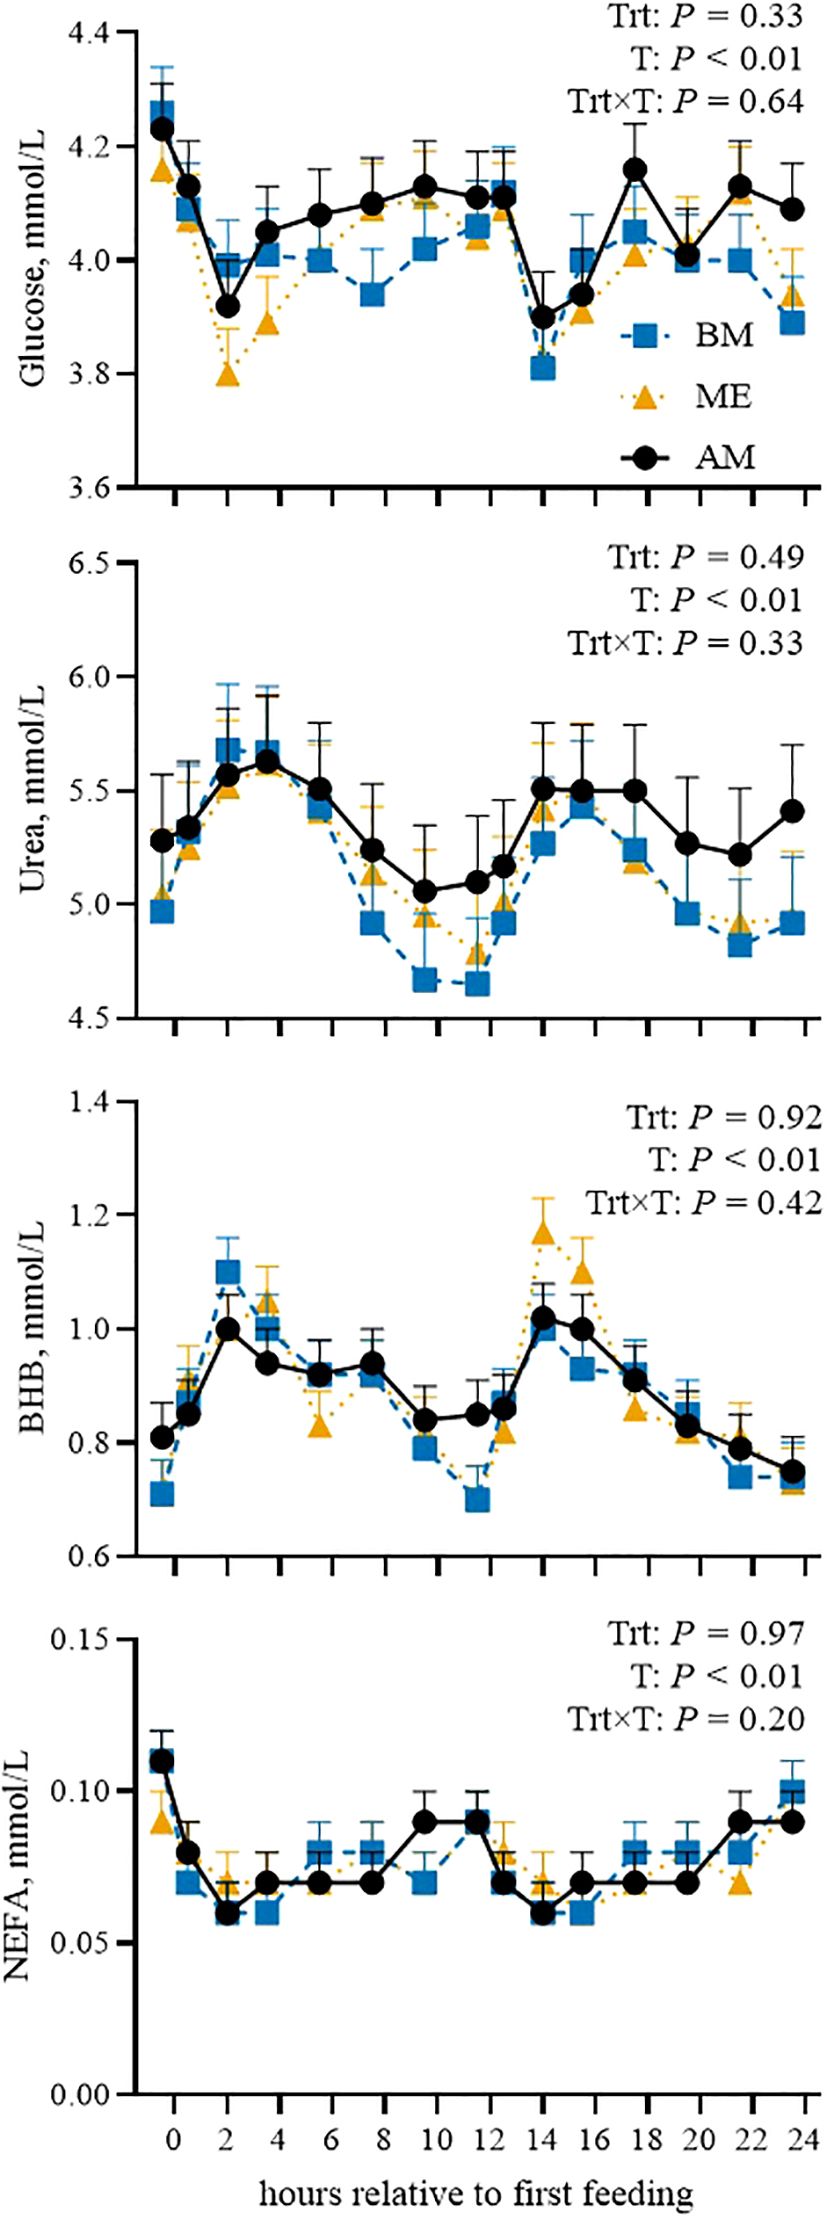
Figure 3. Postprandial pattern (from 0 to 24 h after the first feeding) of plasma glucose, urea, β-hydroxybutyrate (BHB), and nonesterified fatty acids (NEFAs) in Holstein dairy cows fed the first forage meal 5 h before (0030 and 1230 h; BM), at the end (0530 and 1730 h; ME), or 2 h after (0730 and 1930 h; AM) each milking for 14-d experimental periods. P-values of the model are reported (Trt is the treatment effect, T is the time effect, Trt×T is the interaction effect). Error bars represent standard error.
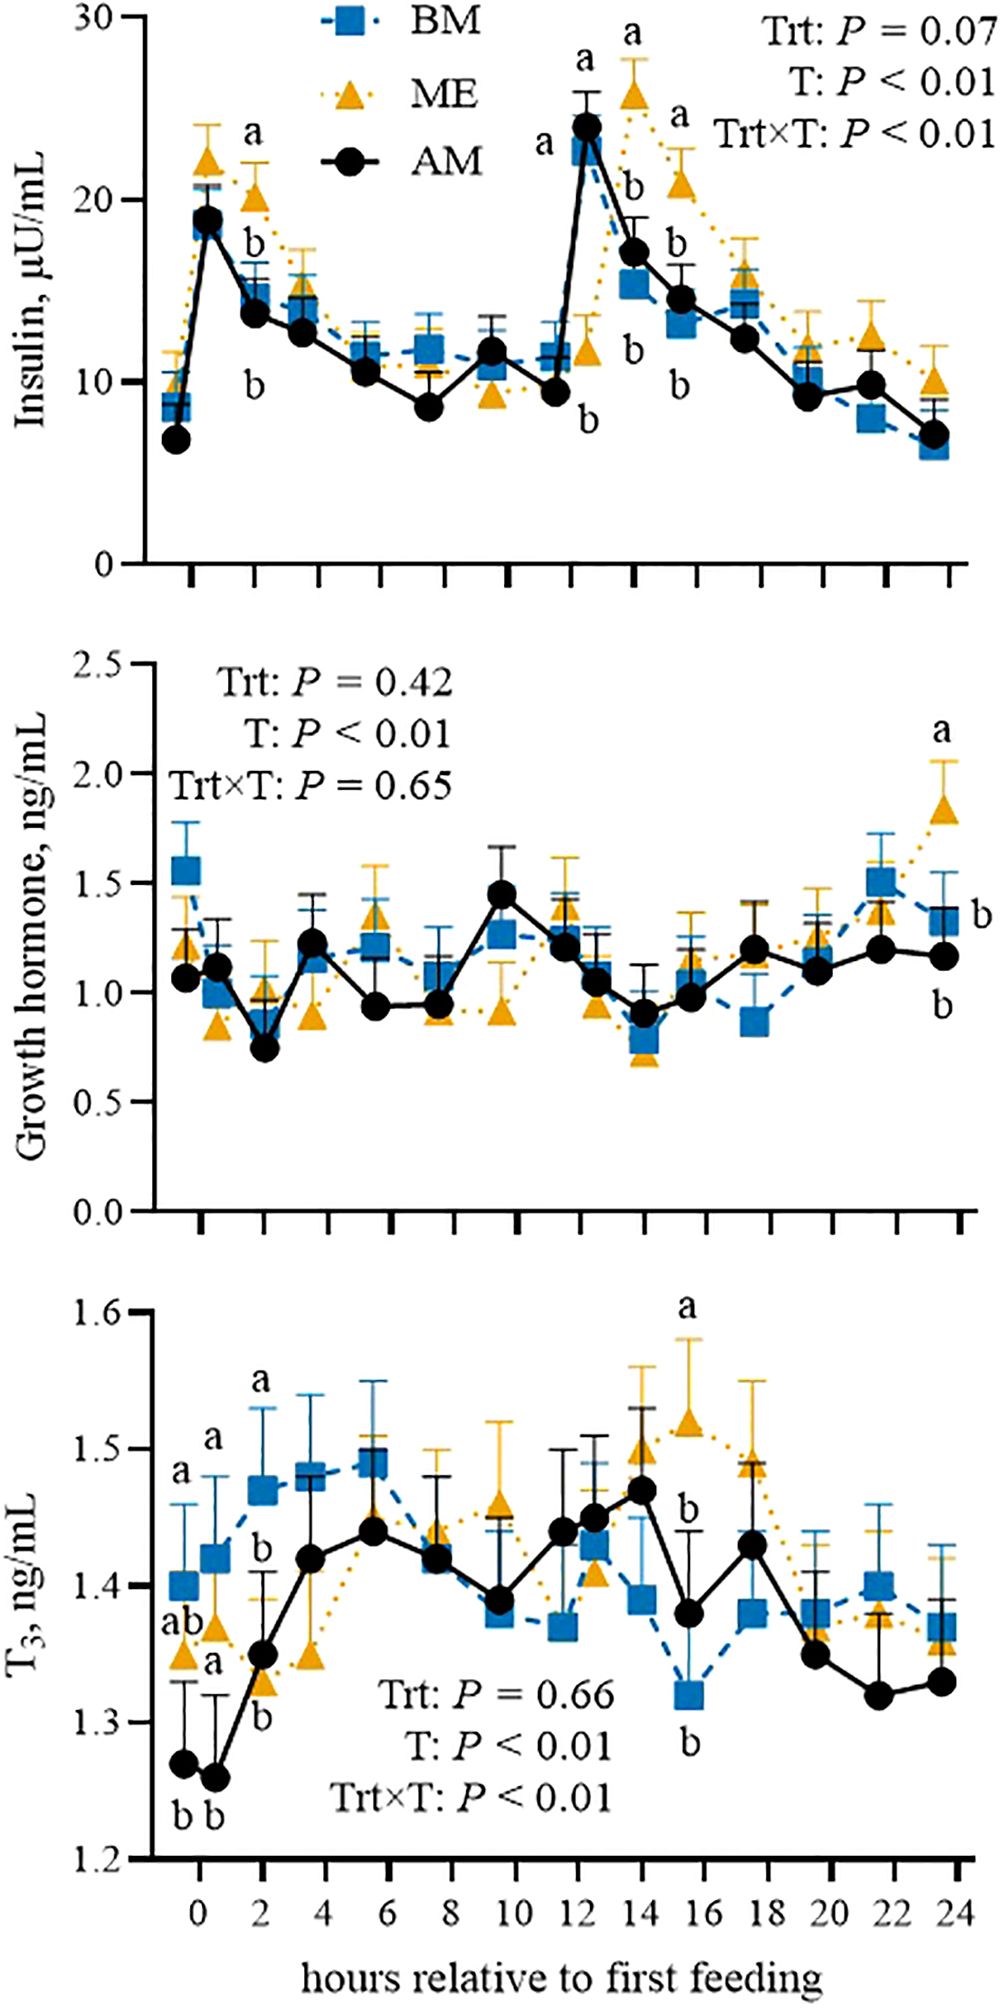
Figure 4. Postprandial pattern (from 0 to 24 h after the first feeding) of plasma insulin, growth hormone, and triiodothyronine (T3) in Holstein dairy cows fed the first forage meal 5 h before (0030 and 1230 h; BM), at the end (0530 and 1730 h; ME), or 2 h after (0730 and 1930 h; AM) each milking for 14-d experimental periods. P-values of the model are reported (Trt is the treatment effect, T is the time effect, Trt×T is the interaction effect). Significant differences (P < 0.05) among groups at each time point are denoted with different letters. Error bars represent standard error.
Glucose concentration fitted a 24-h cosine function only in BE (P = 0.01), and GH did not fit a cosine rhythm in any of the groups. All the other traits investigated demonstrated daily rhythmicity (P < 0.01; Table 4; Figure 5). No difference in the mesor of BHB was noted among treatments, but amplitude was reduced in AM compared with other treatments and acrophase occurred in the morning in BM and the afternoon in AM and ME. The NEFA pattern was similar among treatments but the acrophase in BM was shifted to the morning. Insulin mesor and amplitude were greater in ME compared with the other treatments, but acrophase was anticipated in BM relative to AM and ME. Urea, despite similar mesors, had a reduced amplitude in AM, whereas acrophase was anticipated in BM compared with AM and ME. Similarly, T3 peaked earlier in BM, although mesor and amplitude were not impacted by feeding time.
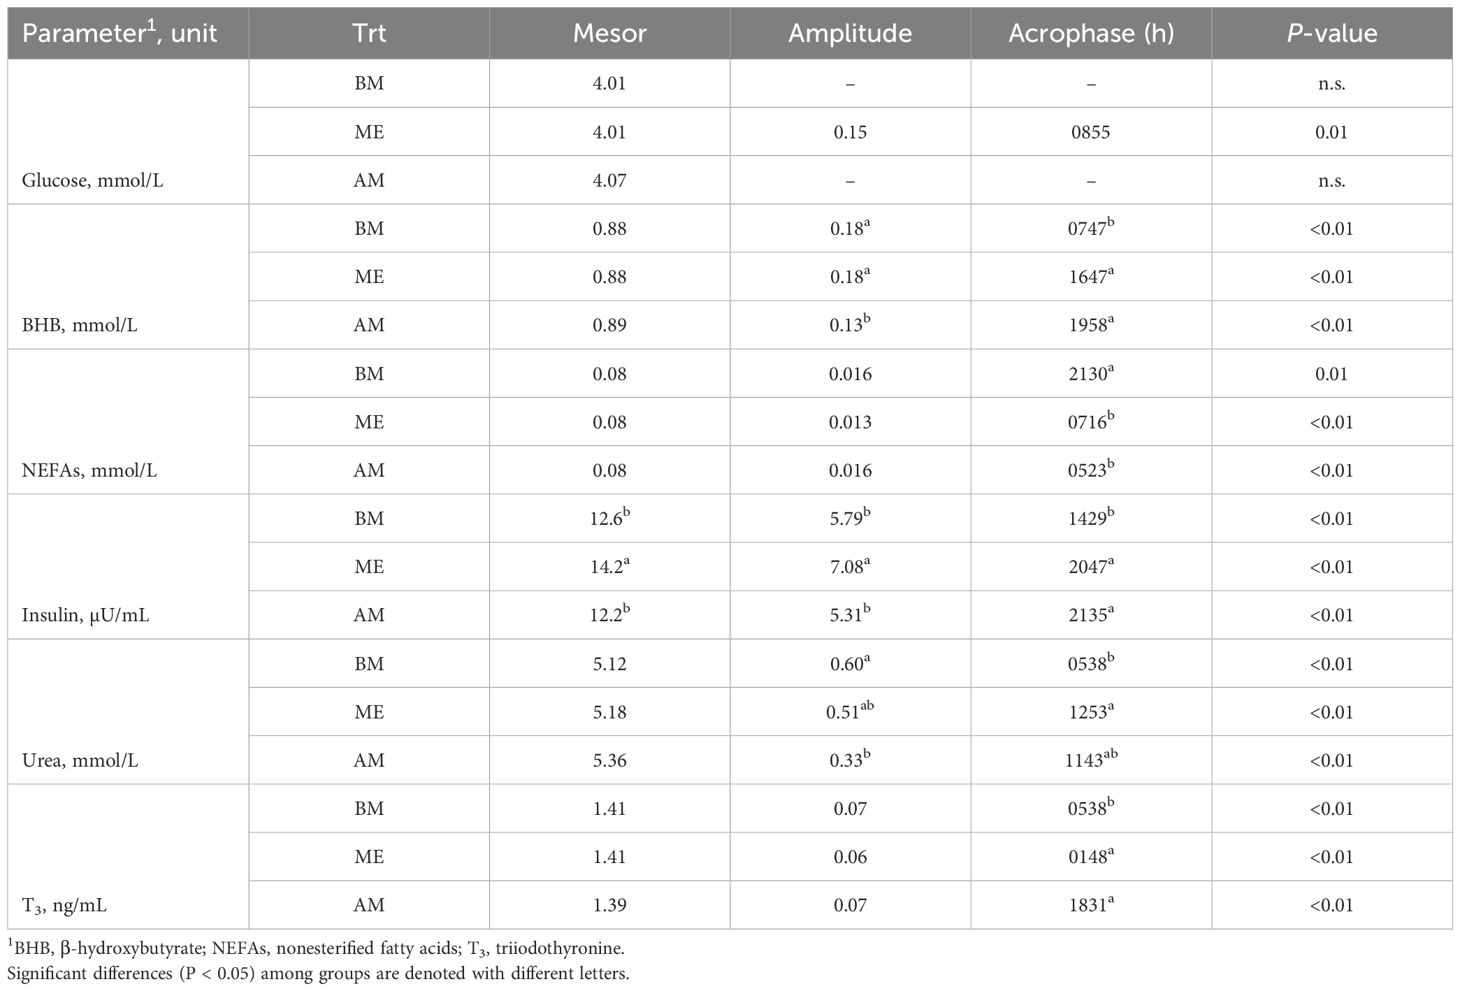
Table 4. Cosinor parameters and P-values of the zero-amplitude test for the plasma markers and hormones investigated in Holstein dairy cows fed the first forage meal 5 h before each milking (0030 and 1230 h; BM), at the end of each milking (0530 and 1730 h; ME), or 2 h after (0730 and 1930 h; AM).
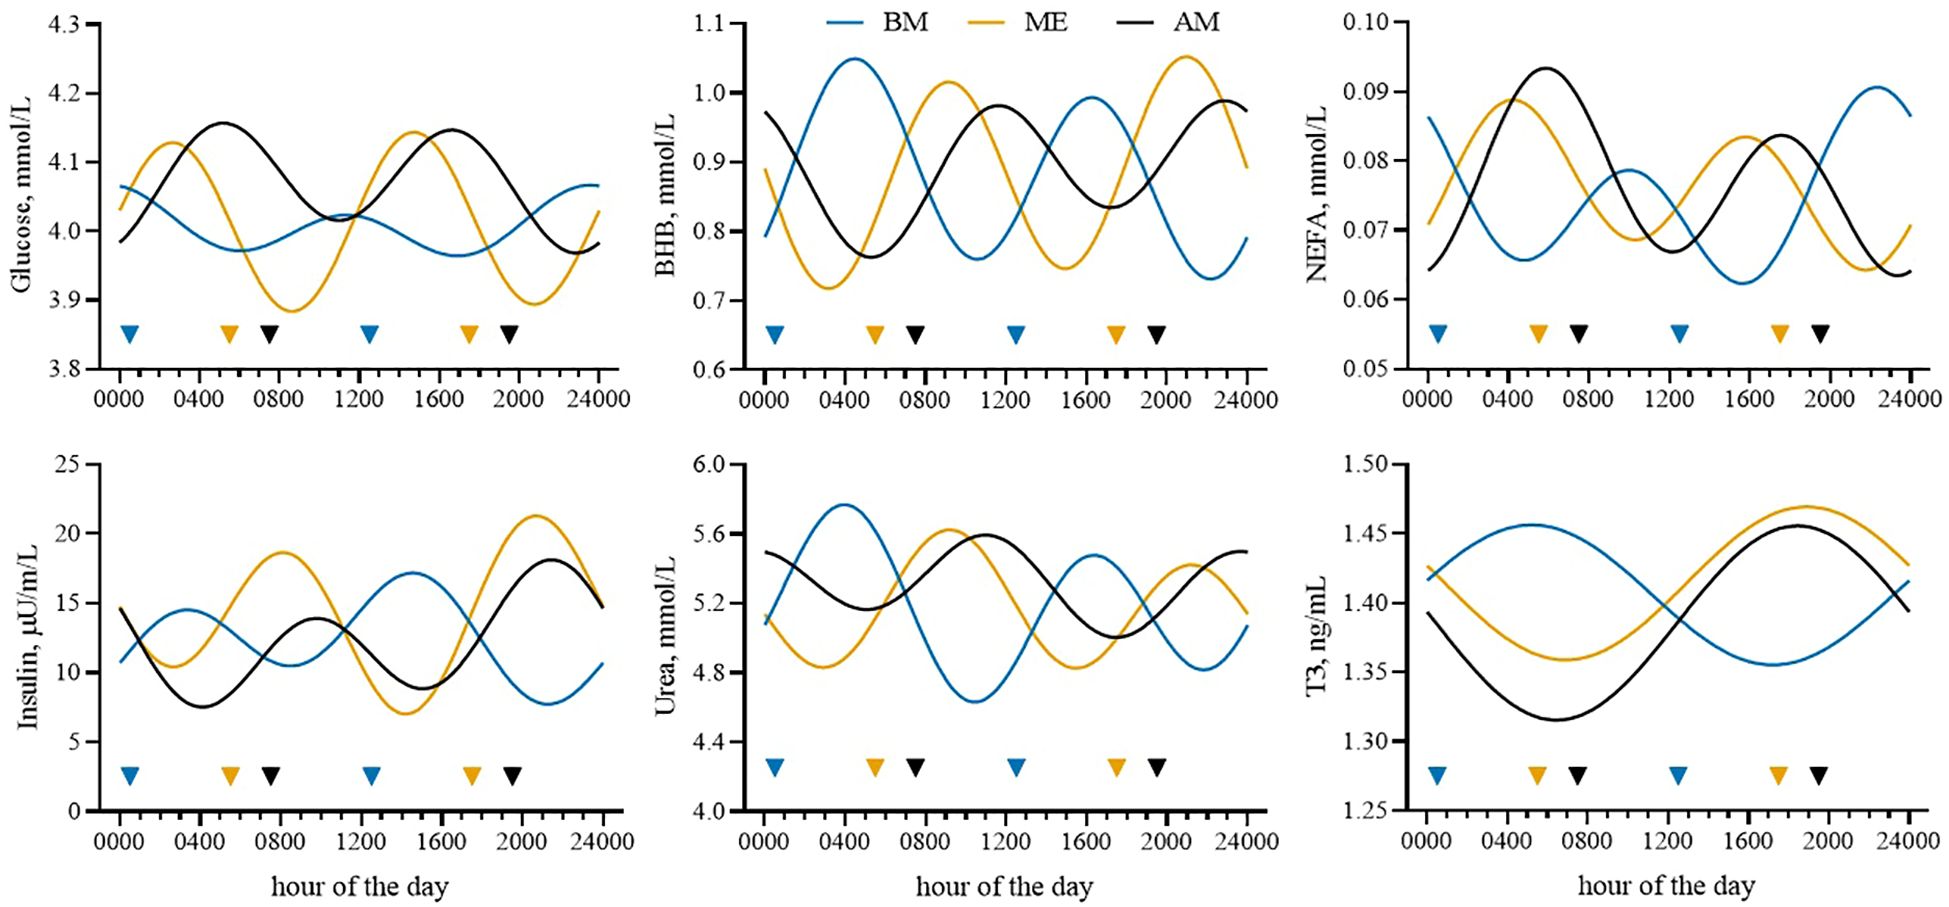
Figure 5. Cosinor fits of plasma glucose, β-hydroxybutyrate (BHB), nonesterified fatty acids (NEFAs), insulin, urea, and triiodothyronine (T3) in Holstein dairy cows fed the first forage meal 5 h before (0030 and 1230 h; BM), at the end (0530 and 1730 h; ME), or 2 h after (0730 and 1930 h; AM) each milking for 14-d experimental periods. Colored triangles indicate the time of forage feedings.
4 Discussion
In the present study, we investigated the post-feeding and daily changes in blood metabolic biomarkers as a result of different feeding schemes. Our results were obtained in late-lactation dairy cows and in a limited sample size. The stage of lactation affects the concentrations of metabolites and hormones (Cattaneo et al., 2023b) and their daily changes (Cattaneo et al., 2023a), suggesting that one should interpret these results with some caution. Moreover, the experimental setting of this study was not representative of the most common commercial settings (i.e., freestalls, TMR delivered once daily, and free access to automatic feeders, when present). However, it allowed us to highlight the effect of forage meals offered at the same 12-hour interval but at different times of the day and before (BM), at (ME), or after (AM) milkings. Nevertheless, studies in different housing conditions should be performed to confirm these results.
During the experimental period, feeding forage to cows at different times during the day did not impact DMI and milk production nor altered the post-feeding intake pattern or the daily milk synthesis pattern. Cows are motivated to eat after milking (DeVries et al., 2003), and changing feeding time relative to milking has been shown to reduce DMI in freestall-housed cows (King et al., 2016). In the latter study, the authors did not find any difference in productivity, and they observed that cows fed later relative to milking time ate more slowly and in smaller and more frequent meals than those fed closer to milking. In our study, feeding behavior was not impacted when expressed as relative to the first forage delivery (also when it occurred in the night, i.e., BM), but housing conditions (freestall vs tie-stall) were different, potentially influencing the results. The lack of differences in the intake pattern among the groups observed in our study confirmed that the delivery of fresh feed stimulates feeding behavior (DeVries and von Keyserlingk, 2005; King et al., 2016), regardless of the time of the day and milking. Moreover, milk composition and component yields were unaltered. The frequent concentrate delivery could have contributed to this outcome, providing a constant energy input in all groups, regardless of the forage feeding time.
The analysis of plasma retinyl-palmitate revealed an increased passage rate in BM cows. Retinyl-palmitate originates from the digestion and absorption of carotenoids (e.g., vitamin A) in the gut. Orally administering a known amount of rumen-protected vitamin A allows us to infer the rate at which the marker (and hence the feed) passes through the digestive tract (Trevisi et al., 2007). As the feed moves through the digestive system, retinyl palmitate is absorbed by the gut epithelium and enters the bloodstream. The latter might help in understanding the numerically reduced yield observed in the BM cows compared to ME, despite similar intake. With a faster passage rate, feed digestibility is usually reduced and thus the BM cows might have absorbed less nutrients than ME ones (Colucci et al., 1982).
The differences observed in the concentration of biomarkers of metabolism in plasma samples harvested at 0700 h (morning samples) should be interpreted considering the daily rhythmicity of some biomarkers relative to the timing of sampling, as clearly visible in Figure 5. After meals, plasma urea increases because of the hepatic conversion of the ammonia flux resulting from dietary protein degradation (Rottman et al., 2015; Spek et al., 2013), whereas NEFA concentration decreases because of the postprandial reduction in lipolysis and the higher peripheral NEFA utilization mediated by insulin (Cattaneo et al., 2023a; Nikkhah et al., 2008; Niu et al., 2014). These results confirm that it is advisable to consider time relative to feeding when assessing energy status (Bertoni and Trevisi, 2013; Quiroz-Rocha et al., 2010) to avoid incorrect interpretations.
Regarding other biomarkers, such as minerals and those related to liver function and inflammation, we cannot determine whether the sampling time had an effect. The latter could be true for minerals, but liver and inflammation biomarkers have limited variation during the day in healthy subjects (Bertoni et al., 2004; Liesegang et al., 2003; Piccione et al., 2013). The analysis of these biomarkers seems to suggest a slightly increased inflammation in the AM cows, but the variations observed here were small and not of concern. Indeed, most of the differences observed were between the AM and ME cows, with BM having an intermediate condition for most of the biomarkers investigated. AM cows had increased blood concentration of positive acute phase protein (i.e., globulin and ceruloplasmin) that usually rises in cases of inflammatory conditions (Cattaneo et al., 2021). Meanwhile, the reduced blood concentrations of some minerals in ME can be associated with the numerically greater output by the mammary gland (Goff, 2006).
Limited changes in biomarkers of energy and protein metabolism were noted throughout the day without any different patterns among the groups. The greater average (i.e., mesor) urea observed in AM was not consistent with what we observed in the samples collected in the morning. Again, the reason is related to the daily rhythm of blood urea concentration. AM had a smaller amplitude and therefore had reduced variations around the mean value throughout the day, whereas BM and ME were more variable (i.e., greater amplitude). Greater changes were noted in plasma hormones. Insulin peaked after forage meals in all the groups (Piccioli-Cappelli et al., 2014). The postprandial insulin peaks were more marked in ME compared with AM and BM, consistent with the faster and greater decrease in glycemia after the forage meals that was observed in those cows, although this was non-significant. These changes might be related to the numerically greater milk production recorded in those cows. Indeed, as can be noted in Figure 5, the ME cows underwent longer periods during the day of low circulating glucose, likely because of the greater uptake by the mammary gland.
Some differences among groups were easier to ascertain by analyzing the cosinor curves. Treatments did not remarkably impact the trends of plasma biomarkers when analyzed relative to the first meal. However, when reported in relation to the time of day, as in the cosinor analysis, the impact of feeding time was evident. Significant differences in acrophase (the time at which the peak occurs) were detected in all the biomarkers investigated. Most of these differences were between BM and the other two groups. The latter was not surprising, because AM and ME were fed with just a 2-hour difference, with BM receiving the first forage meal further in time from the other groups (with a 5- and 7-h difference, respectively) and at night. Matching nutrient availability with the need for milk synthesis could improve milk production (Harvatine, 2023) but also the presence of light during the first meal can exert an effect on the duration of the meal, which is longer during the night (Bertoni et al., 2004), and consequently can influence rumen fermentation. By milking twice daily we could not precisely determine the daily pattern of milk synthesis as others have done (Rottman et al., 2014; Salfer and Harvatine, 2020). However, the numerically greater yield in ME might suggest that those cows had a better overlap of nutrient availability and utilization. This is not surprising, since the ME cows had feed available immediately after milking. Considering that the cows in all the groups consumed most of their forage at delivery (~ 50%), AM and BM cows had limited feed available for 2 (AM) or even 7 hours (BM) after milking. As a side result, feed availability after milking stimulates cows to stand longer, with positive effects on udder health (DeVries et al., 2010; Watters et al., 2014), although in our experiment we did not observe a significant effect on SCC.
5 Conclusions
Shifting feed delivery time to different times relative to milking did not affect milk yield, feed intake, or feeding behavior. The feed delivery schedule during the day is important to optimize rumen fermentation and better match it with liver and mammary functions. In the present study, feeding cows at different times of the day did not significantly improve performance. To achieve results more comparable with common commercial settings (i.e., freestalls and TMR delivered once daily), studies in different housing conditions should be performed. Moreover, the daily rhythms of blood biomarkers —particularly of energy metabolism—varied with the different feeding times. This finding strengthens the need to standardize bleeding for metabolic profiling in lactating dairy cows. Interpreting these data is even more challenging in commercial settings because of the hardship of knowing the distance from meals when sampling them.
Data availability statement
The raw data supporting the conclusions of this article will be made available by the authors, without undue reservation.
Ethics statement
The animal study was approved by Italian laws on animal experimentation and ethics (DL n. 116, 27/01/1992). The study was conducted in accordance with the local legislation and institutional requirements.
Author contributions
LC: Formal analysis, Methodology, Visualization, Writing – original draft. MP: Formal analysis, Methodology, Visualization, Writing – review & editing. FP-C: Conceptualization, Investigation, Project administration, Writing – review & editing. ET: Conceptualization, Data curation, Funding acquisition, Investigation, Project administration, Resources, Writing – review & editing.
Funding
The author(s) declare financial support was received for the research, authorship, and/or publication of this article. This work is part of the project NODES which has received funding from the MUR – M4C2 1.5 of PNRR funded by the European Union - NextGenerationEU (Grant agreement no. ECS00000036). This study was supported by the Romeo ed Enrica Invernizzi Foundation (Milan, Italy).
Acknowledgments
The authors are grateful to Emeritus Professor Giuseppe Bertoni (Università Cattolica del Sacro Cuore) for his advice and assistance during the planning and realization of the study.
Conflict of interest
The authors declare that the research was conducted in the absence of any commercial or financial relationships that could be construed as a potential conflict of interest.
Publisher’s note
All claims expressed in this article are solely those of the authors and do not necessarily represent those of their affiliated organizations, or those of the publisher, the editors and the reviewers. Any product that may be evaluated in this article, or claim that may be made by its manufacturer, is not guaranteed or endorsed by the publisher.
References
Bertoni G., Lombardelli R., Trevisi E. (2004). Circadian blood variations and performance effects in dairy cows fed during the day or the night. J. Anim. Feed Sci. 13, 463–466. doi: 10.22358/jafs/73966/2004
Bertoni G., Trevisi E. (2013). Use of the Liver Activity Index and other metabolic variables in the assessment of metabolic health in dairy herds. Veterinary Clinics North America: Food Anim. Pract. 29, 413–431. doi: 10.1016/j.cvfa.2013.04.004
Casey T., Plaut K., Boerman J. (2022). Circadian clocks and their role in lactation competence. Domest. Anim. Endocrinol. 78, 106680. doi: 10.1016/j.domaniend.2021.106680
Cattaneo L., Lopreiato V., Piccioli-Cappelli F., Trevisi E., Minuti A. (2021). Plasma albumin-to-globulin ratio before dry-off as a possible index of inflammatory status and performance in the subsequent lactation in dairy cows. J. Dairy Sci. 104, 8228–8242. doi: 10.3168/jds.2020-19944
Cattaneo L., Piccioli-Cappelli F., Minuti A., Trevisi E. (2023a). Metabolic and physiological adaptations to first and second lactation in Holstein dairy cows: Postprandial patterns. J. Dairy Sci. 106, 3576–3585. doi: 10.3168/jds.2022-22685
Cattaneo L., Piccioli-Cappelli F., Minuti A., Trevisi E. (2023b). Metabolic and physiological adaptations to first and second lactation in Holstein dairy cows. J. Dairy Sci. 106, 3559–3575. doi: 10.3168/jds.2022-22684
Colucci P. E., Chase L. E., Van Soest P. J. (1982). Feed intake, apparent diet digestibility, and rate of particulate passage in dairy cattle. J. Dairy Sci. 65, 1445–1456. doi: 10.3168/jds.S0022-0302(82)82367-9
DeVries T. J., Dufour S., Scholl D. T. (2010). Relationship between feeding strategy, lying behavior patterns, and incidence of intramammary infection in dairy cows. J. Dairy Sci. 93, 1987–1997. doi: 10.3168/jds.2009-2692
DeVries T. J., von Keyserlingk M. A. G. (2005). Time of feed delivery affects the feeding and lying patterns of dairy cows. J. Dairy Sci. 88, 625–631. doi: 10.3168/jds.S0022-0302(05)72726-0
DeVries T. J., von Keyserlingk M. A. G., Beauchemin K. A. (2003). Short communication: diurnal feeding pattern of lactating dairy cows. J. Dairy Sci. 86, 4079–4082. doi: 10.3168/jds.S0022-0302(03)74020-X
Dibner C., Schibler U., Albrecht U. (2010). The mammalian circadian timing system: organization and coordination of central and peripheral clocks. Annu. Rev. Physiol. 72, 517–549. doi: 10.1146/annurev-physiol-021909-135821
Goff J. P. (2006). Macromineral physiology and application to the feeding of the dairy cow for prevention of milk fever and other periparturient mineral disorders. Anim. Feed Sci. Technol. 126, 237–257. doi: 10.1016/j.anifeedsci.2005.08.005
Harvatine K. J. (2023). Importance of circadian rhythms in dairy nutrition. Anim. Prod. Sci. 63, 1827–1836. doi: 10.1071/AN23085
Hastings M., Maywood E., Brancaccio M. (2019). The mammalian circadian timing system and the suprachiasmatic nucleus as its pacemaker. Biology 8, 13. doi: 10.3390/biology8010013
Huzzey J. M., DeVries T. J., Valois P., von Keyserlingk M. A. G. (2006). Stocking density and feed barrier design affect the feeding and social behavior of dairy cattle. J. Dairy Sci. 89, 126–133. doi: 10.3168/jds.S0022-0302(06)72075-6
Islam M. Z., Giannoukos S., Räisänen S. E., Wang K., Ma X., Wahl F., et al. (2023). Exhaled volatile fatty acids, ruminal methane emission, and their diurnal patterns in lactating dairy cows. J. Dairy Sci. 106, 6849–6859. doi: 10.3168/jds.2023-23301
King M. T. M., Crossley R. E., DeVries T. J. (2016). Impact of timing of feed delivery on the behavior and productivity of dairy cows. J. Dairy Sci. 99, 1471–1482. doi: 10.3168/jds.2015-9790
Liesegang A., Sassi M.-L., Risteli J. (2003). Diurnal variation in concentrations of various markers of bone metabolism in growing female goats and sheep. Anim. Sci. 77, 197–203. doi: 10.1017/S1357729800058938
Nikkhah A., Furedi C. J., Kennedy A. D., Crow G. H., Plaizier J. C. (2008). Effects of feed delivery time on feed intake, milk production, and blood metabolites of dairy cows. J. Dairy Sci. 91, 4249–4260. doi: 10.3168/jds.2008-1075
Niu M., Ying Y., Bartell P. A., Harvatine K. J. (2014). The effects of feeding time on milk production, total-tract digestibility, and daily rhythms of feeding behavior and plasma metabolites and hormones in dairy cows. J. Dairy Sci. 97, 7764–7776. doi: 10.3168/jds.2014-8261
Piccioli-Cappelli F., Loor J. J., Seal C. J., Minuti A., Trevisi E. (2014). Effect of dietary starch level and high rumen-undegradable protein on endocrine-metabolic status, milk yield, and milk composition in dairy cows during early and late lactation. J. Dairy Sci. 97, 7788–7803. doi: 10.3168/jds.2014-8336
Piccione G., Marafioti S., Giannetto C., Messina V., Monteverde V., Guercio A., et al. (2013). Role of bacterial disease on daily rhythm of some metabolic parameters in dairy cow. Comp. Clin. Pathol. 22, 277–281. doi: 10.1007/s00580-011-1399-9
Plaut K., Casey T. (2012). Does the circadian system regulate lactation? Animal 6, 394–402. doi: 10.1017/S1751731111002187
Quiroz-Rocha G. F., LeBlanc S. J., Duffield T. F., Jefferson B., Wood D., Leslie K. E., et al. (2010). Short communication: Effect of sampling time relative to the first daily feeding on interpretation of serum fatty acid and β-hydroxybutyrate concentrations in dairy cattle. J. Dairy Sci. 93, 2030–2033. doi: 10.3168/jds.2009-2141
Quist M. A., LeBlanc S. J., Hand K. J., Lazenby D., Miglior F., Kelton D. F. (2008). Milking-to-milking variability for milk yield, fat and protein percentage, and somatic cell count. J. Dairy Sci. 91, 3412–3423. doi: 10.3168/jds.2007-0184
Rottman L. W., Ying Y., Zhou K., Bartell P. A., Harvatine K. J. (2014). The daily rhythm of milk synthesis is dependent on the timing of feed intake in dairy cows. Physiol. Rep. 2, e12049. doi: 10.14814/phy2.12049
Rottman L. W., Ying Y., Zhou K., Bartell P. A., Harvatine K. J. (2015). The effects of feeding rations that differ in neutral detergent fiber and starch concentration within a day on production, feeding behavior, total-tract digestibility, and plasma metabolites and hormones in dairy cows. J. Dairy Sci. 98, 4673–4684. doi: 10.3168/jds.2014-8859
Salfer I. J., Harvatine K. J. (2020). Night-restricted feeding of dairy cows modifies daily rhythms of feed intake, milk synthesis and plasma metabolites compared with day-restricted feeding. Br. J. Nutr. 123, 849–858. doi: 10.1017/S0007114520000057
Skinner J., Brown R., Roberts L. (1991). Bovine haptoglobin response in clinically defined field conditions. Veterinary Rec. 128, 147–149. doi: 10.1136/vr.128.7.147
Spek J. W., Dijkstra J., Van Duinkerken G., Bannink A. (2013). A review of factors influencing milk urea concentration and its relationship with urinary urea excretion in lactating dairy cattle. J. Agric. Sci. 151, 407–423. doi: 10.1017/S0021859612000561
Sunderman F. W., Nomoto S. (1970). Measurement of human serum ceruloplasmin by its p-phenylenediamine oxidase activity. Clin. Chem. 16, 903–910. doi: 10.1093/clinchem/16.11.903
Trevisi E., Lombardelli R., Minuti A., Bertoni G. (2007). Change of digesta passage rate in dairy cows after different acute stress situations. Ital. J. Anim. Sci. 6, 377–379. doi: 10.4081/ijas.2007.1s.377
Turek F. W. (1994). Circadian rhythms. Recent Progress in Hormone Research, 49 43–90. doi: 10.1016/b978-0-12-571149-4.50007-6
Van Saun R. J. (2023). Metabolic profiling in ruminant diagnostics. Veterinary Clinics North America: Food Anim. Pract. 39, 49–71. doi: 10.1016/j.cvfa.2022.10.004
Watters M. E. A., Barkema H. W., Leslie K. E., Von Keyserlingk M. A. G., DeVries T. J. (2014). Relationship between postmilking standing duration and risk of intramammary infection in freestall-housed dairy cows milked 3 times per day. J. Dairy Sci. 97, 3456–3471. doi: 10.3168/jds.2013-7381
Keywords: metabolic profile, daily rhythm, circadian rhythm, feed entrainment, milk synthesis
Citation: Cattaneo L, Passamonti MM, Piccioli-Cappelli F and Trevisi E (2024) Shifting feed delivery time: effects on feeding behavior, milk production, and blood biomarkers in late-lactating dairy cows. Front. Anim. Sci. 5:1428611. doi: 10.3389/fanim.2024.1428611
Received: 06 May 2024; Accepted: 29 August 2024;
Published: 23 September 2024.
Edited by:
Long Guo, Lanzhou University, ChinaReviewed by:
Giovanni Buonaiuto, University of Bologna, ItalyGibson Maswayi Alugongo, China Agricultural University, China
Copyright © 2024 Cattaneo, Passamonti, Piccioli-Cappelli and Trevisi. This is an open-access article distributed under the terms of the Creative Commons Attribution License (CC BY). The use, distribution or reproduction in other forums is permitted, provided the original author(s) and the copyright owner(s) are credited and that the original publication in this journal is cited, in accordance with accepted academic practice. No use, distribution or reproduction is permitted which does not comply with these terms.
*Correspondence: Erminio Trevisi, ZXJtaW5pby50cmV2aXNpQHVuaWNhdHQuaXQ=