- 1Department of Animal and Dairy Sciences, University of Wisconsin-Madison, Madison, WI, United States
- 2Department of Medical Sciences, School of Veterinary Medicine, University of Wisconsin-Madison, Madison, WI, United States
Heat stress is a known challenge for dairy farms, but standardized, practical heat abatement assessments are lacking. Our objectives were to evaluate the summer ventilation system performance of Wisconsin freestall facilities, provide farms with feedback, and refine our assessment method for knowledge transfer to the industry. Six naturally ventilated (NV) and six cross-ventilated (CV) facilities (n=12) were enrolled. On day 1, 30 focal cows received data loggers to measure resting behavior and intravaginal temperature. Data loggers recorded barn air temperature and relative humidity. Air speeds (AS) were measured manually with anemometers to characterize AS distributions at cow resting (0.5m) and standing (1.5m) heights. Data loggers were removed on day 5, resulting in 3 days of data for resting behavior, vaginal temperature, and temperature humidity index (THI). The fixed effects of average AS and daily maximum THI on daily maximum vaginal temperature (VT), 24-h lying time (LT), and the number and duration of daily lying bouts were analyzed using linear mixed models. We evaluated the fixed effects of THI, average AS, and within-facility SD in AS among stalls on within-facility SD of VT, LT, and the number and duration of lying bouts among focal cows. Stall AS in NV vs. CV barns was 1.4 ± 0.3 vs. 2.0 ± 0.7 m/s (inter-facility ranges: 0.9–1.7 vs. 1.4–3.1 m/s) at resting height and 2.3 ± 0.3 vs. 2.5 ± 0.5 m/s (range: 1.7–2.8 vs. 1.7–3.1 m/s) at standing height. When facility AS increased by 1 m/s, cows had 0.8 fewer lying bouts per day. When the within-facility SD of AS among stalls increased by 1 m/s, the SD among cows of daily lying time increased 1 h/d, driven by an increase in the SDs of lying bouts (+2.5 bouts/d) and durations (13.9 min/bout). For every 10-unit increase in THI, VT increased 0.4°C, daily lying bouts tended to increase by 0.9/d, and SD of daily lying time increased 0.4 h/d. The farms received reports with summary data and suggestions to improve the consistency of AS at cow resting height. Consistent air speeds of ≥1 m/s among stalls can improve cow comfort during heat stress by reducing variation in lying behavior.
1 Introduction
Heat stress in cattle threatens the viability of the dairy industry. Substantial research has documented the negative effects of heat stress on the welfare and productivity of dairy cattle. Cattle exposed to heat stress experience a reduction in feed intake (West, 2003; Spiers et al., 2004; Baumgard and Rhoads, 2013), milk yield (Collier et al., 1981; Gantner et al., 2017; Tao et al., 2020), and fertility (García-Ispierto et al., 2007; Morton et al., 2007; Schüller et al., 2014). In extreme instances, severe heat stress can result in cattle deaths (Bishop-Williams et al., 2015; Vitali et al., 2015). The estimated economic impact of heat stress on the U.S. dairy industry is between $897 million to $1.5 billion annually (St-Pierre et al., 2003) for lactating cows and youngstock. However, these estimates are decades old, and the 10 warmest years on record within the 1850 to 2023 database occurred since those numbers were generated (2014–2023; NOAA National Centers for Environmental Information, 2024). This suggests that the actual economic impact is likely higher now and will continue to increase as global temperatures rise. Furthermore, recent research has reported the potential for an additional $1.4 billion in costs from the lasting effects of dry cow heat stress (Laporta et al., 2020).
During periods of heat stress, cows increase standing times at the expense of time spent resting (Cook et al., 2007; Allen et al., 2015; Ortiz et al., 2015). As the temperature-humidity index (THI) increases, lying times have been documented to decrease by as much as 3.3 h/d, driven by a decline in the duration of each lying bout (Nordlund et al., 2019). During a single lying bout, cows can gain 0.40–0.48°C in core body temperature, whereas they can dissipate heat at a rate of up to –0.25°C/h while standing (Nordlund et al., 2019). Cows are highly motivated to lie down (reviewed by Tucker et al., 2021), and frustration and discomfort may occur when the desire to lie down conflicts with the need to dissipate heat (Polsky and von Keyserlingk, 2017). Furthermore, longer standing times when cows experience heat stress may explain both the higher rates of claw lesions observed in late summer (Cook and Nordlund, 2009) and a peak in overall lameness prevalence in the late summer and fall (Cook et al., 2006; Sanders et al., 2009). These delayed, cumulative effects of heat stress on the risk of lameness currently remain unaccounted for in economic estimations of the impact of heat stress.
Approximately 98.7% of U.S. farms provide at least one type of heat abatement, such as shade, fans, and/or soakers to alleviate the deleterious welfare and production impacts of heat stress (USDA, 2021). Studies using water-based cooling methods (i.e., soakers or misters) have documented reductions in physiological responses such as respiration rate (Correa-Calderon et al., 2004; Schütz et al., 2011) and vaginal temperature (Kendall et al., 2007; Chen et al., 2016) along with increased milk yields (Flamenbaum et al., 1986; Chen et al., 2016) and dry matter intake (Strickland et al., 1989; Levit et al., 2021). However, these methods fail to restore the lying times reduced during periods of heat stress (Overton et al., 2002; Legrand et al., 2011; Chen et al., 2013).
Until a recent study by our group, no study had reported a method of improving lying times under heat stress conditions. We found that fans delivering air speeds of at least 1 m/s at cow resting height (defined as 0.5 m above the bedded surface) improved 24-h lying times by an average of 1 h/d compared to when cows had only prevailing winds and the shade of the barn (Reuscher et al., 2023). Properly calibrated fans also maintained vaginal temperature within the normal physiological range (≤39.2°C; Merck Veterinary Manual, 2012), in contrast to when cows had no fans, and VT values reached as high as 40.1°C on the hottest days (Reuscher et al., 2023). The calibrated fans were also effective in reducing respiration rate and improving milk yield and dry matter intake (Reuscher et al., 2023). These experimental findings are consistent with the minimum cooling air speed (MCAS) recommended by Mondaca (2019) of ≥1 m/s at cow resting height to maintain a favorable heat loss gradient around resting cows.
Facility-specific data provided in a benchmarking report can help inform management decisions to improve the MCAS at cow resting height on farms. Benchmarking can be a valuable tool to compare one’s performance with others and identify areas for improvement (Anand and Kodali, 2008). Research has shown that providing dairy farms with benchmarking reports results in changes which improve measured outcomes such as calf growth and transfer of passive immunity (Atkinson et al., 2017) or lameness rates in cows (Chapinal et al., 2014). Reports with areas identified for improvement, along with suggestions of solutions, can help the farmer feel empowered by allowing them to make informed decisions on specific issues (Sumner et al., 2018).
Our research team had previously developed a standardized method for reporting ventilation performance in both mechanical (e.g., cross-ventilated) and naturally ventilated freestall dairy facilities (Mondaca et al., 2019). This method mapped air speeds at both cow standing and resting heights (1.5 and 0.5 m, respectively) for 3 min/location along with measuring barn temperature and relative humidity. The 42 farms which were used to validate the methodology were given a report characterizing the ventilation performance, pen maps outlining areas with insufficient air speeds (<1 m/s) at cow resting and standing heights, a summary, and action items for potential improvements. However, on-farm assessments should also include animal-based measures (Whay et al., 2003) such as vaginal temperature and lying time to directly assess animal welfare and/or heat stress status in relation to the air speeds and microclimate. Additionally, refinement was needed to reduce the time needed for the assessment and to simplify the process of generating the feedback reports for wider adoption of the methodology across the dairy industry.
Our objective was to evaluate the summer ventilation system performance in a sample of naturally and mechanically cross-ventilated Wisconsin dairy facilities and to refine the assessment method for knowledge transfer to the dairy industry. We hypothesized that facilities with consistently higher air speeds, as measured at cow resting height (0.5 m), would provide the most effective heat abatement. Specifically, we predicted that cows at facilities with higher air speeds would exhibit longer daily lying times (with fewer daily lying bouts but longer lying bout durations) and lower daily maximum vaginal temperature.
2 Materials and methods
2.1 Animals and housing
The study was conducted during the summer (June to August 2021) in six naturally ventilated (NV) and six mechanically cross-ventilated (CV) freestall dairy facilities (n = 12 facilities across 10 farm ownerships) in Wisconsin, USA, with all procedures approved by the University of Wisconsin-Madison Institutional Animal Care and Use Committee (protocol #A005906).
The enrollment criteria for facilities in the study were: high-producing herds with 300 to 3000 milking cows, 3 times/d milking in a parlor, at least one pen dedicated to high-producing cows, at least one hoof trim per lactation, deep-bedded stalls (NV: all six used sand bedding, CV: five sand and one manure solids), uniform stall design within the high-producing pen, head locks at the feed bunk, and drive-through total mixed ration (TMR) feeding. The number of cows and milk yield are reported in Table 1. One focal pen of high-producing cows was selected on each facility, and 30 focal cows were selected from this pen at each facility, for a total of 360 lactating Holsteins observed in the study. To be considered for enrollment as focal animals, cows had to be pregnant and non-lame (as determined by research personnel). The characteristics of the focal pens and focal cows among the facilities are summarized in Table 1.
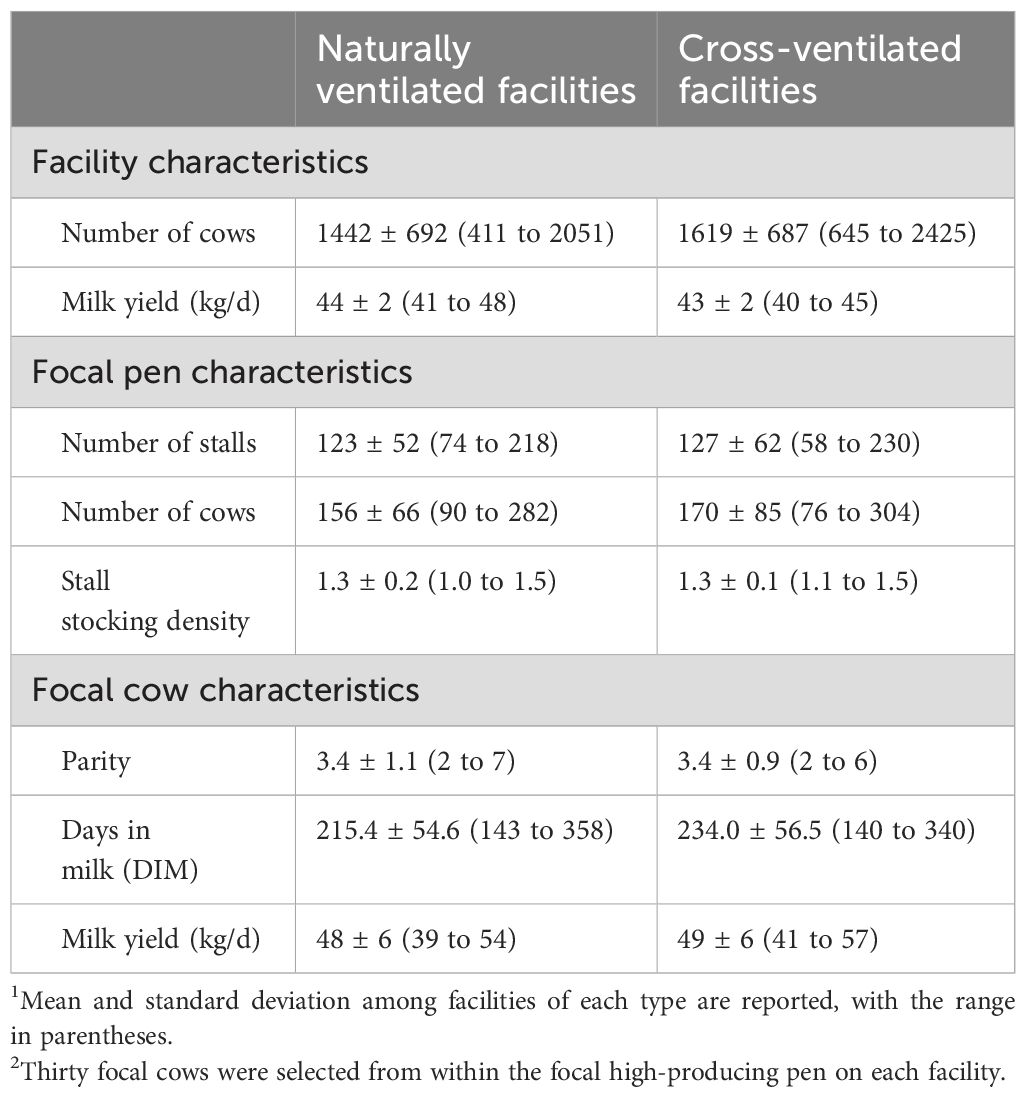
Table 1. Summary1 of the facility, focal pen, and focal cow2 characteristics among the 12 freestall dairy facilities (6 naturally ventilated and 6 mechanically cross-ventilated) enrolled in the study.
2.2 Measures
Each facility was visited twice in a single week. On Mondays (d 1), the research team placed the data loggers and performed a microclimate assessment of the focal high-producing pen. On Fridays (d 5), the research team removed the equipment. Farm visits were balanced between the NV and CV facilities across weeks to distribute the effects of weather and seasonal change between the facility types.
2.2.1 Environmental measures
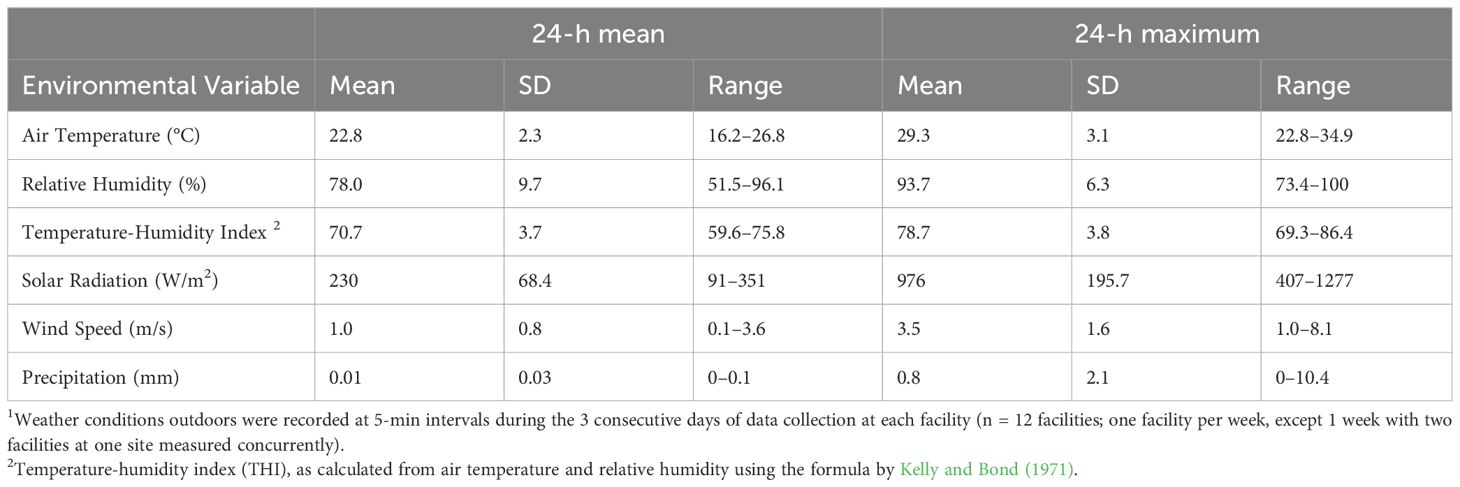
A portable weather station (HOBO U30-NRC, Onset Computer Corporation) was placed outdoors on the farmstead to record ambient conditions at 5-min intervals: air temperature (T, °C), relative humidity (RH, %), solar radiation (W/m2), wind speed (m/s), and precipitation (mm). The 24-h weather conditions are summarized in Table 2.
In the focal pen, a T and RH logger (HOBO U23, Onset Computer Corporation) was mounted 2 m above the stall bed to record microclimate conditions at 5-min intervals.
The THI, both in the experimental pens and outdoors, was calculated by the following equation from Kelly and Bond (1971):
Air speeds (AS) in resting stalls within the focal pen were evaluated (Figure 1) with a propeller anemometer (Kestrel 5500AG, Nielson-Kellerman Company) with a rotating vane mount (Kestrel Rotating Vane Mount 5000, Nielson-Kellerman Company) set at 1.5 m high to represent cow standing height, and a hot-wire anemometer (Alnor Velometer Thermal Anemometer AVM440, TSI Incorporated) with the probe set at 0.5 m above the stall bed to represent cow resting height (Mondaca et al., 2019), both mounted on a tripod (TP-TR62, Digipower). The greater accuracy of the hot-wire anemometer enabled accurate detection of AS at lower speeds (<0.5 m/s) which are more common at resting height. At each facility, the research team created a hand-drawn diagram of the barn dimensions and the focal pen layout, with each sampling location marked for reference. Each location was measured for 1 min simultaneously on both devices. After each sampling interval, the research team member wrote down the average air speed shown on the devices before moving to the next location.
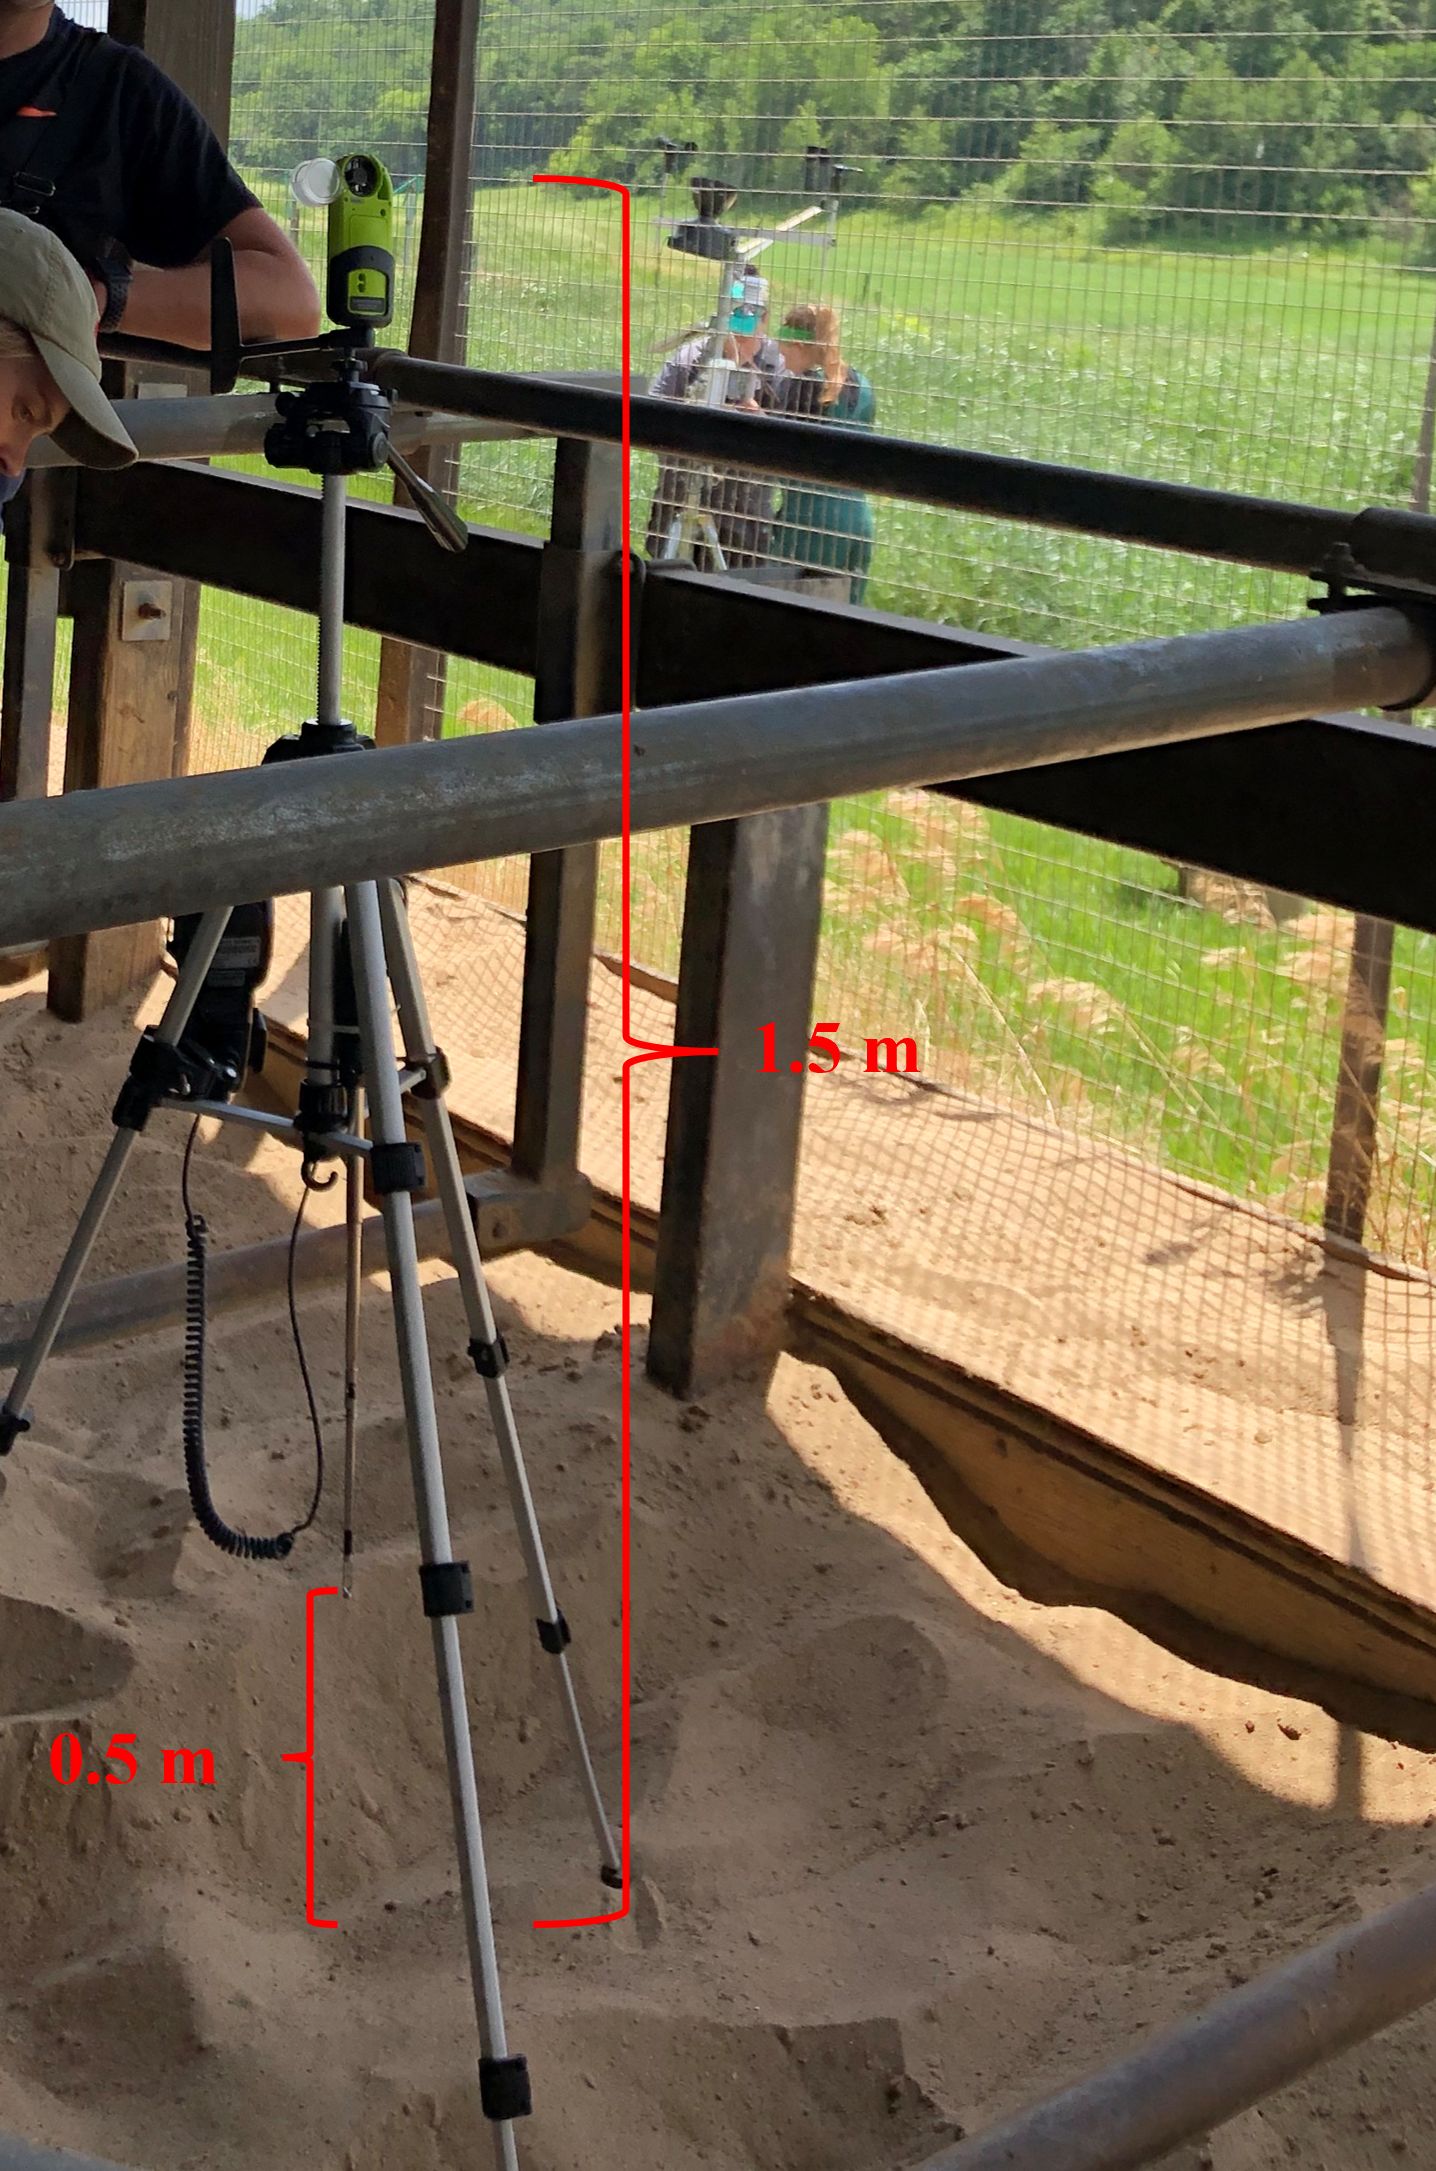
Figure 1. Photo of how air speed was measured in a stall (1 min per location). To obtain air speeds at cow standing (1.5 m) and resting (0.5) heights, a propellor anemometer on a rotating vane mount and a hot wire anemometer were used, respectively. The two devices were mounted on the same tripod, as demonstrated in the photo, and placed in the middle of the stall with the notch on the end of the hot-wire anemometer facing toward the direction of oncoming air flow.
For the NV facilities, air speeds relative to the circulation fans in the resting area were characterized in the focal pen (Figure 2A) by starting in a stall directly underneath a fan at least 6.0 m from the end wall; measurements were collected at 2.4-m intervals between three fans within a row of stalls. The same locations were tested along each row of freestalls within the pen. The notch of the hot-wire anemometer was pointed toward the direction of oncoming air flow, as determined using the rotating vane mount.
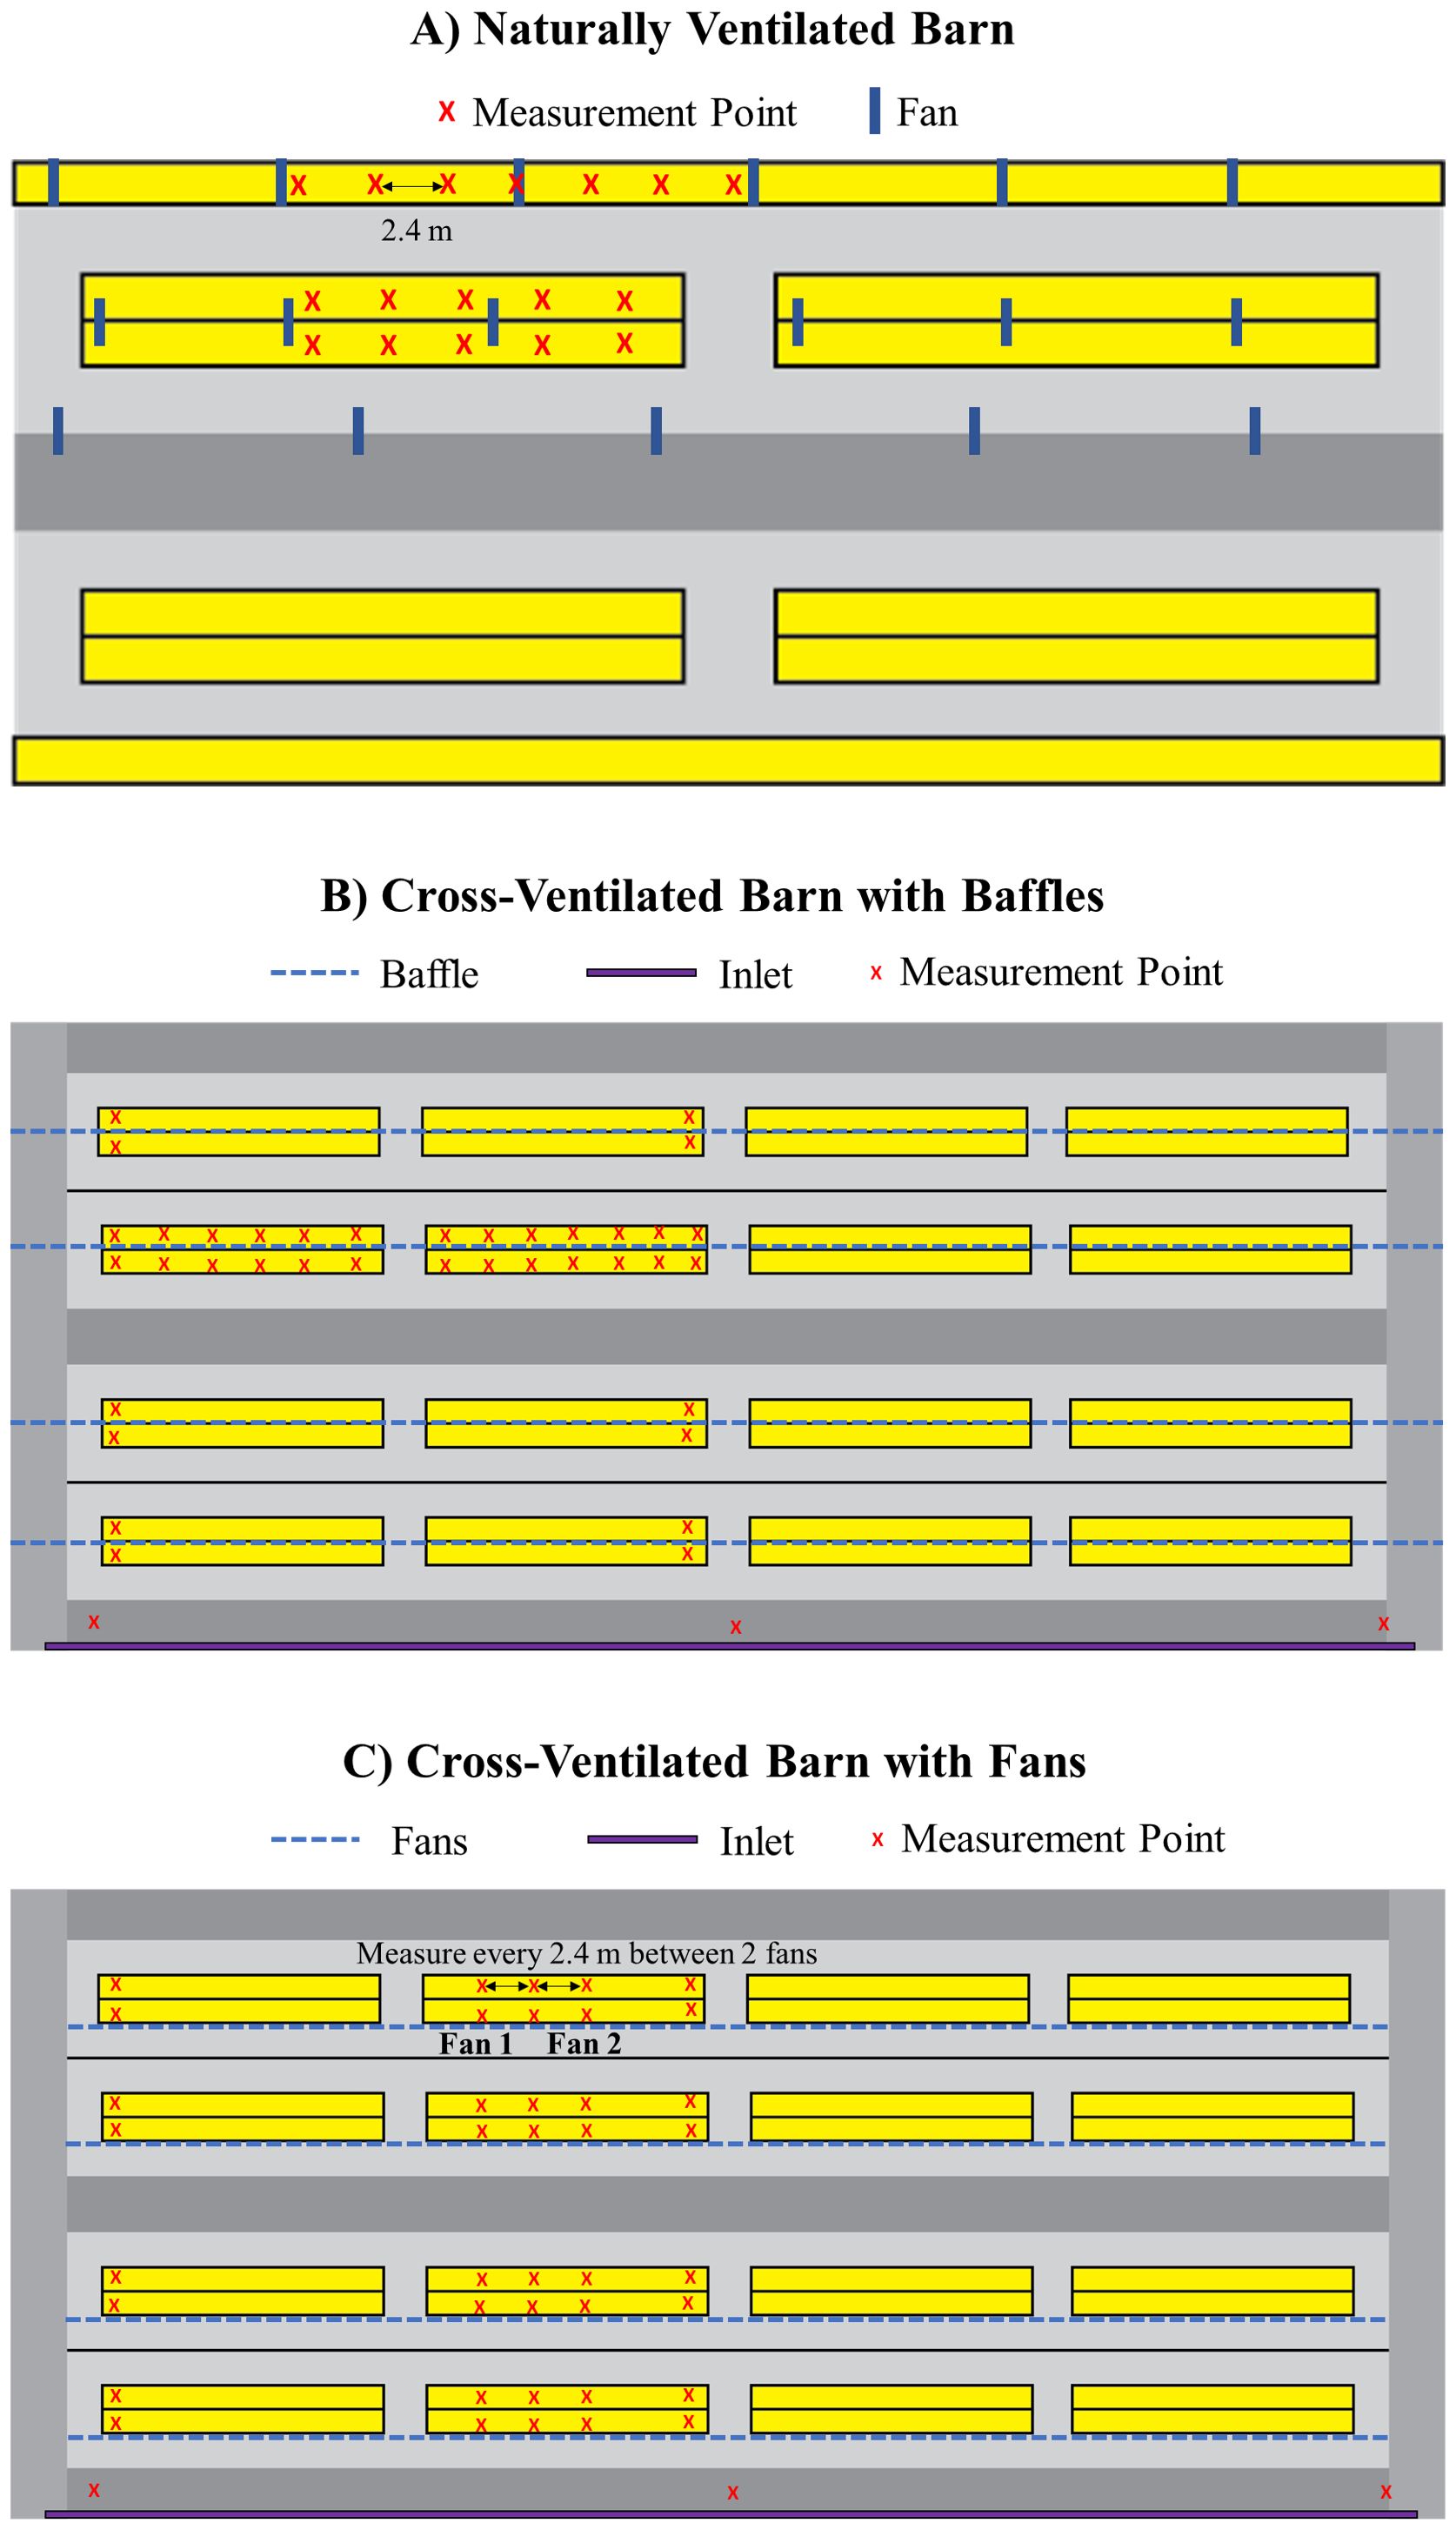
Figure 2. Diagram of example locations of where air speeds were measured in the cows’ resting stalls (yellow filled areas) within freestall facilities with either (A) natural ventilation and fans (n = 6) or mechanical cross-ventilation with (B) baffles (n = 5) or (C) fans (n = 1).
For the CV facilities, air speeds were recorded in stalls within multiple pens following an “H” pattern along the barn, including on either side of baffles, if present (Figure 2B). For CV barns with fans over the pens (Figure 2C), readings were taken every 2.4 m between two fans, with at least four measurements per row in the pens closest to the barn’s inlet and outlet. The notch of the hot-wire anemometer was pointed toward the inlets when taking air speeds. A minimum of at least 27 air speed readings was taken in each facility.
In the CV facilities, air exchange was calculated using barn volume (BV, m3) and fan capacity. Barn measurements were collected with a laser distance meter (DISTO X4, Lecia) for barn length (BL), barn width (BW), sidewall height (SH), and ridge height (RH). The following equation was used to determine BV:
Next, the total fan capacity (TFC, m3/h) was determined by counting the number of exhaust fans and multiplying the number by the fan capacity at 2.54 mm H2O static pressure, as rated by the manufacturer or as listed in an independent source archive (http://bess.illinois.edu/search.asp).
Lastly, the total air changes per hour (ACH) when all exhaust fans were running was calculated using the following formula:
2.2.2 Cow measures
Vaginal temperature (VT) was recorded to represent core body temperature at 1-min intervals with loggers (DST centi-T; Star Oddi), which were attached using heat shrink tubing to the wing of a hormone-free controlled internal drug release insert (Eazi-Breed CIDR; Zoetis). Cows were affixed with accelerometers (HOBO Pendant G, Onset Computer Corporation) on the inside of the left hind leg to record lying and standing postures at 1-min intervals. The accelerometers were placed in a plastic bag with a piece of foam to prevent abrasions and then attached to the leg with cohesive bandage (Vetrap; 3M Products). The data were cleaned for erroneously short lying events as described by Ito et al. (2009) and were summarized to calculate total lying time (LT, h/d), lying bouts per day, and duration per lying bout (min/bout) for each cow using SAS code (T. Bennett; UW-Madison).
2.3 Feedback reports
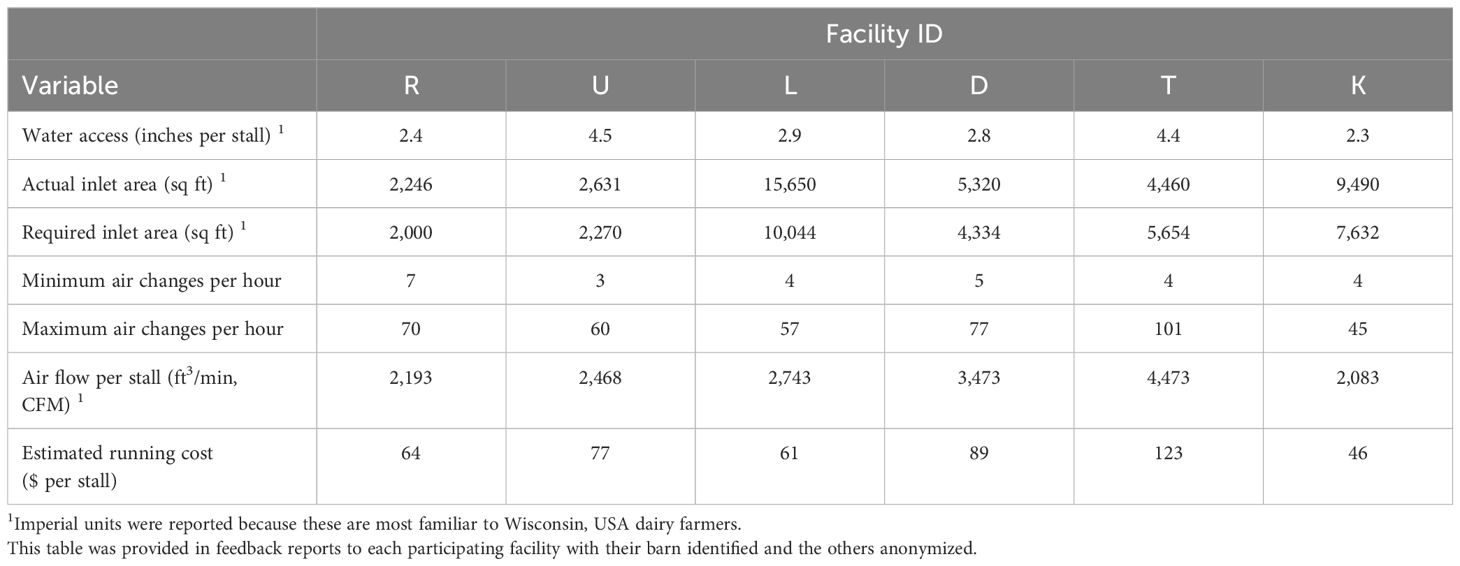
Descriptive reports were generated for each facility comparing summary data from their facility to anonymized data from the other five facilities of the same ventilation type (NV or CV). Data were reported using imperial units, as this measurement system is most familiar to US farmers. Specifically, we used feet (3.28 ft = 1 m) and inches (12 inches per ft) to describe barn and fan dimensions, feet per minute (100 ft/min = 0.508 m/s) to report AS, and °F (1.8°F per °C; 32°F = 0°C) to report cows’ VT. For CV barns, a summary page reported the facility’s calculated winter and summer ACH, maximum air flow (ft3/min, CFM) per stall, maximum AS (ft/min) below the baffles, the required inlet area needed for 500 ft/min (2.54 m/s) entry air speed, and the estimated annual operating cost (USD, total and per stall). Next, a table (Table 3) compared the following parameters for each facility: water trough access (inches/stall), actual vs. required inlet area, minimum vs. maximum ACH, air flow per stall (CFM), and estimated running cost per stall (USD). For NV barns, a summary page reported the barn’s dimensions (BL, BW, SH, RH), the number of stalls in the focal pen, water trough perimeter (per pen and per stall), and the general locations, number, diameter, and spacing of fans.
Both facility types received bar graphs (Figure 3) showing the average AS at cow resting height, maximum daily THI, maximum daily VT, and daily LT across the six facilities of the same type. Although the figure in this manuscript shows both facility types, the reports given to the farms only contained data from their type of facility. Next, the reports had a bar graph showing LT (mean and SD among the 3 d) for each of the focal cows at that facility. Finally, comments on practical inferences about the performance of the ventilation and heat-abatement systems on that facility and suggestions for troubleshooting were summarized. The reports also included an AS map (for both resting and standing heights) of the evaluated barn. Example AS maps for cross-ventilated and naturally ventilated facilities shown in Supplementary Figures S1 and S2.
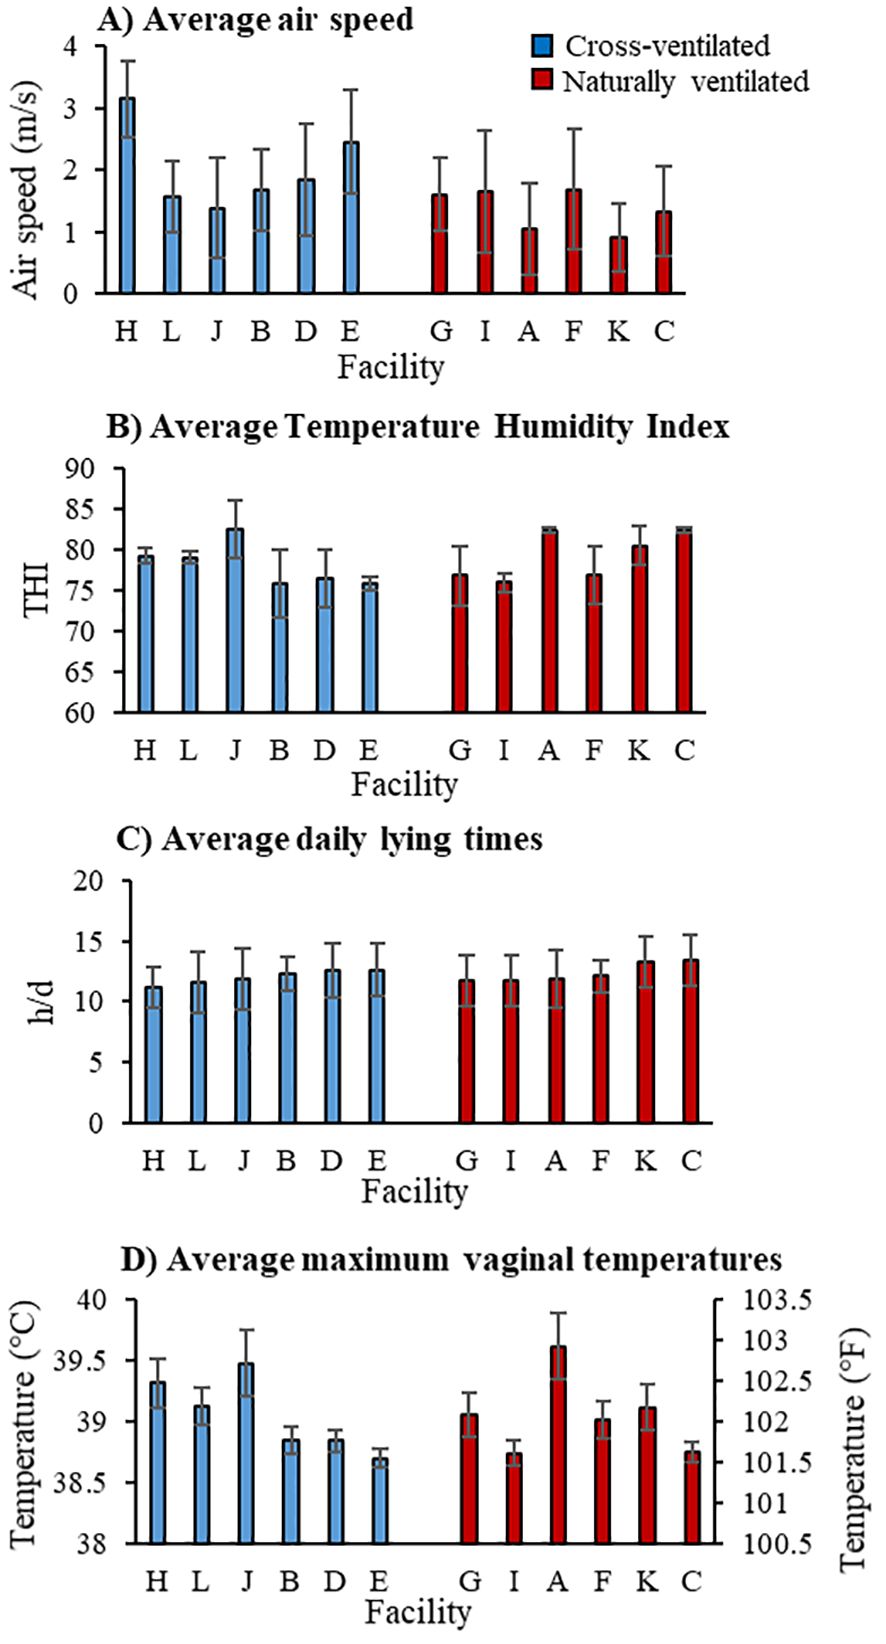
Figure 3. Figure provided in feedback reports to each participating facility, either mechanically cross-ventilated (n = 6) or naturally ventilated (n = 6), with their barn identified and the others anonymized; facilities are shown in rank order by average lying time, with the order maintained for all figure panels. Shown are the mean ± SD of: (A) air speed at cow resting height (0.5 m) in the stalls, (B) maximum daily temperature-humidity index (THI) in the focal pen, (C) daily lying time (among n = 30 focal cows per facility), and (D) maximum daily vaginal temperature in the focal cows.
2.4 Statistical analysis
All variables were summarized per 24-h for the 3 d of data collection (d 2–4). Facility was the experimental unit (n = 12), and thus all cow-level data (VT, LT, number and duration of lying bouts) were averaged at the facility level for analysis. Independent predictor variables included maximum daily THI in the pens for the 3 d of data collection (d 2–4) and AS at cow resting height (both the facility mean and the SD among measured stalls). Air speeds at cow standing height are reported only descriptively.
2.4.1 Missing or excluded data
Missing data occurred due to cows being culled, moved out of the focal pen, or from loggers becoming lost. Body temperature data were missing for 6 and 11 cows from four NV and four CV facilities, respectively (out of 180 cows per facility type). Lying time data were missing for two and seven cows in two NV and two CV facilities, respectively; in addition, data were excluded for one cow from a CV facility, as she was identified as lame at the time of logger removal.
2.4.2 Statistical models
All analyses were conducted using SAS software (Version 9.4; SAS Institute Inc.). The assumptions of normality and equal variance were evaluated by visually examining plots of the residuals. Effects of AS on cow-based measures were evaluated using linear mixed models with day (2–4) as a repeated measure and facility as the subject. First, to determine the effects of average AS at cow resting height and THI on average cow-based responses (maximum daily VT, 24-h LT, number of lying bouts per 24 h, and average duration of lying bouts), the models included fixed effects of AS and daily maximum THI. Second, to evaluate the effect of the variability in AS among stalls, when accounting for average AS and THI, on the variability in cow-based responses (SD of the aforementioned dependent variables), the models included fixed effects of facility-average AS at cow resting height, SD of AS at cow resting height, and daily maximum THI. All models also included a fixed effect of facility type (NV vs. CV).
3 Results
3.1 Air speed and microclimate
In the CV facilities, the average AS at cow resting height was 2.0 ± 0.7 m/s, and all six facilities exceeded the MCAS of ≥ 1 m/s (Figure 3A). The average AS at cow resting height in the NV barns was 1.4 ± 0.3 m/s, and one of the six facilities had an average AS which was marginally below the MCAS (0.9 m/s; Figure 3A). However, there was noteworthy within-facility variability in AS at cow resting height among the stalls measured, with 16.3 ± 15.0 and 38.5 ± 21.1% of stalls within the CV and NV facilities, respectively, recorded as having AS below the recommended MCAS of ≥1 m/s (overall when combining facility types: 27.4 ± 20.9% of stalls; mean ± SD).
The average AS at cow standing height in the CV vs. NV barns was 2.5 ± 0.5 vs. 2.3 ± 0.3 m/s, (range: 1.7–3.1 vs. 1.7–2.8 m/s, respectively). There was also within-facility variability in AS at cow standing height among the stalls measured, with 7.2 ± 8.0 and 11.9 ± 5.2% of stalls within the CV and NV facilities, respectively, recording as having AS below 1 m/s (overall: 9.9 ± 7.0% of stalls; mean ± SD).
The average daily maximum THI within the CV vs. NV barns was 78.2 ± 3.4 vs. 79.1 ± 3.4 (Figure 3B).
3.2 Average cow responses
3.2.1 Resting behavior
The average daily LT among focal cows in the CV vs. NV barns was 12.0 ± 0.8 vs. 12.3 ± 0.9 h/d, respectively (Figure 3C). On average, there were 11.3 ± 1.4 vs. 11.6 ± 1.0 lying bouts/d in the CV vs. NV barns, averaging 69.5 ± 7.4 vs. 68.2 ± 7.7 min/bout. No effects were detected of average facility AS at cow resting height or daily maximum THI on the overall daily LT (F1,32 ≤ 0.3; P > 0.44; Figures 4A, B). However, there was an effect of average facility AS at cow resting height on the number of daily lying bouts (F1,32 = 6.5, P = 0.031; Figure 4C): for every 1 m/s increase in AS, lying bouts decreased by 0.8 bouts/d. There was also a tendency for an effect of THI (F1,32 = 2.9, P = 0.10; Figure 4D): for every 10-unit increase in daily maximum THI, the number of lying bouts increased by 0.9/d. No effects were detected of average facility AS at cow resting height or daily maximum THI on the duration of lying bouts (F1,32 ≤ 0.2; P > 0.12; Figures 4E, F).
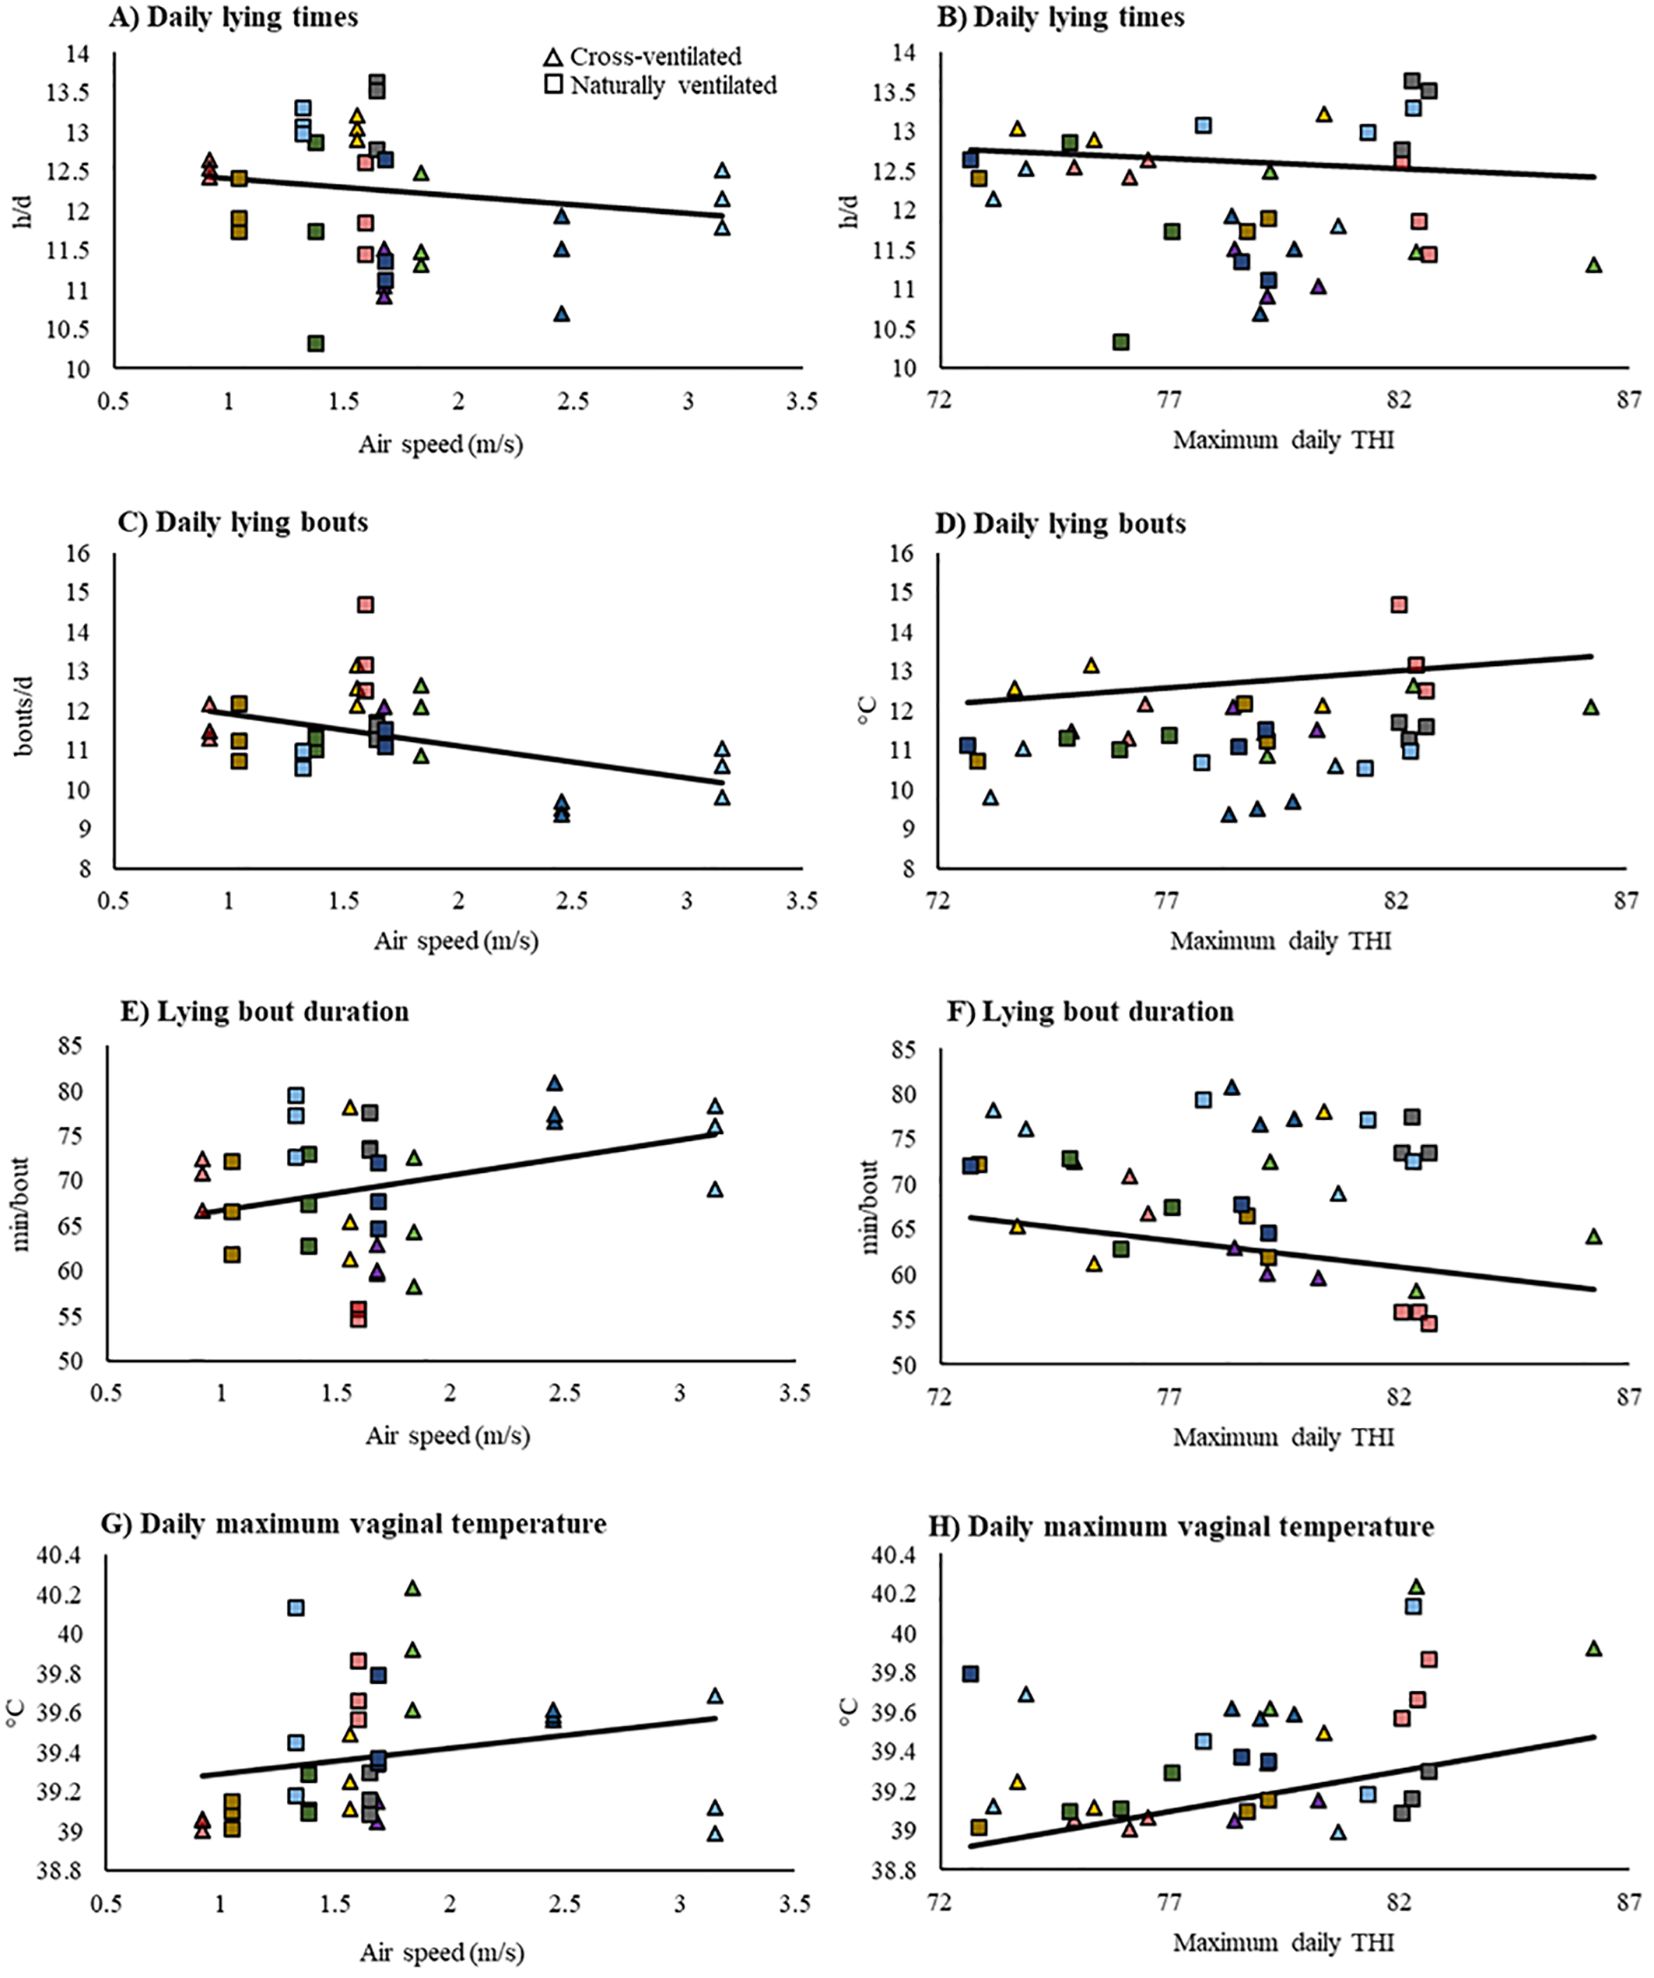
Figure 4. Dependent variable responses in mechanically cross-ventilated and naturally ventilated facilities (n = 6 facilities of each type), depending on the air speeds measured at cow resting height (0.5 m) in the stalls and the maximum daily temperature-humidity index (THI) in the pens. The dependent variables were: (A, B) 24-h lying time, (C, D) number of daily lying bouts, (E, F) average duration of lying bouts, and (G, H) daily maximum vaginal temperature. Air speed data were manually collected on day 1, whereas data for THI, resting behavior, and vaginal temperature were recorded with data loggers over 3 days at each facility.
3.2.2 Vaginal temperature
Among focal cows, average maximum VT was 39.4 ± 0.5°C regardless of barn type (Figure 3D). There was no effect of average facility AS at cow resting height on VT (F1,32 = 1.8, P = 0.21; Figure 4G). However, there was an effect of maximum daily THI (F1,32 = 6.8, P = 0.015): for every 10-unit THI increase, maximum daily VT increased by 0.4°C (Figure 4H).
3.3 Within-facility variation in cow responses
3.3.1 Resting behavior
Among focal cows, the average within-facility SD in daily lying times was 1.9 ± 0.4 vs. 1.8 ± 0.3 h/d in the CV and NV facilities respectively (Figure 5). For the number of lying bouts, the SD among cows in the CV vs. NV facilities was 3.3 ± 0.5 vs. 3.3 ± 0.7 bouts/d. The average SD in lying bout durations was 20.7 ± 4.9 vs. 18.9 ± 4.2 min/bout in the CV vs. NV barns.
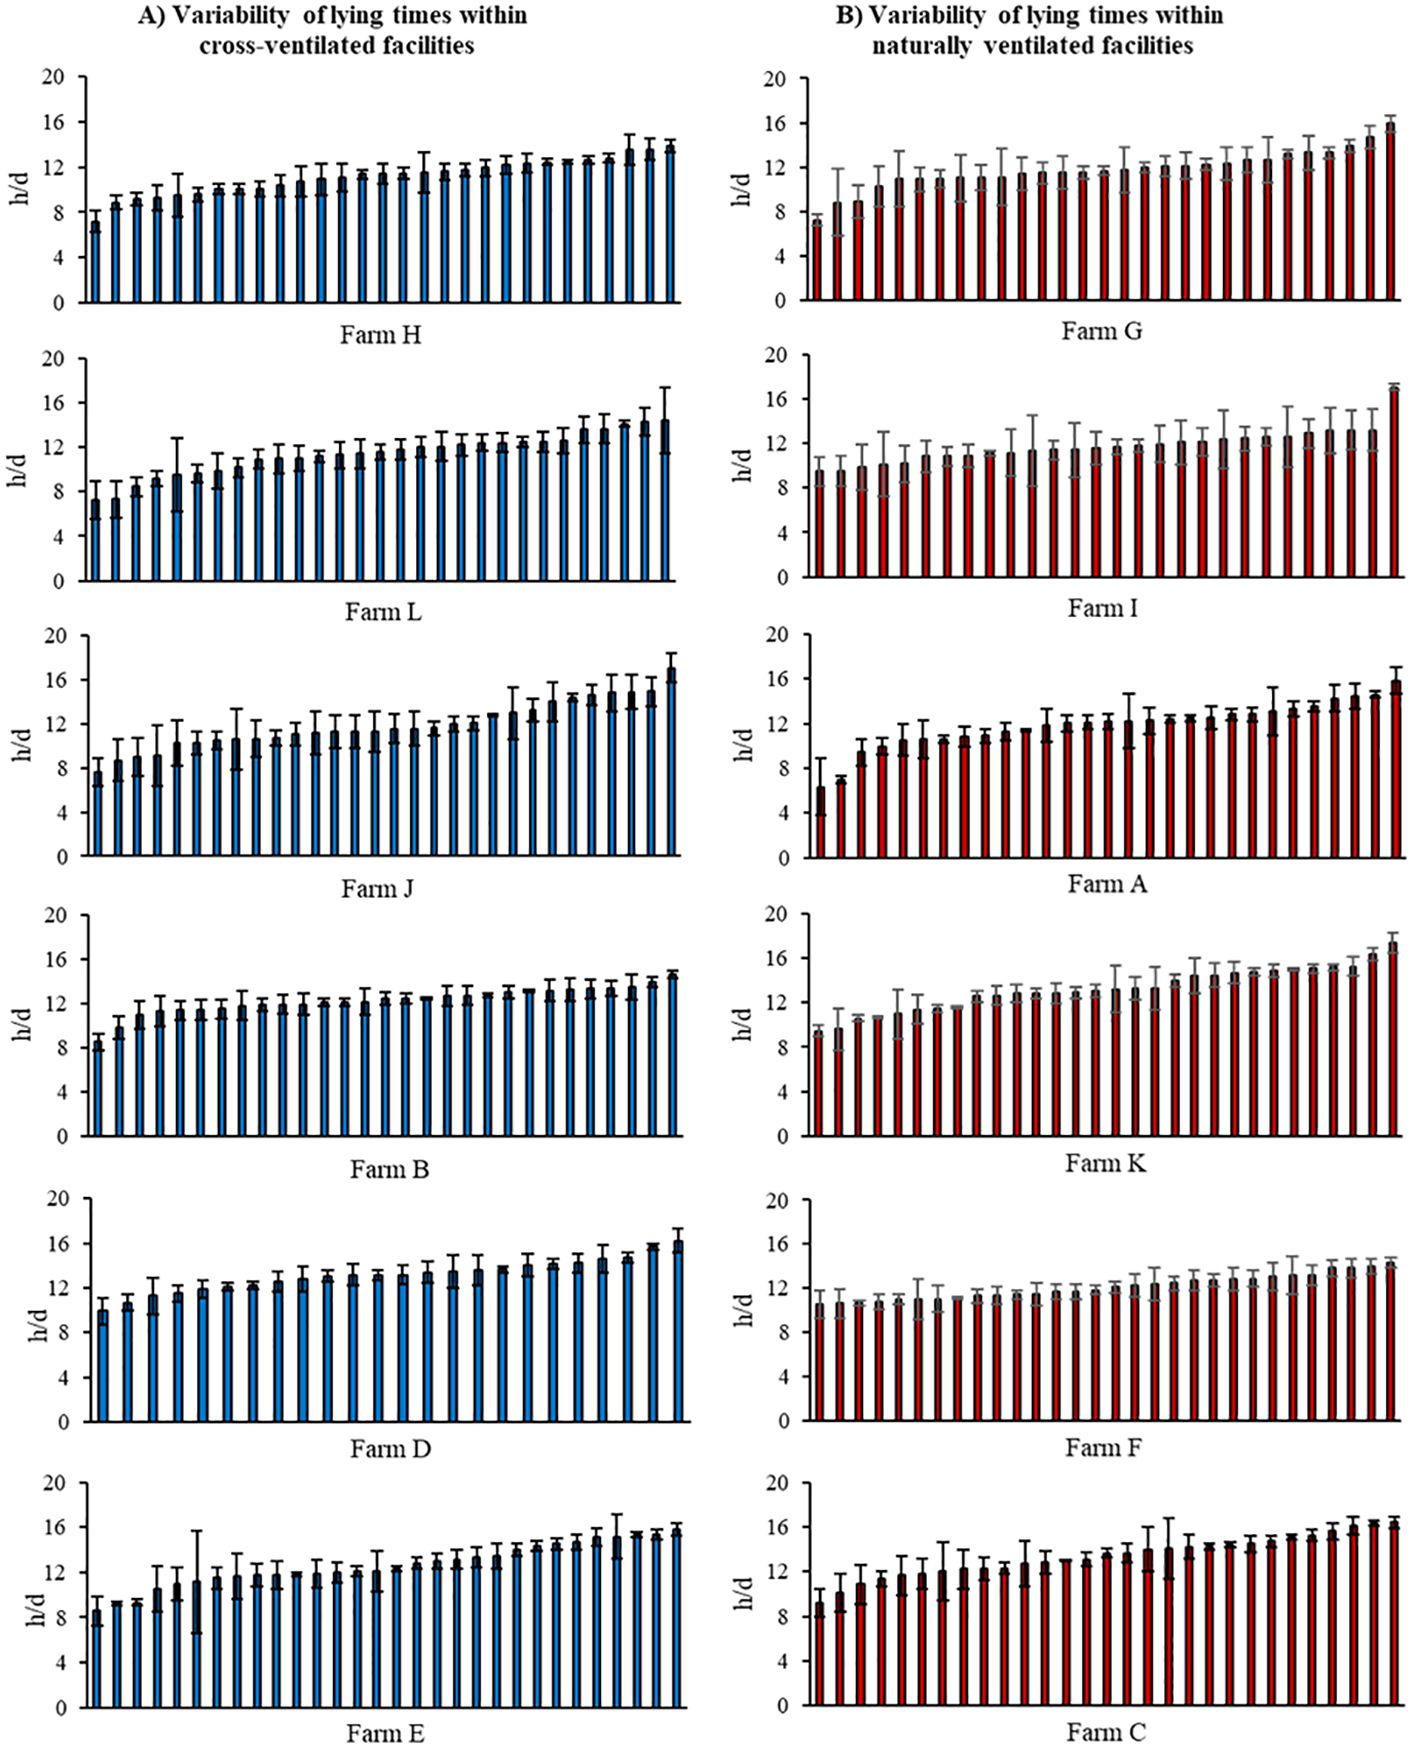
Figure 5. Mean ± SD lying time (in rank order) recorded on 3 consecutive days for n = 30 high-producing focal cows on each facility: (A) mechanically cross-ventilated (n = 6) and (B) naturally ventilated (n = 6) freestall barns. In the feedback report given to each facility, they received the graph for focal cows in their own facility, with individual cow IDs labeled on the x-axis and mean and median lying time reported.
The within-facility SD of LT was affected by both the SD (F1,31 = 5.8, P = 0.042; Figure 6A) of AS among stalls and the maximum daily THI (F1,31 = 5.4, P = 0.029; Figure 6C). For every 1 m/s increase in the SD of AS, the SD of lying time increased by 1 h/d, and for every 10-unit increase in THI, the SD of lying time increased by 0.4 h/d. The within-facility SD of LT also tended to be affected by the facility mean AS (F1,31 = 5.0, P = 0.056; Figure 6B): for every 1 m/s increase in mean AS at cow resting height, the SD of lying time tended to decrease by 0.2 h/d.
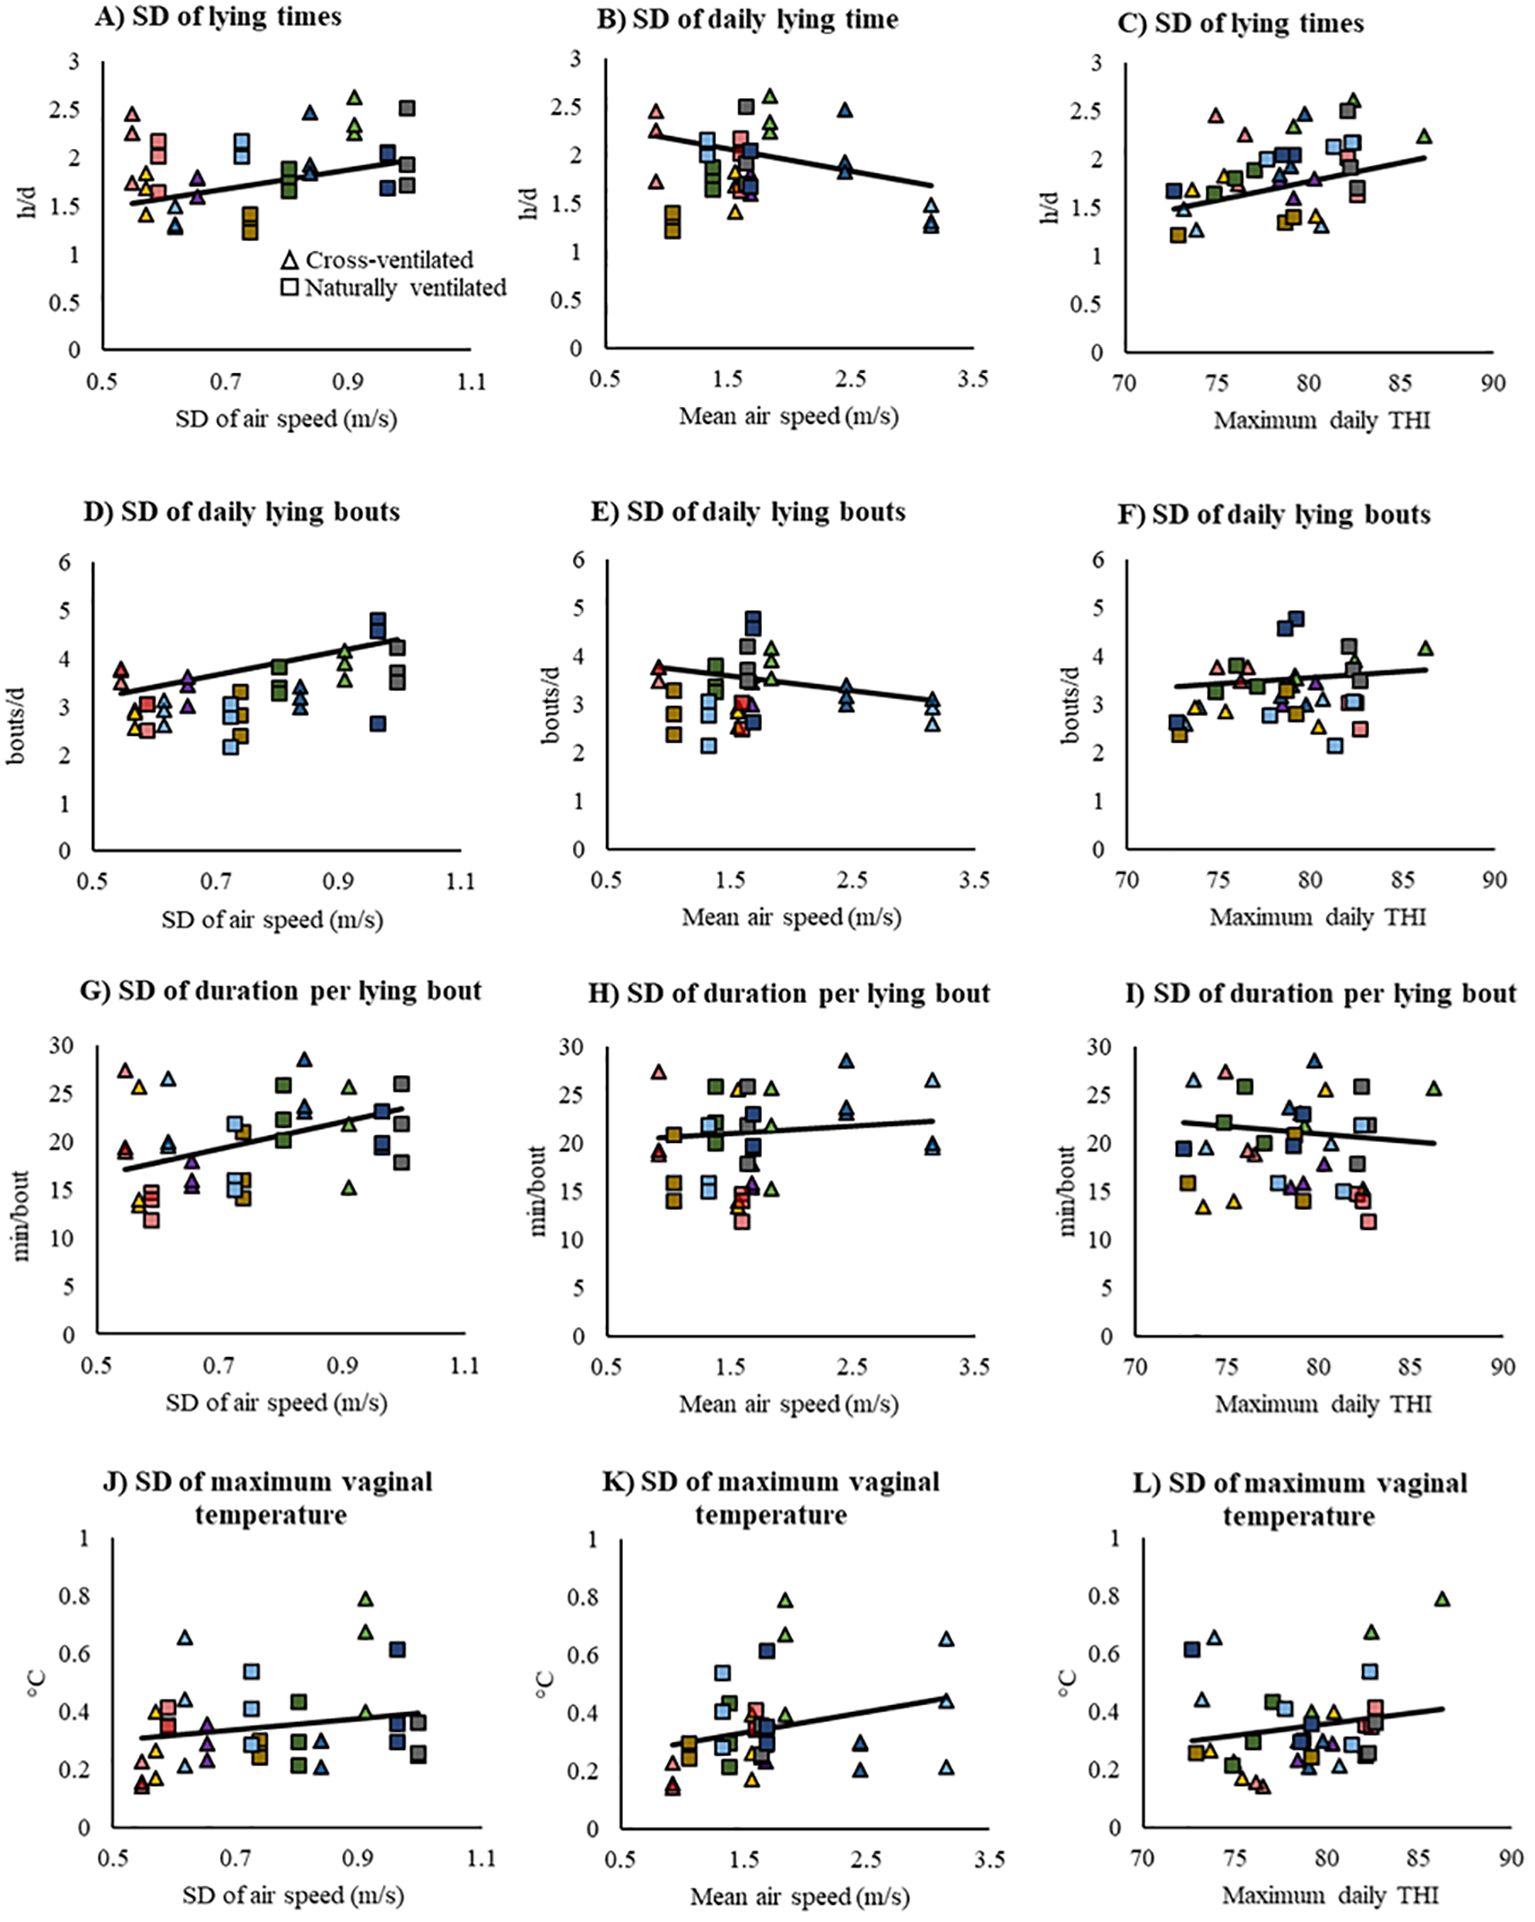
Figure 6. Dependent variable responses in mechanically cross-ventilated (CV) and naturally ventilated (NV) facilities (n = 6 facilities of each type), depending on the maximum daily temperature-humidity index (THI) in the pens and both mean and SD of air speeds measured at cow resting height (0.5 m) in the stalls. The dependent variables were the within-facility SD among focal cows (n = 30 per facility) for: (A-C) 24-h lying time, (D-F) number of daily lying bouts, (G-I) average duration of lying bouts, and (J-L) daily maximum vaginal temperature. Air speed data were manually collected on day 1, whereas data for THI, resting behavior, and vaginal temperature were recorded with data loggers over 3 days at each facility.
For the SD of the number of lying bouts per day, there was an effect of the SD in AS among stalls (F1,31 = 14.6, P = 0.005; Figure 6D) and a tendency for an effect of the facility mean AS (F1,31 = 3.4, P = 0.100; Figure 6E). For every 1 m/s increase in the SD of AS, the SD of the number of lying bouts increased by 2.5/d, and for every 1 m/s increase in average AS at cow resting height, the SD of the number of lying bouts decreased by 0.3/d. There was no effect of daily maximum THI on the SD of the number of lying bouts per day (F1,31 = 0.9, P = 0.35; Figure 6F).
Similarly, there was an effect of the SD of AS among stalls on the SD of the duration of lying bouts (F1,31 = 6.6, P = 0.033; Figure 6G): for every 1 m/s increase in the SD of AS, the SD of the duration of lying bouts increased by 13.9 min/bout. However, there was no effect of mean facility AS at cow resting height nor of daily maximum THI on the SD of lying bout duration (F1,31 ≤ 0.3; P > 0.48; Figures 6H, I).
3.3.2 Vaginal temperature
Among focal cows, the average within-facility SD in maximum VT was 0.34 ± 0.18°C regardless of barn type (Figure 7). No effect on within-facility SD in maximum daily VT among focal cows was detected for either the mean or SD of AS at cow resting height or for daily maximum THI (F1,31 ≤ 1.1; P > 0.17; Figures 6J–L).
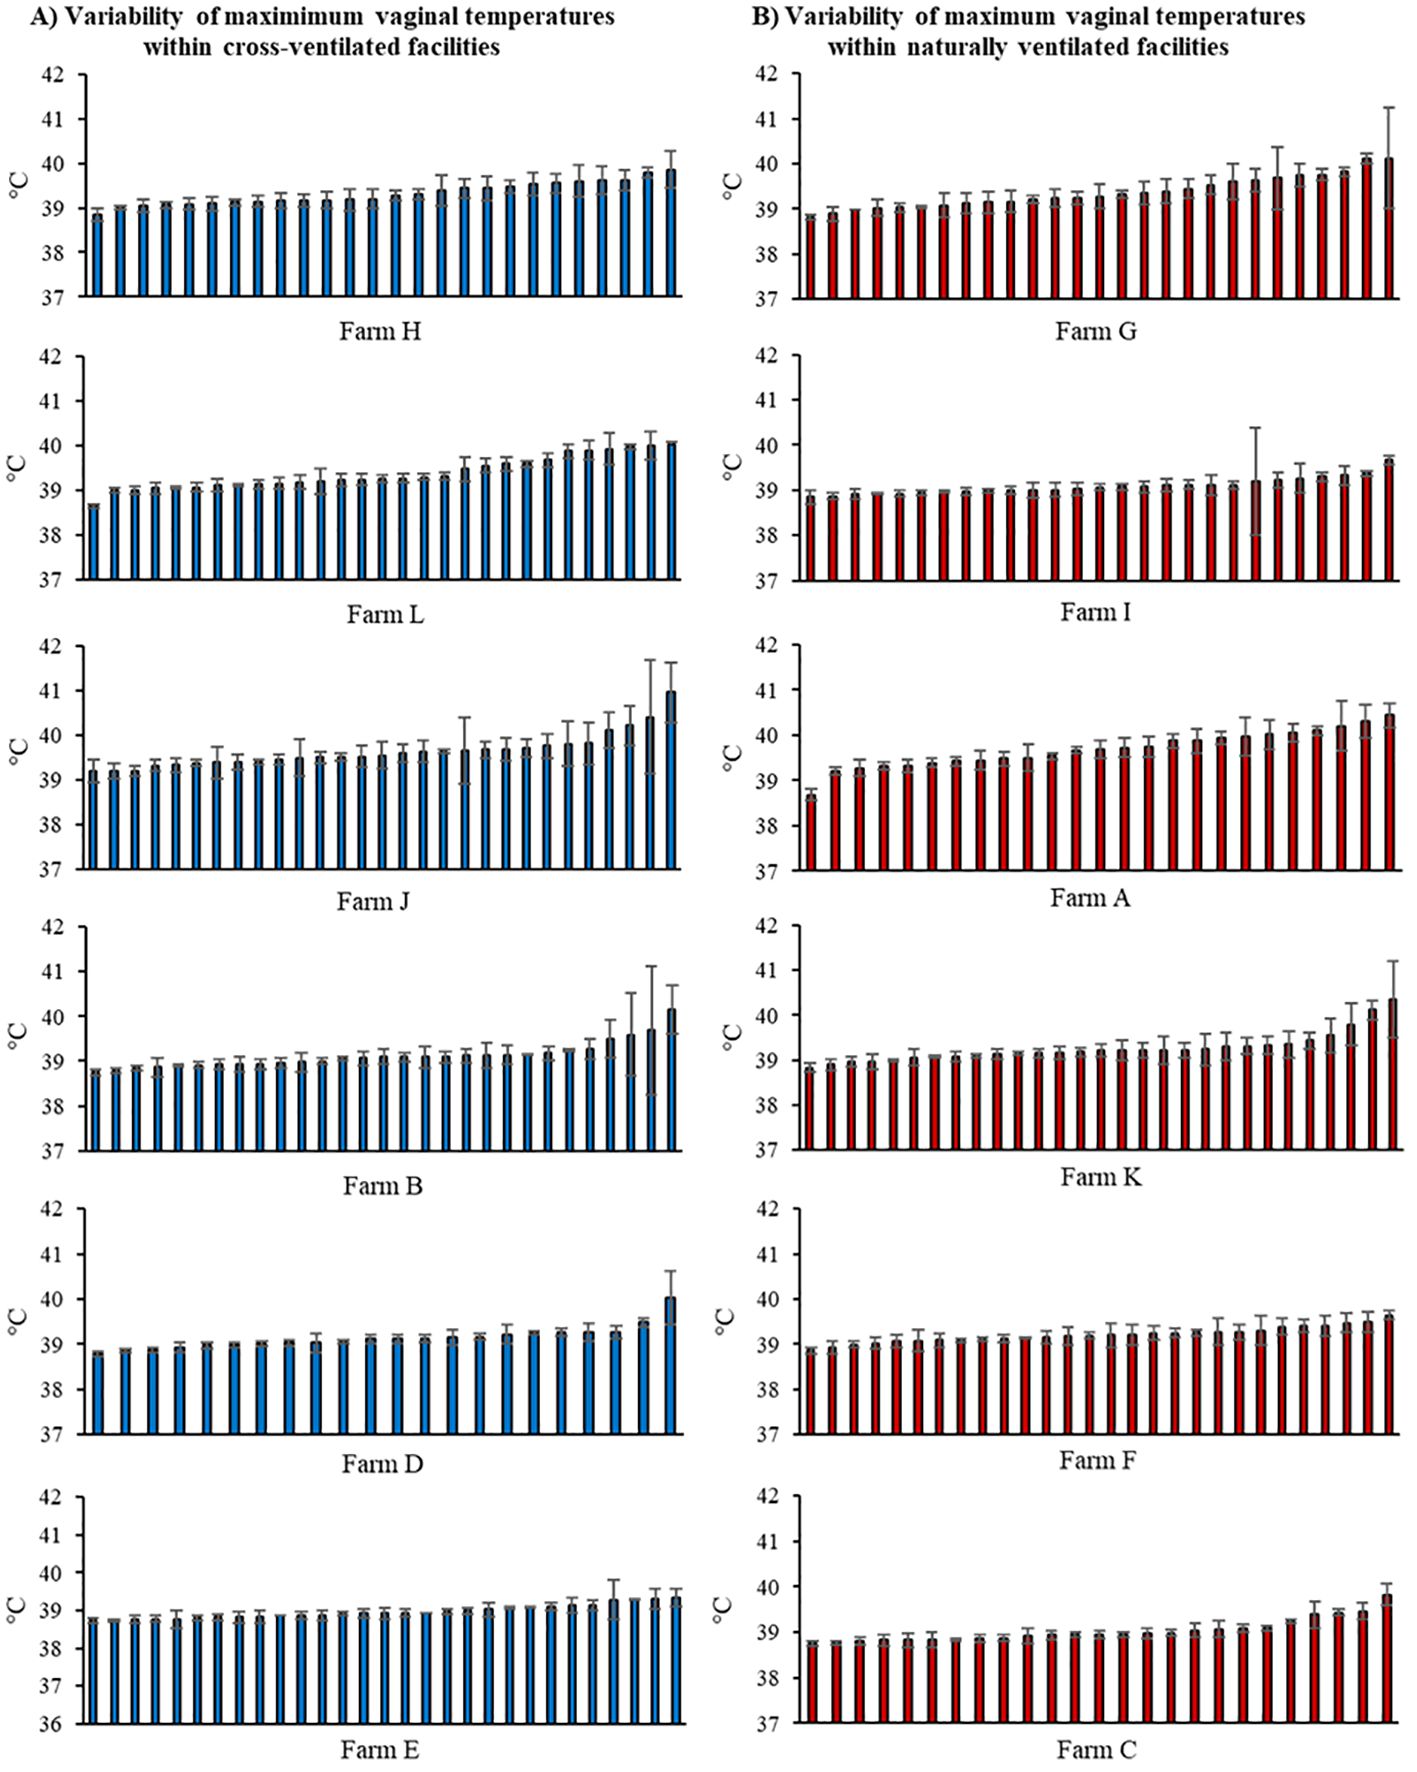
Figure 7. Mean ± SD maximum vaginal temperature (in rank order) recorded on 3 consecutive days for n = 30 high-producing focal cows on each facility: (A) mechanically cross-ventilated (n = 6) and (B) naturally ventilated (n = 6) freestall barns.
4 Discussion
This is the first study to characterize stall air speeds using a novel assessment method on commercial dairy farms and to evaluate how this factor relates to cow-based measurements such as vaginal temperature and resting behavior. We found evidence to support findings from our previous controlled experiment (Reuscher et al., 2023): in facilities with greater air speeds at cow resting height (0.5 m), we observed a reduction in the number of daily lying bouts. In addition, as the within-facility variability in the air speeds among stalls increased, the variability in the total hours cows spent lying down per day increased, driven by greater variability in both the number of bouts and the duration per lying bout. Furthermore, when accounting for within-facility variability in air speeds among stalls, as the average air speeds increased, the variability in the total hours cows spent lying down decreased. Together, these findings support a practical implication that consistent, high air speeds in the freestall area are associated with improved consistency of resting behavior among dairy cows. Further research is warranted on a larger, more representative sample of farms to replicate these novel results.
4.1 Effects of pen microclimate and stall microenvironment on cow responses
Our results from this sample of commercial farms support our previous experimental work demonstrating that the resting behavior of dairy cows under heat stress conditions is affected by air speeds at cows’ resting height. As the average facility air speed increased, the number of lying bouts decreased. In our previous controlled study performed at a research facility, we found that when fans provided the MCAS of ≥1 m/s at cow resting height in the stalls (Mondaca, 2019), cows had approximately one fewer lying bout per day – but greater total daily lying time (by approximately 1 h/d) – compared to when fans were turned off (Reuscher et al., 2023). In a previous experiment by another group, fans alone did not influence the number of cows lying in the freestalls; however, this was likely because the fans delivered air speeds of only 0.8 m/s at cow resting height (Frazzi et al., 2000), which is below the MCAS.
In the current study, no effect of average air speed was seen on the daily lying times across facilities. We speculate that no relationship was detected because both lying times and air speeds were relatively high among the facilities we sampled. Overall, on average, cows in the study spent at least 12 h/d lying down, regardless of barn ventilation type. This is greater than typically reported in freestall facilities under heat stress conditions (Cook et al., 2007: 7.9 to 9.1 h/d; Nordlund et al., 2019: 9.5 h/d). With one exception, the average air speed in the facilities in our sample exceeded the MCAS at cow resting height; one naturally ventilated facility had a borderline average air speed of 0.9 m/s. However, our relatively small sample size of 12 facilities could be an alternative explanation for why we did not detect an effect. In addition, we enrolled farms that used deep bedding (11 with sand, one with manure solids), which may have contributed to the relatively long lying times we observed. Bedding depth, quality, and maintenance are important factors affecting cows’ resting behavior (Tucker et al., 2003; Drissler et al., 2005). Further research is merited to examine how these factors interact with heat stress and heat abatement to affect lying time.
In our previous controlled experiment, we calibrated the fans to ensure all stalls had air speeds ≥1 m/s at cow resting height. In the current study, the ventilation systems were not calibrated before the observational experiment began. Although the mean facility air speeds were almost all greater than the MCAS, the measurements within facilities varied among stalls, with over 16% and 38% of stalls in cross- and naturally ventilated facilities, respectively, having air speeds < 1 m/s. We found that, as the within-facility variation in air speed at cow resting height increased, the variation in lying times among focal cows also increased. Additionally, as the average facility air speed increased, the variation in lying times decreased. These results indicate that consistent, high air speeds among stalls at cow resting height impacts the consistency of the cows’ daily resting behavior. The inter-cow variation in lying times was driven by variation in both the number and duration of lying bouts, which showed similar patterns in response to inter-stall variability in air speeds. In stalls with lower air speeds, we expect that cows likely laid down for shorter bouts and stood up more frequently to dissipate the heat accumulated while resting (Atkins et al., 2018; Nordlund et al., 2019); however, direct stall use observations were not possible in the current study, and this topic represents an opportunity for future research.
Finally, although maximum daily vaginal temperature increased with maximum daily THI, we did not detect effects of air speed, whether considering facility means or SD, on vaginal temperature. In contrast, previous studies examining convective cooling found reductions in vaginal temperature (Aii et al., 1987; Frazzi et al., 2000; Reuscher et al., 2023). Although all cows in our study were provided heat abatement per the farms’ management, on average, the cows in the study had vaginal temperature values 0.1°C above the normal physiological range, regardless of facility type (Merck Veterinary Manual, 2012). In more than 27% of the measurements across both facility types, cows had daily maximum vaginal temperatures ≥ 39.4°C. This descriptive pattern suggests that facilities of both ventilation system types in our sample had the potential to improve how well they kept their cows cool during summer, either by improving the inter-stall consistency of air speeds, through additional supplemental heat abatement strategies, or potentially through breeding strategies targeting resilience to heat stress (Carabaño et al., 2017). In our previous controlled experiment in the same Wisconsin climate, maximum vaginal temperature stayed within the normal physiological range and was, on average, 0.5°C cooler when cows were provided calibrated fans compared to shade alone (Reuscher et al., 2023). However, our sample size may have also limited our ability to detect an effect.
4.2 Extension-outreach efforts
Creating an assessment protocol for the dairy industry and delivering benchmarking data and proposed solutions to farms could potentially improve ventilation performance and the cows’ welfare. For cross-ventilated facilities, some recommendations we provided included suggestions to reposition baffles or remove evaporative cooling pads at the barn inlet to increase air entry speeds. For those facilities, we included comparisons of the current estimated operating costs (on a per-stall basis) for all six facilities. Our recommendations for naturally ventilated facilities included adjusting fan angles and/or spacing to improve where the cone of air flow pointed, and the addition of fans where none were present (e.g., along the outside row of stalls). One of the farms with a cross-ventilated facility used in the original development of the assessment method (Mondaca et al., 2019) implemented a solution proposed in the original report they received. This farm participated again in the current study, and the air speeds at cow resting height improved from an average of 0.5 m/s to 1.8 m/s, demonstrating how report data can help farmers understand key issues (as in benchmarking the growth performance of calves; Atkinson et al., 2017). This benchmarking process has been found to help farmers to make an informed decision about their specific situation and feel empowered to enforce management changes (Sumner et al., 2018).
Members of our research team founded The Dairyland Initiative, an outreach program at the University of Wisconsin School of Veterinary Medicine. This program has hosted training online and in person on ventilation assessment methodologies for over 280 participants since 2017. The program’s website (https://thedairylandinitiative.vetmed.wisc.edu/), which provides an overview of dairy barn ventilation, has had over 9,600 unique page views since 2020. These engagement metrics indicate that many dairy industry stakeholders seek information on evaluating barn ventilation systems. In addition, our group is contacted about the ventilation assessment methodology (previously reported by Mondaca et al., 2019) at least eight times a year by farms. However, our staff has the capacity to provide on-farm consulting to only half of the requests. The high demand for information on and services for troubleshooting or improving barn ventilation systems demonstrates the need to disseminate this knowledge to the wider dairy industry.
Therefore, our updated assessment methods, including report creation, were incorporated into hands-on ventilation assessment workshops in the summer of 2022 to transfer knowledge to 43 dairy industry professionals. The four workshops were hosted by three Wisconsin farms, each with both naturally and cross-ventilated barns onsite, which had participated in the study the previous summer. In the morning classroom sessions, participants learned about key ventilation criteria, including considerations relating to the cost of installing and operating different system designs, understanding THI, and assessing short-term animal-based measures of heat stress (i.e., panting and respiration rate). The afternoon sessions consisted of hands-on demonstrations and practice assessing air speeds in both naturally and cross-ventilated facilities and recording respiration rates on a sample of cows. After the hands-on portion, the workshop concluded with a discussion of the assessments conducted on the 12 facilities reported in the current study and how these findings were compiled into the reports for the farmers. The professional roles of the participants included extension educators, bovine veterinary practitioners, nutritionists, and sales consultants, all of whom work directly with dairy farmers to provide support and troubleshooting for dairy cattle housing and management. Empowering professionals in the dairy industry to systematically assess ventilation systems, interpret cow-based indicators of heat stress, and create feedback reports will allow for greater dispersal of knowledge to U.S. dairy farmers and for continued improvements in facility ventilation and cow welfare. Future work is warranted to evaluate the spread and improvement in knowledge among U.S. dairy stakeholders, as well as the implementation of – or barriers to adoption of (such as financial cost) – more effective facility ventilation and downstream impacts on cow welfare and productivity.
4.3 Conclusions
In total, 11 freestall facilities, with the exception of one naturally ventilated one, provided average air speeds above the recommended minimum cooling air speed of ≥1 m/s at cow resting height in the stalls. Furthermore, the average lying time among cows in all 12 facilities was ≥12 h/d, which is greater than reported in previous studies in heat stress conditions. Nonetheless, many individual cows had shorter lying times, and many individual stalls had insufficient air speeds. Greater variation in air speeds among stalls within a facility was associated with greater variation in cows’ lying times, driven by greater variability in both the number and duration of lying bouts; however, greater average air speeds reduced this variability. These findings reinforce the importance of providing consistent, sufficiently high air speeds across the resting area to obtain the best results from heat abatement systems and promote cow comfort. The knowledge of how to systematically assess ventilation is of great interest to the dairy industry, and we have continued to refine our methodology while sharing the assessment process with other dairy industry professionals.
Data availability statement
The raw data supporting the conclusions of this article will be made available by the authors, without undue reservation.
Ethics statement
The animal studies were approved by University of Wisconsin-Madison Institutional Animal Care and Use Committee. The studies were conducted in accordance with the local legislation and institutional requirements. Written informed consent was not obtained from the owners for the participation of their animals in this study because verbal consent was obtained from the farm owners to conduct an observational study on their facilities.
Author contributions
KR: Data curation, Formal analysis, Investigation, Software, Validation, Visualization, Writing – original draft. NC: Conceptualization, Data curation, Formal analysis, Funding acquisition, Investigation, Methodology, Resources, Software, Supervision, Visualization, Writing – review & editing. CH: Investigation, Visualization, Writing – review & editing. MM: Conceptualization, Methodology, Visualization, Writing – review & editing. JVO: Conceptualization, Data curation, Funding acquisition, Methodology, Project administration, Resources, Software, Supervision, Validation, Visualization, Writing – review & editing.
Funding
The author(s) declare financial support was received for the research, authorship, and/or publication of this article. This work is supported by the USDA National Institute of Food and Agriculture, Agriculture and Food Research Initiative, Critical Agricultural Research and Extension project 1019684. We thank Zinpro for a generous unrestricted gift that provided additional salary support for Summer Henschel and Alexis Payette and a gift-in-kind of a portable weather station. We also appreciate the gifts-in-kind of propeller anemometers and hormone-free controlled drug release inserts from Nielsen-Kellerman and Zoetis, respectively.
Acknowledgments
The authors are grateful to the participating farms. We also appreciate the efforts of Summer Henschel, Alexis Payette, and Kiara Twumasi who assisted with data collection, Tadeu da Silva for his helpful suggestions on statistical analysis, and Tom Bennett for processing the resting behavior data. We gratefully acknowledge the infrastructure support of the UW-Madison Department of Animal and Dairy Science (College of Agricultural and Life Sciences) and the Department of Food Animal Production Medicine (School of Veterinary Medicine).
Conflict of interest
The authors declare that the research was conducted in the absence of any commercial or financial relationships that could be construed as a potential conflict of interest.
Publisher’s note
All claims expressed in this article are solely those of the authors and do not necessarily represent those of their affiliated organizations, or those of the publisher, the editors and the reviewers. Any product that may be evaluated in this article, or claim that may be made by its manufacturer, is not guaranteed or endorsed by the publisher.
Supplementary material
The Supplementary Material for this article can be found online at: https://www.frontiersin.org/articles/10.3389/fanim.2024.1422937/full#supplementary-material
References
Aii T., Takahashi S., Kurihara M., Kume S. (1987). Effect of an evaporative cooling procedure on the physiological responses of lactating dairy cows in a hot, humid climate. Japanese J. Zootechnical Sci. 58, 790–796.
Allen J. D., Hall L. W., Collier R. J., Smith J. F. (2015). Effect of core body temperature, time of day, and climate conditions on behavioral patterns of lactating dairy cows experiencing mild to moderate heat stress. J. Dairy Sci. 98, 118–127. doi: 10.3168/jds.2013-7704
Anand G., Kodali R. (2008). Benchmarking the benchmarking models. Benchmarking 15, 257–291. doi: 10.1108/14635770810876593
Atkins I. K., Cook N. B., Mondaca M. R., Choi C. Y. (2018). Continuous respiration rate measurement of heat-stressed dairy cows and relation to environment, body temperature, and lying time. Trans. ASABE 61, 1475–1485. doi: 10.13031/trans.12451
Atkinson D. J., von Keyserlingk M. A. G., Weary D. M. (2017). Benchmarking passive transfer of immunity and growth in dairy calves. J. Dairy Sci. 100, 3773–3782. doi: 10.3168/jds.2016-11800
Baumgard L. H., Rhoads R. P. (2013). Effects of heat stress on postabsorptive metabolism and energetics. Annu. Rev. Anim. Biosci. 1, 311–337. doi: 10.1146/annurev-animal-031412-103644
Bishop-Williams K., Berke O., Pearl D. L., Hand K., Kelton D. F. (2015). Heat stress related dairy cow mortality during heat waves and control periods in rural Southern Ontario from 2010-2012. BMC Vet. Res. 11, 291. doi: 10.1186/s12917-015-0607-2
Carabaño M. J., Ramón M., Díaz C., Molina A., Pérez-Guzmán M. D., Serradilla J. M. (2017). Breeding and genetics symposium: Breeding for resilience to heat stress effects in dairy ruminants. A Compr. review. J. Anim. Sci. 95, 1813–1826. doi: 10.2527/jas.2016.1114
Chapinal N., Weary D. M., Collings L., von Keyserlingk M. A. G. (2014). Lameness and hock injuries improve on farms participating in an assessment program. Vet J. 202, 646–648. doi: 10.1016/j.tvjl.2014.09.018
Chen J. M., Schütz K. E., Tucker C. B. (2013). Dairy cows use and prefer feed bunks fitted with sprinklers. J. Dairy Sci. 96, 5035–5045. doi: 10.3168/jds.2012-6282
Chen J. M., Schütz K. E., Tucker C. B. (2016). Cooling cows efficiently with water spray: Behavioral, physiological, and production responses to sprinklers at the feed bunk. J. Dairy Sci. 99, 4607–4618. doi: 10.3168/jds.2015-10714
Collier R. J., Eley R. M., Sharma A. K., Pereira R. M., Buffington D. E. (1981). Shade management in subtropical environment for milk yield and composition in Holstein and Jersey cows. J. Dairy Sci. 64, 844–849. doi: 10.3168/jds.S0022-0302(81)82656-2
Cook N. B., Banks R. J., Bennett T. B., Burgi K. (2006). “Season associated changes in infectious and claw horn lesions in a free stall housed dairy herd,” in Proc 14th Int Symp Lameness Rum, Colonia del Sacramento, Uruguay. 163–164.
Cook N. B., Mentink R. L., Bennett T. B., Burgi K. (2007). The effect of heat stress and lameness on time budgets of lactating dairy cows. J. Dairy Sci. 90, 1674–1682. doi: 10.3168/jds.2006-634
Cook N. B., Nordlund K. V. (2009). The influence of the environment on dairy cow behavior, claw health and herd lameness dynamics. Vet. J. 179, 360–369. doi: 10.1016/j.tvjl.2007.09.016
Correa-Calderon A., Armstrong D., Ray D., DeNise S., Enns M., Howison C. (2004). Thermoregulatory responses of Holstein and Brown Swiss heat-stressed dairy cows to two different cooling systems. Int. J. Biometeorol. 48, 142–148. doi: 10.1007/s00484-003-0194-y
Drissler M., Gaworski M., Tucker C. B., Weary D. M. (2005). Freestall maintenance: Effects on lying behavior of dairy cattle. J. Dairy Sci. 88, 2381–2387. doi: 10.3168/jds.S0022-0302(05)72916-7
Flamenbaum I., Wolfenson D., Mamen M., Berman A. (1986). Cooling dairy cattle by a combination of sprinkling and forced ventilation and its implementation in the shelter system. J. Dairy Sci. 69, 3140–3147. doi: 10.3168/jds.S0022-0302(86)80778-0
Frazzi E., Calamari L., Calegari F., Stefanini L. (2000). Behavior of dairy cows in response to different barn cooling systems. Trans. ASAE 43, 387–394. doi: 10.13031/2013.2716
Gantner V., Bobic T., Gantner R., Gregic M., Kuterovac K., Novakovic J., et al. (2017). Differences in response to heat stress due to production level and breed of dairy cows. Int. J. Biometeorol. 61, 1675–1685. doi: 10.1007/s00484-017-1348-7
García-Ispierto I., López-Gatius F., Bech-Sabat G., Santolaria P., Yániz J. L., Nogareda C., et al. (2007). Climate factors affecting conception rate of high producing dairy cows in northeastern Spain. Theriogenology 67, 1379–1385. doi: 10.1016/j.theriogenology.2007.02.009
Frazzi E., Calamari L., Calegari F., Stefanini L. (2000). Behavior of dairy cows in response to different barn cooling systems. Trans. ASAE 43, 387–394. doi: 10.13031/2013.2716
Ito K., Weary D. M., von Keyserlingk M. A. G. (2009). Lying behavior: Assessing within- and between- herd variation in free-stall-housed dairy cows. J Dairy Sci 92, 4412–4420. doi: 10.3168/jds.2009-2235
Kelly C. F., Bond T. E. (1971). Bioclimatic factors and their measurement. Washington, D.C.: National Academies Press.
Laporta J., Ferreira F. C., Ouellet V., Dado-Senn B., Almeida A. K., de Vries A., et al. (2020). Late-gestation heat stress impairs daughter and granddaughter lifetime performance. J. Dairy Sci. 103, 7555–7568. doi: 10.3168/jds.2020-18154
Legrand A., Schütz K. E., Tucker C. B. (2011). Using water to cool cattle: Behavioral and physiological changes associated with voluntary use of cow showers. J. Dairy Sci. 94, 3376–3386. doi: 10.3168/jds.2010-3901
Levit H., Pinto S., Amon T., Gershon E., Kleinjan-Elazary A., Bloch V., et al. (2021). Dynamic cooling strategy based on individual animal response mitigated heat stress in dairy cows. Animal 15, 100093. doi: 10.1016/j.animal.2020.100093
Mondaca M. R. (2019). Ventilation systems for adult dairy cattle. Veterinary Clinics North America - Food Anim. Pract. 35, 139–156. doi: 10.1016/j.cvfa.2018.10.006
Mondaca M., Van Os J., Cook N. B. (2019). A standardized method for characterizing ventilation in freestall dairy facilities. J. Dairy Sci. 102 (Suppl. 1), 200.
Morton J. M., Tranter W. P., Mayer D. G., Jonsson N. N. (2007). Effects of environmental heat on conception rates in lactating dairy cows: Critical periods of exposure. J. Dairy Sci. 90, 2271–2278. doi: 10.3168/jds.2006-574
NOAA National Centers for Environmental Information (2024). Monthly Global Climate Report for Annual 2023. Washington, DC. Available online at: https://www.ncei.noaa.gov/access/monitoring/monthly-report/global/202313 (Accessed August 2, 2024).
Nordlund K. V., Strassburg P., Bennett T. B., Oetzel G. R., Cook N. B. (2019). Thermodynamics of standing and lying behavior in lactating dairy cows in freestall and parlor holding pens during conditions of heat stress. J. Dairy Sci. 102, 6495–6507. doi: 10.3168/jds.2018-15891
Ortiz X. A., Smith J. F., Rojano F., Choi C. Y., Bruer J., Steele T., et al. (2015). Evaluation of conductive cooling of lactating dairy cows under controlled environmental conditions. J. Dairy Sci. 98, 1759–1771. doi: 10.3168/jds.2014-8583
Overton M. W., Sischo W. M., Temple G. D., Moore D. A. (2002). Using time-lapse video photography to assess dairy cattle lying behavior in a free-stall barn. J. Dairy Sci. 85, 2407–2413. doi: 10.3168/jds.S0022-0302(02)74323-3
Polsky L., von Keyserlingk M. A. G. (2017). Invited review: Effects of heat stress on dairy cattle welfare. J. Dairy Sci. 100, 8645–8657. doi: 10.3168/jds.2017-12651
Reuscher K. J., Cook N. B., da Silva T. E., Mondaca M. R., Luchterhand K. M., Van Os J. M. C. (2023). Effect of different air speeds at cow resting height in freestalls on heat stress responses and resting behavior in lactating cows in Wisconsin. J. Dairy Sci. 106, 6552–9567. doi: 10.3168/jds.2023-23364
Sanders A. H., Shearer J. K., De Vries A. (2009). Seasonal incidence of lameness and risk factors associated with thin soles, white line disease, ulcers, and sole punctures in dairy cattle. J. Dairy Sci. 92, 3165–3174. doi: 10.3168/jds.2008-1799
Schüller L. K., Burfeind O., Heuwieser W. (2014). Impact of heat stress on conception rate of dairy cows in the moderate climate considering different temperature-humidity index thresholds, periods relative to breeding, and heat load indices. Theriogenology 81, 1050–1057. doi: 10.1016/j.theriogenology.2014.01.029
Schütz K. E., Rogers A. R., Cox N. R., Webster J. R., Tucker C. B. (2011). Dairy cattle prefer shade over sprinklers: Effects on behavior and physiology. J. Dairy Sci. 94, 273–283. doi: 10.3168/jds.2010-3608
Spiers D. E., Spain J. N., Sampson J. D., Rhoads R. P. (2004). Use of physiological parameters to predict milk yield and feed intake in heat-stressed dairy cows. J. Thermal Biol. 29, 759–764. doi: 10.1016/j.jtherbio.2004.08.051
St-Pierre N. R., Cobanov B., Schnitkey G. (2003). Economic losses from heat stress by US livestock industries1. J. Dairy Sci. 86, 52–77. doi: 10.3168/jds.S0022-0302(03)74040-5
Strickland J. T., Bucklin R. A., Nordstedt R. A., Beede D. K., Bray D. R., Member A., et al. (1989). Sprinkler and fan cooling system for dairy cows in hot, humid climates. Appl. Eng. Agric. 5, 231–236. doi: 10.13031/2013.26507
Sumner C. L., von Keyserlingk M. A. G., Weary D. M. (2018). How benchmarking motivates farmers to improve dairy calf management. J. Dairy Sci. 101, 3323–3333. doi: 10.3168/jds.2017-13596
Tao S., Orellana Rivas R. M., Marins T. N., Chen Y. C., Gao J., Bernard J. K. (2020). Impact of heat stress on lactational performance of dairy cows. Theriogenology 150, 437–444. doi: 10.1016/j.theriogenology.2020.02.048
Tucker C. B., Jensen M. B., de Passillé A. M., Hänninen L., Rushen J. (2021). Invited review: Lying time and the welfare of dairy cows. J. Dairy Sci. 104, 20–46. doi: 10.3168/jds.2019-18074
Tucker C. B., Weary D. M., Fraser D. (2003). Effects of three types of free-stall surfaces on preferences and stall usage by dairy cows. J. Dairy Sci. 86, 521–529. doi: 10.3168/jds.S0022-0302(03)73630-3
USDA (2021). Dairy 2014: Trends in dairy cattle health and management practices in the United States 1991-2014. USDA-APHIS-VS-CEAH. Fort Collins. Available online at: https://www.aphis.usda.gov/sites/default/files/dairy-trends-hlth-mngmnt-1991-2014.pdf (Accessed August 2, 2024).
Vitali A., Felici A., Esposito S., Bernabucci U., Bertochhi L., Maresca C., et al. (2015). The effect of heat waves on dairy cow mortality. J. Dairy Sci. 98, 4572–4579. doi: 10.3168/jds.2015-9331
West J. W. (2003). Effects of heat-stress on production in dairy cattle. J. Dairy Sci. 86, 2131–2144. doi: 10.3168/jds.S0022-0302(03)73803-X
Keywords: mechanical ventilation, air speed, air speed distribution, heat stress, microclimate, facility assessment, dairy cattle, dairy cattle barns
Citation: Reuscher KJ, Cook NB, Halbach CE, Mondaca MR and Van Os JMC (2024) Consistent stall air speeds in commercial dairy farms are associated with less variability in cow lying times. Front. Anim. Sci. 5:1422937. doi: 10.3389/fanim.2024.1422937
Received: 24 April 2024; Accepted: 22 July 2024;
Published: 09 August 2024.
Edited by:
Mohan Mondal, ICAR-National Dairy Research Institute, IndiaReviewed by:
Naceur M’Hamdi, National Agricultural Institute of Tunisia, TunisiaNicola Lacetera, University of Tuscia, Italy
Copyright © 2024 Reuscher, Cook, Halbach, Mondaca and Van Os. This is an open-access article distributed under the terms of the Creative Commons Attribution License (CC BY). The use, distribution or reproduction in other forums is permitted, provided the original author(s) and the copyright owner(s) are credited and that the original publication in this journal is cited, in accordance with accepted academic practice. No use, distribution or reproduction is permitted which does not comply with these terms.
*Correspondence: Jennifer M. C. Van Os, anZhbm9zQHdpc2MuZWR1
†Present addresses: Kimberly J. Reuscher, Department of Food and Animal Sciences, Tennessee State University, Nashville, TN, United States
Mario R. Mondaca, VES-Artex, Chippewa Falls, WI, United States
 Kimberly J. Reuscher1†
 Jennifer M. C. Van Os