 Tesfaye Feyisa
 Adugna Tolera1
 Ajebu Nurfeta
 Mulubrhan Balehegn
 Adegbola Adesogan
- 1School of Animal and Range Sciences, Hawassa University, Hawassa, Ethiopia
- 2Department of Animal Science, Wolkite University, Wolkite, Ethiopia
- 3Feed the Future Innovation Lab for Livestock Systems, University of Florida, Gainesville, FL, United States
Livestock production is a major contributor to the national economy in Ethiopia, of which ruminants, particularly cattle, are the dominant and most important livestock species. Limited supply of quality feeds is a major constraint to the improvement of livestock production in Ethiopia. The expansion of agro-industries in Ethiopia, over the last three decades, has created an opportunity for an increased supply of agro-industrial byproducts as a source of feed for livestock. This study was conducted to assess the availability, distribution, and quality of agro-industrial byproducts and compound feeds in Ethiopia. About 310 flour mill factories, 194 oil factories, 13 brewery factories, 7 sugar factories, 4 malt factories, 2 meat and bone meal processing plants, 8 limestone factories, and 112 feed processing plants were surveyed to assess the availability and distributions of agro-industrial byproducts and compound feeds. A total of 757 feed samples were collected for evaluating nutritional values. The annual production of agro-industrial byproducts ranges from 18,065 tons DM/year (abattoir byproducts) to 3,092,035 tons DM/year (malt byproducts) and the total annual production of the different agro-industrial by-products amounts to 5,245,854 tons DM. The annual production of compound feeds was reported to be 5,812,608 tons DM. All agro-industries are processing under their capacity, ranging from 11.7% in sugar factories to 93% in breweries. Shortage and seasonal fluctuation of supply of raw materials (34.8%), high price and price fluctuations of raw materials (17.5%) and electric power interruptions (17.5%) were the major challenges faced by different agro-industries. The crude protein (CP) concentrations of agro-industrial byproducts ranges from 6.2% in maize grain screening to 15.9% in wheat bran for flour mill byproducts; 28% in cotton seed cake to 49.7% in groundnut cake for oilseed cakes and 14.8% in areqe atela to 24.8% in brewery spent grains for brewery and local distillery byproducts. High protein or energy contents of agro-industrial byproducts indicated their potential to be utilized in intensive livestock rations. Thus, it is necessary to create enabling conditions to allow the existing agro-industries to operate at full capacity and to attract new ones into the business to boost the production and availability of agro-industrial byproducts needed as main inputs to manufacture compound feeds.
1 Introduction
Livestock production is a major contributor to the national economy in Ethiopia, of which ruminants, particularly cattle, are the dominant and most important livestock species. This is because cattle contribute about 45 percent to the value added of agriculture (FAO, 2018a). However, limited supply of quality feed is the major constraint to improving livestock productivity. Most of the available feeds are dominated by crop residues and low-quality natural pastures that cannot meet the nutrient requirements of the country’s livestock population (Tolera, 2007). Under such conditions, it is difficult to meet the nutrient requirement of animals for production and reproduction without protein and energy supplementation. The expansion of agro-industries in the last three decades has provided an opportunity for increasing the supply of agro-industrial byproducts, which can be used as a supplement to low-quality feeds. High nutritive value and availability during most of the year make agro-industrial byproducts good supplements for livestock. However, information on the current scale of production and nutritive quality of agro-industrial byproducts and compound feeds at the national level are scanty, given that only a limited number of assessments have been made (Tolera, 2007; Tegegne and Assefa, 2010; Tesfay, 2010; Feyissa et al., 2015; FAO, 2018b). However, all the previous assessments were limited either in area coverage or scope.
The current study envisages building on what has already been done with a particular focus on filling the missing gaps in the previous assessments to provide a complete national picture of feed resource availability, distribution, and quality. Moreover, the quantities and qualities of agro-industrial byproducts change periodically as they are influenced by different factors (Makkar and Ankers, 2014). According to CSA (2017), there were around 300 flour mill factories in Ethiopia in 2017. Currently, there are 310 flour mill factories in the country excluding those in Tigray and parts of the Amhara region, which were inaccessible due to insecurity. Feyissa et al. (2015) also reported that the qualities of feed resources are highly dynamic and subject to variations depending on the type of raw material, processing method, season, handling, storage, transportation, and utilization. Hence, up-to-date information is needed regarding the availability, distribution, and nutritional quality of agro-industrial byproducts and compound feeds. Assessing the availability and nutritive value of feed resources at the national level is critical for planning the optimal utilization and distribution of available feed resources (Makkar and Ankers, 2014). This survey was, therefore, undertaken to assess the availability, distribution, and quality of agro-industrial byproducts and compound feeds in Ethiopia.
2 Materials and methods
2.1 Study areas
This was a country-wide survey to assess the availability, distribution and quality of various agro-industrial byproducts of flour mills, oil factories, breweries, sugar factories, malt factories, and abattoirs. The assessments were conducted all over the country by interviewing representative of the agro-industries except in Tigray and northern parts of the Amhara regions, which could not accessed due to security problems. Production and nutritional quality of the byproduct of home distilled alcoholic liquor (areqe atela) was assessed in Arsi Negelle in West Arsi zone of Oromia Region and in Debre Birhan town in North Shewa zone of Amhara region because of the high potential of the two locations to meet the national demand for areqe atela production.
2.2 Availability and distribution assessment procedures
Different agro-industries that produce agro-industrial by-products used as feed ingredients were assessed from 2019 to 2021. Accordingly, about 310 flour mills, 194 oil factories, 13 breweries, 7 sugar factories, 4 malt factories, 2 meat and bone processing abattoirs, 8 limestone factories and 112 feed processing plants were surveyed. The number, location, production capacity, actual production performance, raw materials utilized and constraints faced by the agro-industries were assessed. For this purpose, all available agro-industries were visited and the manager or focal person of each agro-industry was interviewed.
The average percentage increase in the production of flour mill byproducts for Oromia and SNNPR since the FAO (2018b) report was used to estimate the percent of increase in flour mill byproducts in the Amhara region due to similarities among these regions. The total production of flour mill byproducts in the Amhara region was estimated by adding the latter increase to the value reported in the FAO (2018b) report. Similarly, the percentage increase in the Oromia region was used to estimate the current production of oilseed seed cakes in the Amhara region. The data in the FAO (2018b) report for the Tigray region for the production of flour mill byproducts and oilseed cakes was used as is. The Bediye (2017) report was used for the production of compound feeds in the Tigray region due to the unavailability of recorded data after 2017/18, and the difficulty of assessing the region due to security problems. The annual production of areqe atela in Arsi Negelle and Debre Birhan towns was assessed by interviewing 377 and 102 areqe producers, respectively. The total areqe atela production in each town was estimated by multiplying the average annual actual atela production per household with the total number of households engaged in distilling the liquor.
2.3 Feed quality assessment
2.3.1 Feed sample collection and preparation
Samples of agro-industrial byproducts and compound feeds were collected from the surveyed agro-industries and feed processing plants. A total of 757 feed samples (361 flour mill by-products, 124 oilseed cakes, 61 brewery and local distillery by-products, 22 sugarcane factory byproducts, 6 malt byproducts, 1 meat and bone meal, and 182 compound feeds) were collected for determination of chemical composition and in-vitro digestibility. The collected feed samples were sub-sampled, oven-dried at 60°C for 48h, ground to pass through a 1 mm mesh sieve, packed in airtight clean plastic bags and stored until analysis.
2.3.2 Chemical analysis
Chemical analyses of feed samples were conducted at the Animal Nutrition Laboratory of International Livestock Research Institute (ILRI) in Addis Ababa, Ethiopia. The near-infrared reflectance spectrophotometry (NIRS) was used to scan the feed samples to determine the dry matter (DM), crude protein (CP), ash, neutral detergent fiber (NDF), acid detergent fiber (ADF), acid detergent lignin (ADL), metabolizable energy (ME) and in-vitro organic matter digestibility (IVOMD) of the samples using predictive equations developed for agro-industrial byproducts and compound feeds. The NIRS instrument used was Foss 5000 forage analyzer with software package Win ISI II in a spectral range of 1108 to 2492 nm (Win Scan version 1.5, 2000, intrasoft international, L.L.C, Luxembourg). General mixed feed model was used to predict the chemical composition, IVOMD and ME content of the feed samples. Calibration equations were evaluated by using coefficient of determination (R2), standard error of calibration (SEC), and standard error of prediction (SEP).
2.4 Data analysis
Descriptive statistics such as mean, percentage and standard deviations were used for the availability and distributions of agro-industrial byproducts and compound feeds while the chemical composition and in-vitro organic matter digestibility data were analyzed using analysis of variance (ANOVA) procedures of R programming software package (R i386) version 3.4.2. To compare differences among flour mill byproducts (i = 1, 2,…, 6); oilseed cakes (i = 1, 2,…, 9); brewery and local distillery byproducts (i = 1, 2,…, 4); sugar factory byproducts (i = 1, 2, 3); malt byproducts (i = 1, 2, 3), and compound feeds (i = 1, 2,…,15), one-way ANOVA was used with the following model: Yij = μ + Di + eij. Where; Yij = dependent variable; μ = the overall mean; Di = effect of differences in flour mill byproducts/oilseed cakes/brewery and local distillery byproducts/sugar factory byproducts/malt byproducts or effect of differences in compound feeds; eij = random error. Tukey’s test was used to compare differences between means. Differences between means were declared significant at P ≤0.05.
3 Results
3.1 Annual production and distribution of agro-industrial byproducts and compound feeds in Ethiopia
3.1.1 Flour mill byproducts
Annual production and distributions of flour mill byproducts are shown in Table 1. Annually, 918,648 tons DM of flour mill byproducts were produced with the highest production being in Oromia followed by SNNPR and Addis Ababa city administration. In contrast, the lowest production of flour mill byproducts was observed in Gambella followed by Harari and Benishangul Gumuz. There was no flour factory in the Afar region and hence no flour mill byproducts were reported in the region during the study. The flour factories were processing at 52.4 ± 14.9% of their capacity on average. Among the flour mill byproducts, the annual production of wheat bran was the highest followed by wheat grain screenings and wheat shorts. However, the lowest annual production was recorded for the maize grain screenings followed by oat bran and maize shorts.
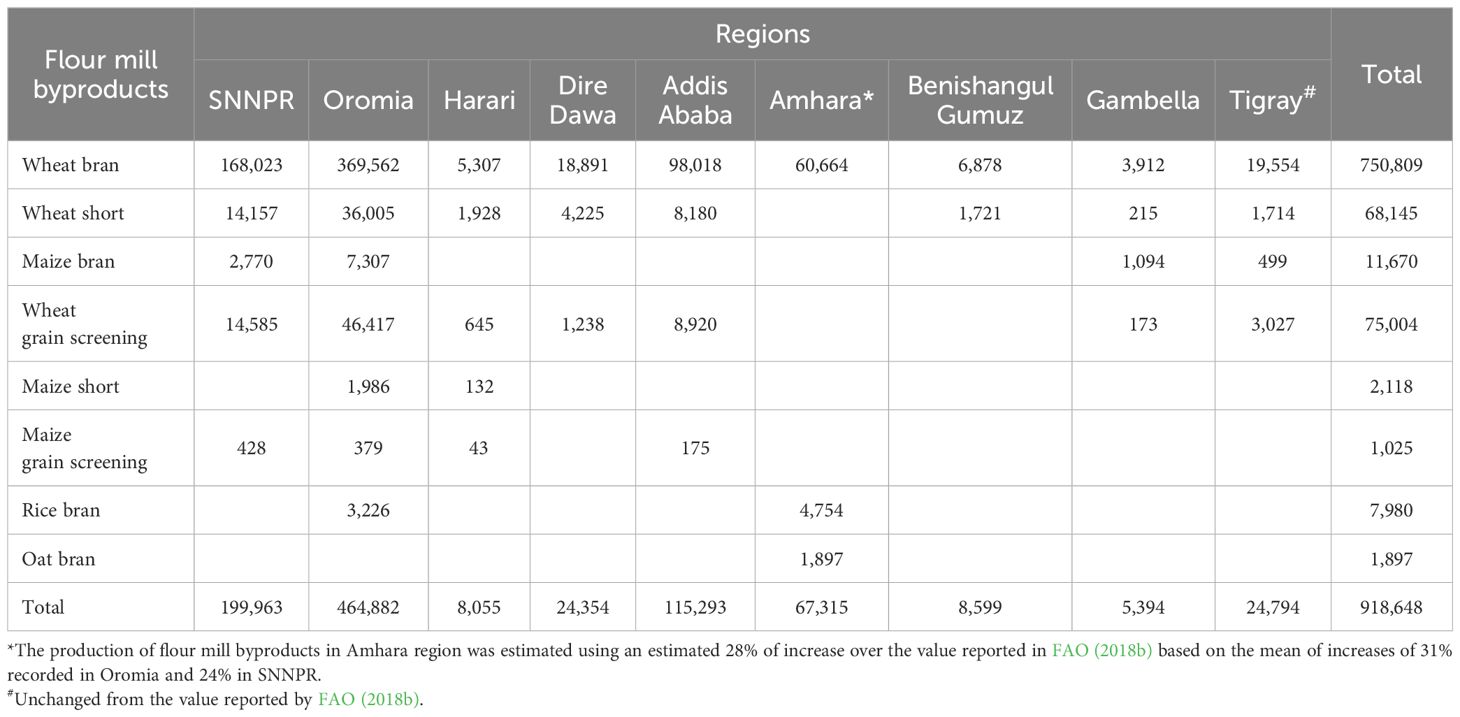
Table 1 Annual production and distribution of flour mill byproducts in Ethiopia by region (tons DM/year).
3.1.2 Oilseed cakes
The annual production of oilseed cakes was 345,974 tons DM with the greatest annual production being in Oromia followed by Amhara and Tigray regions (Table 2). In contrast, the lowest annual production of oilseed cakes was observed in SNNPR followed by Benishangul Gumuz and Harari regions. There was no oil factory in the Afar region hence there is no any oilseed cake production. The oil factories reported that they are processing at 43.2 ± 28.7% of their capacity on average. The annual production of noug (Niger) seed cake was the highest followed by cotton seed cake and soybean seed cake. In contrast, the annual production of rape seed cake was the lowest followed by sunflower seed cake and linseed cake.
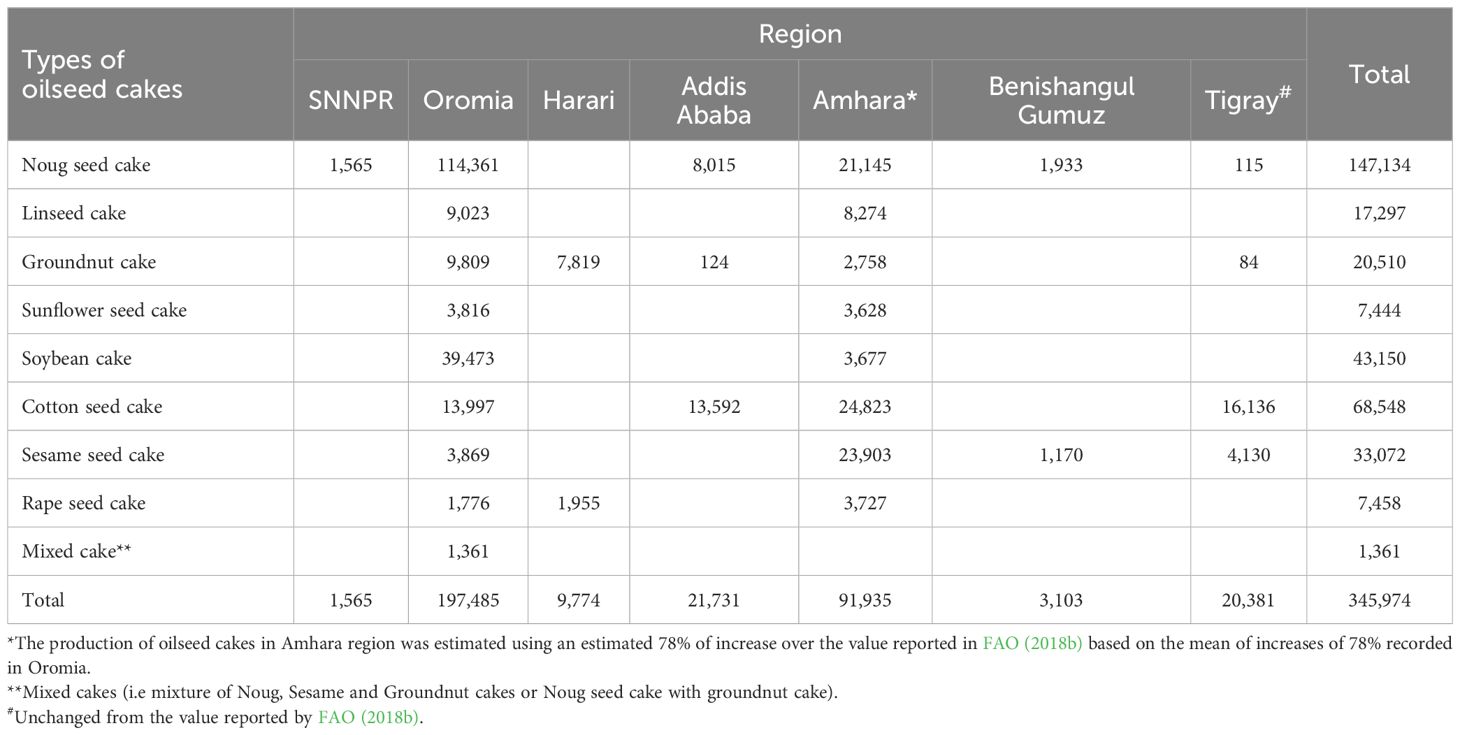
Table 2 Annual production and distribution of oilseed cakes in Ethiopia by region (tons DM/year).
3.1.3 Brewery and distillery byproducts
Annually, 57,695 tons DM of brewery-spent grains and 8,767 tons DM of brewery-spent yeast were produced during the study period (Table 3). The annual production of areqe atela was 88,214 tons DM in Arsi Negelle (78,959 tons DM) and in Debre Birhan (9,255 tons DM) towns only, indicating the high potential production of the local distilleries in the area. The annual production of brewery byproducts (both brewery-spent grains and brewery-spent yeast) in the Amhara region was the highest followed by Oromia and Addis Ababa city administration. However, it was the lowest in the Harari region followed by Tigray and SNNPR regions. The brewery factories reported that they are processing at 93 ± 8.1% of their capacity while the local distilleries indicated that they are processing at 63.6 ± 22.5% of their capacity on average.
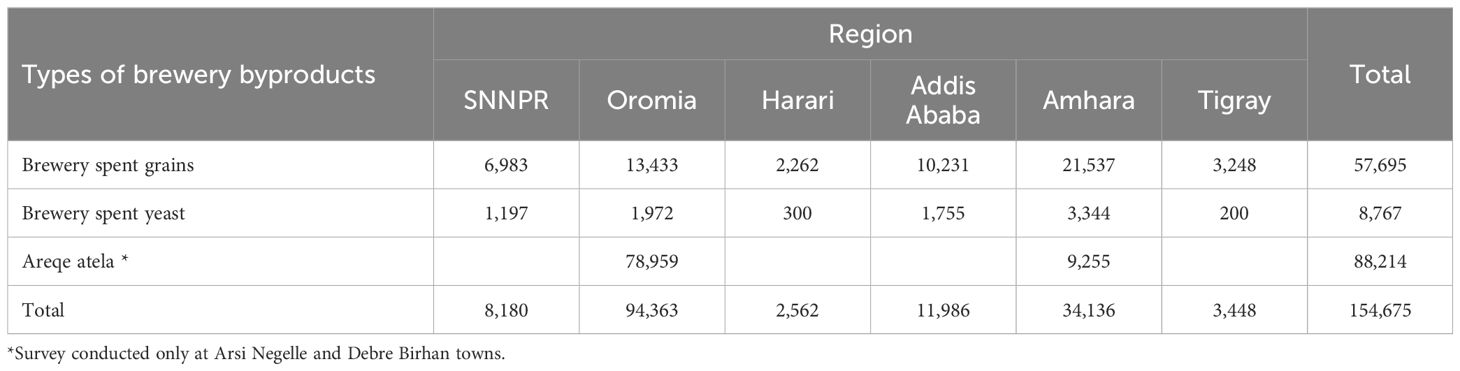
Table 3 Annual production and distribution of brewery and distillery byproducts in Ethiopia by region (tons DM/year).
3.1.4 Sugar factory byproducts
Annual production and distributions of sugar factory byproducts are depicted in Table 4. The sugar factories in the country reported that they produce 75,511 tons DM molasses, 316,079 tons DM bagasse and 324,867 tons cane tops per annum. The total annual production of sugar factory byproducts was greatest in Oromia region while it was lowest in the Amhara region. The main byproducts by the sugar factories were sugar cane tops and bagasses, both which are the more fibrous low-quality feeds whereas the annual production of molasses, which serves as sources readily digestible source of energy feed is relatively low. The sugar factories reported that they are processing at 11.7 ± 2.2% of their capacity on average.
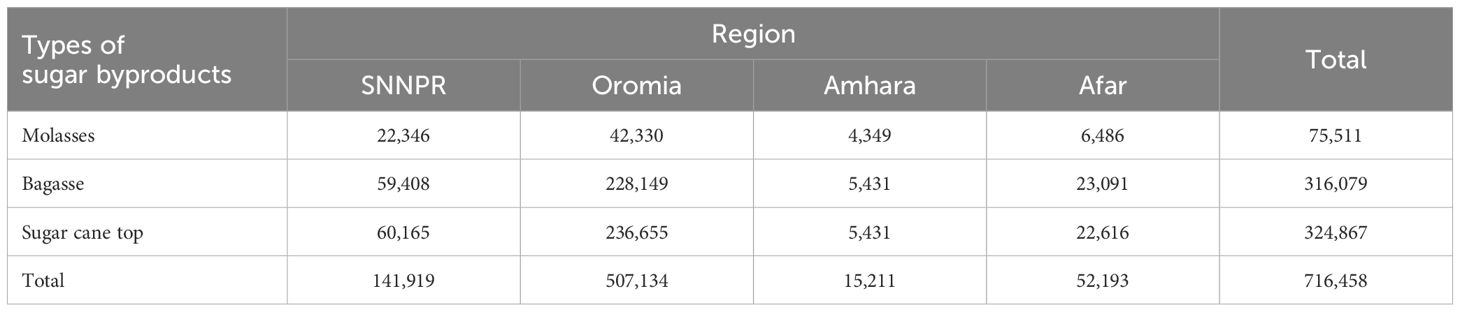
Table 4 Annual production and distribution of sugar factory byproducts in Ethiopia by region (tons DM/year).
3.1.5 Malt byproducts
The number of malt factories in the country, which produce different malt byproducts that could be used as livestock feed, has increased from two in 2015 to four in 2021. Annual production of malt factory byproducts during the study period was 3,092,035 tons DM. The Amhara region produced more malt byproducts compared to Addis Ababa city administration and Oromia region (Table 5). Comparison of the different types of malt byproducts show that the annual production of broken/feed barley was highest followed by germ/rootlet whereas of malt dust was the lowest. The malt factories were processing at 87.5 ± 10.7% of their capacity on average.
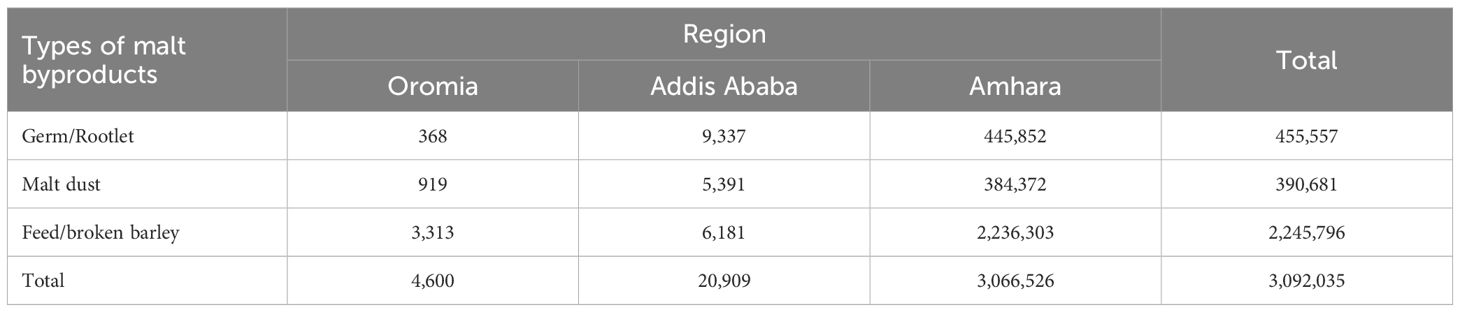
Table 5 Annual production and distribution of malt byproducts in Ethiopia by region (tons DM/year).
3.1.6 Abattoir byproducts
Yet, there are only two abattoirs processing meat and bone meal and one abattoir producing bone meal in Ethiopia with annual production of 18,054 tons DM of meat and bone meal, and 11 tons DM of bone dust. The abattoirs producing meat and bone meal, and bone dust were processing at 43% and 52.2% of their capacity on average, respectively. The average meat and bone meal produced per head of slaughtered cattle, and sheep and goats were 4.75 and 3.5 kg, respectively.
3.1.7 Cement factory byproduct or limestone
Annually, 3,111,071 tons DM of limestone was produced in Oromia and Amhara regions. Out of this, 3,100,664 tons DM of limestone was produced from the Oromia region whereas 10,407 tons was annually produced from two zones (North Shewa and East Gojjam zones) of Amhara region. The limestone factories were processing at 71.9% of their designed capacity.
3.1.8 Compound feeds
The annual production and distributions of compound feeds are shown in Table 6. The annual production of compound feeds was 5,812,608 tons DM. The production was greatest in the Oromia region followed by Addis Ababa city administration and SNNPR. There was no production of compound feeds in the Gambella region during the study period, due to absence of feed processing plants in the region. The feed processing plants were processing only at 24 ± 36.5% of their capacity on average. The annual production of layer feed was highest followed by dairy cattle feed and broiler finisher feeds. The annual production of fish feed was the least followed by pig and equine feeds.
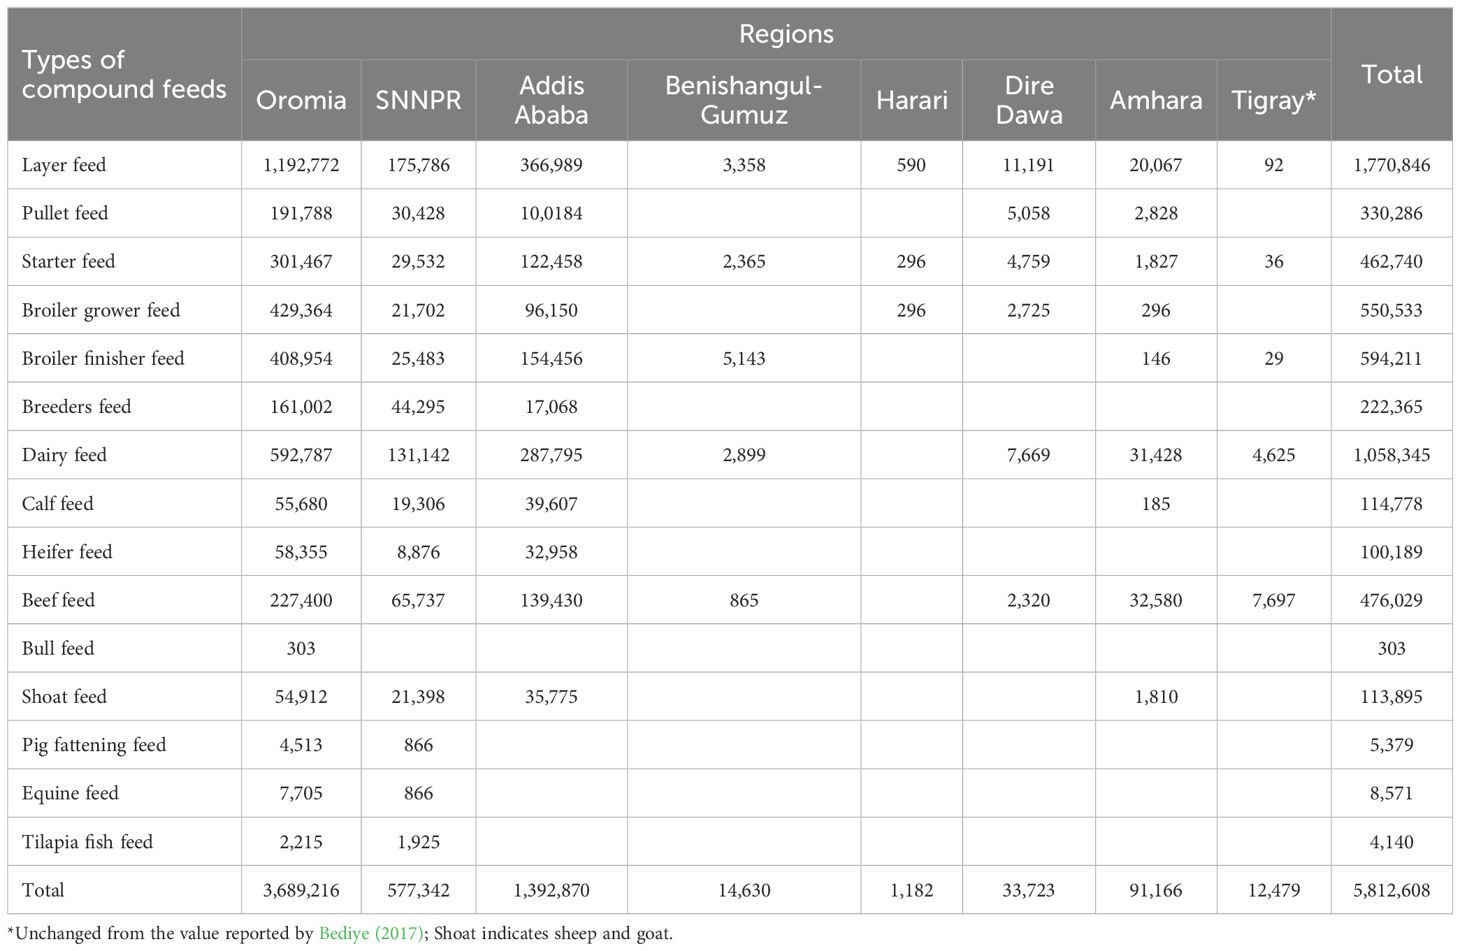
Table 6 Annual production and distribution of compound feeds in Ethiopia by region (tons DM/year).
3.2 Chemical composition and in-vitro digestibility of agro-industrial byproducts and compound feeds
3.2.1 Flour mill byproducts
The ash, NDF, ADF and ADL values of rice bran were greatest (P<0.05) compared to all other flour milling byproducts, whereas the CP of wheat bran was highest (P<0.001) (Table 7). The ME and IVOMD of wheat bran and wheat short were greatest (P<0.05) in comparison to all flour milling byproducts.
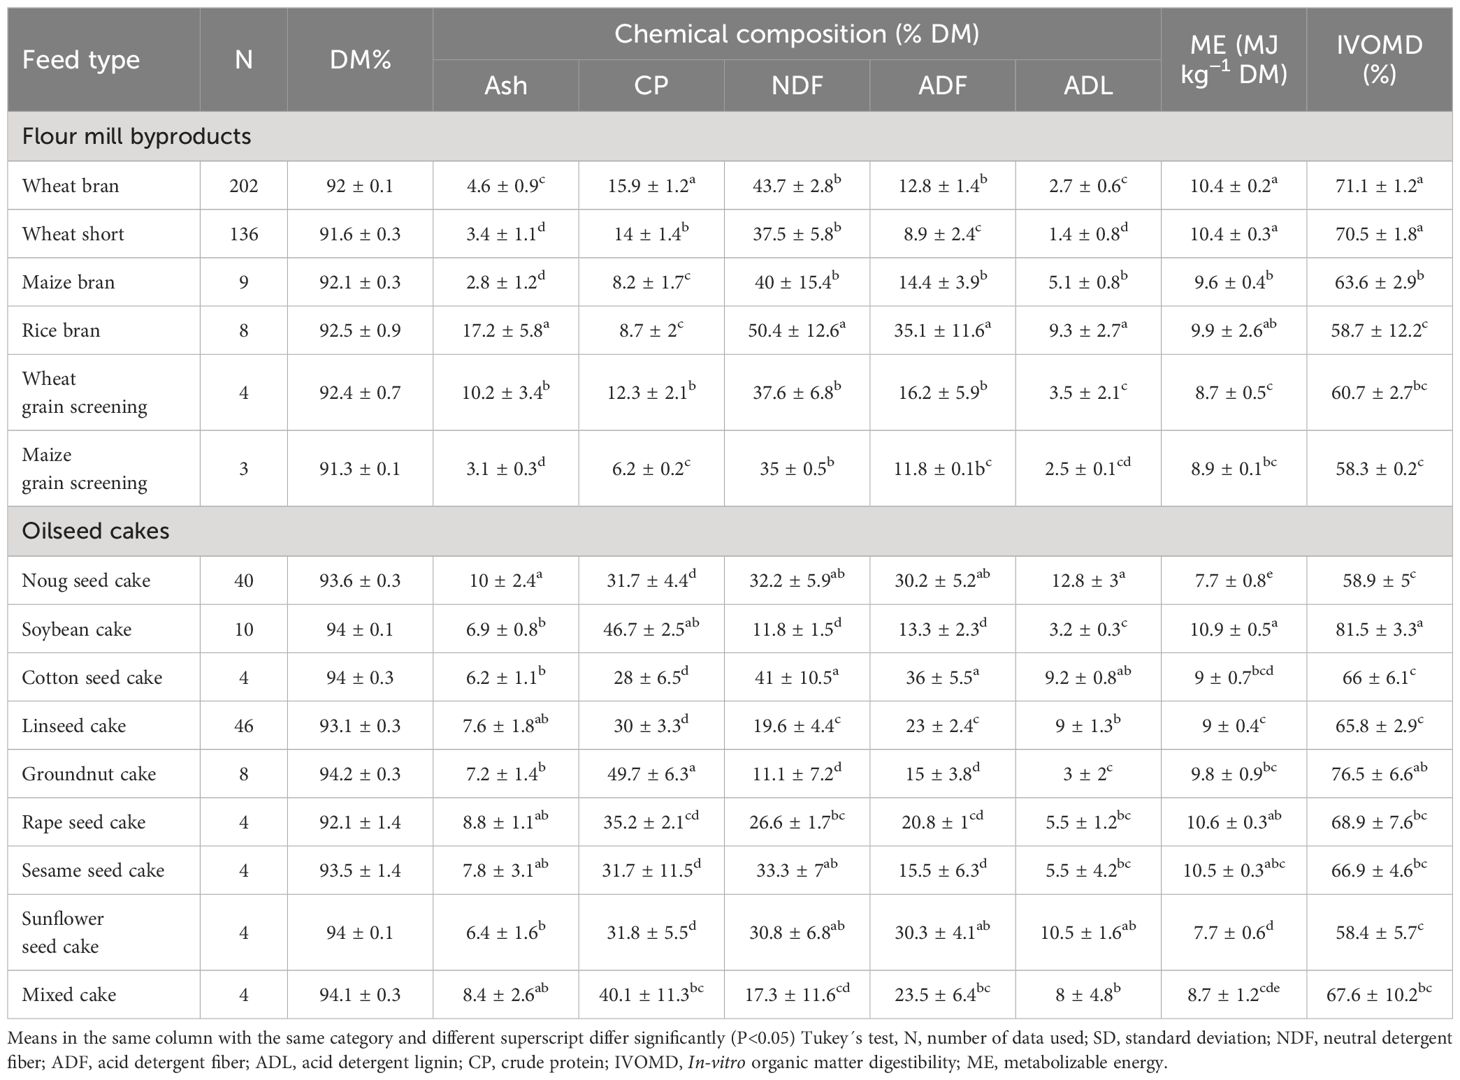
Table 7 Chemical composition and in-vitro digestibility of flour mill byproducts and oilseed cakes (Mean ± SD).
The CP concentration of flour mill byproducts varied from 6.2% in maize grain screening to 15.9% in wheat bran. The NDF concentration was as low as 35% in maize grain screening to as high as 50.4% in rice bran. The ADF concentration ranged from 8.9% in wheat short to 35.1% in rice bran. The ME (MJ kg−1 DM) of flour mill byproducts varied from 8.7 in wheat grain screening to 10.4 in wheat shorts. The IVOMD ranged from 58.3% in maize grain screening to 71.1% in wheat bran.
3.2.2 Oilseed cakes
The chemical composition and in-vitro digestibility of oilseed cakes varied (Table 7). The CP concentration of groundnut cake and soybean cake were greatest (P<0.05) compared to other types of oilseed cakes evaluated in this study. However, there were no significant differences (P>0.05) in CP concentrations of other oilseed cakes such as noug seed cake, cotton seed cake, linseed cake, rape seed cake, sesame seed cake and sunflower seed cake. The NDF concentration of cotton seed cake was higher (P<0.05) than those of groundnut cake, soybean cake, linseed cake and rape seed cake. The ADF concentration of cotton seed cake was greatest (P<0.01) compared to other oilseed cakes except noug seed cake and sunflower seed cake while the ADL of noug seed cake was higher (P<0.01) compared to all other oilseed cakes except cotton seed cake and sunflower seed cake. The ME value of soybean cake was greater (P<0.05) than other oilseed cakes except for rape seed cake and sesame seed cake, whereas the IVOMD of soybean cake was greater (P<0.05) compared to all other oilseed cakes except groundnut cake. There was no significant difference (P>0.05) between soybean and groundnut cakes; linseed and rape seed cakes; rape seed and sesame seed cakes, and among noug seed, cottonseed and sunflower seed cakes for ash, CP, NDF, ADF, ADL and IVOMD indicating that these oilseed cakes can be used interchangeably in supplementing low-quality feeds.
The CP concentration of oilseed cakes highly varied from 28% in cottonseed cake to 49.7% in groundnut cake. The NDF and ADF content ranged from 11.1% in groundnut cake to 40.9% in cottonseed cake for NDF and from 13.3% in soybean cake to 35.9% in cottonseed cake for ADF. The ME also varied from 7.66 MJ kg−1 DM in noug seed cake to 10.9MJ kg−1 DM in soybean cake, and IVOMD varied from 58.4% in sunflower seed cake to 81.5% in soybean cake.
3.2.3 Brewery and distillery byproducts
The CP concentration of brewery spent grains was greater (P<0.05) than that of areqe atela and local brewery byproducts (borde atelas) (Table 8). The NDF, ADF and ADL values of tella atela were greater (P<0.01) compared to other brewery byproducts and areqe atela except for the ADF concentration which was similar (P>0.05) to that of brewery spent grains. However, there was no significant difference (P>0.05) between brewery and local distillery byproducts for ME and IVOMD.
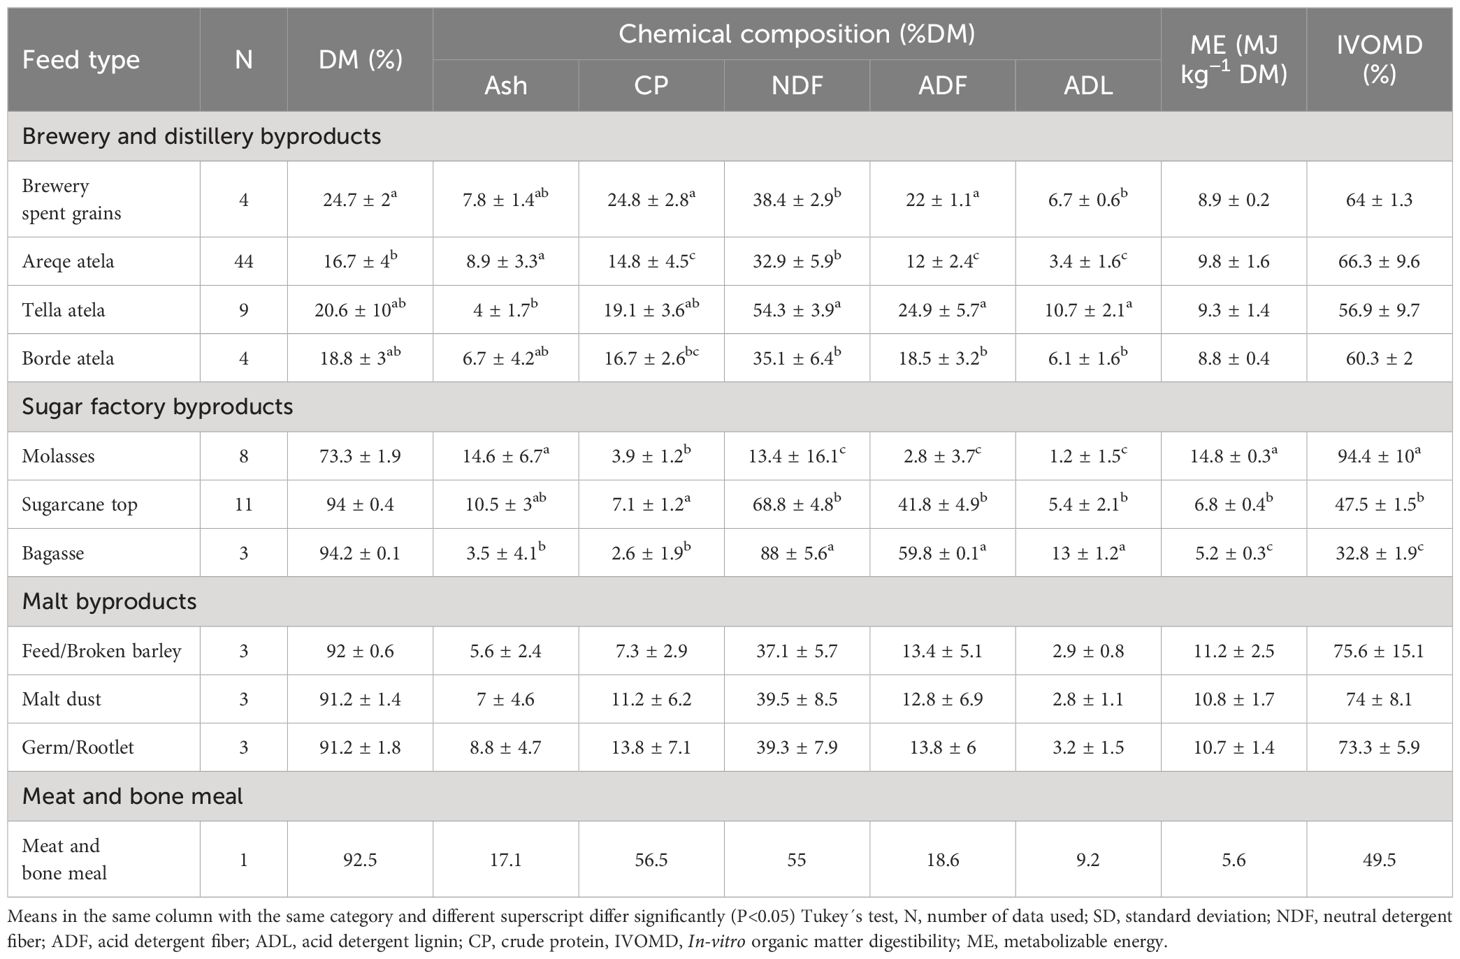
Table 8 Chemical composition and in-vitro digestibility of brewery and distillery, sugar factory, malt and abattoir byproducts (Mean ± SD).
The CP concentration varied from 14.8% in areqe atela to 24.8% in brewery-spent grains. The NDF and ADF values ranged from 32.9% in areqe atela to 54.3% in tella atela for NDF and from 12% in areqe atela to 24.9% in tella atela for ADF. The ME and IVOMD varied from 8.8 MJ kg−1 DM in borde atela to 9.8MJ kg−1 DM in areqe atela for ME, and from 56.9% in tella atela to 66.3% in areqe atela for IVOMD.
3.2.4 Sugar factory byproducts
The CP concentration of sugarcane tops was greater (P<0.001) than molasses and sugarcane bagasse (Table 8). The ME and IVOMD of molasses were greater (P<0.001) than sugarcane tops and bagasse, whereas the NDF, ADF and ADL of molasses were lower (P<0.05) than those of sugarcane tops and bagasse. In contrast, the NDF, ADF and ADL of sugarcane bagasse were higher (P<0.01) than molasses and sugarcane tops while the ME and IVOMD of sugarcane bagasse were lower (P<0.001) than molasses and sugarcane tops.
The nutritive value of sugar byproducts indicated that the CP concentration varied from 2.6%in sugarcane bagasse to 7.1% in sugarcane tops. The NDF value ranged from 13.4% in molasses to 88% in sugarcane bagasse, and that of ADF varied from 2.8% in molasses to 59.8% in bagasse. The IVOMD of sugar byproducts was as low as 32.8% in sugar cane bagasse to as high as 94.4% in molasses. The ME concentration highly varied from 5.2 MJ kg−1 DM in sugarcane bagasse to 14.8MJ kg−1 DM in molasses.
3.2.5 Malt byproducts
The chemical composition and in-vitro digestibility of malt byproducts are shown in Table 8. The multiplication of beer factories in the country resulted in more malt factories, which produce different byproducts that can be used as animal feed due to their good protein or energy value. There was no difference (P>0.05) among different malt byproducts for chemical composition and in-vitro organic matter digestibility.
The chemical composition and in-vitro digestibility of malt byproducts varied from 7.3% in feed barley to 13.8% in germ for CP, 37.1% in broken barley to 39.5% in malt dust for NDF, 12.8% in malt dust to 13.8% in germ for ADF, 10.7 MJ kg−1 DM in germ/rootlet to 11.2 MJ kg−1 DM in feed barley, and 73.3% in germ/rootlet to 75.6% in feed barley.
3.2.6 Abattoir byproducts
The CP concentration of meat and bone meal was more than all plant-origin protein source feeds (Tables 7, 8). The NDF and ADF of meat and bone meal were relatively lower than oilseed cakes indicating its potential to supplement low-quality feeds. However, meat and bone meal was low in ME and IVOMD.
3.2.7 Compound feeds
The chemical composition and in-vitro digestibility of compound feeds are presented in Table 9. There was no significant difference (P>0.05) among different compound feeds for ash, ADL and ME. However, a significance difference was observed in CP, NDF, ADF and IVOMD concentrations. The CP and IVOMD values of Tilapia fish grower feed were greatest (P<0.05) compared to all other compound feeds. The CP concentration of layer starter and rearing (breeder) feed was higher (P<0.05) than beef and dairy feeds. The NDF concentration of ruminant feed (i.e. dairy, beef, calf, heifer and shoat feeds) and equine feed was greater (P<0.05) than monogastric animals (i.e. layer, starter, grower, broiler finisher and pig fattening feeds) and Tilapia fish grower feed.
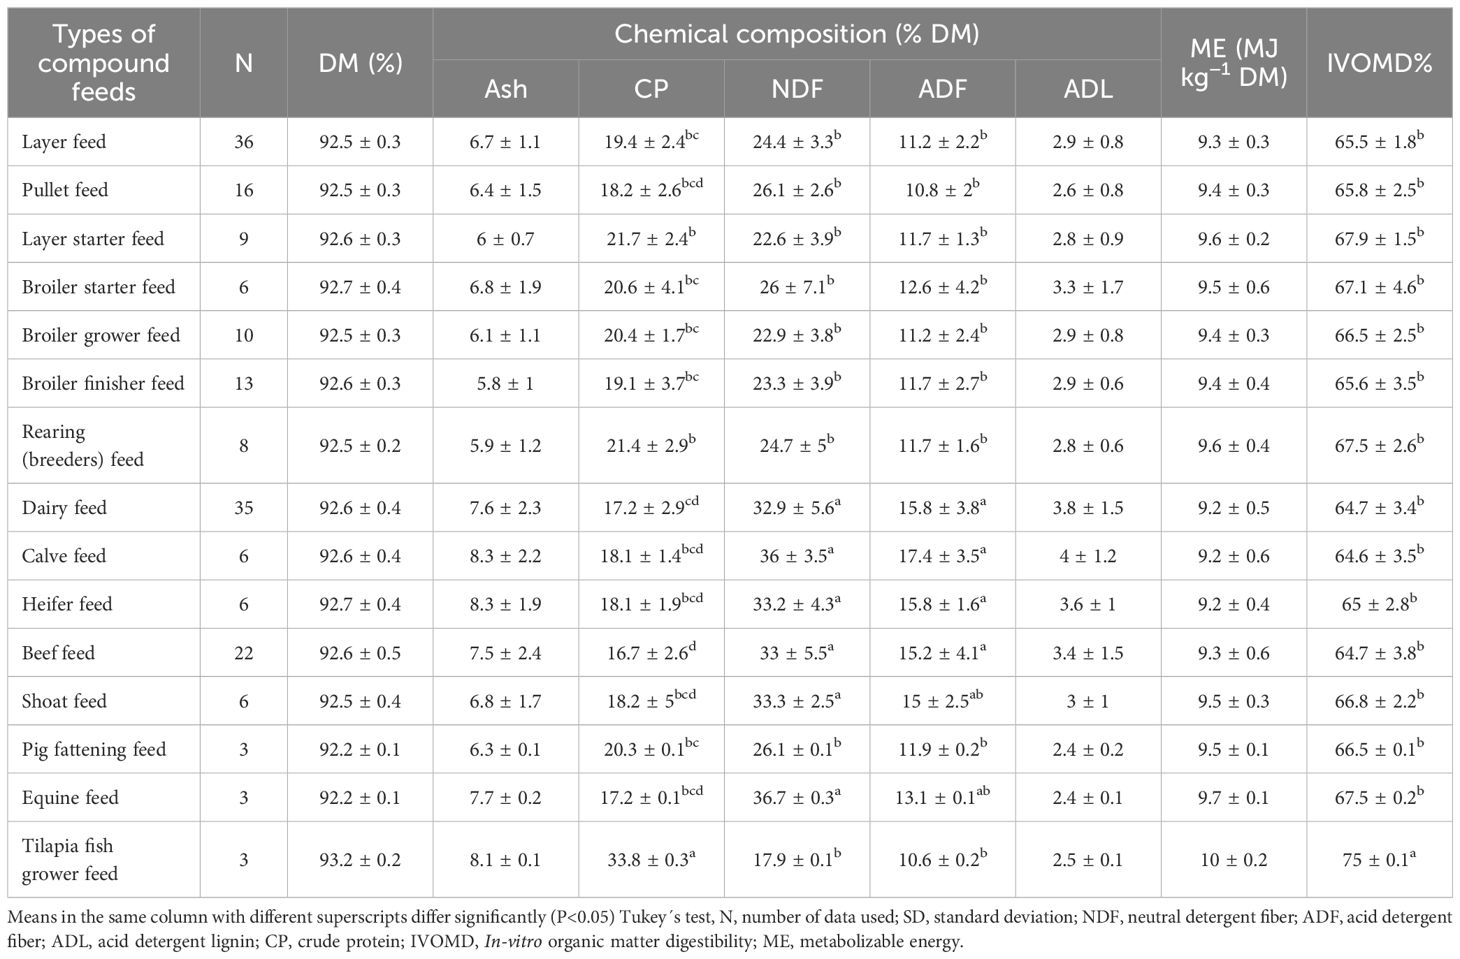
Table 9 Chemical composition and in-vitro digestibility of compound feeds (Mean ± SD).
The CP concentration of compound feeds varied from 16.7% in beef feed to 33.8% in Tilapia fish grower feed. The NDF and ADF content ranged from 17.9% in Tilapia fish grower feed to 36.7% in equine feed for NDF and from 10.6% in Tilapia fish grower feed to 17.4% in calf feed for ADF. The ME concentration ranged from 9.15 MJ kg−1 DM in calf feed to 10 MJ kg−1 DM in Tilapia fish grower feed whereas the IVOMD varied from 64.6% in calf feed to 75% in Tilapia fish grower feed.
3.3 Challenges and opportunities in the production of agro-industrial byproducts and compound feeds
Agro-industries in Ethiopia are facing different challenges to produce their main products and byproducts. Most of the respondents indicated that shortage and seasonal variations of raw materials were the major challenges faced by the agro-industries followed by high price and price fluctuations of raw materials and electric power interruptions (Table 10). In contrast, the lowest challenge faced by agro-industries was market inaccessibility followed by lack of capital and lack of skilled manpower.
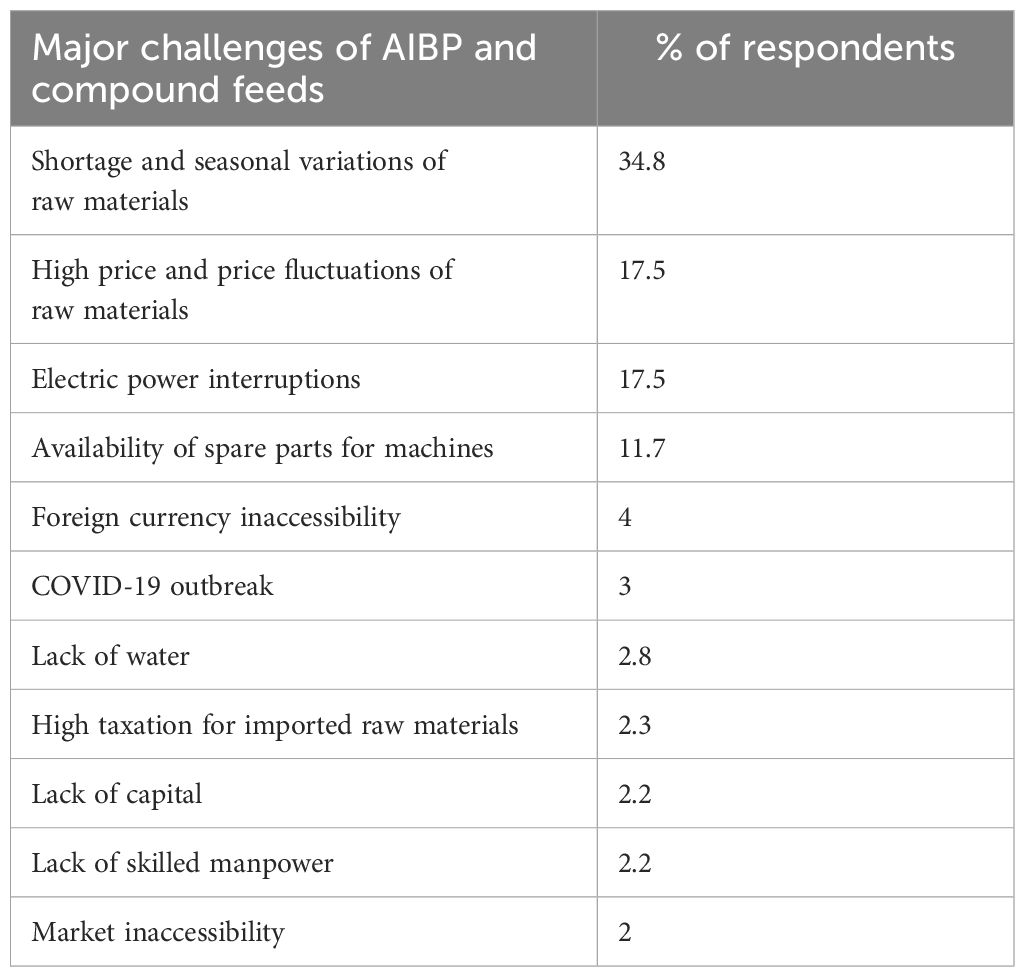
Table 10 Major challenges of agro-industrial byproducts (AIBP) and compound feeds (% of respondents).
The high demand for agro-industrial byproducts and compound feeds mainly during the dry season indicated a major opportunity to leverage. The majority of agro-industries (especially flour and oil factories), storied their byproducts for less than a week followed by two weeks and three weeks during the dry season, indicating a high demand for the byproducts (Table 11). However, there was less demand during the main rainy season in which the majorities of agro-industries stored their byproducts for a month followed by two months and three months. About 19.6% of feed processing plants also indicated lower demand for compound feeds during the main rainy season.
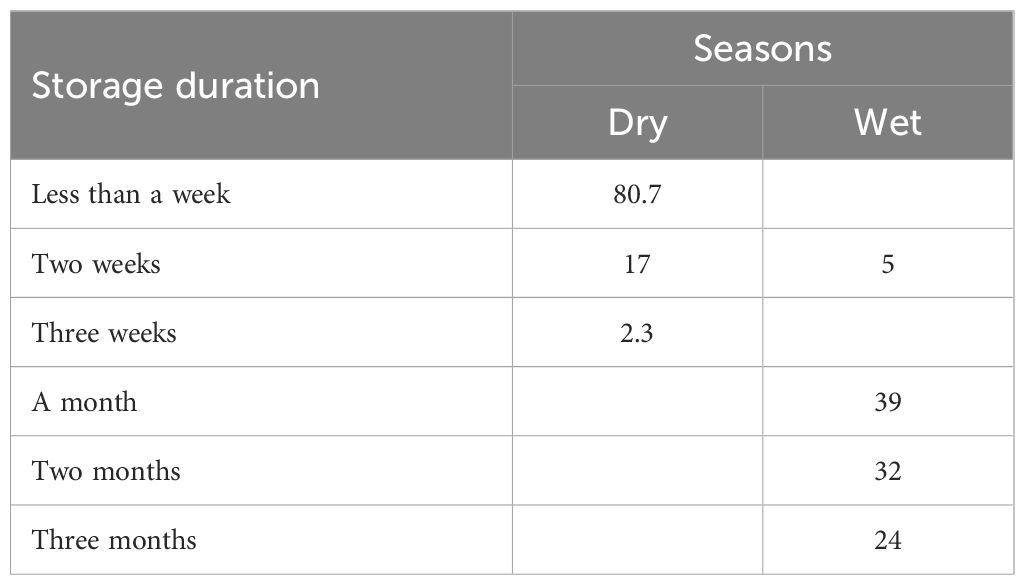
Table 11 Storage duration of agro-industrial byproducts (% of respondents).
4 Discussion
4.1 Annual production and distribution of agro-industrial byproducts and compound feeds in Ethiopia
4.1.1 Flour mill byproducts
The high production of flour mill byproducts in the Oromia region is due to the existence of many flour mill factories in the region, which is a reflection of the suitability of the region for growing cereals. According to our survey, 173 flour factories out of the 310 factories surveyed are in the Oromia region. The higher production of wheat bran in the country compared to other types of flour mill byproducts could be associated with the higher extraction rate of wheat bran (20.5%) compared to wheat short (3.7%), maize bran (12.5%), maize short (3.5%), wheat grain screening (3.1%) and maize grain screening (2.4%). The higher production of wheat bran compared to rice bran despite the higher extraction rate of rice bran (42.3%) is related to the lower number of rice milling factories in the country. The lower production of maize grain screening is attributed to the lower number of maize milling factories and its extraction rate. The current lower actual annual production (52.4%) of flour mill byproducts compared to the potential capacity could be attributed to shortage and seasonal variations of raw materials supply (45.9%), electric power interruptions (29.1%), and high price and price fluctuations of raw materials (14%). Market problems (8.2%), machine spare part problems (6.2%), water problems (2.7%) and lack of capital (financial problems) (2.1%) were also other constraints for the lower production of flour mill byproducts compared to the potential capacity.
4.1.2 Oilseed cakes
The high production of oilseed cakes observed in the Oromia region is related to the greater number of oil factories in the region (136 out of the 194 oil factories surveyed are located in the region). In contrast, the lower production of oilseed cakes in SNNPR can be attributed to the few oil factories (2 oil factories) in the region. The lower actual production (43.2%) of oil seed cakes compared to the capacity is due to shortage and seasonal variations of oilseed supply (46.3%), high price and price fluctuations of oilseeds (18.4%) and electric power interruptions (17.4%). Lack of market (7.4%), lack of finance (4.2%), lack of spare parts (3.7%) and low quality of oilseeds (2.6%) were also other challenges for the low productions of oilseed cakes.
According to Foreign Agricultural Service (FAS, 2021), the production of sesame, Noug and soybean seeds during 2019/20 was 280,000, 295,000 and 132,000 metric tons, respectively, and about 213,905, 12,057 and 75,670 MT of sesame, Noug and soybean seeds were exported in the same year with the export percentage of 76%, 4% and 57%, respectively. The high production of Noug seed cake in Ethiopia is associated with the high production and low export of Noug seed compared with other oilseeds (CSA, 2021; FAS, 2021). The low production of sunflower seed cake is due to the lower production and supply of sunflower seed. According to CSA (2021), the production of sunflower seed in 2020/21 was 42,878 quintals which is the lowest value compared with other oilseeds.
4.1.3 Brewery and distillery byproducts
The number of brewery factories in Ethiopia increased from 5 in 2010 to 13 in 2021. These brewery factories have been producing a large amount of byproducts, which are important for supplementing low-quality roughage feeds such as crop residues, natural pastures and hays. The high annual production of brewery byproducts in the Amhara region is due to presence of more (3) of brewery factories in the region. However, the low production of brewery byproducts in the Harari region is related to the lower number (1) and capacity of beer factories in the region. The brewery factories were operating at 85.6% of their capacity during the study period, which is commendable. They did not operate at full capacity due to foreign currency inaccessibility (32%), COVID-19 disruptions (25%), high taxation for imported raw materials (18%), security problems (14%) and electric power interruptions (11%). Similarly, the local distillery byproduct (areqe atela) producers reported that they were operating at only 75.5% of their capacity due to high price and price fluctuations of inputs (84%), lack of capital (7%), electric power problem (5.4%) and water problem (3.6%). The estimate for areqe atela could be much greater than the reported value if the survey was done widely at the country level. Production of local home-brewed brewery byproducts (tella atela) was not included due to difficulty of collecting data on the volume of the atela produced at household level although it makes a substantial contribution to livestock feed in smallholder households particularly for urban and peri-urban livestock producers in different parts of the country.
4.1.4 Sugar factory byproducts
The greater total annual production of sugarcane byproducts in the Oromia region is due to greater number and processing capacity of sugar factories in the region. The region is endowed with good climatic and soil conditions and irrigable land suitable for sugarcane plantations. The greatest production of sugarcane tops is associated with the high extraction rate (30%) of sugarcane tops than bagasse (29.5%) and molasses (3.8%). The lower actual production (11.7%) of sugar factories compared to the capacity can be attributed to the shortage of sugar cane (54.5%), spare parts (27.3%) and high turnover rate of senior or skilled workers (18.2%).
4.1.5 Malt byproducts
The production of malt byproducts was greater in the Amhara region due to greater number (2) and capacity of malt factories in the region (Table 5). The greater production of broken/feed barley can be associated with the high extraction rate of broken/feed barley than other byproducts. The total annual production of malt dust was relatively low due to its low extraction rate. The lower actual production of malt byproducts (87.5%) compared with its capacity can be related to shortage of barley grain (67%), electric power interruptions (17%), and water problems (16%).
4.1.6 Abattoir byproducts
According to CSA (2021), 391,991 cattle and 8,423,989 sheep and goats were slaughtered in Ethiopia during the reference period of 2019 to 2020. This indicates that the country has a promising opportunity to produce high amounts of meat and bone meal or bone meal alone. However, out of 33 abattoirs visited during the survey, only three process meat and bone meal, and bone meal alone, indicating that a lot of abattoir byproducts have been dumping/voiding from many abattoir services without use. The high annual production (16,171 tons DM/year) of meat and bone meal in the Oromia region is associated with the high capacity (550 tons/day) of meat and bone processing plant in the Oromia region. The lower production of meat and bone meal, and bone dust production compared to its production capacity can be associated with lack of spare parts (50%), electric power interruptions (25%), and shortage of raw materials (slaughtered animals) (25%). According to the key informant interview held with processing plant managers, the factory was processing much less than the demand of meat and bone meal for feed processing plants.
4.1.7 Cement factory byproduct or limestone
The annual production of limestone in this report does not indicate the total production at the country level since Tigray and northern parts of the Amhara regions were not assessed due to security problems. The cement factories indicated that the current production of limestone is lower than the designed capacity of the plants due to electric power interruptions (33.3%), problems with and old age of machines (25%), low demand for limestone for animal feed (25%) and shortage of raw materials (16.7%). In addition, according to the key informant interview held by cement factory managers, limestone is more in demand for soil acidity treatment than for animal feed.
4.1.8 Compound feeds
The highest annual production of compound feeds was reported in the Oromia region, which is due to a greater number (52) of feed processing plants in the region. This could be due to central location of the region and greater availability of the different ingredients used by the feed processing plants. The lower (24%) actual production of feed processing plants compared to production capacity is associated with shortage of raw materials mainly that of vitamin premix (40%), high price and price fluctuations of raw materials (23.2%) and electric power interruptions (17.9%). Lack of market (8.4%), difficulty of accessing spare parts (6.3%), and lack of credit (4.2%) were also other problems that explain the low production volume. Poultry feed, particularly layer feed, is the most widely produced compound in Ethiopia. Commercial poultry farms are dependent on industry-produced compound feed as they cannot undertake home mixing of the feeds because of unavailability of protein supplements and premixes. The compound feeds used in commercial poultry farms are sourced from feed processing plants, whereas most dairy farms and feedlots buy different feed ingredients and mix them on their own farms, which is consistent with the reports of Yami and Woldesemayat (2012). The relatively lower production of pig and fish feed is probably due to most of the pig and fish farming in Ethiopia is traditional method which may not use commercial/compound feeds. According to Hussen and Abebe (2020), fish production in the central rift valley of Ethiopia mainly uses the traditional system. The study conducted by Gebregziabhear (2022) also indicated that pig production in Ethiopia is a recently introduced activity with a traditional management based scavenging type of feeding.
4.2 Chemical composition and in-vitro digestibility of agro-industrial byproducts and compound feeds
4.2.1 Flour mill byproducts
The CP concentration of wheat bran is within the range (15–16% CP) recommended to support lactating dairy cows during mid-lactation; whereas the CP of wheat short is within the range (13–15% CP), and that of wheat grain screening, maize bran, rice bran and maize grain screening is less than the range (13–15% CP) recommended for lactating dairy cows during the late lactation (NRC, 2001). The NDF of wheat short, wheat grain screening and maize grain screening is within the range (30–38%) and the NDF of maize bran is within the range (33–43%) recommended for lactating dairy cows during mid and late lactation, respectively (NRC, 2001) and hence can be supplemented to mid and late stage lactating dairy cows, respectively.
The higher NDF, ADF and ADL values of rice bran compared to other flour milling byproducts could be due to inherent difference of rice from other crops, crop growing environment and method of grain milling. The study conducted by Gloria et al. (2019) also revealed that rice contained arabinoxylan (the main polysaccharide) which increases the concentrations of fiber and decreases in-vitro dry matter digestibility of rice. The greater ME concentration of wheat short than other flour milling byproducts is associated with its higher proportion of germ and flour in wheat short than in the other byproducts, which consistent with the findings of Feyissa et al. (2015). The greater IVOMD concentration of wheat bran than other flour milling byproducts could be associated with its high CP value. IVOMD is positively correlated with CP and negatively correlated with ADF and lignin (Girma et al., 2015).
4.2.2 Oilseed cakes
The CP concentrations of all oilseed cakes were greater than the range of CP (17–19%) recommended for lactating dairy cows during early lactation (NRC, 2001) indicating their potential to supplement lactating dairy cows during early lactation. The NDF of all oilseed cakes except cotton seed cake were less than the range (30–34%) recommended for lactating dairy cows during early lactation whereas the NDF of cotton seed cake was within the range (33–43%) recommended for late lactation (NRC, 2001). Thus, the cottonseed cake needs to be combined with less fibrous oilseed cakes or other protein supplements during early lactation or for high producing dairy cows. The nutritive attributes of oilseed cakes such as the high CP concentration in groundnut and soybean cakes; the greater NDF and ADF of cotton seed cake; the higher ME value of soybean cake, and the greater IVOMD of groundnut cake compared to the other oilseed cakes, is associated with the type and nature of oilseed (Tolera, 2008; Feyissa et al., 2015).
4.2.3 Brewery and distillery byproducts
The CP content of brewery spent grains and tella atela is greater than the range (17–19% CP) recommended for lactating dairy cows during early lactation, whereas the CP content of areqe atela, which is similar to that of borde atela, is comparable with the range (15–16% CP) recommended for lactating dairy cows during mid-lactation (NRC, 2001). The NDF of areqe atela is within the range (30–34%) recommended for lactating dairy cows during early lactation, whereas the NDF of borde atela and brewery spent grains is within the range (30–38%) recommended for lactating dairy cows during mid-lactation (NRC, 2001). This indicated that areqe and borde atelas can be used as protein supplements in lactating dairy cows during early and mid-lactation, respectively.
The greater CP concentration of brewery spent grains than areqe atela and borde atela, and the high NDF of tella atela could be attributed to differences in the types and varieties of crops used for making the beverages and the extraction process used to get the by-product (Feyissa et al., 2015). It could also be attributed to the species of the grains (barley, maize, and rice) used for beer making, their inclusion levels and the processing method (Kitaw, 2019). The nutritive value of the grains used, the period of fermentation, processing techniques and analytical procedures also contribute to variations in the chemical composition of their byproducts (Senthilkumar, 2009).
4.2.4 Sugar factory byproducts
The CP of all sugar factory byproducts is less than the minimum CP level (7.5%) required for proper rumen function (Van Soest, 1982) indicating the need for supplementation with protein rich feeds when any of sugar factory byproducts are used as animal feed. The NDF of sugarcane tops and bagasse are greater than 65%, hence they fall in the category of low-quality feeds (Singh and Oosting, 1992). Molasses is a readily digestible feed with the least fiber content and the greatest IVOMD and ME concentration compared to all other agro-industrial byproducts and can be used as a readily available source of energy supplement (NRC, 2001).
4.2.5 Malt byproducts
The CP concentration of germ is within the range (13–15% CP) recommended for lactating dairy cows during late lactation, whereas the CP concentration of malt dust and feed/broken barley is less than the requirement indicating the need for supplementing with a source of protein when malt dust and/or broken barley are fed to lactating dairy cows (ARC, 2001). The NDF content of malt byproducts is within the range (33–43%) recommended for lactating dairy cows during late lactation (NRC, 2001).
4.2.6 Abattoir byproducts
The CP (56.5%) concentrations of meat and bone meal in the current study is greater than the values (52.3%, 50% and 50%) reported by Sebsibe (2017); Mehari et al. (2019) and Chala (2020), respectively. However, the ME (5.6 MJ/kg DM) concentration of meat and bone meal is less than the values (14.6, 11.8 and 11.8 MJ/kg DM) reported by Sebsibe (2017); Mehari et al. (2019) and Chala (2020), respectively. The variations between different studies might be due to the variations between meat and bone meal processing plants (rendering plants). Hendriks et al. (2004) also reported the variation in meat and bone quality due to variations associated with operation of the rendering system, differences between plants in the animal parts being rendered, handling and treatment of rendered material prior to rendering.
4.2.7 Compound feeds
The CP and NDF of dairy feed are comparable with the 17–19% of CP and 30–34% NDF recommended for lactating dairy cows during early lactation whereas the ADF is less than the recommended (19–21% ADF) (NRC, 2001). The CP of dairy feed is also sufficient enough to meet the 17% CP required for lactating large breed (680 kg live weight) dairy cows in early lactation which produces 30 kg milk per day with 3.5% fat, 2.5% true protein, and 14.5 kg dry matter intake (NRC, 2001).The CP content of heifer feed in the current study is comparable with the 17.9% CP required for large breed non-bred heifers with 150 kg body weight with 1 kg average daily gain and 4.2 kg dry matter intake per day. The CP concentration of calf feed in the current study is also sufficient enough to support the 18% CP required for young calves of 40 kg live weight, 600 grams gain per day and 0.69 kg dry matter intake per day (NRC, 2001).The CP and ME of shoat (sheep and goat) feed in the current study were comparable with 18.2%CP and 9.12 MJ/kg DM ME required for growing early weaned lambs of 20 kg body weight and 300 grams gain per day (Kearl, 1982). The CP concentrations of layer and broiler finisher feed is greater than 18.8% and 18%, required for White-egg layers with the daily feed intake of 80 g per hen, and broiler finishers with the age of 6 to 8 weeks, respectively (NRC, 1994). The greater CP and IVOMD values of fish feed than other compound feeds are due to the types and proportions of ingredients used (Feyissa et al., 2015).
4.3 Challenges and opportunities in the production of agro-industrial byproducts and compound feeds
Shortage and seasonal variations of raw materials, and their high price and price fluctuations in the current study are consistent with the previous findings of Bediye et al. (2018) and Negash (2020). The export of oilseeds could be one of the reasons for the shortage and high price of oilseed cakes, which is in agreement with Tolera (2007), who reported the inadequate supply of oilseeds due to competition between export and the demand for domestic processing. According to Foreign Agricultural Service (FAS, 2021), about 213,905, 12,057 and 75,670 MT of sesame, noug and soybean seeds, respectively were exported during 2019/20. Security problems in different parts of the country are also another reason for the shortage and high price of raw materials. Addressing the security problems across the country and efforts for peaceful resolution of conflicts could help to create a stable conduction environment conducive for various feed business operations. In addition, fair distribution and efficient and effective utilization of the electric power supply generated in the country may help to alleviate electric power interruption problems.
The high demand for agro-industrial byproducts and compound feeds can be attributed to the expansion of commercial livestock production as a result of the high demand for livestock products. According to Shapiro et al. (2017), the production of meat in Ethiopia is projected to grow by about 39% from about 1.1 million tons in 2013 to about 1.6 million tons in 2028 and that of milk is expected to grow by 50% from 5.2 million liters in 2013 to 7.8 million liters in 2028.
5 Conclusion
The expansion of agro-industry in Ethiopia presents a promising opportunity to produce a lot of byproducts to supplement low-quality feeds. Annually, 5.25 million tons DM of agro-industrial byproducts and 5.8 million tons DM of compound feeds were produced in Ethiopia during the study period (2019–2021). High protein or energy contents of some agro-industrial byproducts indicated their potential to be utilized in the intensive livestock operations. Currently, all agro-industries are operating below their installed capacities due to shortage and seasonal fluctuation of raw materials supply, high price and price fluctuations of raw materials, and electric power interruptions. There is a need for addressing these bottlenecks to allow the existing agro-industries to operate at fully capacity and to attract additional agro-industries into the business to boost the production and availability of agro-industrial byproducts badly needed as critical inputs in the manufacture of compound feeds.
Data availability statement
The raw data supporting the conclusions of this article will be made available by the authors, without undue reservation.
Author contributions
TF: Conceptualization, Data curation, Formal analysis, Investigation, Methodology, Visualization, Writing – original draft, Writing – review & editing. AT: Conceptualization, Data curation, Methodology, Project administration, Supervision, Visualization, Writing – review & editing. AN: Methodology, Supervision, Validation, Visualization, Writing – review & editing. MB: Methodology, Supervision, Visualization, Writing – review & editing. AA: Conceptualization, Funding acquisition, Project administration, Supervision, Writing – review & editing.
Funding
The author(s) declare financial support was received for the research, authorship, and/or publication of this article. This work was funded in whole or part by the United States Agency for International Development (USAID) Bureau for Food Security under Agreement no. AID-OAA-L-15-00003 as part of Feed the Future Innovation Lab for Livestock Systems. Additional funding was received from Bill & Melinda Gates Foundation OPP#1175487. Any opinions, findings, conclusions, or recommendations expressed here are those of the authors alone. Under the grant conditions of the Foundation, a Creative Commons Attribution 4.0 Generic License has already been assigned to the Author Accepted Manuscript version that might arise from this submission.
Acknowledgments
The authors are grateful for the information provided by different agro-industries. The authors also would like to extend special thanks to different government offices such the bureaus of agriculture, livestock, and trade and industry for their unlimited support.
Conflict of interest
The authors declare that the research was conducted in the absence of any commercial or financial relationships that could be construed as a potential conflict of interest.
Publisher’s note
All claims expressed in this article are solely those of the authors and do not necessarily represent those of their affiliated organizations, or those of the publisher, the editors and the reviewers. Any product that may be evaluated in this article, or claim that may be made by its manufacturer, is not guaranteed or endorsed by the publisher.
References
Bediye S. (2017). The Status of the Commercial Feed Sub-Sector in Ethiopia. Feed Bulletin No.007/ 2017 (Addis Ababa, Ethiopia: Ethiopian Animal Feed Industry Association).
Bediye S., Nemi G., Makkar H. (2018). Ethiopian feed industry: Current status, challenges and opportunities. Broadening Horizons 50 (Rome, Italy: Feedipedia). Available at: www.feedipedia.org.
Chala D. (20202020). Body weight gain and testicular growth of horro rams supplemented concentrate with lablab purpureus fed grass hay. Am. J. Zoology 3, 47–52. doi: 10.11648/j.ajz.20200302.13
CSA (Central Statistical Agency). (2017). Agricultural sample survey 2016/17 (2009 E.C.) Volume I. Report on area and production of crops (Private Peasant Holdings, Meher Season). Statistical Bulletin 584 (Addis Ababa, Ethiopia: CSA).
CSA (Central Statistical Agency). (2021). Agricultural sample survey 2020/21 (2013 E.C.) Volume I. Report on area and production of major crops (Private Peasant Holdings, Meher Season). Statistical Bulletin 590 (Addis Ababa, Ethiopia: CSA).
FAO (Food and Agriculture Organization of the United Nations). (2018a). Africa Sustainable Livestock 2050 (Ethiopia: Integrated snapshot). Cattle sector. CA0712EN/1/09.18.
FAO (Food and Agriculture Organization of the United Nations). (2018b). Ethiopia: Report on feed inventory and feed balance (Rome, Italy: FAO) 160.
FAS (Foreign Agricultural Service). (2021). Ethiopia oilseeds report annual. Oilseeds and Products: Report Number: ET2021-0006. (Addis Ababa, Ethiopia: United States Department of Agriculture (USDA) and Global Agricultural Information Network (GAIN)).
Feyissa F., Kitaw G., Assefa G. (2015). Nutritional qualities of agro-industrial by-products and local supplementary feeds for dairy cattle feeding. Ethiop. J. Agric. Sci. 26, 13–26. Available at: https://www.ajol.info/index.php/ejas/article/view/144684.
Gebregziabhear E. (2022). Swine husbandry practices in Ethiopia. A review. J. Biology Agric. Healthcare 12 (1), 22–29. doi: 10.7176/JBH/12-1-03
Girma M., Animut G., Assefa G. (2015). Chemical composition and in vitro organic matter digestibility of major indigenous fodder trees and shrubs in Northeastern dry lands of Ethiopia. Livestock Res. Rural Dev. 27, 26. Available at: http://www.lrrd.org/lrrd27/2/girm27026.htm.
Gloria A. C., Hellen N. L., Knud E. B. K., Hans H. S. (2019). Arabinoxylan is the main polysaccharide in fiber from rice coproducts, and increased concentration of fiber and decreases in-vitro digestibility of dry matter. Anim. Feed Sci. Technology. 247, 255–261. doi: 10.1016/j.anifeedsci.2018.11.017
Hendriks W. H., Cottam Y. H., Morel P. C. H., Thomas D. V. (2004). Source of the variation in meat and bone meal nutritional quality. Asian-Australasian J. Anim. Sci. 17 (1), 94–101. doi: 10.5713/ajas.2004.94
Hussen A., Abebe A. (2020). Overview of Ethiopian fisheries production system and its challenges in different fish potential area: A review. Int. J. fisheries Aquat. Stud. 8, 148–156. Available at: https://www.fisheriesjournal.com/archives/2020/vol8issue5/PartB/8-4-82-391.pdf.
Kearl L. C. (1982). “Nutrient requirements of ruminants in developing countries,” in All Graduate Theses and Dissertations. (Logan: International Feedstuffs Institute, Utah State University) Paper 4183.
Kitaw G. (2019). Assessment on the Production, Conservation and Utilization Practices of Brewery Spent Grain across Selected Districts in Ethiopia, and its Supplementary Value for Dairy Cows. Ph.D. Dissertation (Addis Ababa, Ethiopia: Addis Ababa University).
Makkar H. P. S., Ankers P. (2014). A need for generating sound quantitative data at national levels for feed-efficient animal production. Anim. Production Sci. 54, 1569–1574. doi: 10.1071/AN14377
Mehari R., Shumuye B., Kinfe M., Adugna G. (2019). Performance of egg-laying hens fed Acacia saligna seed meal. Livestock Res. Rural Dev. 31, 27. Available at: http://www.lrrd.org/lrrd31/2/mehk31027.html.
Negash D. (2020). Evaluation of commercial animal feed quality and manufacturing status in Ethiopia. Edelweiss Food Sci. Technol. 1, 12–20. doi: 10.31080/ASNH.2020.04.evaluation-of-commercial-animal-feed-quality-and-manufacturing-status-in-ethiopia
NRC (National Research Council). (1994). Nutrient requirements of poultry. ninth revised ed (Washington, DC: National Academy Press).
NRC (National Research Council). (2001). Nutrient requirements of dairy cattle. 7th revised ed (Washington, DC: National Academy Press).
Sebsibe A. (2017). Effect of substituting soya bean meal with fish offal meal and poultry litter on growth performance and carcass composition of Nile Tilapia (Oreochromis niloticus) in pond culture at Alage ATVET collage. MSc. Thesis (Hawassa: Collage of Agriculture, Hawassa University), 64. pp.
Senthilkumar S. (2009). Effect of Brewery Waste on Nutrient Digestibility of Paddy Straw Based Diet in Lactating Cows. Ph.D. Thesis (Mannuthy, Thrissur (KAU: College of Veterinary and Animal Sciences), 242. p.
Shapiro B. I., Gebru G., Desta S., Negassa A., Nigussie K., Aboset G., et al. (2017). Ethiopia livestock sector analysis. International Livestock Research Institute. (Addis Ababa, Ethiopia: International Livestock Research Institute).
Singh G. P., Oosting S. J. (1992). A model describing the energy value of straw. Indian Dairyman XLIV. (New York: Cornell University), 322–327.
Tegegne F., Assefa G. (2010). Feed resources assessment in amhara regional state. Ethiopian Sanitary and Phytosanitary Standards and Livestock Meat Marketing Program (SPS-LMM), (Addis Ababa, Ethiopia: Texas A&M University System).
Tesfay Y. (2010). Feed resources availability in Tigray region, northern Ethiopia, for production of export quality meat and livestock (Ethiopia: Ethiopia Sanitary and Phyto-sanitary Standards and Livestock and Meat Marketing Program (SPS-LMM). USAID).
Tolera A. (2007). Feed resources for producing export quality meat and livestock in Ethiopia, examples from selected Woredas in Oromia and SNNP regional states (Ethiopia: Ethiopia Sanitary and Phytosanitary Standards and Livestock and Meat Marketing Program (SPS-LMM). USAID).
Tolera A. (2008). Feed resources and feeding management: A manual for feedlot operators and development workers (Addis Ababa, Ethiopia: Ethiopia Sanitary and Phyto-Sanitary Standards and Livestock and Meat Marketing Program (SPS-LMM).
Yami A., Woldesemayat Y. (2012). “Chapter 5. Compound feed processing industries in Ethiopia,” in Livestock feed resources in Ethiopia: Challenges, opportunities and need for transformation. Eds. Tolera A., Yami A., Alemu D., (Addis Ababa, Ethiopia: Ethiopian Animal Feed Industry Association) 58–72.
Keywords: agro-industrial byproducts, availability, brewery spent grain, compound feeds, distribution, distillery byproducts
Citation: Feyisa T, Tolera A, Nurfeta A, Balehegn M and Adesogan A (2024) Availability, distribution and quality of agro-industrial byproducts and compound feeds in Ethiopia. Front. Anim. Sci. 5:1408050. doi: 10.3389/fanim.2024.1408050
Received: 27 March 2024; Accepted: 28 June 2024;
Published: 16 July 2024.
Edited by:
Uchenna Anele, North Carolina Agricultural and Technical State University, United StatesReviewed by:
Mayra A. D. Saleh, University of the Azores, PortugalJoel Alabi, North Carolina Agricultural and Technical State University, United States
Copyright © 2024 Feyisa, Tolera, Nurfeta, Balehegn and Adesogan. This is an open-access article distributed under the terms of the Creative Commons Attribution License (CC BY). The use, distribution or reproduction in other forums is permitted, provided the original author(s) and the copyright owner(s) are credited and that the original publication in this journal is cited, in accordance with accepted academic practice. No use, distribution or reproduction is permitted which does not comply with these terms.
*Correspondence: Tesfaye Feyisa, dGVzZmF5ZS5mZXlpc2FAZ21haWwuY29t