 Pieter W. Knap
- Genus-PIC, Isernhagen, Germany
The requirements for standardized ileal digestible (SID) lysine due to lean tissue growth rate (LTGR) in growing-finishing pigs were quantified on the basis of data from the literature. The same was done for those requirements due to LTGR; protein deposition in mammary tissue, uterine tissue, fetal tissue and placental tissue; and colostrum and milk protein synthesis in gestating and lactating sows. These processes were expressed in terms of LTGR, litter size, piglet birth weight, preweaning survival rate, litter weaning weight and teat number. The 2013--2023 genetic trends of those traits in the PIC-L02, PIC-L03, PIC-L65 and PIC-L800 populations were estimated and converted to genetic trends in lysine requirements. On this basis, the daily SID lysine requirement of Camborough (i.e., PIC-L02 × PIC-L03) sows increases by 0.47 g/d (i.e., by 2% of the current mean level) per year: 0.10 g/d per year and 0.37 g/d per year for gestational and lactational processes, respectively. The daily SID lysine requirement of growing-finishing progeny of Camborough sows and either PIC-L65 or PIC-L800 boars increases by 0.09 g/d (i.e., by 0.6% of the current mean level) per year.
Introduction
Livestock breeding leads to long-term quantitative changes in the energy and protein metabolism of the various livestock species, which are associated with long-term increases in traits such as milk production (cattle), egg production (poultry), meat production (cattle, poultry, pigs) and reproduction (poultry, pigs). Such increasing productivity levels must logically be supported by an adequate supply of energy and protein from the feed; it follows that the nutrient requirements of these livestock species will change over time, due to genetic trends in production traits. However, livestock nutrition and livestock genetics are often more or less disconnected disciplines and as a consequence, such changes are rarely quantified; early examples to the contrary include Wiesemüller (1980: “Selection for leaner types of pigs is associated with a more sustained daily lean tissue growth and consequently with an increase in the daily lysine requirement”) and Lenis and Metz (1984). More recently, the simulation models of the National Research Council (2012, p. 128) “characterize pig types (genotypes and gender)” by their level of protein deposition, and let these types influence energy intake, maintenance energy requirements, and phosphorous requirements. Another such model is InraPorc (Van Milgen et al., 2008); this model can be calibrated to a particular pig genotype based on repeated observations of body weight, ad libitum feed intake, and diet composition, and then it estimates that genotype’s lysine requirements. Interestingly, Brossard et al. (2019) applied this method to indigenous European breeds that were never exposed to serious genetic selection; the estimated lysine requirements are considerably lower than those recommended by NRC (1979) for “modern” genotypes of about 50 years ago as shown in Figure 1, where we also present more recent recommendations published in 2008, 2012, 2016 and 2022; we believe that such a disconnected approach does not properly reflect the continuous character of genetic change in pigs. Therefore we focus here on the continuous changes over time in the protein requirements of growing-finishing pigs and reproductive sows due to genetic trends in the production traits that pigs are typically selected for. The focus is on protein because this is the most costly component of the typical pig diet; for example, across the eight diets that we at PIC feed to our pigs from the post-nursery stage to mature sows and boars, the feed price correlates much more strongly to the crude protein content (+0.90) than to fiber (–0.77), fat (+0.18), energy (+0.69) or even minerals (+0.88). Animal protein requirements (and feed protein content) are commonly specified in terms of the essential amino acids, of which lysine is the first limiting one in pig production; the other ones are usually specified in terms of a proportion of lysine requirement (or content). Lysine is by far the most intensively studied amino acid in this field; for example, NRC (2012) based their recommendations on 42 trials focusing on lysine versus 1, 1, 11, 1, 19, 13, 19 and 7 trials focusing on arginine, histidine, isoleucine, leucine, methionine, threonine, tryptophan and valine, respectively. Of course, changes in the requirements for other essential nutrients can be modeled the same way. The equations developed here are summarized in Table 1; they were preferably sourced from NRC (2012), and from other sources when these provide a better match to performance traits that feature in PIC’s breeding goals so that we can estimate their genetic trends.
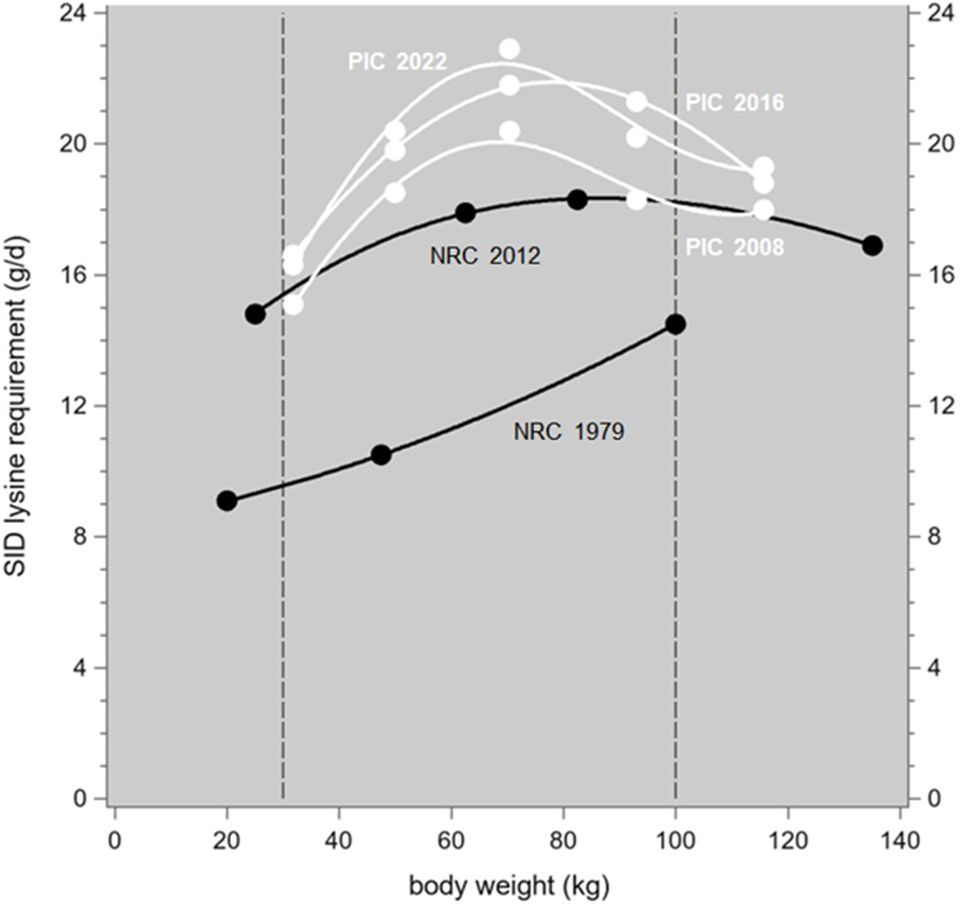
Figure 1. Daily SID lysine requirements of growing-finishing pigs as recommended by NRC (1979, 2012; black) and PIC (2008, 2016, 2021; white), in relation to body weight. Averages of the g/d values recommended for females and castrated males, where required converted from a lysine per metabolizable energy (ME) ratio assuming 3.3 MJ ME per kg feed. The trendlines are spline interpolation plots; the dashed vertical reference lines indicate the body weight trajectory analyzed in the text.
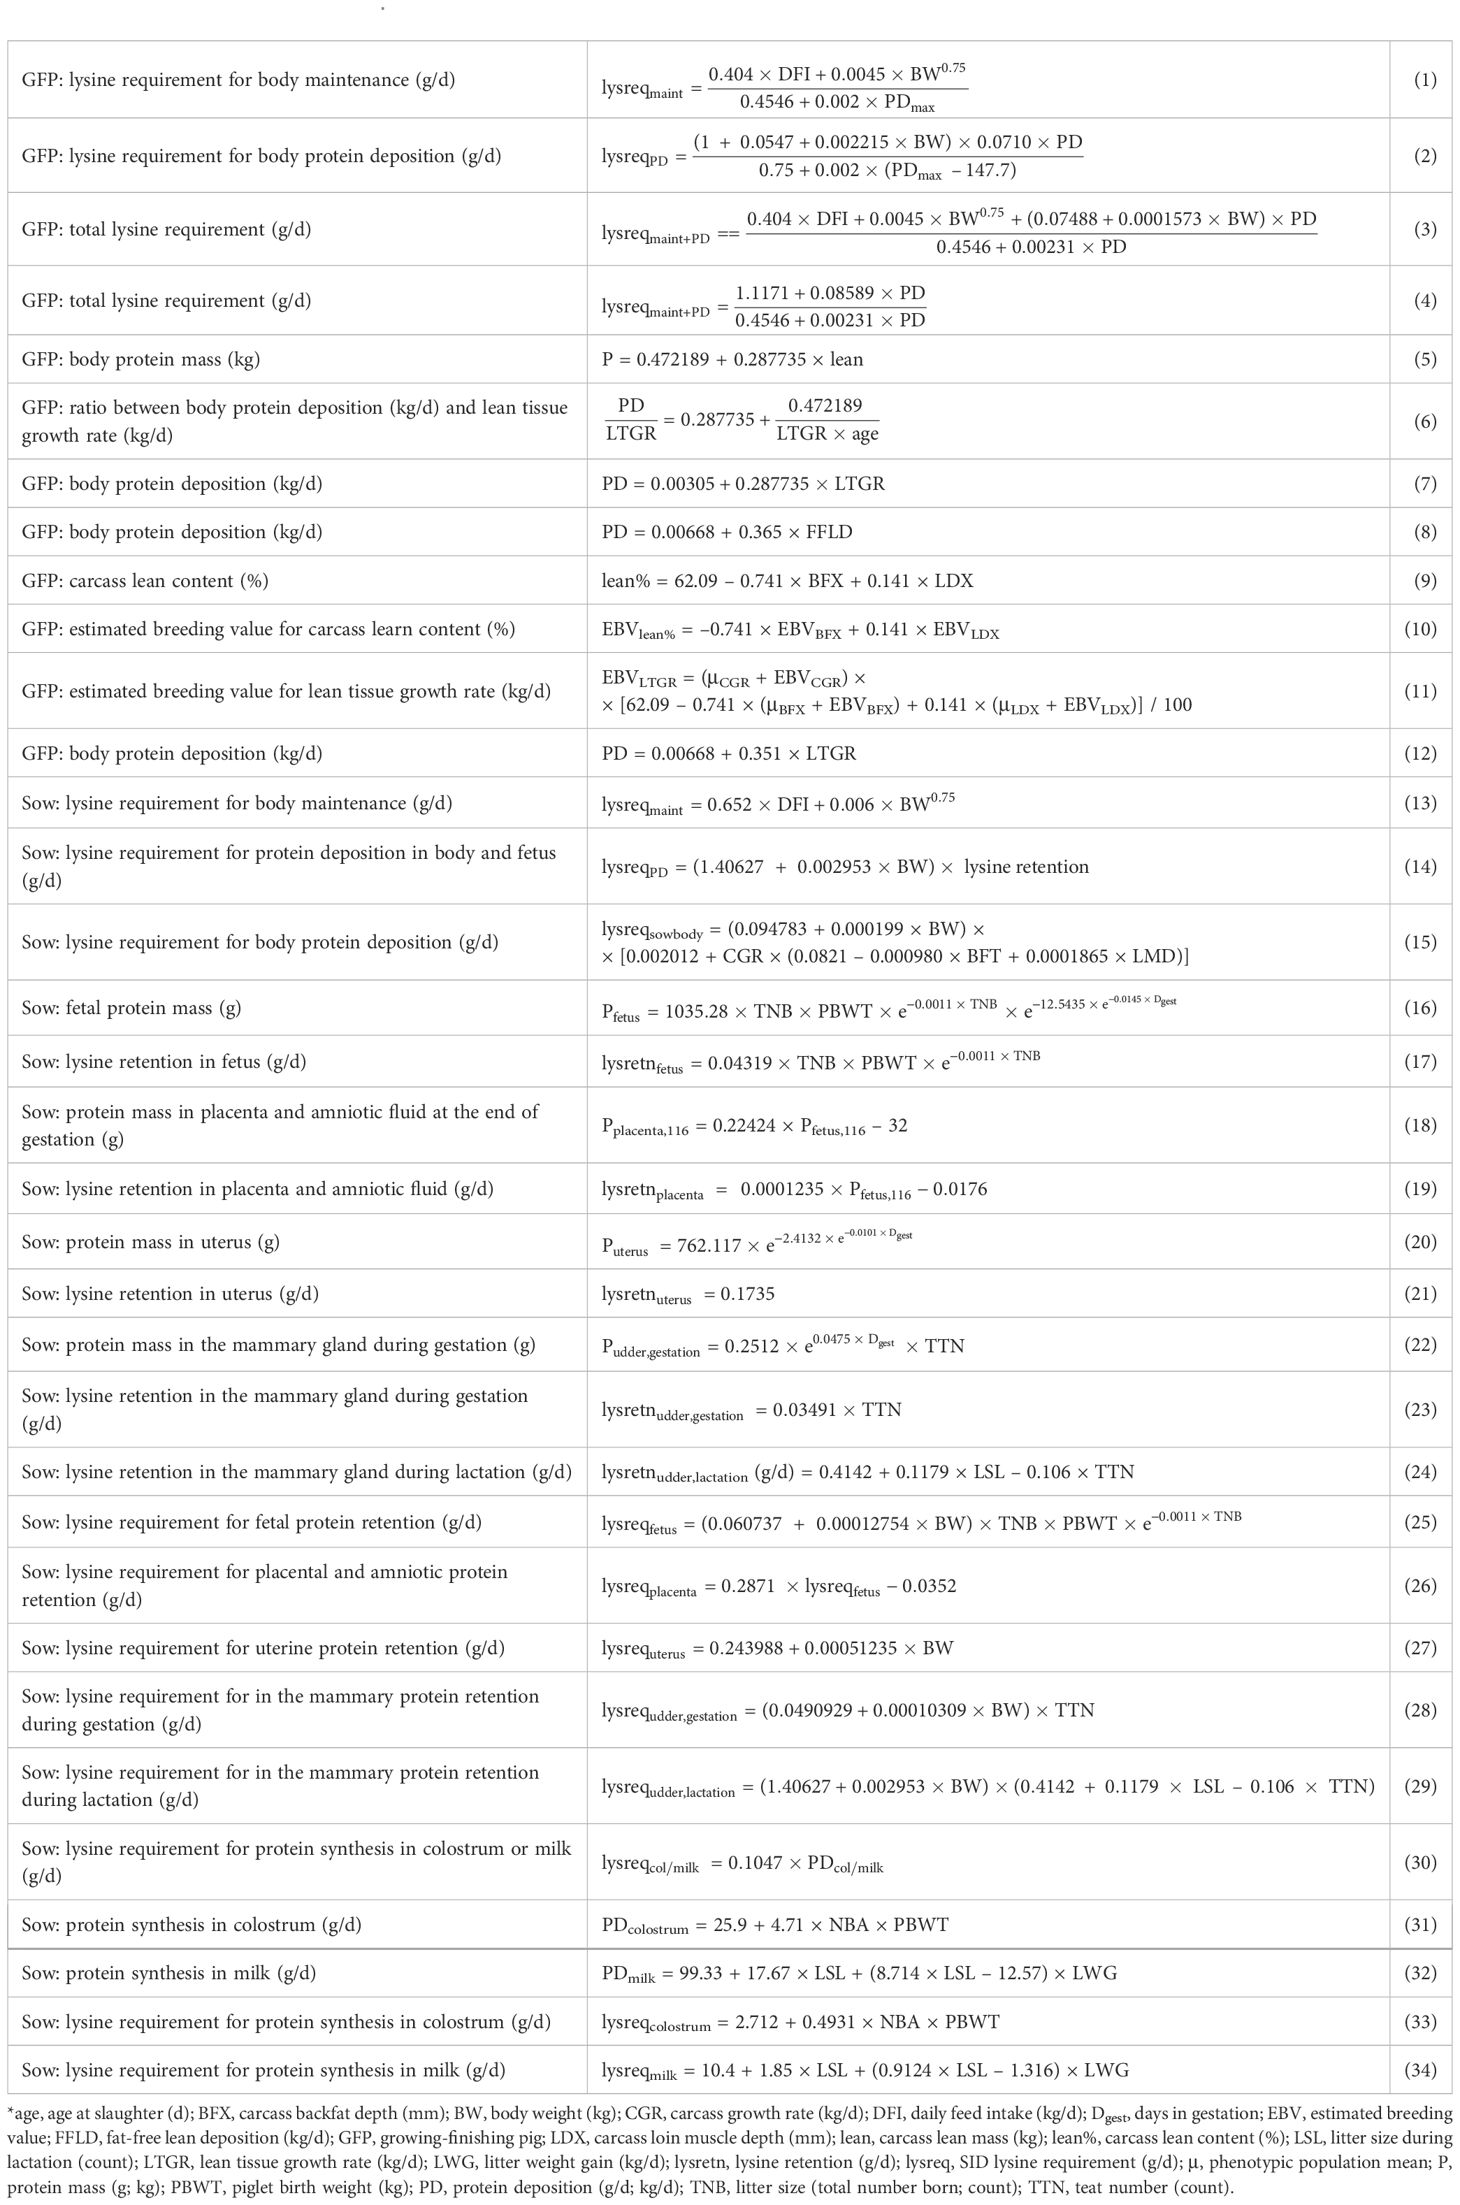
Table 1. Equations used in this study*.
Materials and methods
Growing-finishing pigs
The protein requirements of growing-finishing pigs follow from body maintenance and body protein deposition. The National Research Council (NRC, 2012, Equations 8-42 and 8-44) models these requirements in terms of the daily standardized ileal digestible (SID) lysine requirements (g/d), as follows.
Body maintenance
For body maintenance, to restore body protein losses from the gastro-intestinal tract (GIT) and the integument (i.e. skin and hair), the SID lysine requirement (in g/d) is:
For the numerator, “basal endogenous lysine losses recovered at the terminal ileum have been estimated at 0.417 g per kg of feed dry matter intake; these losses have been related to feed intake, assuming 88 % feed dry matter, and to whole-GIT losses, assuming that large intestinal losses represent 10 % of GIT losses recovered at the ileum […]. Integument lysine losses have been estimated at 4.5 mg per kg of BW0.75.”
For the denominator, “inevitable plus minimum lysine catabolism is assumed to be 25 % of SID lysine intake, equivalent to a 0.75 efficiency of SID lysine utilization to support [these] losses. This efficiency […] increases with improvements in pig performance potential. For every [gram per day] increase in PDmax, relative to the typical mean value for gilts and barrows [which was set at PDmax = 147.7 g/d], the rate of […] catabolism is reduced by 0.002” (i.e. by 0.2 %).
This 2012 approach replaces the one of NRC (1998) that quantified these maintenance requirements (g/d) as 0.036 × BW0.75. In the new approach, “by specifically identifying the maintenance amino acid requirements associated with skin and hair losses and endogenous intestinal losses, the substantial contribution of [the latter] is represented more explicitly”.
Body protein deposition
For whole-body protein deposition (PD, in g/d), the SID lysine requirement (in g/d) is:
The denominator is the same as that in Equation 1. For the numerator, “it is assumed that PD contains 7.10% lysine. [… ] The marginal efficiency of lysine utilization declines with BW.” This declining efficiency was estimated as 0.682 and 0.568 at 20 and 120 kg BW, respectively — equivalent to a proportional increase in the lysine requirement of 0.0990 and 0.3205, respectively. The term 0.0547 + 0.002215 × BW in Equation 2 is the linear regression through these values.
This 2012 approach replaces the one of NRC (1998) that quantified these deposition requirements (g/d) as 0.12 × PD; in Equation 2, this would hold, for example, for a pig with PDmax = 150 g/d and BW = 99.6 kg.
In our target nutritional environment, protein deposition is never constrained, so that the pig’s genetic potential is always fully expressed; PD across the 20–120 kg body weight trajectory would then be a function of PDmax. Supplementary Material S1 shows that the average PD across that growing period is 87% of PDmax, or vice versa PDmax = 1.155 × average PD. The total SID lysine requirement (in g/d) of a growing pig between 20 and 120 kg body weight is then as follows:
In this 20 to120 kg body weight trajectory, the average BW is 70 kg, the average BW0.75 (following Foster et al., 1983) is , and the average DFI is typically approximately 2.5 kg/d. With that, Equation 3 works out as:
The next step is to quantify PD (and more specifically, its genetic trend) in real-life pigs. Outside laboratory conditions, actual large-scale measurement of PD is prohibitively difficult; a more realistic alternative is to estimate it from lean tissue growth rate (LTGR) – which in turn will be derived from body growth rate and from backfat and loin muscle depth.
PD and LTGR: Mohrmann & Landgraf
Mohrmann et al. (2006, their Figure 2) relate lean mass (in kg) to protein mass in the soft tissue (Psoft, in kg; “soft tissue” is the whole body including skin and excluding bones, blood and the thoracic and abdominal viscera) of growing pigs from 20 to 120 kg body weight as (r=0.98; conversely, Psoft = 0.202 × lean1.019). Using the same data, Landgraf et al. (2006, their Table 2) listed the weights and protein contents of soft tissue, viscera and bones; whole-body protein mass (P, in kg) can be calculated from these weights and can then be related to lean mass, as estimated from Psoft with Mohrmann’s prediction equation described above. This gives
The ratio between lifetime whole-body protein deposition (PD, in kg/d) and the lifetime lean tissue growth rate (LTGR, in kg/d) is then as follows:
…with age at slaughter in days, carcass weight CWT in kg, lifetime carcass growth rate CGR in kg/d, and lean in kg; leanprop is lean as a proportion of carcass weight.
Equation 6 can be rearranged to relate PD to LTGR. With age = 155 d this gives
These pigs had an average MRI-estimated LTGR of 0.380 kg/d from 20 to 120 kg BW; on the basis of data from Mitchell et al. (2012) on the body weight and body composition of neonate piglets, the LTGR from 2 to 120 kg BW of Mohrmann & Landgraf’s pigs can then be extrapolated as 0.252 kg/d, i.e., 0.663 times the 20 to 120 kg value.
PD and LTGR: schinckel
Schinckel et al. (1996) related whole-body protein deposition (PD, in kg/d) to body weight (BW, in kg) and fat-free lean deposition (FFLD, in kg/d) in growing pigs from 25 to 152 kg body weight via an extension of Kanis and Koops (1990) nonlinear statistical model:
This can be rearranged as a convoluted main-effects-and-interaction model with eight parameters to be estimated:
…with
and
Averaged across a 20 to 120 kg BW trajectory and across female and castrated male pigs, Schinckel’s [a, b, c, d, e, f, g, h] estimates work out as
Schinckel’s pigs had an average FFLD of 0.283 kg/d from 20 to 120 kg BW; with the 0.663 extrapolation factor derived from Mohrmann & Landgraf’s data this translates as LTGR = 0.188 kg/d from 2 to 120 kg BW.
PD and LTGR: application
We used backfat and loin muscle depth (BFX and LDX, as measured in mm on the carcass by equipment such as FOM) records from 62,434 pigs slaughtered after 2020 to calculate the carcass lean content as predicted by the commercial prediction equations used routinely in each of ten countries (Pig Improvement Company (PIC), 2022, their Table 3.1). These ten predicted lean content values were then averaged by animal, and the average was regressed on BFX and LDX. This gives our average “worldwide” prediction equation to convert carcass backfat and loin muscle depth (in mm) to carcass lean content (in %):
…and from there, in terms of estimated breeding values (EBVs):
This can then be combined with the EBV for the lifetime carcass growth rate (EBVCGR, in kg/d) to derive the EBV for the LTGR (in kg/d), as follows:
…where the μ… terms are the phenotypic population means (i.e., line means) of the traits, calculated across a useful period such as the most recent 12 months. EBVCGR, EBVBFX and EBVLDX have zero population means, whereas EBVLTGR does not.
Adjustments for intramuscular fat content
The commercial prediction equations that led to our Equations 9 and 10 were derived by regressing dissected lean mass on backfat and loin muscle depth. This dissected lean mass includes intramuscular fat (IMF), which raises the question of the extent to which the carcass lean elements in our Equations 5 and 7 (due to Mohrmann & Landgraf) and (8) (due to Schinckel) may be biased because IMF was excluded there but is implicitly included in our Equation 11.
Mohrmann et al. (2006) estimated the lean content of their pigs via in vivo IMR. Kongsro and Gjerlaug-Enger (2013) used a similar technique (computer tomography: CT) on pigs with 0.44 to 3.23% chemically determined IMF in the loin muscle (a very wide range) and concluded that “CT is not a feasible method for in vivo prediction of intramuscular content”, mainly because their pigs, although sedated for the scan, still moved enough to make the equipment’s resolution inadequate for detecting the IMF. Therefore, Mohrmann’s lean tissue readings most likely include the IMF and there is no bias to adjust for in Equation 7.
Schinckel’s “carcass fat-free lean mass” was obtained as the sum of the fat-free lean masses of (i) ham, (ii) loin, (iii) butt, (iv) picnic, and (v) the combined rest of the carcass. In this respect, “fat-free lean” means that the actually dissected gross lean mass of components (i) to (iv), and the actually dissected lean plus adipose tissue mass of component (v), were adjusted for their respective adipose tissue content, which was due to imperfect dissection of the lean tissue, especially in component (v), where this was deliberate. For this adjustment, (vi) the chemically determined lipid mass in the dissected gross lean parts of components (i) to (iv), and in the dissected lean plus adipose tissue part of component (v), were divided by (vii) the chemically determined lipid proportion of all the dissected subcutaneous plus intermuscular adipose tissue; this gives estimates of adipose tissue mass, which were then subtracted from (viii) the dissected gross lean (or lean plus adipose) mass of each component: (viii) – (vi) / (vii). Unfortunately, none of these intermediate values are reported in the Schinckel et al. (1996) article. This dissection separated the gross lean of components (i) to (iv) from subcutaneous and intermuscular adipose tissue; any such adipose residue missed by the dissection (and the large amount of adipose tissue that was deliberately retained in component (v)) would have been dealt with by the abovementioned “fat-free” adjustment. This adjustment will also have subtracted the IMF content, which is typically approximately 2% in the ham and loin muscles, 4% in the shoulder muscles (D’Souza et al., 2002; Font i Furnols et al., 2019) and much higher than that in the muscles of component (v). Assuming 2, 2, 4 and 7% IMF in those muscle groups, respectively, and applying lean distribution values from Pulkrábek et al. (2006, their Tables 1, 2), the overall (adjusted-out) IMF content of the dissected carcass lean in Schinckel’s pigs would have been approximately 4%. Hence, the application of Equation 7 to LTGR values based on a lean prediction that was not adjusted for the IMF (as in Equation 8) would overestimate the PD, so the regression coefficient of Equation 8 should be reduced to 0.365 / 1.04 = 0.351:
Summary
This leads to the following steps:
1. Convert carcass BFX and LDX to carcass lean content: Equation 9
2. Combine carcass lean content and lifetime growth rate into the lifetime LTGR: Equation 11
3. Convert lifetime LTGR to lifetime whole-body PD: Equations 7 or 12
4. Convert lifetime whole-body PD to the lifetime lysine requirements: Equation 4
5. Quantify the genetic trends.
Gestating and lactating sows
Figure 2 shows the lysine partitioning patterns during late gestation and lactation, as modeled by Feyera and Theil (2017, their Figure 4B). In this model, body weight growth in the final weeks of gestation is assumed to be absent; this does not agree with the body protein deposition measurements of Miller et al. (2016, 2017) as shown in our Figure 3. Nevertheless, these patterns are usefully illustrative.
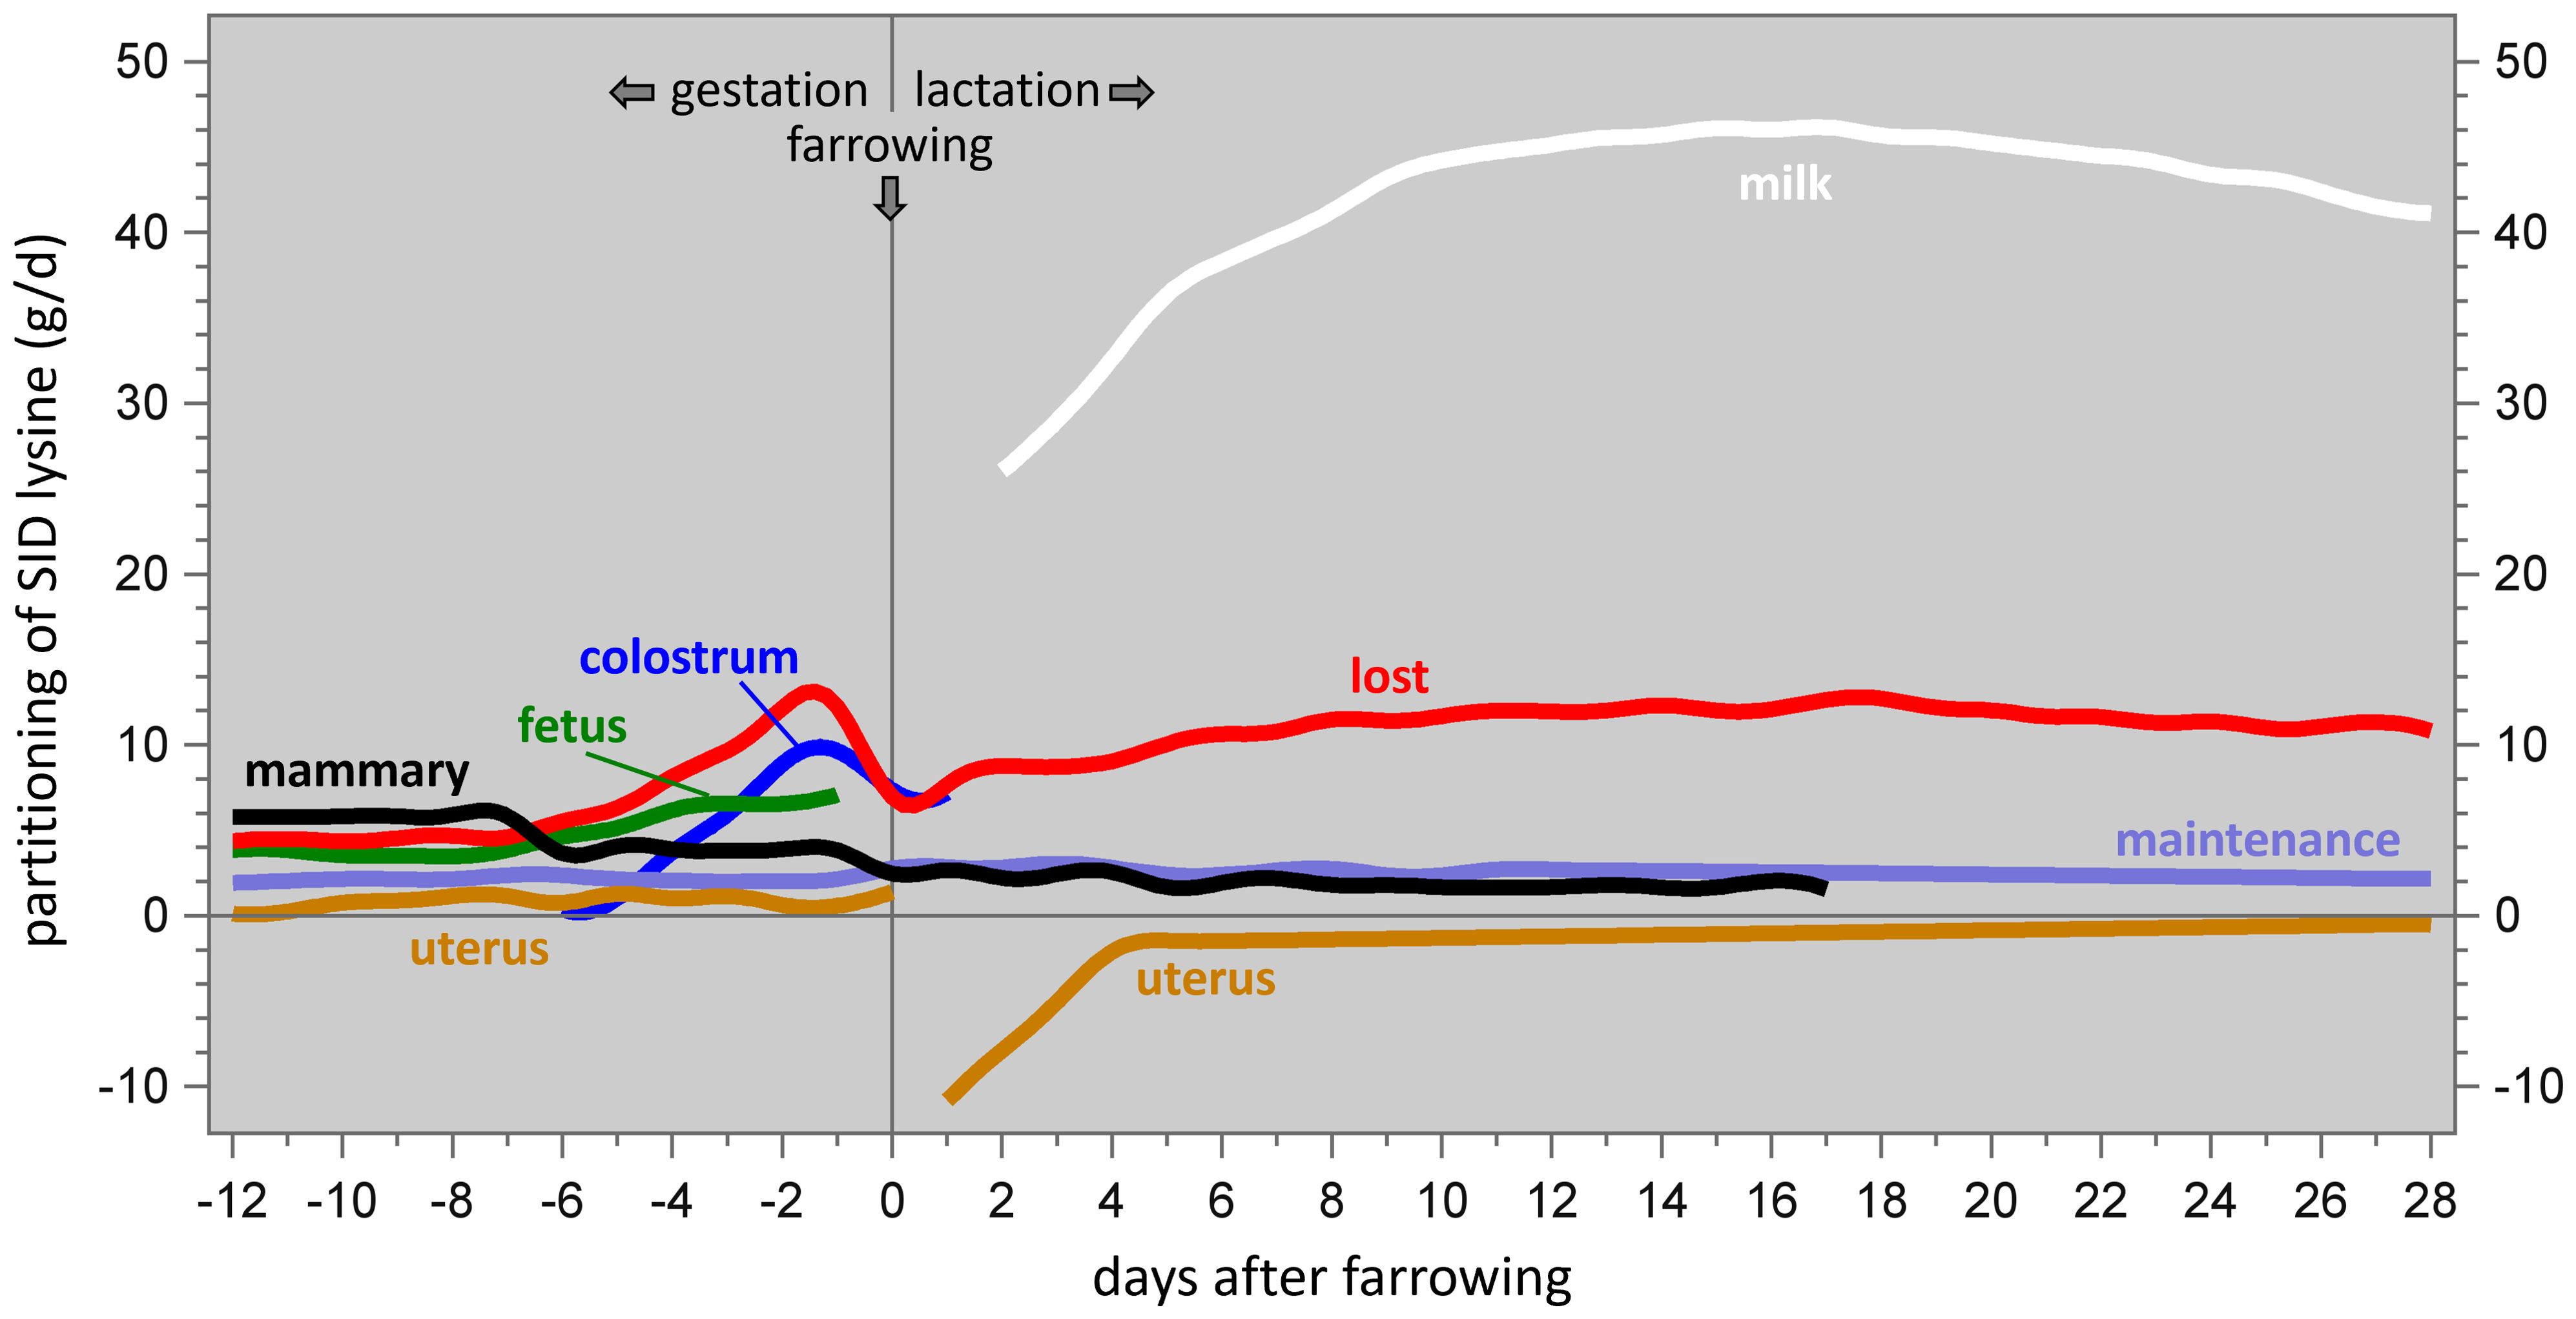
Figure 2. Partitioning of dietary SID lysine among the protein requirements for sow body maintenance, mammary tissue growth, uterine growth, fetal growth, colostrum production, milk production, and oxidation/transamination (i.e. lost for the purpose of protein synthesis), in sows in late gestation or in lactation. Data from Feyera and Theil (2017).
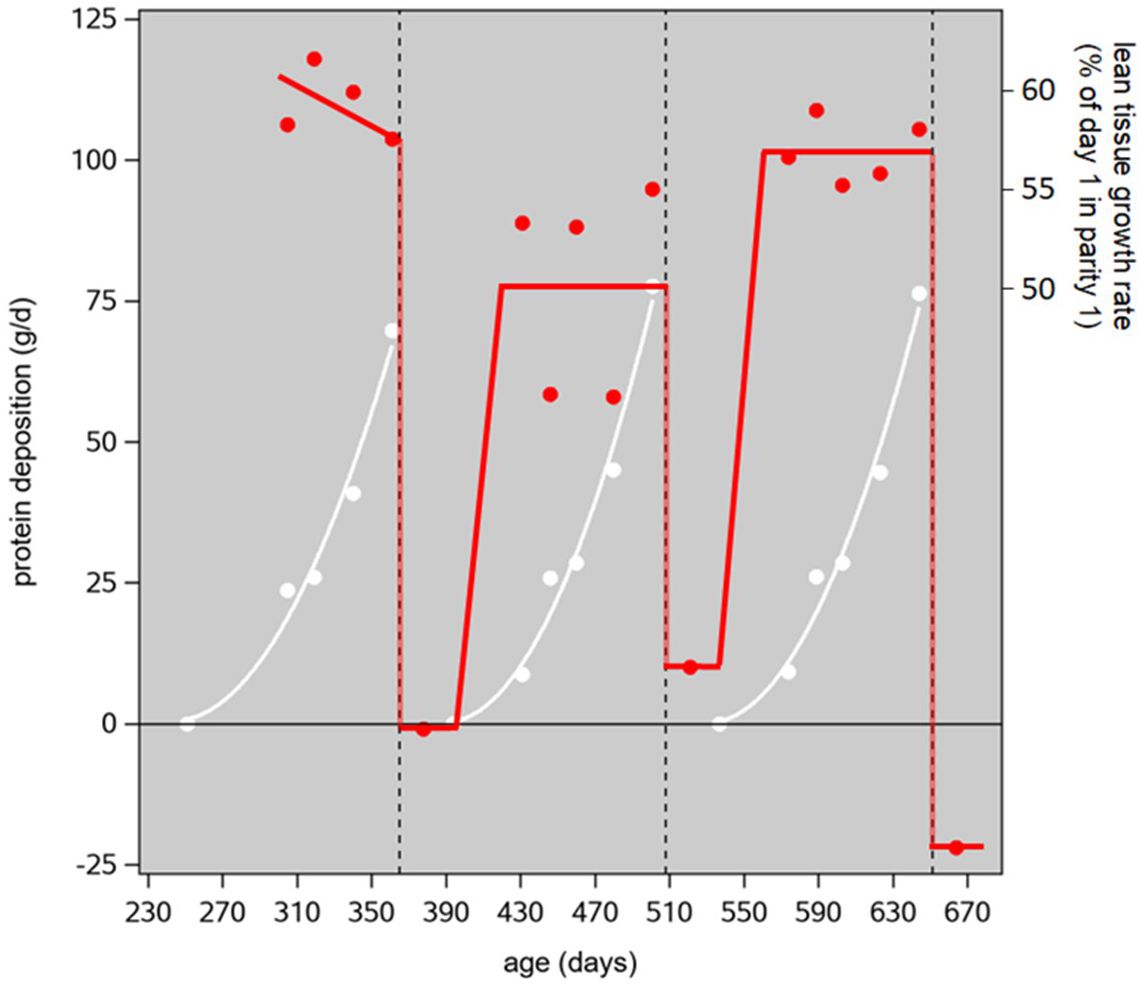
Figure 3. Protein deposition (PD) in the nonreproductive parts of the sow's body (red) and in the uterus and its contents and the mammary glands (white). The data points are from Miller et al. (2016, 2017); the trendlines are our interpolations through them. The vertical reference lines indicate the days of farrowing, based on first farrowing at 365 days of age, 116 days gestation, 22 days of lactation, and a 7-day weaning-mating interval. The secondary vertical axis gives the associated lean tissue growth rate (LTGR) as a percentage of the momentary LTGR on day 1 of parity 1 (first mating); because the conversion from PD to LTGR was based on data recorded from 20 to 120 kg body weight, the conversion equation holds a nonzero intercept, and this gives unrealistic LTGR values at PD levels close to zero. Hence, this axis is not valid below values of, say, 40 g/d.
Body maintenance
For body maintenance, to restore body protein losses from the gastrointestinal tract (GIT) and the integument (i.e., skin and hair), the SID lysine requirement of sows is given by NRC (2012, p. 139) as a simplification of our Equation 1 for growing-finishing pigs:
Across a 200 to 300 kg body weight trajectory, the average BW0.75 (following Foster et al., 1983) is , and the average DFI is typically approximately 2.75 kg/d (PIC, 2016, Table J1 and Figure I7; Lavery et al., 2019). With that, Equation 13 works out as lysreqmaint = 2.2 g/d.
Tissue deposition
In general terms, the SID lysine requirements for protein deposition (PD) in the nonreproductive parts of the sow’s body, in the uterus and the mammary glands (not the milk), in the fetus, and in the placenta and amniotic fluid are given by NRC (2012, p. 139) as a simplification of our Equation 2 for growing-finishing pigs:
To calculate the lysine retention for each tissue, the lysine content of the tissue’s protein can be combined with that tissue’s PD. Tables 2–11 of NRC (2012) gives lysine contents of 6.74% of body protein, 6.92% of uterine protein, 6.55% of mammary gland protein, 4.99% of fetal protein, and 6.39% of placental and abdominal fluid protein.
Body protein deposition
As in growing-finishing pigs, body protein deposition in sows can be quantified in terms of the lean tissue growth rate (LTGR, in kg/d). Equations 6, 7 and 12 for growing-finishing pigs can be scaled to the sow level as follows.
Miller et al. (2017) measured whole-body PD during gestation (days 31 to 112) in Canadian Yorkshire sows of parities 1, 2 and 3 at 0.110, 0.078 and 0.102 kg/d, respectively. This can be converted to the LTGR, following Supplementary Material S2; this gives the LTGR of Miller’s sows during gestation (days 31 to 112) in parities 1, 2 and 3 as 0.185, 0.156 and 0.178 kg/d, respectively.
Routine recording of the traits that constitute LTGR in pigs takes place during performance testing, typically at 100 to 130 kg liveweight, but the PD (or LTGR) of Miller’s sows at that stage was not reported (and was probably not recorded). This is unfortunate because it would have made it possible to relate the gestational LTGR to the performance test LTGR in Miller’s animals and, from there, to other genotypes. Therefore, we need an approximation, following Supplementary Material S3.
Canadian Yorkshire gilts that were performance tested (at 100 kg liveweight) in 2015 had an average lifetime liveweight growth rate (LWGR) at 0.613 kg/d and 10.2 and 62.5 mm BFP and LDP, respectively (Appendix 7 of CCSI, 2016). Substituting those values into equation (B4) of Supplementary Material S3 gives a 100-kg lifetime LTGR of 0.265 kg/d. The momentary LTGR on the day of first mating at approximately 125 kg live weight can be estimated from this value (following Supplementary Material S1) as 1.17 × 0.265 = 0.309 kg/d. Taking this as the base level (100%) on day 1 of parity-1 gestation, the abovementioned gestational LTGR levels (days 31 to 112 in parities 1, 2 and 3) of Miller’s sows work out as 0.185 kg/d = 60%, 0.156 kg/d = 50% (increasing from zero on day 1), and 0.178 kg/d = 58% (increasing from 0.01 kg/d = 3% on day 1) of the first-mating base level, respectively. This pattern is illustrated, with some rounding errors, in Figure 3. The average value of the red trendline, from the first mating at 249 days of age to the third mating at 683 days, represents 41.4% of the base-level LTGR.
The realized genetic trend of LTGR during the grower−finisher stage in Camborough is shown in Figure 4: a stable linear increase in dLTGR = 0.00267 kg/d per year since 2017. To work back from the LTGR to the whole-body PD, we use the equation of above: PD = 0.00486 + 0.3194 × LTGR. This indicates a genetic trend in Camborough’s whole-body protein deposition rate of dPD = 0.00486 + 0.3194 × 0.00267 = 0.0057 kg/d additional protein deposition in the grower-finisher stage per year. Adopting the PD pattern of Figure 3 and its percentwise consequences for Camborough sows, this gives an annual increase in the parity-1 to parity-3 (434 days) body protein deposition rate of dPDsowbody = 0.414 × 0.0057 = 0.00237 kg/d: that is the annual increase in the average daily protein deposition rate in the nonreproductive parts of the sow's body due to the current genetic trends in the grower-finisher LTGR in PIC-L02 and PIC-L03.
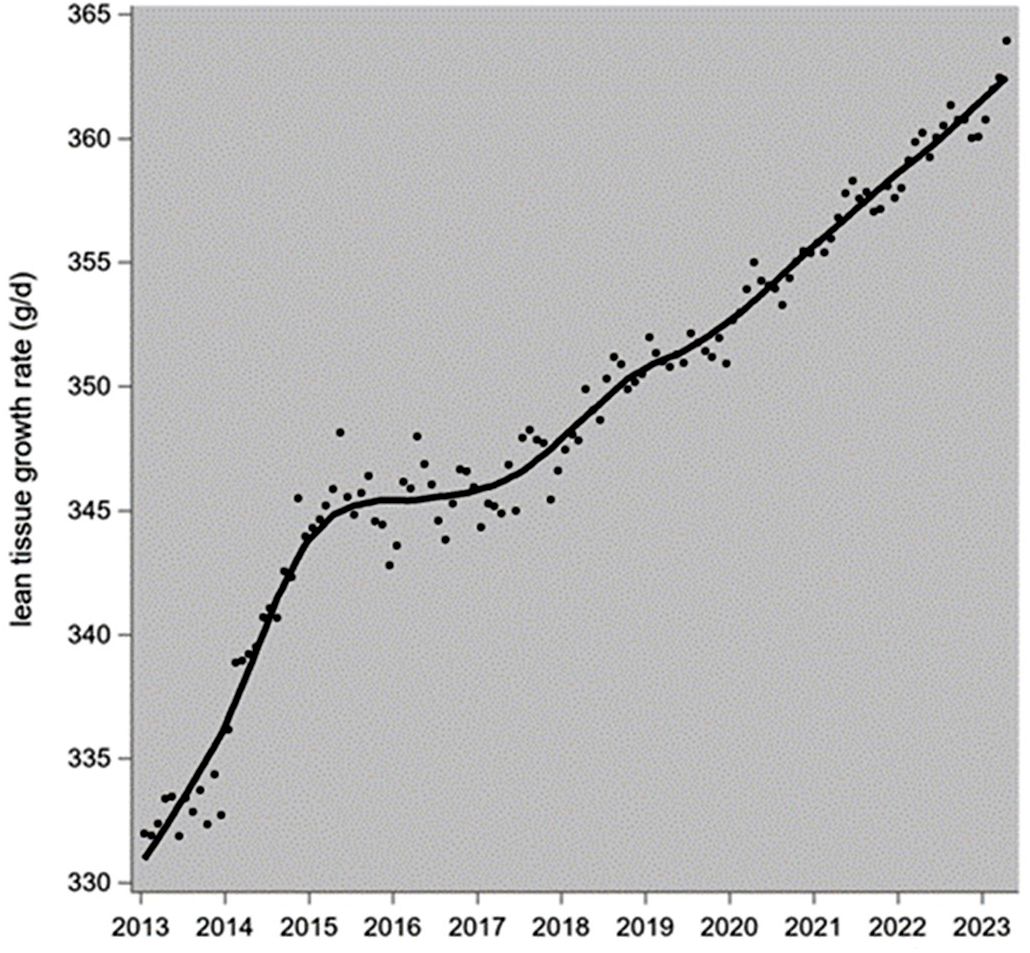
Figure 4. Genetic trend of the lean tissue growth rate during the grower-finisher stage in PIC-Camborough pigs. The data points are monthly averages, and the trendline is a LOESS plot.
The average daily body lysine retention (lysretn, in g/d) across multiple parities is then 0.0674 × PDsowbody, and the associated SID lysine requirement follows from substitution into Equation 14 as
Fetal protein deposition
Fetal protein mass is predicted by Equations 8-56 and 8-58 of NRC (2012) as follows:
…where TNB is litter size (total number born), PBWT is individual piglet birth weight (in kg), and Dgest is the number of days in lactation, from 1 to 116.
The average daily fetal lysine retention (lysretn, in g/d) throughout gestation can then be estimated by evaluating Equation 16 for Dgest=116 (ignoring the Dgest=1 entry because it is so much smaller than the Dgest=116 one), dividing through 116, and multiplying by the lysine content of 0.0499. This gives:
Placental protein deposition
The protein mass in the placenta and amniotic fluid (Pplacenta) can usefully be related to the fetal protein mass Pfetus of Equation 17. Equation 8-57 of NRC (2012) goes back to Noblet et al. (1985) who measured both these pools and analyzed their course over time with the number of viable fetuses and the sow’s energy intake as covariables. The regression equations below their Table 6 can be used to predict Pfetus at 116 days of gestation (Pfetus,116) and the associated Pplacenta,116 for variable values of TNB; these two predictions relate linearly to each other as in Equation 18:
The associated average daily lysine retention throughout gestation can then be estimated in a similar way as lysretnfetus by dividing Pplacenta,116 through 116, and multiplying by the lysine content of 0.0639. In terms of Pfetus,116 this gives:
Uterine protein deposition
Uterine protein mass is predicted by Equation 8-59 of NRC (2012) as follows:
The average daily uterine lysine retention throughout gestation can then be estimated via Equation 20 for Dgest=1 and Dgest=116, subtracting, dividing through 116, and multiplying by the lysine content of 0.0692. This gives:
Mammary gland protein deposition
The parenchymal protein mass in the mammary glands at Dgest days in gestation can be estimated from Table 2 of Ji et al. (2006):
…where TTN is the number of functional teats.
The average daily lysine retention in the mammary glands throughout gestation can then be estimated by evaluating Equation 22 for Dgest=1 and Dgest=116, subtracting, dividing through 116, and multiplying by the lysine content of 0.0655. This gives:
The parenchymal protein mass in the mammary glands during lactation can be estimated as follows. Kim et al. (1999, their Figure 3B) reported the protein mass (g) in the aggregated suckled mammary glands at 21 days in lactation, dependent on how many teats are actually suckled which is determined by litter size during lactation (LSL): Psuckledglands = 132.8 + 37.8 × LSL (R2 = 0.88), where LSL = NBA × (1 – PWM), NBA is the litter size (number born alive) and PWM is the preweaning mortality rate. A nonsuckled gland goes into regression and retains 10 g of protein at the end of lactation (Kim et al., 2001, their Table 2). Their effective number is TTN – LSL. The protein mass of the whole udder at 21 days of lactation is then 132.8 + 37.8 × LSL + 10 × (TTN – LSL) = 132.8 + 27.8 × LSL + 10 × TTN. According to Kim et al. (1999, their Table 1), the corresponding protein mass at the start of lactation (due to the gestational deposition of our Equations 22, 23) is 44 g per gland. Subtracting 44 × TTN, dividing through 21, and multiplying by the lysine content of 0.0655 gives the average daily lysine retention in the mammary glands throughout lactation:
…which may be negative as well as positive.
Summary: tissue protein deposition
Substituting Equations 17, 19, 21, 23 and 24 into Equation 14 gives the average daily SID lysine requirements associated with these protein deposition processes, as in Equations 25 to 29:
Colostrum and milk protein synthesis
The equivalent of Equation 2 for colostrum or milk production follows from Equation 8-76 of NRC (2012):
…where matmob is the amount of body protein mobilized during lactation (g/d); we ignore it here because we are ultimately interested only in the effects of trends in the reproduction traits, and such effects on body protein mobilization are very difficult to model. Hence, Equation 30 overestimates the true lysreqcol/milk; at the same time, any mobilized body protein will have to be replenished during the subsequent gestation, which will increase lysreqsowbody as in Equation 15.
To calculate lysine retention, the lysine content of each protein can be combined with the PD. Table 2 of Yao et al. (2023) gives 7.85% lysine in milk protein and 7.50% lysine in colostrum protein.
Colostrum protein synthesis
Colostrum protein synthesis can be predicted from Tables 1 and 7 of Vadmand et al. (2015): colostrum yield (kg/d) = 1.10 + 0.20 × LBWT, where LBWT is the litter birth weight in kg, calculated as NBA × PBWT. Colostrum contains 16.5% protein; a large proportion of this consists of immunoglobulins, which are synthesized outside the mammary glands during the week before farrowing. Therefore, Pcolostrum (kg) = 0.165 × (1.10 + 0.20 × NBA × PBWT) = 0.1815 + 0.033 × NBA × PBWT. Assuming that this takes place during the final 7 days of gestation, the average daily colostrum protein synthesis in g/d is as follows:
Milk protein synthesis
Milk protein synthesis follows from Hansen et al. (2012): milk production at Dlact days in lactation (Dlact ≥ 2) can be described with a Wood lactation curve (often used for dairy cows: MDlact = α × Dlactβ × e –λ × Dlact); its parameters α, β and λ can be quantified in terms of litter size and litter weight gain; Supplementary Material S4 provides more detail. The milk protein content (%) is 4.71 + 4.43 / Dlact + 0.07 × (CPfeed – 15.9); CPfeed is the CP content of the feed (%). Assuming a feed with CPfeed = 15.9 %, the resulting patterns are illustrated in Figure 5; the associated prediction equation for total sow milk protein synthesis from day 2 in lactation to weaning at 22 days is Pmilk (kg) = 2.086 + 0.371 × LSL + (0.183 × LSL – 0.264) × LWG. The final term LWG = (LWWT – NBA × PBWT) / 22 is the average litter weight gain (kg/d), with LWWT as the litter weaning weight (kg/d). The average daily milk protein synthesis (in g/d) from days 2 to 22 of lactation is then
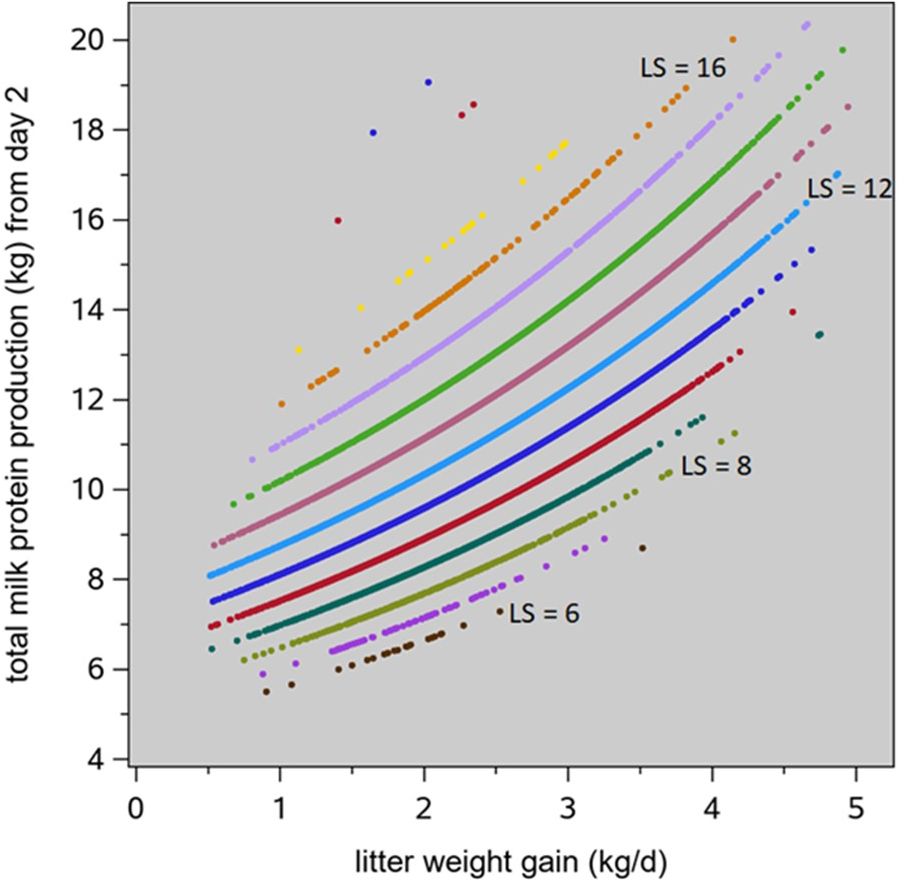
Figure 5. Total milk protein production from days 2 to 22 in lactation, in relation to litter weight gain and litter size (LS), based on the basis of the prediction equations of Hansen et al. (2012).
Substituting Equations 31 and 32 into Equation 30 gives the average daily SID lysine requirements associated with these protein synthesis processes:
…where LSL = NBA × (1 – PWM) and LWG = (LWWT – NBA × PBWT) / 22.
Results
Growing-finishing pigs
The genetic trends of CGR, BFX and LDX in progeny from PIC-Camborough dams and PIC-L65 or PIC-L800 sires (shown in Figure 6) were converted into genetic trends of LTGR according to Equation 11, substituting the μCGR, μBFX and μLDX means of animals harvested in 2022 shown in Table 2.
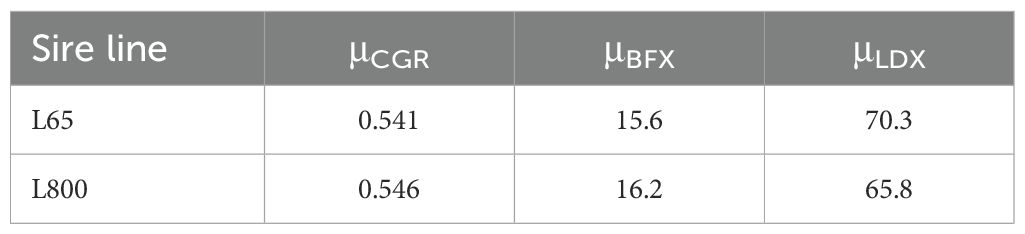
Table 2. Mean values for carcass growth rate (CGR, kg/d), backfat depth (BFX, mm) and loin muscle depth (LCX, mm) in growing-finishing pigs descending from two sire lines, as used to estimate the genetic trends of lean tissue growth rate in Equation 11.
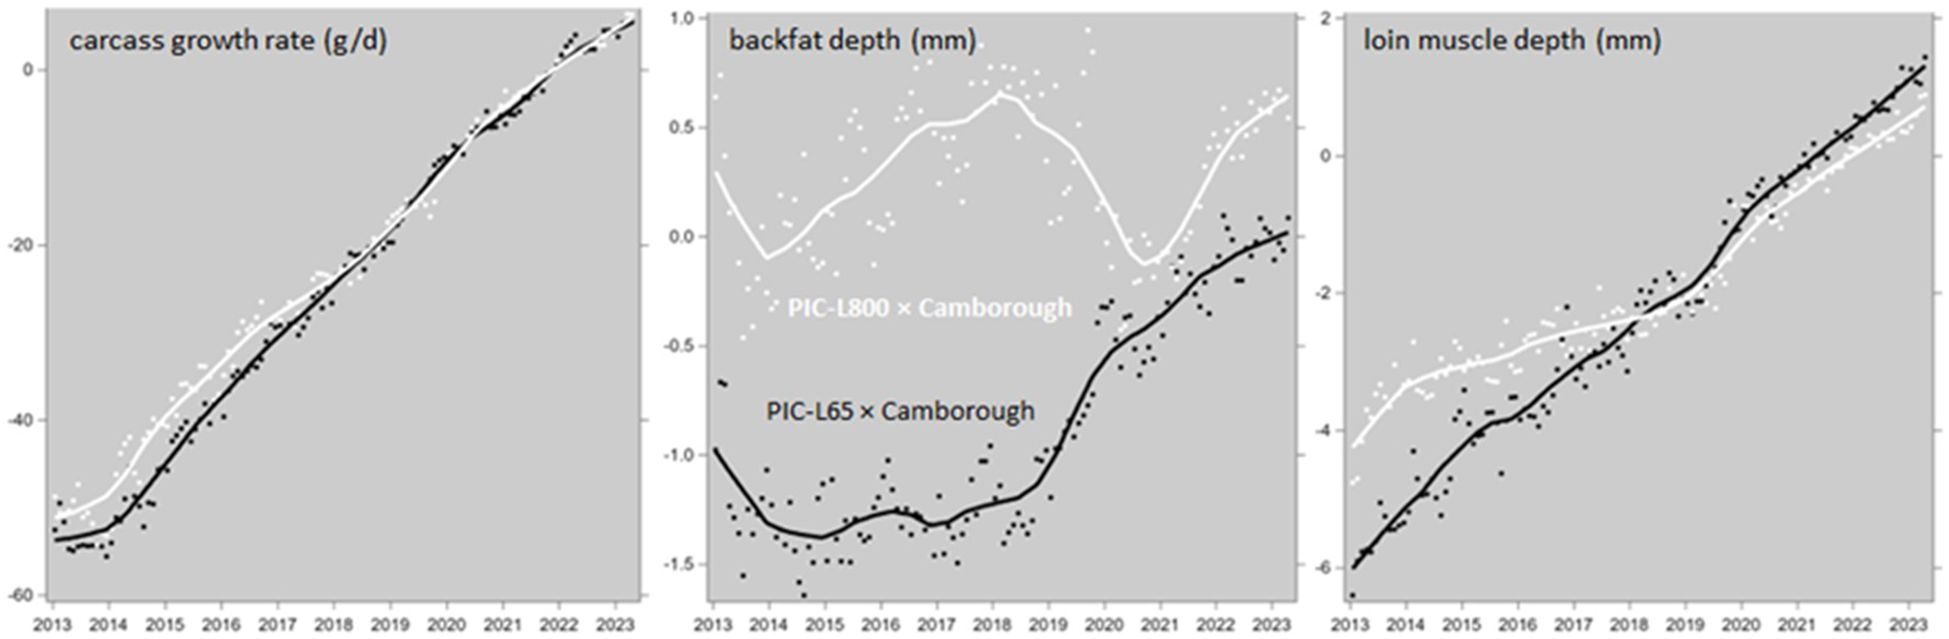
Figure 6. Genetic trends of carcass growth rate, backfat depth and loin muscle depth in growing-finishing pigs, progeny of Camborough parent sows and PIC-L65 or PIC-L800 parent boars. The data points are monthly averages, and the trendlines are LOESS plots.
From there the genetic trend of PD was derived with the average of Equations 7 and 12 (i.e. PD = 0.00486 + 0.3194 × LTGR) and the average of the lysine requirements according to Equation 4. This leads to the patterns in Figure 7, with regression coefficients of +0.0916 and +0.0889 g/d per year for the PIC-L65 and PIC-L800 progeny, respectively. These coefficients are not significantly different from each other (P=0.14); the pooled estimate is +0.0903 g/d per year. This is the annual increase in the average lifetime daily SID lysine requirement of growing-finishing pigs (progeny of PIC-Camborough parent sows and of PIC-L65 or PIC-L800 parent boars) due to the genetic trends in the growth rate and body composition of the PIC-L02, PIC-L03, PIC-L65 and PIC-L800 populations.
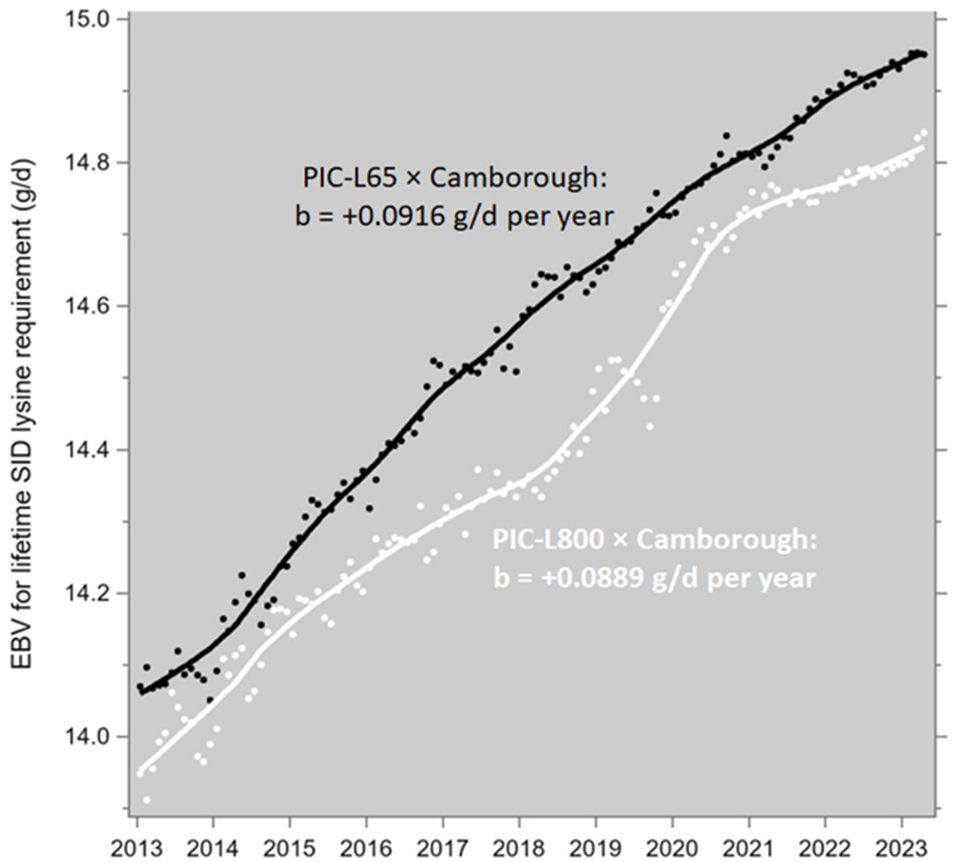
Figure 7. Genetic trends of the average lifetime (2 to 120 kg body weight) daily SID lysine requirements of growing-finishing pigs, progeny of Camborough parent sows and PIC-L65 or PIC-L800 parent boars. The data points are monthly averages, and the trendlines are LOESS plots.
Gestating and lactating sows
The genetic trends of LTGR (shown in Figure 4) and those of TNB, NSB, PWM, PBWT, LWWT and TTN in PIC-Camborough sows (shown in Figure 8) were converted into genetic trends of the lysine requirements for the various protein synthesis functions according to Equations 15, 25 to 29, 33 and 34. These trends are shown in Figure 9.
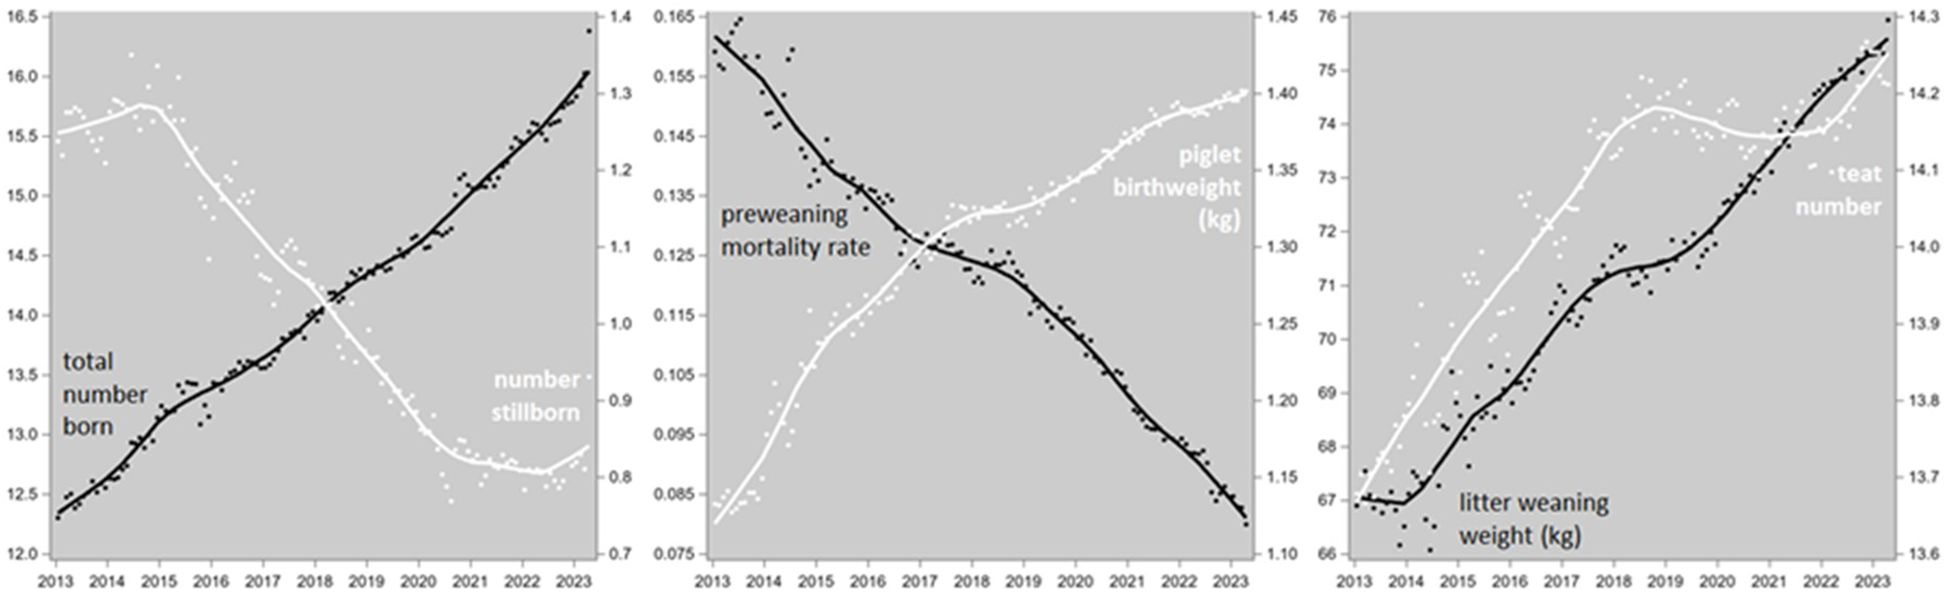
Figure 8. Genetic trends of litter size (total number born), number stillborn, preweaning mortality rate, piglet birth weight, litter weaning weight and teat number in Camborough sows. The data points are monthly averages, and the trendlines are LOESS plots.
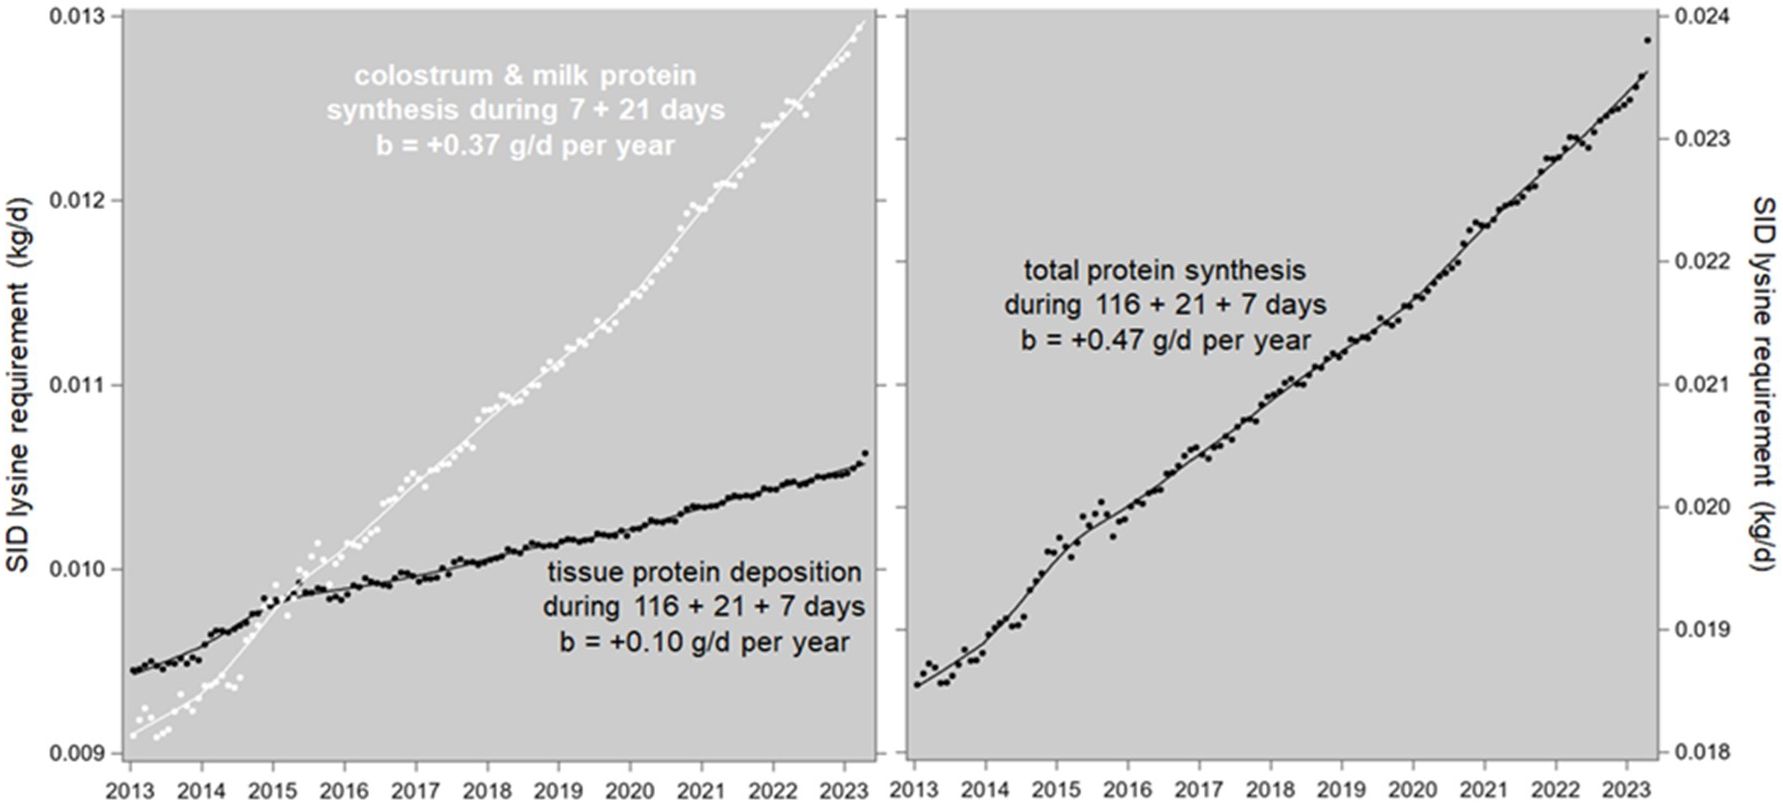
Figure 9. Genetic trends of the SID lysine requirements (kg/d) for tissue deposition (in body, mammary glands, and the uterus with its contents) and for colostrum and milk production in Camborough sows. The data points are monthly averages, and the trendlines are LOESS plots.
The lysine requirements for tissue deposition (in the body, mammary glands, and uterus with its contents) during gestation, lactation and the weaning-mating interval (116 + 21 + 7 days) increase each year by 0.10 g/d, and the lysine requirements for colostrum and milk production during lactation and the preceding week (7 + 21 days) increase each year by 0.37 g/d; the sow’s total lysine requirements for the whole parity length then increase by 0.47 g/d per year. This is the annual increase in the average daily SID lysine requirement of reproductive PIC-Camborough sows due to the genetic trends of production and reproduction traits in the PIC-L02 and PIC-L03 populations.
Discussion
In this study we quantified the annual changes in the lysine requirements of growing-finishing pigs and of reproductive sows, as caused by realized genetic trends in the production and reproduction traits that are routinely selected for in commercial pig breeding. Of course, changes in the requirements for other essential nutrients can be modeled the same way. The annual increase in the average lifetime daily SID lysine requirement of growing-finishing pigs (progeny of PIC-Camborough parent sows and of PIC-L65 or PIC-L800 parent boars) is +0.0903 g/d per year, i.e., +0.6% of the 2022 mean level per year. This is due to the genetic trends in the growth rate and body composition of the PIC-L02, PIC-L03, PIC-L65 and PIC-L800 populations.
The annual increase in the average daily SID lysine requirement across the whole parity length of reproductive PIC-Camborough sows is +0.47 g/d per year (i.e., +2% of the 2022 mean level per year): +0.10 g/d and +0.37 g/d (+1% and +3%) for gestational and lactational processes, respectively. This is due to the genetic trends of growth rate and body composition and of litter size, preweaning survival, piglet birth weight, litter weaning weight and teat number in the PIC-L02 and PIC-L03 populations. Figure 10 shows the relative importance of the genetic changes in these breeding goal traits (the sources) for the changes in the various protein deposition and synthesis processes (the targets). Clearly, the change in milk protein synthesis is the dominating target factor here; it is mainly sourced from equal changes in (i) the number born alive and (ii) again in equal proportion, preweaning mortality and litter weaning weight. Changes in protein deposition in the sow’s body tissue and in her uterus and its contents together constitute somewhat less than one-third of the total target, and they are sourced from equal changes in (iii) LTGR and (iv) again in equal proportions, total number born and piglet birth weight. In short, most of the changes in the sow’s protein synthesis processes is due to a change in milk production, and most of that is caused by changes in litter size and in the survivability and growth potential of the piglets.
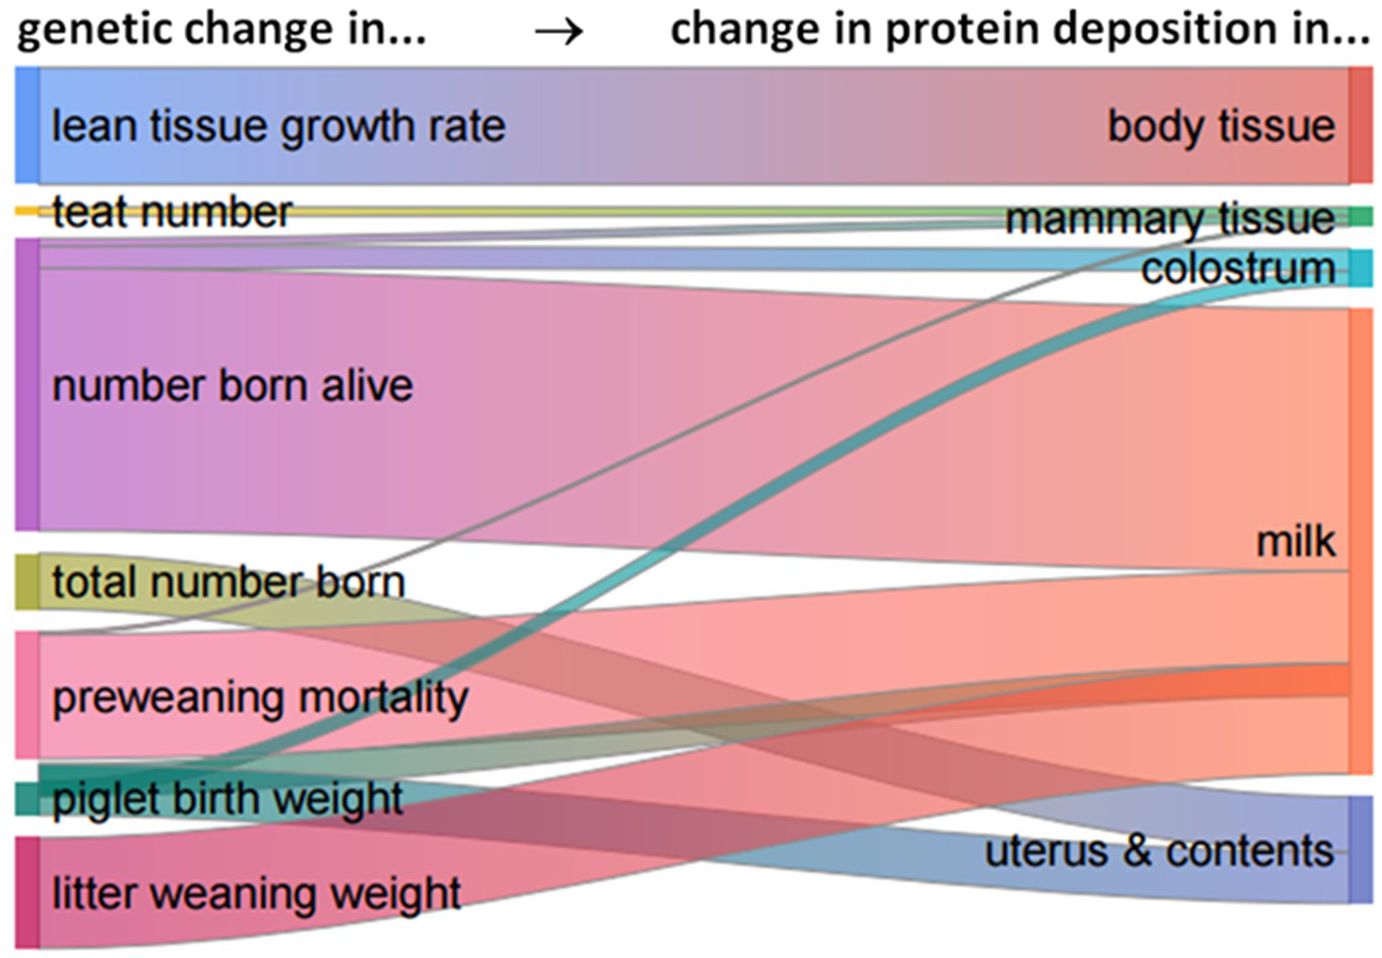
Figure 10. A flow diagram to quantify the relative impact of (i) realized genetic changes in the recorded traits lean tissue growth rate, teat number, litter size, preweaning survival, piglet birth weight and litter weaning weight on (ii) changes in protein deposition in body tissue, mammary tissue and the uterus and its contents and in the synthesis of colostrum and milk protein, in reproductive Camborough sows.
Suitability of the model
The methodology described for growing-finishing pigs is a patchwork of (i) the NRC (2012) model (which itself is based on a wide variety of literature sources) to convert protein deposition (PD) to lysine requirements, (ii) two very different sources ((a) Schinckel et al., 1996; (b) Mohrmann et al., 2006 and Landgraf et al., 2006) to predict PD from the lean tissue growth rate (LTGR), and (iii) a synthetic average of worldwide lean prediction equations to derive LTGR from backfat and loin muscle depth measurements. The studies that generated all that data worked with different pig genotypes and recorded their data across different body weight trajectories, and the only way we could bring the information together was in the form of our more or less convoluted regression Equations 4, 15, 25 to 29, 33 and 34. As such, it is unlikely that this approach is generally valid for any pig population. It can only be recommended to repeat all this research specifically for the pig population of current interest (acknowledging that this will be prohibitively difficult for any commercial operation) and bring the information together in a more coherent model.
Something similar holds for the methodology described for sows; many of its elements due to NRC (2012) derive from studies that were conducted long ago. The most outdated element is placental protein; this is based on data recorded 40 years ago by Noblet et al. (1985) from gilts carrying 12 or 13 “viable fetuses” two weeks before farrowing. Similarly, the mammary gland protein deposition patterns during lactation are based on data recorded 25 years ago by Kim et al. (1999) on gilts that were standardized to nurse 6 to 12 piglets. Again, it seems high time for such studies to be repeated with more recent pig populations and animal management conditions.
It is useful to compare our predicted annual increase in the daily lysine requirement of growing-finishing pigs of 0.09 g/d per year (based on pigs born between 2013 and 2023) to the successive recommendations of NRC (1979, 2012) and PIC (2008, 2016, 2021). Figure 1 shows these recommended patterns. They all span at least a body weight trajectory from 30 to 100 kg and on the basis of the areas below the curves within that common trajectory (from integration of the fitted trendlines, as in Supplementary Material S1), the average lysine requirements are 11.7, 17.6, 18.6, 20.4 and 20.6 g/d, respectively. For the 33-year period between NRC (1979) and NRC (2012), and for the 13-year period between PIC (2008) and PIC (2021), this gives annual increases in the 30 to 100 kg lysine requirement of 0.18 and 0.15 g/d per year, respectively. Considering that our 0.09 estimate was derived for a 2 to 120 kg body weight trajectory, and considering the 0.663 conversion factor from 20 to 120 kg which would increase it to 0.14, the orders of magnitude correspond well. A similar comparison of the sow requirements produced unhelpful results: the literature values are considerably more messy than those reported for growing-finishing pigs.
Consequences of these trends
We found an annual increase in the SID lysine requirements of PIC’s growing-finishing pigs at 0.6 % of the current mean g/d levels. Obviously, this should result in a proportional increase in nutrient consumption to allow for the ongoing expression of the changing genetic production potential – in other words, to unlock that potential and to keep it unlocked over time. If the trend in voluntary feed intake is insufficient to meet the trend in lysine requirements, the protein content of the feed will have to be increased. This will make the feed more expensive, and many feed manufacturers may be reluctant to follow that trend because it will place them in an unfavorable competitive position in the many markets where competition is chiefly on price. This signals a need for better communication between the animal breeding and animal nutrition sectors; the key element must be a focus on farm profitability (which can be maximized only when the pig’s genetic potential is fully expressed) as opposed to cost: best cost rather than least cost. The main problem here is that the livestock production sector is largely unfamiliar with the magnitude of genetic improvement and its consequences.
The genetic trends of voluntary feed intake in PIC growing-finishing pigs can be converted to lysine intake, and those trends are shown in Figure 11, together with the requirement trends shown in Figure 7. In these populations, the trends in intake are at least as strong as the trends in requirements are, so the abovementioned “proportional increase in nutrient consumption” of growing-finishing pigs is catered for. Note that these patterns are averages across the pig’s lifetime; they do not show to what extent the requirements were met in particular stages of that lifetime.
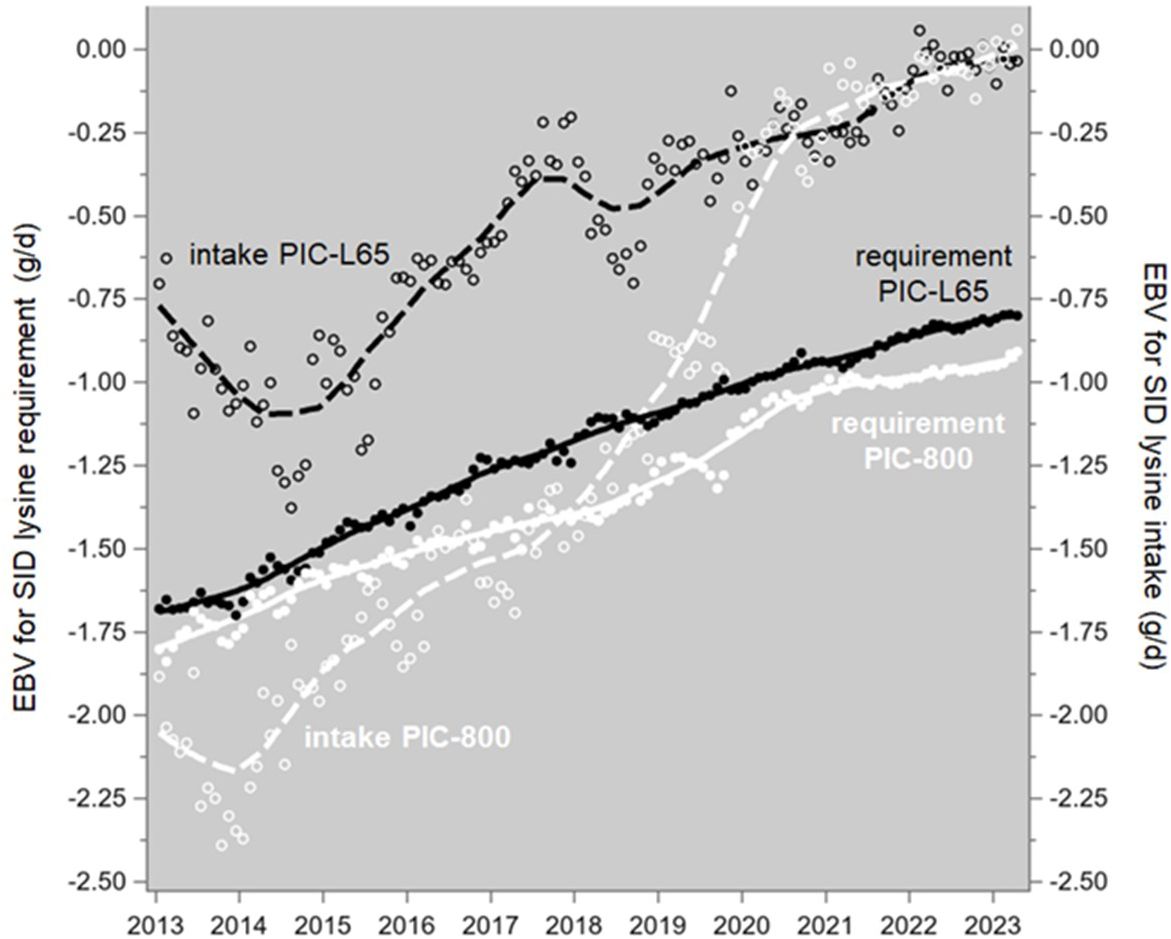
Figure 11. Genetic trends of the average lifetime SID lysine requirements (as in Figure 7; solid lines) and SID lysine intake (dashed lines; calculated as 0.8% of voluntary feed intake from 25 to 135 kg body weight, following Table 16-1A of NRC, 2012) of growing-finishing pigs, progeny of Camborough parent sows and PIC-L65 or PIC-L800 parent boars. The data points are monthly averages, and the trendlines are LOESS plots.
We also found an annual increase in the SID lysine requirements of reproductive sows at 2% of the current mean g/d level. This, again, should result in a proportional increase in nutrient consumption to allow for the ongoing expression of the changing genetic production potential. Lewis and Bunter (2011) and Bergsma et al. (2013) reported genetic correlation estimates of +0.26 and +0.24 between voluntary grower-finisher feed intake and lactation feed intake. Given these low correlations, grower-finisher feed intake cannot be relied upon as a selection trait to control the balance between nutrient consumption and metabolism during lactation. Similarly, Young et al. (2016) studied grower-finisher and lactation feed efficiency and concluded that “when selecting for pigs that are more feed efficient during the grow/finish phase, sow feed intake and body condition change during lactation must be taken into consideration”. This calls for routine recording of lactation feed intake and for its inclusion into the dam line breeding goals – possibly with a positive weighting factor, which will have to be determined once the trend in lactation intake can reliably be compared with the trend in lactation nutrient requirements, as shown in Figure 9. A possible carry-over effect from gestation intake will have to be taken into account: Whittemore (1998) noted that if the required nutrient intake cannot be realized during lactation, feeding strategies during gestation will have to be adapted, and Bunter et al. (2008) concluded from their own data analysis that “under current [Australian] gestational feeding systems, sows are unable to adapt intake to meet both their own and litter requirements on an individual as-needs basis”.
Realized versus potential trends
It is very difficult to ensure that the nutritional requirements of a farm animal are always met so that its genetic production potential can always be fully expressed. For example, Emmans (1997) needed just such data to evaluate his models of potential growth; he resorted to data recorded on fetal cattle and sheep, reasoning that the maternal nutrient supply to a monotocous fetus has a very high metabolic priority which brings it as close to fully unrestricted as practically possible. Performance data of pigs or sows recorded in real-life farm conditions cannot achieve such a high level of integrity.
Like most published genetic trends in farm animals, those of our Figures 4, 6, 8 are based on routinely calculated EBVs that derive from phenotypic data recorded in farm conditions with unclear nutritional restriction levels. We used EBVs of animals housed in PIC’s nucleus farms (where nutrition is closely optimized) only, but those animals form only a part of the whole phenotyped population; much of the data behind their EBVs comes from multiplier and customer farms. Hence these EBVs relate to phenotypes expressed under unclear nutritional restriction levels, and selection on them has caused genetic change in the production potential in such conditions. Although the associated realized trend will be weaker than what might be achieved in a fully unrestricted system, our trend estimates do reflect the true state of nature, i.e. the change in real-life production potential. At the same time, as illustrated in Figure 1, recommended levels of lysine supply were regularly increased over time; hopefully this has led to industry-wide positive environmental trends in real-life production. Our genetic trend estimates should be independent from those, because the EBVs were calculated with adjustment for a contemporary group effect. It follows that our recommended annual increases of lysine supply at 0.6 and 2 % of the base levels are valid for farm conditions with unclear nutritional restriction levels, not for fully unrestricted production systems.
Priorities around efficiency
There are several approaches to voluntary feed intake in the grower-finisher stage and the lactation stage and to the associated efficiencies. The conventional one (i) is to minimize feed intake while maximizing the desired output (i.e., lean tissue growth rate or piglet production, respectively): this is about gross feed efficiency, commonly expressed as the feed conversion ratio (FCR: input / output). A refinement is done in terms of residual feed intake (i.e., net feed efficiency); both approaches target short-term farm profitability. A different approach (ii) would draw from the patterns in our Figure 11 for growing-finishing pigs and its equivalent for reproductive sows (once that information has become available), where the main goal is to ensure that the pig’s or sow’s genetic potential for production is fully supported by its nutrient intake through some combination of voluntary feed intake and feed composition. A third approach (iii) would target nitrogen excretion (the pig’s main contributor to greenhouse gas emission) and the nutrient intake pattern most likely to minimize it, given the pig’s genetic production potential.
All these approaches are about efficiency defined in different ways: (i) gross or net feed efficiency, (ii) capacity utilization rate (e.g., Christiano, 1981), or (iii) nitrogen utilization efficiency. Livestock breeding will have to find a way to integrate these approaches into a single breeding goal. This will take some effort because the various criteria do not respond equally to a change in protein supply. Figure 12 illustrates this with data from Yang et al. (2023), who fed pigs unrestrictedly with four diets with the same net energy content and the same SID lysine, methionine/cysteine and threonine content but different crude protein and fiber contents. This resulted in a wide range of daily nitrogen intake with decidedly variable responses in the relevant productivity and efficiency criteria.
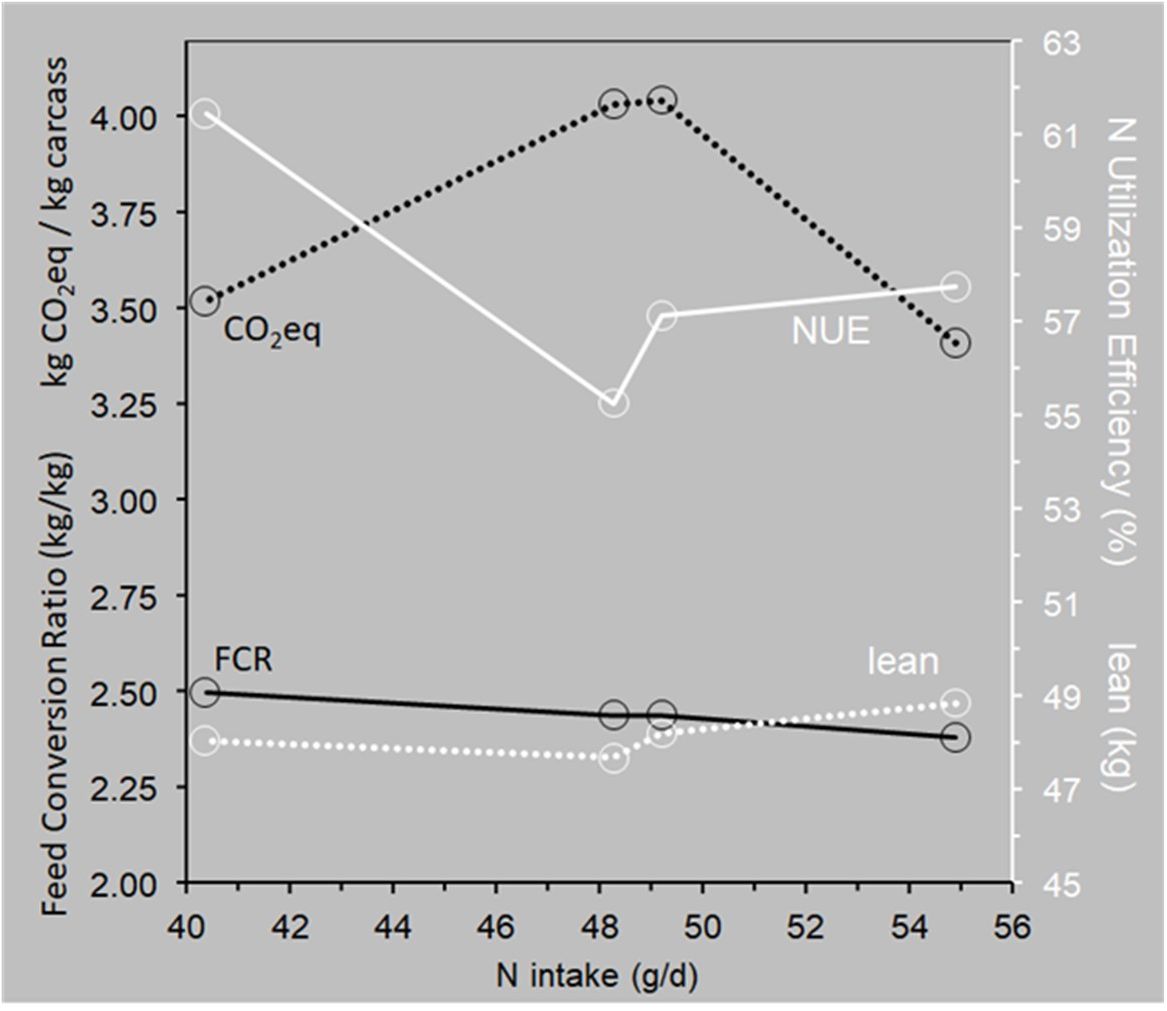
Figure 12. Responses of productivity and efficiency criteria in relation to daily nitrogen intake in growing-finishing pigs fed four diets with different crude protein and fiber contents but equal net energy and equal SID lysine, methionine+cysteine and threonine contents. Data from Yang et al. (2023). The leftmost FCR data point differed significantly (P<0.05) from the other ones; the leftmost NUE data point differed significantly (P=0.03) from the lowest one. The lean contrasts are nonsignificant (P>0.14); the CO2eq estimates did not come with standard errors.
An efficient way to gain insight into the interrelationships within this system would be a simulation study where growing-finishing pigs of an appropriate range of genetic protein deposition (PD) potential are subjected to three feeding regimes for 150 days from 30 kg body weight.
Regime 1: unrestricted access to a diet with the optimum (and therefore dynamic over time) composition to meet each pig’s nutrient requirements (such as in our Equation 4); pigs with a higher PD potential will be able to fully express it because their requirements will be met in this example of precision farming.
Regime 2: as in regime 1, but the diet composition is the optimal one for the pig with the lowest PD potential; the other pigs will be able to fully express their PD potential only when their feed intake capacity allows for it, and because for them the diet is unbalanced they will deposit more body fat.
Regime 3: as in regime 2, but feed intake is restricted to the unrestricted level of the pig with the lowest PD potential; the other pigs will not be able to fully express their PD potential.
The relevant simulation output parameters would be end weight, cumulative feed intake, feed price as a function of diet composition, realized PD, realized fat deposition, and realized nitrogen intake and excretion. From that, the production cost, carcass value, carbon footprint and the three efficiencies described above can be calculated.
Data availability statement
The data analyzed in this study is subject to the following licenses/restrictions: data was extracted from the routine commercial databases of a breeding company. It is not publicly accessible. Requests to access these datasets should be directed to cGlldGVyLmtuYXBAZ2VudXNwbGMuY29t.
Author contributions
PK: Conceptualization, Formal analysis, Investigation, Methodology, Software, Visualization, Writing – original draft, Writing – review & editing.
Funding
The author(s) declare financial support was received for the research, authorship, and/or publication of this article. PK is funded by Genus-PIC.
Acknowledgments
Valuable contributions were made by Weasley Orlando, Steve Dritz, Carina Vier, and Justin Holl.
Conflict of interest
Author PK is employed by the company Genus-PIC.
The author declares that this study received funding from Genus-PIC. The funder had the following involvement in the study: the funder made available the data behind the genetic trends in Figures 4, 6, 7 and 8.
Publisher’s note
All claims expressed in this article are solely those of the authors and do not necessarily represent those of their affiliated organizations, or those of the publisher, the editors and the reviewers. Any product that may be evaluated in this article, or claim that may be made by its manufacturer, is not guaranteed or endorsed by the publisher.
Supplementary material
The Supplementary Material for this article can be found online at: https://www.frontiersin.org/articles/10.3389/fanim.2024.1401514/full#supplementary-material
References
Bergsma R., Mathur P. K., Kanis E., Verstegen M. W. A., Knol E. F., Van Arendonk J. A. M. (2013). Genetic correlations between lactation performance and growing-finishing traits in pigs. J. Anim. Sci. 91, 3601–3611. doi: 10.2527/jas.2012-6200
Brossard L., Nieto R., Charneca R., Araujo J. P., Pugliese C., Radović Č., et al. (2019). Modelling nutritional requirements of growing pigs from local breeds using InraPorc. Animals 9, 169. doi: 10.3390/ani9040169
Bunter K. L., Smits R., Luxford B., Hermesch S. (2008). Sow body composition and its associations with reproductive and litter growth performance in the primiparous sow. Proc. AGBU Pig Genet. workshop, 67–81. Available at: http://agbu.une.edu.au/pig_genetics/pdf/2008/Paper%209_KB_Body%20composition.pdf (Accessed December 17, 2024).
CCSI (2016). Annual report 2015 (Ottawa: Canadian Centre for Swine Improvement). Available at: www.ccsi.ca/meetings/annual/Annualreport%202016.pdf (Accessed December 17, 2024).
Christiano L. J. (1981). A survey of measures of capacity utilization. IMF Econ. Rev. 28, 144–198. doi: 10.2307/3866830
D'Souza D. N., Dunshea F. R., Suster D., Pethick D. W., Pluske J. R., Mullan B. P. (2002). Intramuscular fat deposition pattern in female finisher pigs in Western Australia. Proceedings of the 48th International Congress of Meat Science and Technology, Rome. 2, 658–659. Available online at: https://digicomst.ie/2002-3/2002_07_06 (Accessed December 17, 2024).
Emmans G. C. (1997). A method to predict the food intake of domestic animals from birth to maturity as a function of time. J. Theor. Biol. 186, 189–199. doi: 10.1006/jtbi.1996.0357
Feyera T., Theil P. K. (2017). Energy and lysine requirements and balances of sows during transition and lactation: a factorial approach. Livestock Sci. 201, 50–57. doi: 10.1016/j.livsci.2017.05.001
Font i Furnols M., Brun A., Gispert M. (2019). Intramuscular fat content in different muscles, locations, weights and genotype-sexes and its prediction in live pigs with computed tomography. Animal. 13, 666–674. doi: 10.1017/S1751731118002021
Foster W. H., Kilpatrick D. J., Heaney I. H. (1983). Genetic variation in the efficiency of energy utilization by the fattening pig. Anim. Product. 37, 387–393. doi: 10.1017/S0003356100001999
Hansen A. V., Strathe A. B., Kebreab E., France J., Theil P. K. (2012). Predicting milk yield and composition in lactating sows: a Bayesian approach. J. Anim. Sci. 90, 2285–2298. doi: 10.2527/jas.2011-4788
Ji F., Hurley W. L., Kim S. W. (2006). Characterization of mammary gland development in pregnant gilts. J. Anim. Sci. 84, 579–787. doi: 10.2527/2006.843579x
Kanis E., Koops W. J. (1990). Daily gain, food intake and food efficiency in pigs during the growing period. Anim. Sci. 50, 353–364. doi: 10.1017/S0003356100004803
Kim S. W., Easter R. A., Hurley W. L. (2001). The regression of unsuckled mammary glands during lactation in sows: the influence of lactation stage, dietary nutrients, and litter size. J. Anim. Sci. 79, 2659–2668. doi: 10.2527/2001.79102659x
Kim S. W., Osaka I., Hurley W. L., Easter R. A. (1999). Mammary gland growth as influenced by litter size in lactating sows: impact on lysine requirement. J. Anim. Sci. 77, 3316–3321. doi: 10.2527/1999.77123316x
Kongsro J., Gjerlaug-Enger E. (2013). In vivo prediction of intramuscular fat in pigs using computed tomography. Open J. Anim. Sci. 3, 321–325. doi: 10.4236/ojas.2013.34048
Landgraf S., Susenbeth A., Knap P. W., Looft H., Plastow G. S., Kalm E., et al. (2006). Developments of carcass cuts, organs, body tissues and chemical body composition during growth of pigs. Anim. Sci. 82, 889–899. doi: 10.1017/ASC2006097
Lavery A., Lawlor P. G., Magowan E., Miller H. M., O’Driscoll K., Berry D. P. (2019). An association analysis of sow parity, live-weight and back-fat depth as indicators of sow productivity. Animal 13, 622–630. doi: 10.1017/S1751731118001799
Lenis N. P., Metz S. H. M. (1984). “The consequence of genetic improvement for protein and lysine requirements of growing pigs,” in Proceedings of the 6th International Symposium on Amino Acids, Serock. Eds. Zebrowska T., Buraczewska L., Buraczewski S., Kowalczyk J., Pastuszewski B. (Polish Scientific Publishers, Warszawa), 298–304. Available at: https://tinyurl.com/3hcrym7m (Accessed December 17, 2024).
Lewis C. R. G., Bunter K. L. (2011). Body development in sows, feed intake and maternal capacity 1: performance, pre-breeding and lactation feed intake traits of primiparous sows. Animal 5, 1843–1854. doi: 10.1017/S1751731111001121
Miller E. G., Levesque C. L., Trottier N. L., De Lange C. F. M. (2016). Dynamics of nitrogen retention in gestating gilts at two feeding levels. J. Anim. Sci. 94, 3353–3361. doi: 10.2527/jas.2016-0539
Miller E. G., Levesque C. L., Trottier N. L., De Lange C. F. M. (2017). Dynamics of nitrogen retention at two feeding levels in gestating parity 2 and 3 sows. J. Anim. Sci. 95, 2701–2710. doi: 10.2527/jas2017.1444
Mitchell A. D., Ramsay T. G., Scholz A. M. (2012). Measurement of changes in body composition of piglets from birth to 4 kg using quantitative magnetic resonance (QMR). Archiv für Tierzucht 55, 64–71. doi: 10.5194/aab-55-64-2012
Mohrmann M., Roehe R., Susenbeth A., Baulain U., Knap P. W., Looft H., et al. (2006). Association between body composition of growing pigs determined by magnetic resonance imaging, deuterium dilution technique, and chemical analysis. Meat Sci. 72, 518–531. doi: 10.1016/j.meatsci.2005.08.020
Noblet J., Close W. H., Heavens R. P., Brown D. (1985). Studies on the energy metabolism of the pregnant sow 1. Uterus and mammary tissue development. Br. J. Nutr. 53, 251–265. doi: 10.1079/BJN19850033
NRC (1979). Nutrient requirements of swine: 8th revised edition (Washington DC, USA: National Academy Press). doi: 10.17226/19882
NRC (1998). Nutrient requirements of swine: 10th revised edition (Washington DC, USA: National Academy Press). doi: 10.17226/6016
NRC (2012). Nutrient requirements of swine: 11th revised edition (Washington DC, USA: National Academy Press). doi: 10.17226/13298
PIC (2016). PIC nutrient specifications manual (Hendersonville TN, USA: Pig Improvement Company). Available at: www.pic.com/wp-content/uploads/sites/3/2018/10/Nutrient-Specifications-Manual_2016_English_Metric.pdf (Accessed December 17, 2024).
PIC (2021). PIC nutrition and feeding guidelines (Hendersonville TN, USA: Pig Improvement Company). Available at: www.pic.com/resources/pic-nutrition-and-feeding-guidelines-metric (Accessed December 17, 2024).
PIC (2022). PIC total carcass value handbook (Hendersonville TN, USA: Pig Improvement Company). Available at: www.pic.com/resources/total-carcass-value-handbook (Accessed December 17, 2024).
Pulkrábek J., Pavlík J., Vališ L., Vítek M. (2006). Pig carcass quality in relation to carcass lean meat proportion. Czech J. Anim. Sci. 51, 18–23. doi: 10.17221/3904-CJAS
Schinckel A. P., Preckel P. V., Einstein M. E. (1996). Prediction of daily protein accretion rates of pigs from estimates of fat-free lean gain between 20 and 120 kilograms live weight. J. Anim. Sci. 74, 498–503. doi: 10.2527/1996.743498x
Vadmand C. N., Krogh U., Hansen C. F., Theil P. K. (2015). Impact of sow and litter characteristics on colostrum yield, time for onset of lactation, and milk yield in sows. J. Anim. Sci. 93, 2488–2500. doi: 10.2527/jas2014-8659
Van Milgen J., Valancogne A., Dubois S., Dourmad J. Y., Seve B., Noblet J. (2008). InraPorc: A model and decision support tool for the nutrition of growing pigs. Anim. Feed Sci. Technol. 143, 387–405. doi: 10.1016/j.anifeedsci.2007.05.020
Whittemore C. T. (1998). “Influence of pregnancy feeding on lactation performance,” in The lactating sow. Eds. Verstegen M. W. A., Moughan P. J., Schrama J. W. (Wageningen Pers, Wageningen, the Netherlands), 183–200.
Wiesemüller W. (1980). Amino acid (lysine) requirement of the pig: methods of approach and recommendations. Annales Zootech. 29, 179–193. doi: 10.1051/animres:19800206
Yang Z., Urriola P. E., Johnston L. J., Shurson G. C. (2023). A systems approach to evaluate nitrogen utilization efficiency and environmental impacts of swine growing-finishing feeding programs in U.S. pork. J. Anim. Sci. 101, 1–17. doi: 10.1093/jas/skad188
Yao R., Cools A., Matthijs A., Deyn P. P. D., Maes D., Janssens G. P. J. (2023). Peculiarities in the amino acid composition of sow colostrum and milk, and their potential relevance to piglet development. Veterinary Sci. 10, 298. doi: 10.3390/vetsci10040298
Keywords: pig, sow, protein requirements, lysine requirements, genetic improvement, genetic trend
Citation: Knap PW (2025) Estimated genetic trends in the lysine requirements of growing-finishing pigs and reproductive sows due to genetic trends in production traits. Front. Anim. Sci. 5:1401514. doi: 10.3389/fanim.2024.1401514
Received: 15 March 2024; Accepted: 09 December 2024;
Published: 07 January 2025.
Edited by:
Christine Janet Nicol, Royal Veterinary College (RVC), United KingdomReviewed by:
Halima Sultana, University of Florida, United StatesFrancesco Tiezzi, University of Florence, Italy
Copyright © 2025 Knap. This is an open-access article distributed under the terms of the Creative Commons Attribution License (CC BY). The use, distribution or reproduction in other forums is permitted, provided the original author(s) and the copyright owner(s) are credited and that the original publication in this journal is cited, in accordance with accepted academic practice. No use, distribution or reproduction is permitted which does not comply with these terms.
*Correspondence: Pieter W. Knap, cGlldGVyLmtuYXBAZ2VudXNwbGMuY29t