 Leonora M. James1
 Mary S. Mayes1
 Cori J. Siberski-Cooper1
 Matthew W. Breitzman2Michael J. Vandehaar3
 James E. Koltes1*
- 1Department of Animal Science, Iowa State University, Ames, IA, United States
- 2W. M. Keck Metabolomics Research Laboratory, Iowa State University, Ames, IA, United States
- 3Department of Animal Science, Michigan State University, East Lansing, MI, United States
Genetic selection for feed efficiency is possible in Holstein dairy cattle. However, measuring individual cow feed intake is expensive, which limits available phenotypes, resulting in lower prediction accuracy of breeding values than desired. New indicator trait phenotypes for feed efficiency could help improve breeding value accuracies if they can be measured widely across dairy herds. The objective of this study was to identify milk metabolites associated with feed intake and efficiency traits that may serve as new indicator traits. Metabolites were obtained from three sources and two distinct groups of cows. Gas chromatography mass spectrometry (GC-MS), and liquid chromatography mass spectrometry (LC-MS) assays were conducted on a subset of 39 cows identified based on their extreme residual feed intake (RFI; top and bottom 15%). Routinely collected on-farm milk testing data were evaluated on a second, larger subset of 357 cows. Statistical models were created to evaluate if metabolites: 1) provided novel feed efficiency information; 2) served as proxies for body weight traits not routinely collected on farms; and 3) were associated with breeding values for feed efficiency traits, including: predicted transmitting abilities (PTA) for feed saved (FS), RFI and body weight composite (BWC). Ontology enrichment analysis was used to identify enriched pathways from the contrast of extreme RFI cows by GC-MS and LC-MS. The false discovery rate (FDR, reported as q-values) and Hommel corrections were used as multiple testing corrections. Partial least squares discriminate analysis confirmed animals could be classified as high or low feed efficiency groups. A total of 33 GC-MS metabolites, 10 LC-MS ontology pathways (both q<0.20) and 42 fatty acid or milk quality assays from on-farm tests (Hommel adj-p<0.05) were identified for analyses 1, 2, and 3 respectively. Ontology enrichment analysis of LC-MS data identified the sphingolipid metabolism (analysis 2), and beta-alanine metabolism (analysis 1) pathways (q<0.20). Heptanoic acid was identified as associated with PTA BWC (GC-MS, Model 3; q<0.15). These metabolites represent new candidate indicator traits for feed efficiency that could be included in existing on-farm milk testing systems upon validation.
1 Introduction
Feed is the number one cost on dairy farms (USDA-ERS, 2022). Improvement of feed efficiency is of high importance to dairy farms and the dairy industry, because of its large impact on profitability and environmental sustainability. Understanding the factors that impact feed intake and feed efficiency could lead to the development of improved metrics to breed and manage dairy cattle to reduce feed costs. However, individual feed intake data is difficult to obtain. Individual feed intake collection is costly, laborious, and not feasible on commercial dairy farms. For these reasons, there is a need to develop new measurements or proxies for feed intake or feed efficiency traits that can easily be obtained from commercial dairy farms which could be applied in the dairy industry. Genetic selection is currently being used to improve feed efficiency in dairy cattle; however, there is a need for more phenotype data or additional data from indicator traits to increase the accuracy of the predicted transmitting abilities available for selection today (Gaddis et al., 2021; Siberski–Cooper et al., 2022).
Feed efficiency can be defined several different ways (Siberski–Cooper et al., 2022). The feed efficiency trait in the United States is defined as predicted transmitting ability (PTA) feed saved (FS). The PTA FS is composed of PTA residual feed intake (RFI), and body weight composite (BWC). The RFI value represents the genetic variability in feed efficiency standardized by milk production and body weight values. PTA BWC accounts for the maintenance energy, as it is a multi-trait breeding value including stature, strength, body depth, rump width, and dairy form traits that account for difference in body size that impact individual animal dietary energy requirements. These traits are impacted by stage of lactation, as well as, parity of the animal (Cavani et al., 2023). The PTA FS trait was selected for use in the United States due to the ease of interpretation as larger, positive values represent larger amount of feed saved per lactation (i.e., more feed efficient cow have more feed saved).
In the dairy industry today, PTA RFI is used as part of the genetic evaluation for feed efficiency in Holstein cattle as part of the FS trait (Tempelman et al., 2015; Gaddis et al., 2021). The PTA RFI measurement is the portion of feed saved that captures the variation in individual animal feed intake and is defined as the difference between the actual and expected feed intake adjusted to a comparable level across animals by accounting for differences in contemporary group (CG), days in milk (DIM), parity, milk energy (including: milk protein, milk lactose, and milk fat), metabolic body weight (MBW), and body condition score (BCS). An RFI measurement reflects feed efficiency over a defined period of time. In a similar way, adjusted dry matter intake model (aDMI) can be used to adjust for the same variables in RFI on a daily basis as it is adjusted for the same variables impacting feed efficiency as in RFI (Siberski, 2019; Siberski-Cooper et al., 2023). This daily measurement of efficiency can be useful to get a view of changes in feed efficiency overtime on the same or similar timescale as other trait measurements recorded on the same day. Variables impacting RFI include DIM, parity, and milk energy, which are frequently recorded on individual animals on dairy farms. However, energy status indicators like body weight (BW) and body condition score (BCS) are rarely routinely recorded. This leaves a gap in the information known to be important to predict individual cow feed efficiency measured as RFI.
Milk components (i.e., fat and protein) are routinely measured on nearly two-million US dairy cattle annually through the dairy herd improvement testing labs located across the United States, as well as in additional cows in other countries internationally. Milk and specifically the compounds in milk represent a unique information source about cow health and productivity that is under-exploited in the dairy industry. Milk metabolites are reflective of the metabolic processes that occurred or that will occur, and have been documented as indicative of animal energy balance, methane yield, health, and fertility (Dechow et al., 2017; van Gastelen et al., 2018; Wang and Kadarmideen, 2019; Marinho and Santos, 2022; Hailemariam et al., 2023). Thus, milk metabolites are a source of information that could likely serve as proxies for feed intake, and efficiency related traits.
Milk testing labs already routinely generate milk spectral data which may capture some information about metabolites in milk as correlated information. Subsets of milk metabolites can already be inferred from milk testing data (Dórea et al., 2018; Franzoi et al., 2023), and a standard set of fatty acids and related measures are inferred from commercial spectral data for producers to use (Schwarz, 2018). This study utilized the inferred fatty acids and related measures to evaluate the usability of information already used by producers (i.e., milk fatty acid data) as indicators for feed intake and efficiency traits. However, we do not know all of the metabolites in milk nor which metabolites might be most useful for predicting feed intake. Milk spectral data can help with some metabolite data, but there are technical challenges in using milk spectra for routine evaluation of traits in commercial dairy cattle. Milk spectra are not frequently collected on farms, typically only once a month or less. It is believed that milk data may need to be tested weekly or even daily for information in milk to be informative to predict other traits of interest (Wallén et al., 2018). However, advancements in precision livestock technologies such as in-line milk spectra testing devices may soon help overcome this challenge (Kunes et al., 2021). Milk spectral based measurements serve as proxies for some milk metabolites, but not necessarily for all informative milk metabolites nor are these measures a direct reflection of the metabolite levels for which they serve as proxies (Marchi et al., 2014). Ideally, a comprehensive list of metabolites would be identified that are informative or potentially informative for traits of interest, like feed intake and other traits impacting feed efficiency. Then, assays like milk spectra could be fine-tuned to measure these specific metabolites that could be used as a measurement of feed intake for use in precision feeding management or potentially as indicator traits for genetic selection.
Relatively little is known about the association of milk metabolites with feed intake and efficiency traits. Hailemariam et al. (2023) evaluated the relationship between milk metabolite profiles in high and low feed efficient animals to identify biomarkers of RFI, as well as, investigating their predictive ability in early, mid, and late lactation. The study concluded that accounting for stage in lactation was important in the metabolite profile as these profiles changed across lactation stages. One candidate biomarker for feed efficiency was identified for each stage of lactation: decanoylcarnitine for early lactation, dodecenoylcarnitine for mid lactation, and phenylalanine for late lactation. The study also used the metabolite profiles to predict RFI with an R2 of 0.65, 0.37, and 0.60 for early, mid, and late lactation, respectively (Hailemariam et al., 2023).
The objective of this study was to identify milk metabolites associated with feed efficiency traits using three different metabolite assays at varying levels of detection (i.e., LC-MS, GC-MS, and FT-IR). Milk metabolites were measured with a non-targeted GC-MS assay to evaluate free fatty acids at higher accuracy, an untargeted LC-MS assay for wide-scale discovery of metabolites and a milk FT-IR based assay available by commercial lab testing to approximate fatty acids already used on dairy farm analytics. Three statistical analyses were utilized to determine 1) if milk metabolites were associated with feed intake phenotypes; 2) if milk metabolites add new information beyond what is already explained by the energy sink variables routinely collected to estimate RFI; and 3) if milk metabolites could serve as proxies for body weight and BCS which are known to impact feed efficiency and not commonly collected on dairy farms.
2 Methods and materials
2.1 Animal husbandry
Cows used in this study were housed and reared at the Iowa State Dairy Farm. Individual feed intake data was recorded between the years of 2018–2021 under the Animal Care and Use Committee Protocol: 18-174 and 21–144 at Iowa State University. Cows were milked twice a day and received a total mixed ration (TMR) diet as described (Siberski–Cooper et al., 2022; Siberski-Cooper et al., 2023). Data for the two subsets of animals used in this study were collected from a total of 7 cohorts (i.e., contemporary groups, CG) of animals, defined by pen grouping and study period date. More details regarding the animal care and phenotyping can be found in (Siberski–Cooper et al., 2022; Siberski-Cooper et al., 2023).
2.2 Animal sample selection
Three sets of assays (i.e., GC-MS/LC-MS and milk quality assays) were evaluated with two different population groups. Population subset 1 is from the top and bottom 15% of the population for RFI using GC-MS/LC-MS and population 2 is the 357 cows measured with the milk quality-based assays, including the milk spectral inferred fatty acid data.
The population 1 subset used for the GC-MS/LC-MS assays were identified as follows. Individual cow’s milk samples were selected from the extremes of the phenotype distribution for residual feed intake (RFI) of 465 lactating Holstein dairy cows. The top 15% and bottom 15% of animals ranked by RFI were selected with representation from each contemporary group (1–12) and parity (1, 2, 3+) and DIM (20–320) to ensure factors such as weather or diet and stage of lactation could be adjusted for when considering which animals were potentially more or less feed efficient. Sick animals were excluded from the analysis. Production details on the animals used in this study can be found in Tables 1 and 2. A total of 39 extreme RFI cows were selected for analysis with a range in RFI from −4.98 to −1.69 and 1.47 to 6.26 for the high and low feed efficient animals, respectively.
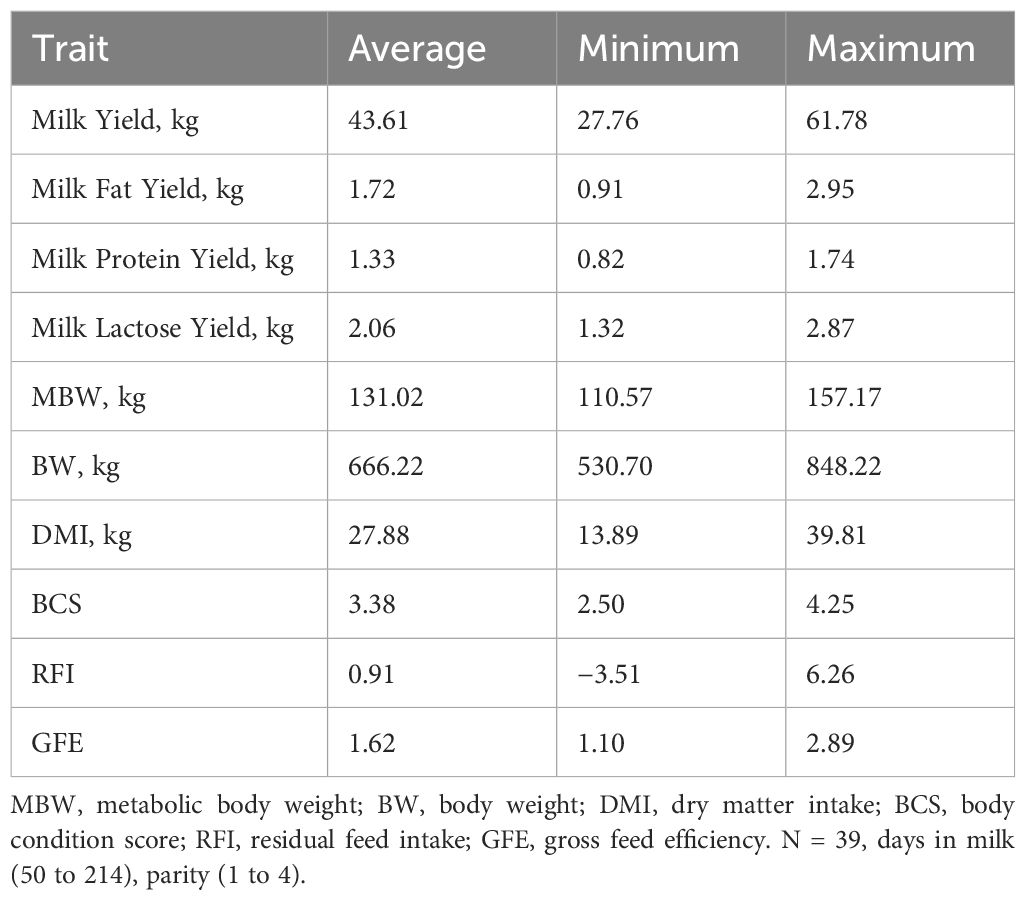
Table 1. Summary statistics for feed efficiency phenotypes for the gas chromatography mass spectrometry and liquid chromatography mass spectrometry study population.
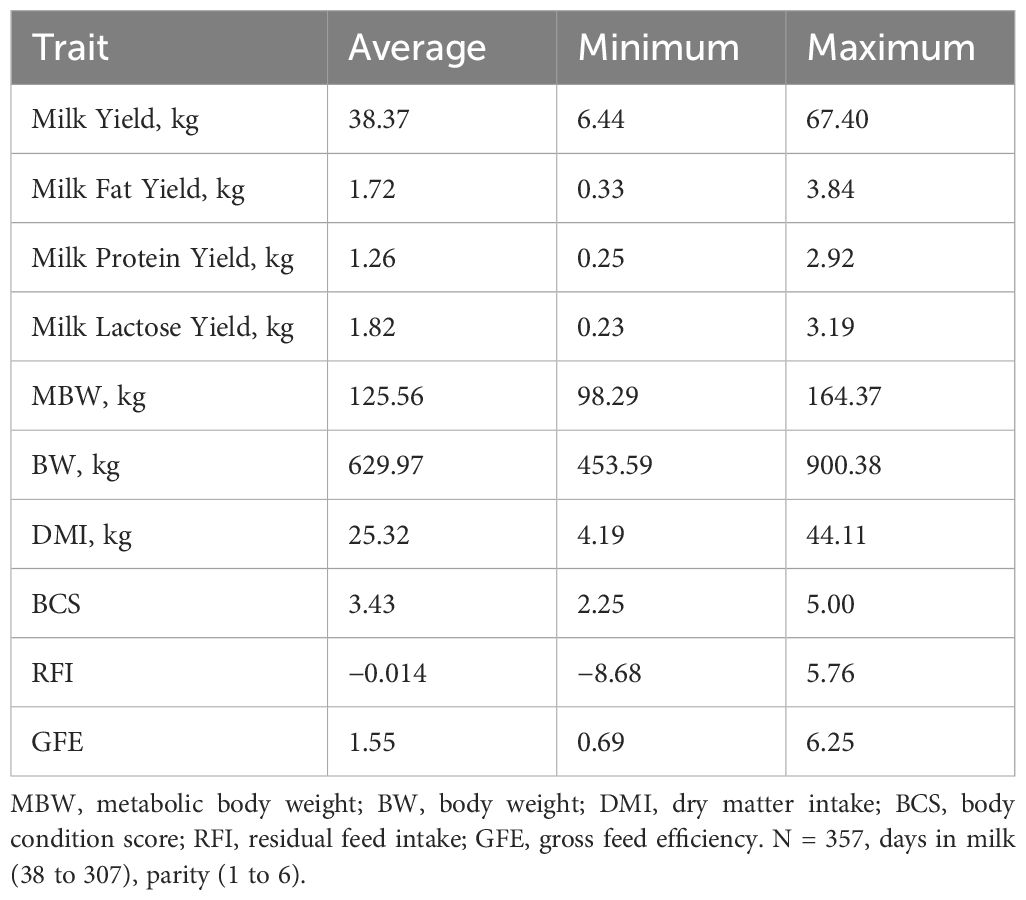
Table 2. Summary statistics for feed efficiency phenotypes for the Fourier transformed infrared spectroscopy study population.
A larger set of animals including 357 cows, population 2, were evaluated for the milk quality assays. These samples were collected on a larger set of cows as these measurements were routinely available with milk-testing data. These cows ranged from 38 to 307 DIM and parities 1 to 6.
2.3 Milk sample collection and processing
Milk samples were collected on a weekly basis at each of two milkings per day (AM and PM) over a six-week time frame while daily feed intake data were collected as described (Siberski–Cooper et al., 2022). After collection, milk samples were stored at 4°C before processing to prepare for metabolomics assays. Samples were processed by first mixing an individual cows two daily samples. Samples were vortexed and then morning and evening samples were merged in equal quantities, vortexed again, aliquoted into replicates and stored at −80°C until utilized for metabolomics assays. A total of 39 samples were used for gas chromatography mass spectrometry (GC-MS) or liquid chromatography mass spectrometry (LC-MS) assays.
2.3.1 LC-MS and GC-MS non-targeted metabolite sample extraction
Milk samples metabolites were analyzed by LC-MS and GC-MS at the Iowa State University W.M. Keck Metabolomics Research Laboratory (RRID: SCR 017911). Preparation of samples was conducted using a modified version of methanolic extraction and preparation methods established by (A et al., 2005). Each sample was allotted into 100 µL spiked with internal standards. The internal standards cocktail consisted of 10 µg of nonadecanoic acid (Sigma-Aldrich CO., St. Louis, MO), 10 µg ribitol (Sigma-Aldrich CO., St. Louis, MO) and 5 µg 1,2-dilauroyl-sn-glycero-3-phosphoethanolamine (Avanti Polar Lipids, Birmingham, AL). Extraction was initiated with the addition of 0.9mL of 80% ice-cold LC-MS grade methanol with 20% LC-MS grade water (Fisher Scientific, Waltham, MA). Samples were vortexed for 10s and placed into an ice-cold sonication water bath at full output power for 10 minutes. Samples were then vortexed for five min followed by centrifugation for seven min at 16,000 x g. Supernatants were recovered, leaving the insoluble pellets to be re-extracted using 0.9 mL of 80% ice-cold methanol. Lastly before preparation for LC-MS and GC-MS analyses, the supernatant extracts were pooled.
2.3.2 Non-targeted LC-MS acquisition and analysis
Supernatant extracts were filtered using 0.2-micron centrifugal filters (Cat. No. UFC30LG25, Millipore Sigma, Burlington, MA) then six µL of each sample was injected into the LC system. Separations for LC were carried out at 40°C with a flow rate of 0.400 mL/minute using an Agilent Technologies 1290 Infinity Binary Pump UHPLC instrument equipped to an Agilent Technologies Eclipse C18 1.8 µm 2.1 mm × 100 mm analytical column coupled to an Agilent Technologies 6540 UHD Accurate-Mass Q-TOF mass spectrometer (Agilent Technologies, Santa Clara, CA). Solvents used for running the analysis included A: water with 5 mM ammonium formate and 0.1% formic acid and B: 25% iso-propanol in acetonitrile with 5 mM ammonium formate and 0.1% formic acid. Solvent conditions started at 0% B and increased on a linear gradient to 100% B over a 15 min period, which was held for five min before returning to 0% B over a two min period. After each LC-MS acquisition, there was a six min run at 0% B.
To detect metabolites in the LC-MS assay, electrospray ionization was used in both negative and positive ionization modes. The service gas used for the ion source was nitrogen with a drying gas flow rate of 12 L/min at 350°C, a 25-psi nebulizing pressure, and gas flow of 11 L/min at 400°C. The nozzle and capillary voltages were 1,750 and 4,000, respectively. Mass spectrometry was operated in the high resolution (four Gz) mode and a scan range from a mass to charge ratio (m/z) 100 to m/z 1,700. The acquisition rate used was 1.5 spectra per second. During LC-MS data acquisition, the reference masses were monitored for continuous mass calibration for positive mode and negative mode, m/z 121.050873 with m/z 922.009698 (positive mode) and m/z 112.985587 with 1033.988109 (negative mode), respectively. Peak detection and data evaluation was carried out using Mass Profiler programs (version 8.0) (Agilent Technologies, Santa Clara, CA) and Agilent MassHunter Qualitative Analysis (version 10.0). Accurate mass spectral analysis by comparison to the METLIN (Smith et al., 2005) database was used to identify the metabolite peaks.
2.3.3 Non-targeted GC-MS acquisition and analysis
Prior to derivation (Koek et al., 2006), 600 µL of the combined extracts were dried using a speed-vac for 10 hours (h). Derivatization of samples was carried out with 50 µL of methoxyamine hydrochloride (20 mg/mL in pyridine) added to the dried extract followed by an incubation for 1.5h at 30°C. After the initial incubation, 70 µL of bis-trimethyl silyl trifluoroacetamide with 1% Trimethylchlorosilane (BSTFA + 1% TMCS) was added to the samples which were incubated again for 30 min at 60°C to induce trimethylsilylation.
Upon completion of derivation, one µL of each sample was injected into an Agilent 6890 gas chromatograph coupled to a model 5973 Mass Selective Detector (Agilent Technologies, Santa Clara, CA) using a HP-5MSI 5% Phenyl Methyl Silox with 30 m × 250 µM × 0.25 µm film thickness column (Agilent Technologies) with the inlet in splitless mode and a constant temperature of 280°C. Oven temperature was programmed to have an initial temperature of 70°C that was increased to 320°C with a 5°C per minute rate and then held for eight min. The carrier gas helium had a flow rate of one mL per minute. The mass spectrometry transfer line was held at 280°C. Detection for mass spectrometry was done using electron ionization at 70 eV with a source and quadrupole temperature set at 230°C and 150°C, respectively. Mass spectrometry data was collected in the range from m/z 40 to m/z 800. Automated Mass Spectral Deconvolution and Identification System (AMDIS, National Institute of Standards and Technology (Gaithersburg, MD, USA)) was used for identification and quantification of metabolites using a manually curated retention indexed GC-MS library. Additional identification was performed using the NIST 20 and Wiley 11 GC-MS spectral library (Agilent Technologies, Santa Clara, CA). Quantification for final results were calculated by integrating corresponding peak areas relative to the area of the internal standards. Raw data were normalized based on the amount of sample used.
2.3.4 On-farm milk testing: milk quality assay
Milk component and milk fatty acid data were obtained from AgSource Laboratories (Menomonie, WI, USA) from one weekly milk sample for each week (n=6) that feed intake data was collected from cows. Milk samples were pooled from the morning and evening milking to get a homogeneous daily sample per cow. Milk Fatty acid data were inferred based on a proprietary method using the milk Fourier transformed infrared spectrometry (FT-IR) spectral data. The milk fatty acids and other compounds that were inferred from spectra include: fat, lactose, protein, urea, mono-unsaturated fatty acids, poly-saturated fatty acids, saturated fatty acids, short chain fatty acids, middle chain fatty acids, long chain fatty acids, trans fatty acids, acetone, beta hydroxybutyrate, myristic acid, palmitic acid, octadecanoic acid, oleic acid, de novo fatty acids, mixed fatty acids, and preformed fatty acids.
2.4 Statistical modeling
To determine the statistical association of milk metabolites with feed intake and feed efficiency, we developed three sets of models that are described below. Three different dependent variables representing feed intake or feed efficiency measurements were considered. Feed efficiency was defined as RFI or adjusted dry mater intake (aDMI) which is similar to a daily RFI value (Tempelman et al., 2015; Siberski, 2019; Siberski-Cooper et al., 2023). These feed efficiency traits were preadjusted for the variables parity, contemporary group, days in milk, metabolic body weight, health status, body condition score, and milk components using concurrent data (i.e., fat, protein, and lactose yield). We also considered feed intake expressed as dry matter intake (DMI) as a dependent variable. Concurrent data for DMI and aDMI was used in these calculations. To correct for multiple testing and estimate false discovery rates the q-value method (Storey et al., 2022) was used for the LC-MS and GC-MS data sets. The q-value is the statistic of false positive discovery. With large datasets and a nominal p-value of 0.05 q-values are used to further validate that the metabolite found nominally significant were true positives rather than false positives. The Hommel correction (R Core Team, 2013) was used to account for multiple testing with the metabolite and other milk quality metrics obtained from commercial milk testing data. Significance for this assay is denoted as adjusted p-values (adj. p). All models were fit in R software (R Core Team, 2021) using stats (R Core Team, 2013).
2.4.1 Association of metabolites with feed efficiency and dry matter intake
The goal of the first model was to identify metabolites that provide novel information about feed intake or efficiency beyond the information explained by traits and measurements already used to estimate feed efficiency as RFI in Holstein dairy cattle. Metabolites were associated with feed intake, RFI and aDMI as the response variable (Y) (Tempelman et al., 2015; Siberski, 2019; Siberski-Cooper et al., 2023). The following model were fit in R software using the lm function in the stats package (R Core Team, 2013):
where the dependent variable, Yijk, is RFI, aDMI (Siberski, 2019), or DMI for the ith cows individually measured metabolite; CG and Parity are the class effects of contemporary group (n = 7) and parity (classified as 1,2, or 3+); MilkYieldi, MilkProteinYieldi, MilkLactoseYieldi, MilkFatYieldi, MBWi and BCSi are fixed effects; and ϵ is the random residual associated with Y. Herein, results from this model will be referenced as “feed intake proxies” to denote the use of Model 1 and differentiate results from other models.
2.4.2 Association of metabolites with body weight traits
The goal of the second model was to identify the metabolites associated with BW and BCS (i.e., as proxies for BW and BCS) as in many cases, these traits are not measured on dairy farms. To identify the metabolites useful as proxies for BW and BCS, a full model including both BW and BCS (Model 1) was compared to a reduced model (Model 2) without BW and BCS. By comparing the full and reduced models, metabolites were identified that were associated with both the feed intake and efficiency variables as well as the body weight variables. The full model was the same as Model 1.
The reduced model was:
where the dependent variable, Yijk, is RFI, aDMI (Siberski, 2019), or DMI for the ith cows individually measured metabolite; CG and Parity are the class effects of contemporary group and parity (classified as 1,2, or 3+); MilkYieldi, MilkProteinYieldi, MilkLactoseYieldi and MilkFatYieldi are fixed effects; and ϵ is the random residual associated with Y. Metabolites were considered as associated with one of the three feed intake variables if they were statistically different (p<0.05) in the reduced model (Model 2) but not different (p>0.05) in the full model (Model 1). Herein, results from this model will be referenced as the “body size proxies” model to denote the comparison between Models 1 and 2 to differentiate results from other models.
2.4.3 Association of metabolites with breeding values for feed efficiency traits
The goal of the third model was to identify metabolites that are associated with genetic merit for feed efficiency traits and body energy related traits (i.e., metabolites associated with PTA RFI, PTA FS, and PTA BWC). To determine if specific metabolites were associated with PTAs for feed efficiency traits, the following model was evaluated:
where the dependent variable, PTAYij was feed saved (FS), RFI, or BWC for the ith cows individually measured metabolite; and ϵ is the random residual associated with PTAY. Herein, results from this model will be referenced as the “genetic proxies” to denote the use of Model 3 and differentiate results from other models. PTAs were provided by the Council for Dairy Cattle Breeding (CDCB) for all animals. The PTA data used in this manuscript was from April 2023. Metabolites were considered as associated with one of the PTA variables if they were statistically different at a nominal p<0.05. When possible, the false discovery rate was estimated and provided using a q-value (Storey et al., 2022).
2.4.4 Metabolite pathway ontology enrichment analysis
Ontology enrichment and pathway analysis was conducted on the metabolite profiles that were identified as nominally significant (p<0.05). Nominally significant metabolites were evaluated based on previous research that successfully identified novel candidate pathways that provided relevant and important biological information to what was already known (Koltes et al., 2015). Enrichment and pathway analysis was done using MetaboAnalyst 5.0 in R (https://www.metaboanalyst.ca/, accessed on September 23, 2023) (Xia et al., 2009). Pathway enrichment analysis was conducted using a hypergeometric test with a relative-betweenness centrality test was used for the topology analysis to search for enriched pathways from the Bos Taurus KEGG database. MetaboAnalyst was also utilized to obtain PCA, partial least squares discriminate analysis (PLS-DA), clustering statistics, and heatmaps with the R based statistical package MetaboAnalyst (Pang et al., 2021). The false discovery rate was estimated for ontology enrichment results using q-values (Storey et al., 2022). Important molecular features were elucidated using the multivariate analysis tools.
2.4.5 Metabolite-based discriminant analysis
A partial least squares discriminant analysis (PLS-DA) was utilized to evaluate if the metabolites could differentiate between the high and low feed efficient groups based on the RFI phenotype of each cow (high or low RFI). The results from the PLS-DA were plotted using the MetaboAnalyst software in R (Pang et al., 2021).
2.4.6 Power analysis
A power analysis was conducted to determine the level of power for 18 cows per feed efficiency group was a sufficient number to identify associations with each of the metabolites measured by the GC-MS and LC-MS assays. The true difference was estimated using 20% of the low feed efficient mean concentration per each individual metabolite for the GC-MS and LC-MS assays Bristol (1995). A pooled standard deviation was computed using a t-test and alpha was set at 0.05. Power was calculated for all individual metabolites for both the GC-MS and LC-MS assays. All calculations were completed using R (R Core Team, 2021).
3 Results
Metabolites identified by GC-MS and LC-MS were able to classify samples by high and low RFI based on the PLS-DA results (Figure 1), and had sufficient power (>0.80) for the majority of metabolites assayed as shown in Figure 2. A total of 87 GC-MS metabolites, 5,993 LC-MS metabolites, and 18 fatty acids and associated milk quality measurements predicted by FT-IR data (i.e., total solids, oligosaccharides, somatic cells, and differential somatic cell count) were analyzed with linear Models 1 (feed intake proxies), 2 (body size proxies), and 3 (genetic proxies) to identify statistical associations with variables impacting feed efficiency. A total of 54 GC-MS and 5,060 LC-MS metabolites were identified as statistically different (nominal p<0.05), for aDMI, RFI, and DMI combined. These metabolites were used to identify 10 enriched ontology pathways (q<0.20) Across all three of the models, a total of 33 metabolites were identified as significant (q<0.20), including 31 GC-MS and 2 LC-MS identified metabolites. The analysis of the on-farm based milk quality assay identified 42 statistical associations with fatty acids and related measure (total solids, oligosaccharides, somatic cells, and differential somatic cell count) identified by Model 1, with none uniquely identified by Model 2. All summary information associated with these analyses can be found in the Supplementary Material. Gross feed efficiency (GFE) was also evaluated for the selected animals to compare the feed efficiency status of the selected animals based on the two most common feed efficiency calculations (i.e. RFI and GFE). GFE is the ratio of milk output to feed input (Connor, 2015). The relationship between the two feed efficiency traits were as expected. As GFE increased RFI decreased, as shown by both plots in Figure 3. While change in BW is a variable used to calculate RFI, in our study it was not found significant. Thus suggesting that metabolite profiles did not fluctuate with change in body weight in our sample set.
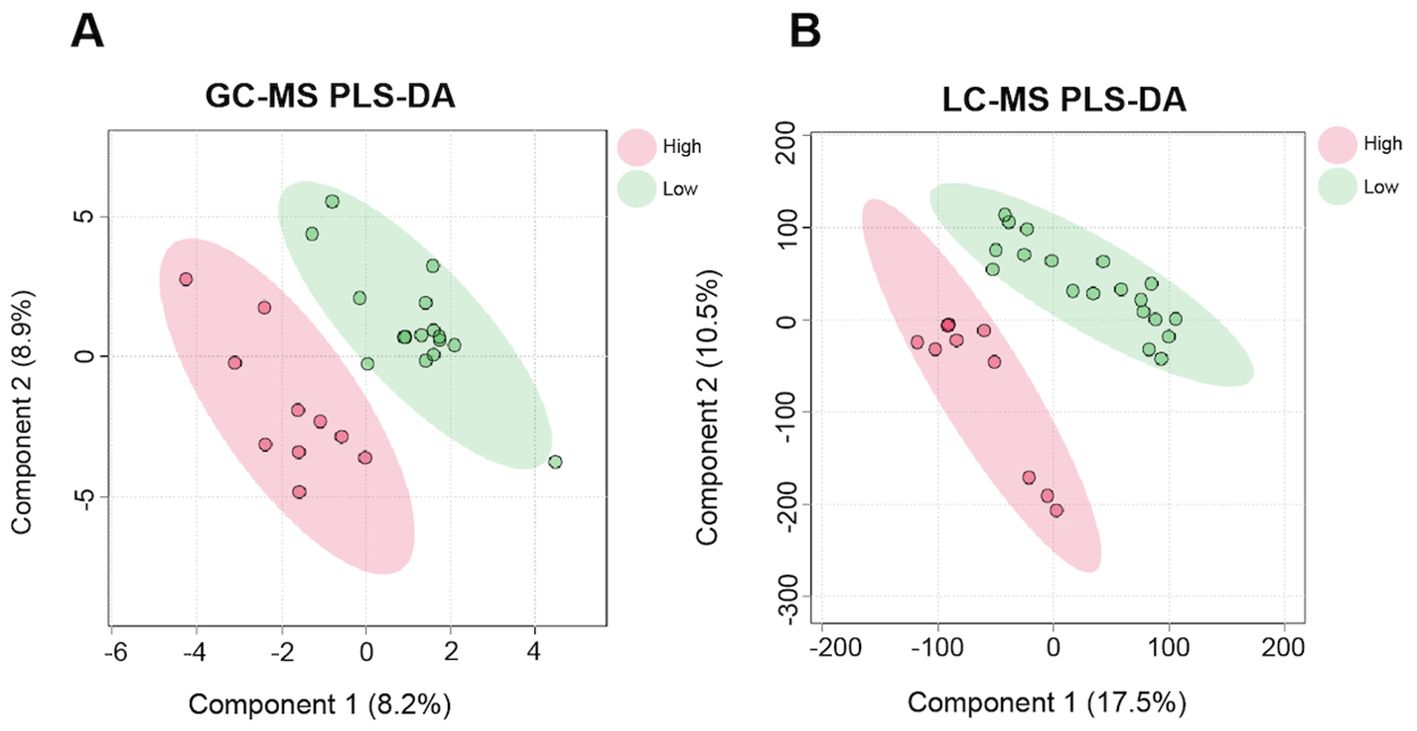
Figure 1. Partial Least Squares-Discriminate Analysis (PLS-DA) differentiates high and low residual feed intake (RFI) animals by their milk metabolic profiles. A PLS-DA was utilized to classify lactating Holstein dairy cows by high or low RFI designation using both (A) GC-MS (n = 87) metabolites, and (B) LC-MS (n = 5,993) metabolites.
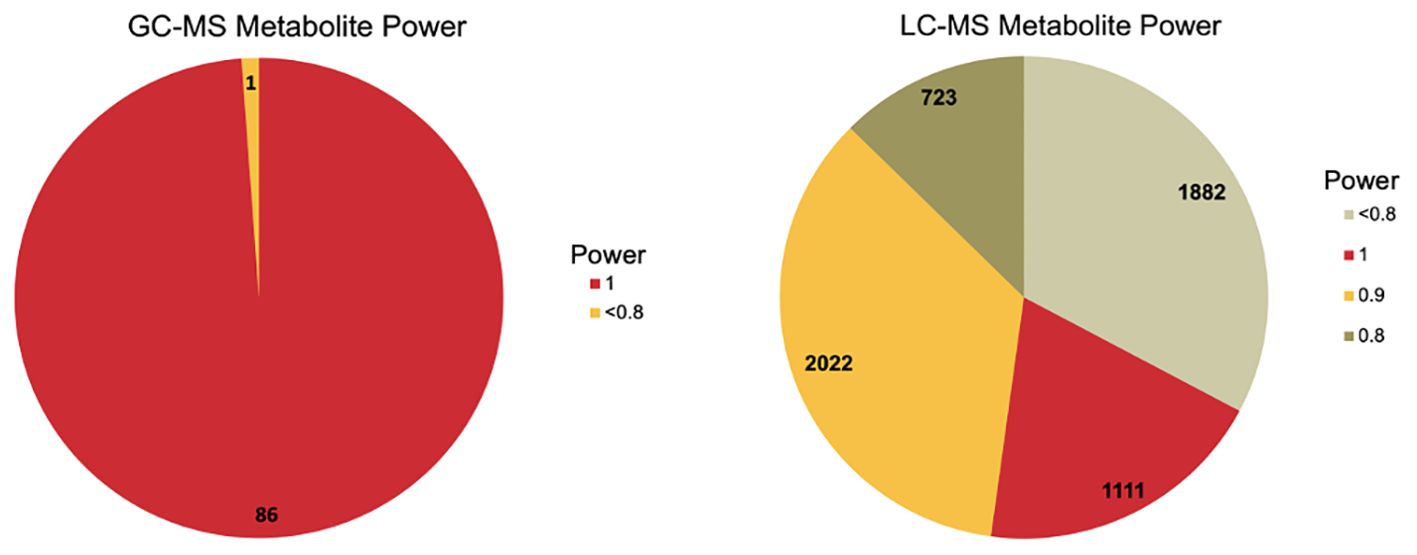
Figure 2. Power analysis summary for gas chromatography mass spectrometry (GC-MS) shown in panel (A) and liquid chromatography mass spectrometry (LC-MS) shown in panel (B) A power analysis was calculated to determine the amount of power for the study sample size. A total of 67.20% of LC-MS metabolites were greater than or equal to 0.8. A total of 98.85% of GC-MS metabolites were greater than 0.8.
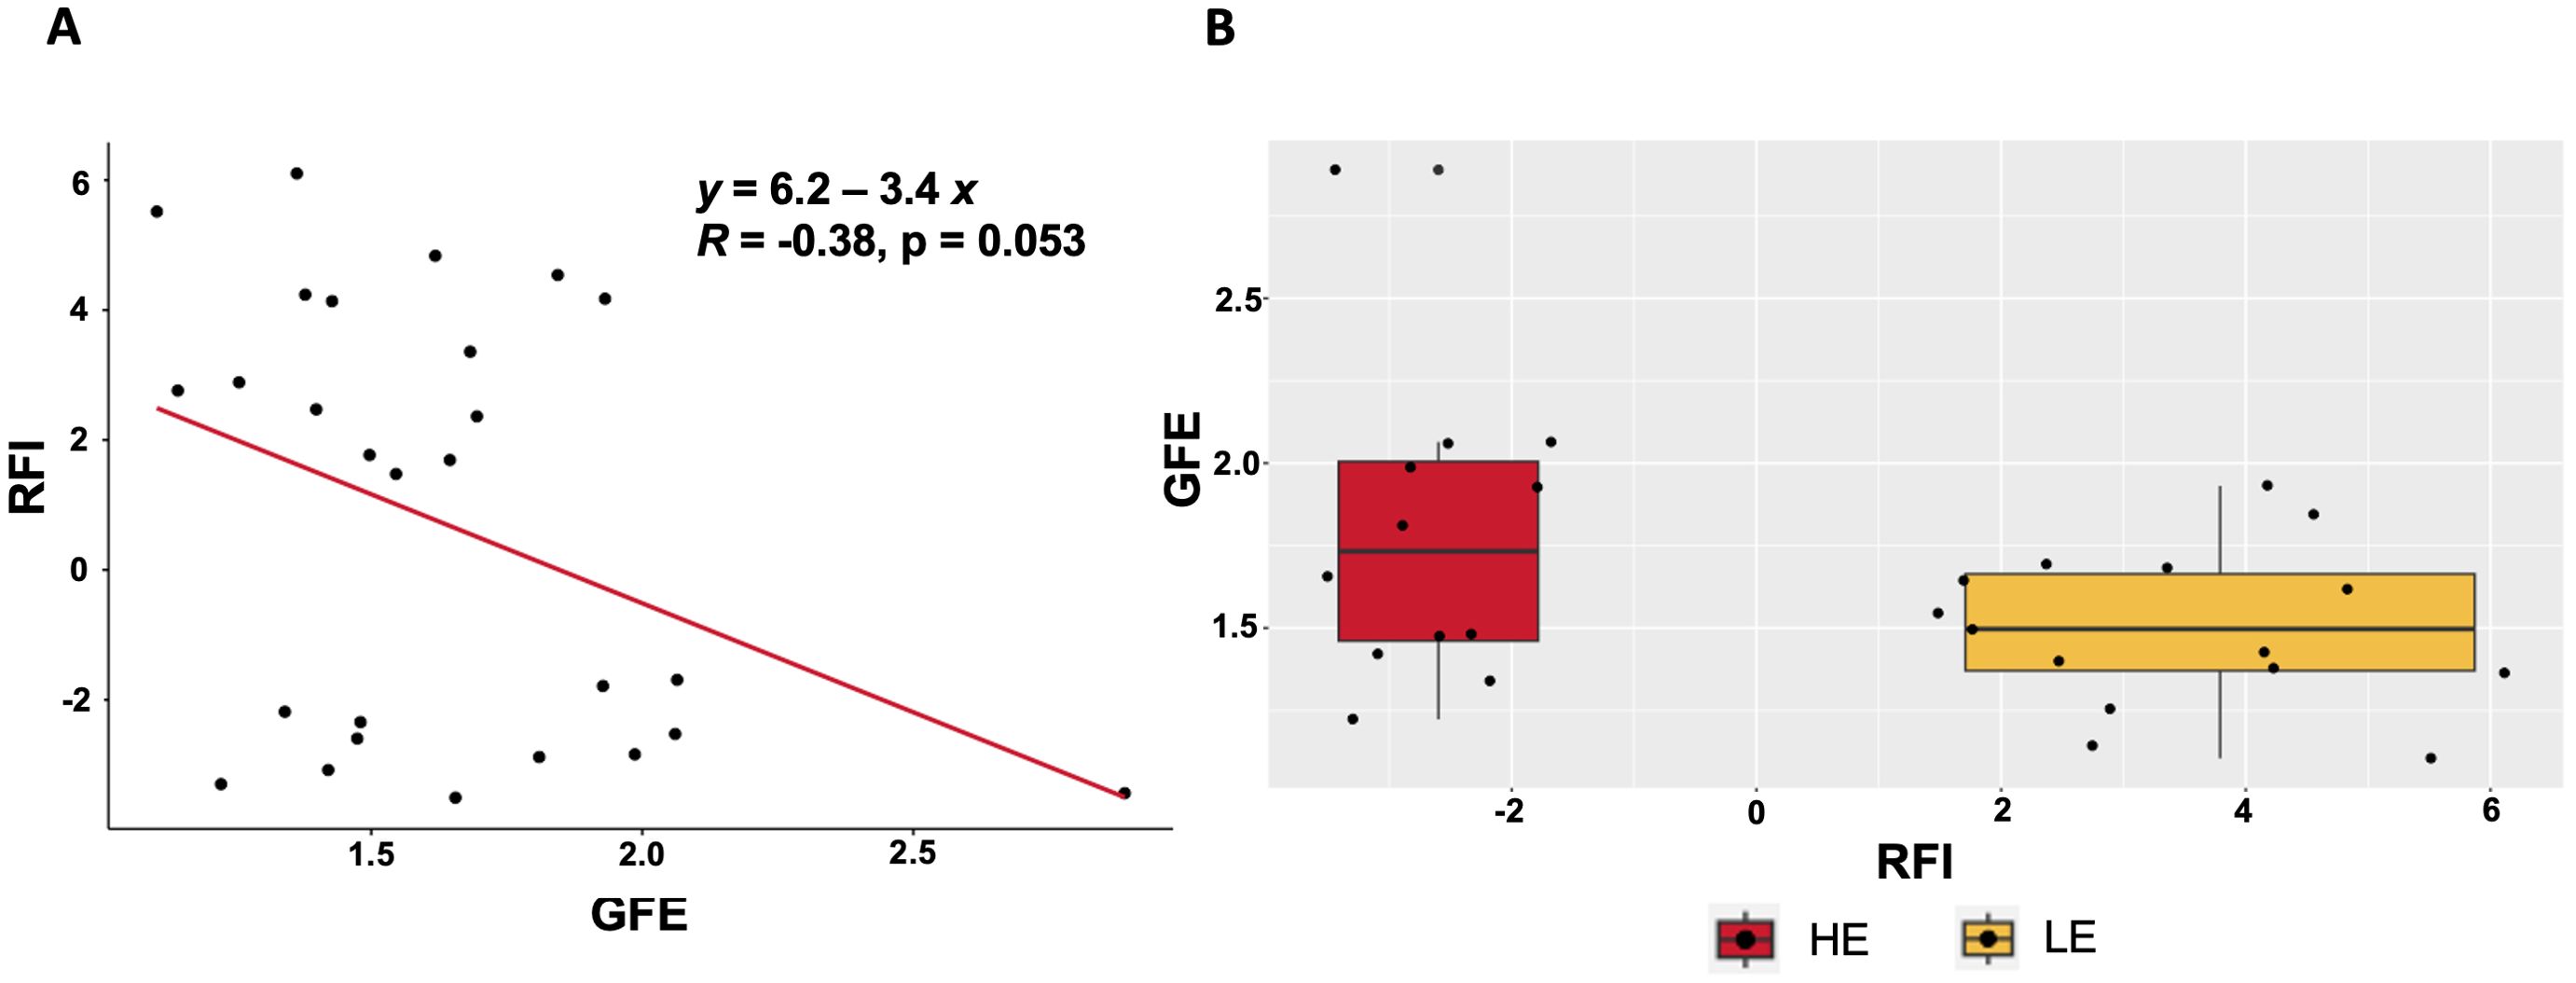
Figure 3. The relationship of gross feed efficiency (GFE) with residual feed intake (RFI) for extreme RFI cows (top and bottom 15%) included with the gas chromatography mass spectrometry (GC-MS) and liquid chromatography mass spectrometry (LC-MS) analyses. Two different ways of visualizing the relationship of RFI and GFE are presented. (A) The regression of GFE on RFI. (B) The distribution of RFI plotted by GFE.
3.1 Metabolites associated with feed intake traits
3.1.1 Model 1: RFI
The milk quality assay identified a total of 12 metabolites or quality measurements significantly associated with RFI, including: solids not fats, urea, monounsaturated fatty acids, saturated fatty acids, total unsaturated fatty acids, medium chain fatty acids, long chain fatty acids, myristic acid, palmitic acid, oleic acid, mixed fatty acids, preformed fatty acids (adj. p<0.05). No GC-MS or LC-MS metabolites were associated with RFI after applying a multi-testing correction. A total of 201 LC-MS metabolites were associated with RFI (p<0.05). Of these 201 metabolites, 83 were annotated, and 118 were not annotated. All nominally significant metabolites can be found in Supplementary Table 1. Ontology enrichment analysis identified five statistically significant pathways (p<0.05). These enriched pathways included: pantothenate and CoA biosynthesis, sphingolipid metabolism, cysteine and methionine metabolism, glycerophospholipid metabolism, and linoleic acid metabolism.
3.1.2 Model 1: aDMI
The milk quality assay identified a total of 16 significantly associated with aDMI, including: milk protein, lactose, monounsaturated fatty acids, polyunsaturated fatty acids, saturated fatty acids, total unsaturated, short chain fatty acids, medium chain fatty acids, long chain fatty acids, trans fatty acids, acetone, BHB, myristic acid, palmitic acid, octadecanoic acid, and oleic acid (adj. p<0.05). No GC-MS or LC-MS metabolites were associated with aDMI after applying a multi-testing correction. However, three GC-MS metabolites were identified nominally associated with aDMI including: 1,2-Dilaurin, and beta-D- Glucopyranose (p<0.05). A total of 284 LC-MS metabolites were associated with aDMI (p<0.05). Of these 284 metabolites, 85 were annotated, and 199 were not annotated. All nominally significant metabolites can be found in Supplementary Table 2. Ontology enrichment analysis identified six total statistically significant pathways: pantothenate and CoA biosynthesis, beta-Alanine metabolism, glycerophospholipid metabolism, and pyrimidine metabolism (q<0.20) and linoleic acid metabolism and vitamin B6 metabolism (p<0.05).
3.1.3 Model 1: DMI
The milk quality assay identified a total of 14 significantly associated with DMI, including: milk protein, lactose, somatic cells, urea, monounsaturated fatty acids, polyunsaturated fatty acids, saturated fatty acids, total saturated fatty acids, medium chain fatty acids, long chain fatty acids, acetone, myristic acid, palmitic acid, and oleic acid (adj. p<0.05). No GC-MS or LC-MS metabolites were associated with DMI after applying a multi-testing correction. However, one GC-MS metabolite was identified nominally associated with DMI 1,2-Dilaurin (p<0.05). A total of 253 LC-MS metabolites were associated with DMI (p<0.05). Of these 253 metabolites 90 were annotated and 163 were not annotated. All nominally significant metabolites can be found in Supplementary Table 3. Ontology enrichment analysis identified six total statistically significant pathways: pantothenate and CoA biosynthesis, beta-Alanine metabolism, glycerophospholipid metabolism, and pyrimidine metabolism (q<0.20) and linoleic acid metabolism and vitamin B6 metabolism (p<0.05).
3.2 Metabolites associated with BW and BCS traits
3.2.1 Model 2: RFI
No GC-MS, LC-MS, or milk quality metabolites were associated with RFI after applying a multi-testing correction. However, the GC-MS assay identified one metabolite nominally associated with RFI was 2-Monomyristin (p<0.05). A total of 285 LC-MS metabolites were associated with RFI (p<0.05). Of these metabolites, 80 were annotated, 205 were not annotated, and 37 were unique to the reduced model. All nominally significant metabolites can be found in Supplementary Table 4. Ontology enrichment analysis identified two total statistically significant pathways: sphingolipid metabolism (q<0.10) and glycosylphosphatidylinositol anchor (GPI) biosynthesis (p<0.05).
3.2.2 Model 2: aDMI
No GC-MS, LC-MS, or milk quality metabolites were associated with aDMI after applying a multi-testing correction. However, a total of 293 LC-MS metabolites were associated with aDMI (p<0.05). Of these metabolites 85 were annotated, 208 were not annotated, and 54 were unique to the reduced model. All nominally significant metabolites can be found in Supplementary Table 5. Ontology enrichment analysis identified two statistically significant pathways (p<0.05). These pathways included: GPI anchor biosynthesis and pentose and glucuronate interconversions pathway.
3.2.3 Model 2: DMI
No GC-MS, LC-MS, or milk quality metabolites were associated with DMI after applying a multi-testing correction. However, four GC-MS metabolites were nominally associated with DMI including: beta-D-Glucopyranose, 2-Hydroxyglutaric acid, and C16:C18 ratio (p<0.05). A total of 302 LC-MS metabolites were associated with DMI (p<0.05). Of these metabolites, 104 were annotated, 198 were not annotated, and 66 were unique to the reduced model. All nominally significant metabolites can be found in Supplementary Table 6. Ontology enrichment analysis identified three total statistically significant pathways: pantothenate and CoA biosynthesis pathway (q<0.15) and valine, leucine and isoleucine biosynthesis and GPI anchor biosynthesis (p<0.05).
3.3 Association of metabolites with genetic merit for feed efficiency and energy status traits
3.3.1 Model 3: PTA body weight composite
One GC-MS metabolite was significantly associated with PTA BWC, heptanoic acid, (q<0.20), while six (D-Myo-inositol, C16:C18 ratio, L-Threonine, octanoic acid, and phosphorylethanolamine) were nominally significant (p<0.05). No LC-MS or milk quality metabolites were associated with PTA BWC after applying a multi-testing correction. However, a total of 245 LC-MS metabolites were associated with BWC PTA at a nominal significance level (p<0.05). Of these metabolites, 75 were annotated and 170 were not annotated. All nominally significant metabolites can be found in Supplementary Table 7. Ontology enrichment analysis identified five nominally significant pathways (p<0.05). These pathways included: glycerophospholipid metabolism, linoleic acid metabolism, caffeine metabolism, alpha-Linolenic acid metabolism, and GPI anchor biosynthesis.
3.3.2 Model 3: FS PTA
A total of seven GC-MS metabolites were significantly associated with PTA FS (q<0.20) including: D-Fructose, Octanoic acid, Dodecanoic acid, and 9,12-Octadecadienoic acid (Z,Z)- while nine (9-Octadecenoic acid, (E)-, Methyl alpha Lyxofuranoside, decanoic acid, hexadecanoic acid, hexanoic acid, phosphorylethanolamine, 2-Monocaprin, D-Myo Inositol, and Myo-Inositol 3,6 bisphosphate, bis[bis(trimethylsilyl) phosphate], myo-) were nominally significant (p<0.05). No LC-MS or milk quality metabolites were associated with PTA FS after applying a multi-testing correction. However, a total of 241 LC-MS metabolites were associated with PTA FS (p<0.05). Of these metabolites, 74 were annotated, and 167 were not annotated. All nominally significant metabolites can be found in Supplementary Table 8. Ontology enrichment analysis identified three nominally significant pathways (p<0.05). These pathways included: glycerophospholipid metabolism, riboflavin metabolism, and linoleic acid metabolism.
3.3.3 Model 3: PTA RFI
A total of 314 LC-MS metabolites were associated with PTA RFI (q<0.20). Of these metabolites, 86 were annotated and 228 were not annotated. All nominally significant metabolites can be found in Supplementary Table 9. Ontology enrichment analysis identified three statistically significant pathways (p<0.05). These pathways included: sphingolipid metabolism, glycerophospholipid metabolism, and linoleic acid metabolism. No GC-MS or milk quality metabolites were associated with PTA RFI after applying a multi-testing correction. However, a total of 20 GC-MS metabolites associated with RFI PTA included 9-Octadecenoic acid, (E)-, 1-Monopalmitin, 9,12-Octadecadienoic acid (Z,Z)-, D-Fructose, 2-Palmitoylglycerol, Hexadecanoic acid, 1-Monomyristin, 3-Hydroxybutyric acid, methyl alpha-Arabinofuranoside, glyceric acid, oleic acid, dodecanoic acid, Pentanoic acid, butyl ester, monolaurin, nonanoic acid, Isopropylamine, N-heptafluorobutyryl- and octanoic acid (p<0.05).
4 Discussion
The PLS-DA analysis indicated that GC-MS and LC-MS metabolite assays were able to classify cows based on their high or low RFI designation as shown in Figure 1. This result provides a basis to justify that metabolites identified in this study can differentiate animals based on their feed efficiency and body weight traits, as well as, genetic merit for three feed efficiency traits. A total of 33 GC-MS metabolites, 10 LC-MS ontology pathways, and 42 fatty acids were identified as statistically associated with feed efficiency measured as RFI, aDMI, or DMI (q<0.20; adjusted p<0.05 for the fatty acids). Metabolites and pathways that were most noteworthy and further discussed below are summarized in Table 3. The remainder of the discussion focuses on the metabolites statistically associated with feed efficiency and body size traits that were the most biologically plausible based on previous studies as biomarkers or predictors for feed efficient and related traits. Metabolites associated with milk energy sinks are not discussed further as we chose to focus on metabolites that could add new information about feed intake and body weight as several milk related measurements are already included in the estimate of RFI. The aDMI phenotype had the most statistically significant associations, specifically from the feed intake proxy model (Model 1) and the body size proxy model (Model 1 vs. Model 2) (588 total metabolites p<0.05). This may be a reflection of metabolite data representing a snapshot in time, much like aDMI which provides a point-in-time estimate of feed efficiency on the same day the metabolite sample was taken. A full summary of all significant metabolites analyzed for each of the three models can be found in the Supplementary Material.
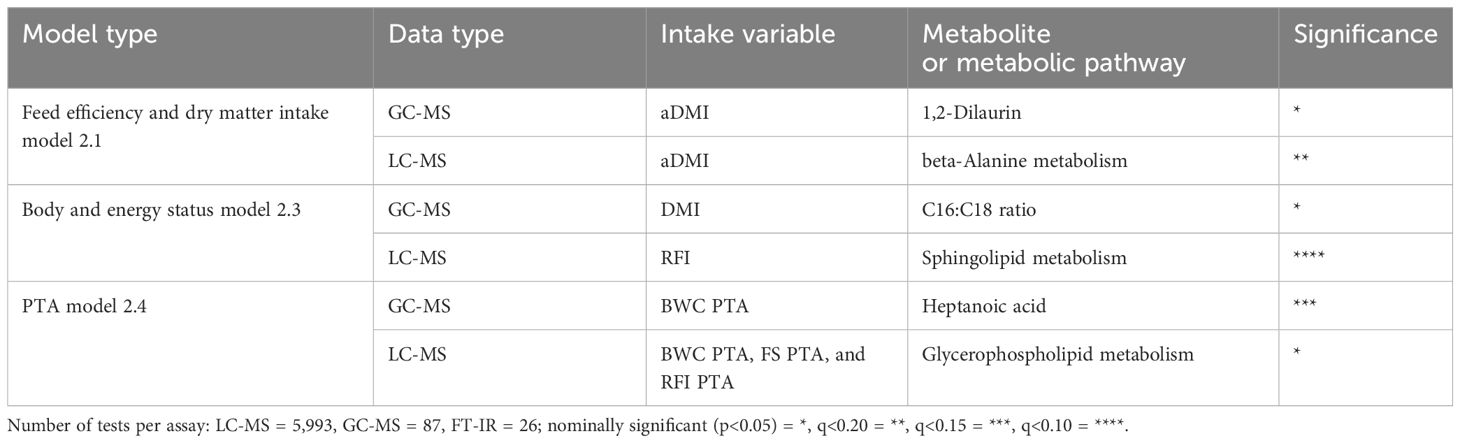
Table 3. Summary of the top metabolites as candidate indicator traits for feed efficiency based on known biological functions.
The sphingolipid, glycerophospholipid metabolism and linoleic acid metabolism pathways were all identified as statistically enriched from the list of metabolites identified as statistically different when evaluating the various feed efficiency traits in the high and low feed efficiency cows. Sphingolipids are components of cell membranes with important metabolic functions. Specifically, sphingolipid concentrations vary with differing body weights and loss in body weight and impact insulin sensitivity as well as fatty acid metabolism (Matsuura et al., 2016; McFadden and Rico, 2019; Rico et al., 2021). These metabolic processes likely directly impact the feed efficiency status of the animal. Additionally, one KEGG pathway was identified as enriched for metabolites associated with both the feed intake (1) and body weight (2), the pantothenate and CoA biosynthesis pathway (q<0.20). Changes in the pantothenate and CoA biosynthesis pathway could be indicative of how changes in milk production alter feed efficiency status. Increases in metabolites within the pantothenate and CoA biosynthesis pathways have been identified to increase milk fat and protein production levels which is thought to be due to increased glucose concentration and decreased acetic acid concentrations in response to pantothenate supplementation (Bonomi, 2000; Ragaller et al., 2011). Two additional KEGG pathways were identified as enriched for metabolites associated with feed intake (1) and breeding values for feed efficiency traits (i.e. genetics models) (3): the glycerophospholipid metabolism pathways (q<0.20) and linoleic acid metabolism (nominal p<0.05), respectively. This could be indicative of genetic variation related to ATP production efficiency and metabolic status as decreased glycerophospholipid and linoleic acid production is associated with increased inflammation and health issues, respectively (Wen et al., 2022; Hailemariam et al., 2023).
4.1 Metabolites associated with feed intake and efficiency (Model 1)
Beta-Alanine metabolism was identified as an enriched pathway from the LC-MS metabolites identified as significantly associated with aDMI in the feed intake proxy model (Model 1) (q<0.20). The metabolism of β-alanine increases the cellular oxygen consumption in conjunction with increased expression of several cellular proteins that are associated with improved oxidative metabolism (Schnuck et al., 2016). Furthermore, one of the cellular proteins that β-alanine regulates is myocyte enhancer factor 2. β-alanine increases the expression of myocyte enhancer factor 2, which leads to increased glucose transporter 4 content (Schnuck et al., 2016). Metabolic processes within the β-alanine metabolism pathway may play an important role in energy balance in dairy cattle. Abnormalities in β-alanine metabolism impacts reproduction abilities in dairy cows (Bai et al., 2021). Thus, metabolites within the β-alanine metabolism pathway may be indicators of both variation in feed efficiency and reproductive health.
The metabolite 1,2-Dilaurin as measured by GC-MS was identified as associated with aDMI in the feed intake proxy model (Model 1) at a nominal significance level (p<0.05). The 1,2-Dilaurin molecule has documented roles in lipid peroxidation, fatty acid metabolism, and the insulin signaling pathway (Wishart et al., 2007). This makes 1,2-Dilaurin a good candidate molecule to understanding more about the metabolic processes that may differ between high and low efficient animals. Furthermore, it is a substrate in 10 different enzymatic processes involving lipid metabolism, one lipid transporter protein, and gene function including hepatic and pancreatic function (Cunningham et al., 2022). Thus, 1,2-Dilaurin may act as a proxy for fatty acid metabolism in cows with differing levels of feed efficiency.
4.2 Metabolites associated with body weight traits (Model 2)
Metabolites identified by LC-MS within the sphingolipid metabolism pathway were identified as significantly associated with body weight traits in Model 2. Sphingolipid metabolism has several important connections to energy status because the metabolism of sphingolipids are regulators of major cellular processes including apoptosis, proliferation, senescence, cell signaling, and inflammation (Matsuura et al., 2016; Quinville et al., 2021). In dairy cows ceramides, which are the precursors for sphingolipids, have the potential to be indicators for hepatic function contingent on the energy status of the cow at a given time (McFadden and Rico, 2019). Furthermore, it has been shown that cows with higher adiposity have increased ceramide levels, which are secreted during circulation and may trigger an insulin action leading to a metabolic imbalance (Humer et al., 2016; Rico et al., 2021). Additionally, altered profiles of sphingolipids can be used as biomarkers for metabolic disease (Hailemariam et al., 2014). Moreover, changes in sphingolipid availability throughout the life cycle of a cow are time-dependent, which indicates the potential role ceramides play in the physiological adaptations that allow for the preservation of energy homeostasis (Navarrete, 2016). All of these combined reasons make sphingolipid metabolism an excellent candidate pathway that may be differential between high and low feed efficiency animals.
The ratio of palmitic acid to stearic acid was found nominally significant by the body weight surrogate model (Model 2) GC-MS with DMI as the dependent variable. This could be indicative of the ability this ratio has to explain the energy status of a cow since palmitic acid to stearic acid are known indicators of energy balance in dairy cattle. Palmitic acid is known to increase milk fat yield as well as restore body reserves lost during negative energy balance. Stearic acid is involved in the synthesis of milk fat and yield (Loften et al., 2014). Having an indicator for energy status that is observed in milk would help alleviate the issue of BW traits not being collected as frequently on commercial dairy farms.
4.3 Metabolites associated with genetic merit for feed efficiency traits (Model 3)
Heptanoic acid measured by GC-MS was identified as associated with PTA BWC in the genetic model (Model 3) (q<0.15). The biological role of heptanoic acid is in energy storage (Wishart et al., 2007). Additionally, heptanoic acid plays a catalytic role in the function of eight different enzymes including seven mitochondrial acyl-CoA synthetase and A2 phospholipase (Wishart et al., 2007). Among those eight enzymes one is encoded by the PLA2G1B gene, which has been associated with protein absorption and digestion, immune defense, and glycerophospholipid metabolism (Cheng et al., 2023). The mitochondrial acyl-CoA synthetase enzymes all play roles in fatty acid metabolism as ligases acting on C4 to C11 compounds (Wishart et al., 2007). In this way heptanoic acid impacts several metabolic processes, which could influence feed efficiency. Glycerophospholipid metabolism was also identified as a significantly enriched pathway from the GC-MS assay with PTA BWC this makes the PLA2G1B a gene of interest for variation in body size. The other seven genes were a part of the acyl-coenzyme A synthetase family. The acyl-coenzyme A synthetase family are vital in the activation of fatty acids and is the prerequisite for fatty acids entering anabolic and catabolic processes (Zhang et al., 2022). Thus, suggesting that the function heptanoic acid may have genetic variation between high and low feed efficient animals.
Metabolites identified by LC-MS were individually enriched for each PTA BWC, FS, and RFI using Model 3 for the ontology term glycerophospholipid metabolism pathway at a nominal significance level (p<0.05). Metabolites within this pathway would be logical indicators of energy status since levels of glycerophospholipids are associated with over-conditioning (i.e., excessive storage of adipose tissue). Glycerophospholipids are primarily synthesized in the liver, and impact hepatic energy status (Ghaffari et al., 2019). Furthermore, Ákos Kenéz et al. indicates that differing glycerophospholipid concentrations are associated with fluctuations in the metabolic status of dairy cows based on their longitudinal study tracking metabolite levels of glycerophospholipids and sphingolipids over 20 weeks starting at the last 6 weeks of pregnancy, which is a time with great potential for metabolic stress (Kenéz et al., 2016). Most importantly, glycerophospholipid metabolism has previously been associated with feed efficiency in cows during early lactation. Specifically, less efficient cows produced milk with higher concentrations of glycerophospholipids in the milk which is thought to disrupt the integrity of the mitochondria leading to compromised energy production. Glycerophospholipids can also increase inflammation, which could increase energy demands (Kvidera et al., 2017; Hailemariam et al., 2023).
4.4 Metabolites associated with on-farm milk tests (Model 1)
Fatty acids and milk quality traits measured in the on-farm milk tests were identified as statistically significant in the majority of the statistical models evaluated. It is unclear how accurate the estimates of the fatty acids are since they are inferred from FT-IR spectral data using a proprietary method (Schwarz, 2018). Since these fatty acids and milk quality traits are routinely measured on a large number of US dairy farms and are consistently associated with feed efficiency traits in this manuscript and previous studies (Brown et al., 2022), they may be useful indicators of feed efficiency. Additional research is needed to determine their heritabilities if they are to be considered for use as indicator traits for feed efficiency.
5 Conclusion
A total of 33 milk metabolites identified by GC-MS and LC-MS were identified and associated with feed intake and efficiency traits (q<0.20). Ten metabolite pathways were identified as enriched by ontology enrichment analysis, including the β-Alanine metabolism, sphingolipid metabolism, pantothenate and CoA biosynthesis, and glycerophospholipid metabolism pathways (q<0.20). These pathways have published roles in energy balance, lipid metabolism, and some were previously associated with feed efficiency. A total of 42 fatty acids and milk quality measurements were associated with feed efficiency (adj p<0.05). These on-farm milk assays already have logistical systems in place to facilitate evaluation on commercial dairy farms. In total, metabolites were identified from all assays that could be further investigated as candidate indicator traits for feed intake and efficiency. Future research should validate these associations in larger populations, across herds and determine the heritability of these traits as well as the genetic correlations with traits include feed efficiency PTAs.
Data availability statement
The original contributions presented in the study are included in the article/Supplementary Material. Further inquiries can be directed to the corresponding author/s.
Ethics statement
This study was approved by the Iowa State University (ISU) Institutional Animal Care and Use Committee (IACUC) under protocol 18-174 and 21-144. The study was conducted in accordance with the local legislation and institutional requirements.
Author contributions
LJ: Writing – original draft, Writing – review & editing, Formal analysis, Investigation. MM: Writing – review & editing, Investigation. CS-C: Writing – review & editing, Investigation. MB: Writing – review & editing, Investigation. MV: Writing – review & editing. JK: Conceptualization, Funding acquisition, Investigation, Project administration, Supervision, Writing – review & editing.
Funding
The author(s) declare financial support was received for the research, authorship, and/or publication of this article. Funding was provided by the Foundation for Food and Agricultural Research (FFAR) and the Council for Dairy Cattle Breeding (CDCB) under Project #CA18-SS-0000000236 Improving dairy feed efficiency, sustainability, and profitability by impacting farmers’ breeding and culling decisions, the Iowa Agriculture and Home Economics Experiment Station, Ames, Iowa (Project No. NRSP-8), the Hatch Act and the State of Iowa.
Acknowledgments
The authors wish to thank Dr. Ranga Appuhamy Jayasooriya and Dr. Susan Lamont for their helpful comments and suggestions to improve the manuscript. Additionally, we would like to thank Dr. Philip Dixon for the guidance and advice on data analysis. We acknowledge the Iowa State University W.M. Keck Metabolomics Research Laboratory (RRID: SCR 017911) for providing analytical instrumentation and we thank Dr. Ann M. Perera and Dr. Lucas J. Showman for their assistance and support. We also wish to thank Dr. Marcela de Souza for her guidance and sharing of resources.
Conflict of interest
The authors declare that the research was conducted in the absence of any commercial or financial relationships that could be construed as a potential conflict of interest.
Publisher’s note
All claims expressed in this article are solely those of the authors and do not necessarily represent those of their affiliated organizations, or those of the publisher, the editors and the reviewers. Any product that may be evaluated in this article, or claim that may be made by its manufacturer, is not guaranteed or endorsed by the publisher.
Supplementary material
The Supplementary Material for this article can be found online at: https://www.frontiersin.org/articles/10.3389/fanim.2024.1393996/full#supplementary-material
References
A J., Trygg J., Gullberg J., Johansson A. I., Jonsson P., Antti H., et al. (2005). Extraction and gc/ms analysis of the human blood plasma metabolome. Anal. Chem. 24, 8086–8094. doi: 10.1021/ac051211v
Bai Y., Song Y., Zhang J., Fu S., Wu L., Xia C., et al. (2021). Gc/ms and lc/ms based serum metabolomic analysis of dairy cows with ovarian inactivity. Front. veterinary Sci. 8. doi: 10.3389/fvets.2021.678388
Bonomi A. (2000). Dairy cattle ration integration with rumen-protected pantothenic acid. effects on milk production and reproductive efficiency. Rivista di Scienza dell'Alimentazione. 29, 321–338.
Bristol D. (1995). Delta: The true clinically significant difference to be detected. Drug Inf. J. - Drug INF J. 29, 33–36. doi: 10.1177/009286159502900105
Brown W., Caputo M., Siberski C., Koltes J., Peñagaricano F., Weigel K., et al. (2022). Predicting dry matter intake in mid-lactation holstein cows using point-in-time data streams available on dairy farms. J. Dairy Sci. 105, 9666–9681. doi: 10.3168/jds.2021-21650
Cavani L., Gaddis K. L. P., Baldwin R. L., Santos J. E., Koltes J. E., Tempelman R. J., et al. (2023). Impact of parity differences on residual feed intake estimation in holstein cows. J. Dairy Sci. 4, 201–204. doi: 10.3168/jdsc.2022-0307
Cheng Z., Ferris C., Crowe M. A., Ingvartsen K. L., Grelet C., Vanlierde A., et al. (2023). Hepatic global transcriptomic profiles of holstein cows according to parity reveal age-related changes in early lactation. Int. J. Mol. Sci. 24, 9906. doi: 10.3390/ijms24129906
Connor E. E. (2015). Invited review: improving feed efficiency in dairy production: challenges and possibilities. Animal 9, 395–408. doi: 10.1017/S1751731114002997
Cunningham F., Allen J. E., Allen J., Alvarez-Jarreta J., Amode M. R., Armean I. M., et al. (2022). Ensembl 2022. Nucleic Acids Res. 50, D988–D995. doi: 10.1093/nar/gkab1049
Dechow C., Baumrucker C., Bruckmaier R., Blum J. (2017). Blood plasma traits associated with genetic merit for feed utilization in holstein cows. J. Dairy Sci. 100, 8232–8238. doi: 10.3168/jds.2016-12502
Dórea J. R. R., Rosa G. J. M., Weld K. A., Armentano L. E. (2018). Mining data from milk infrared spectroscopy to improve feed intake predictions in lactating dairy cows. J. Dairy Sci. 101, 5878–5889. doi: 10.3168/jds.2017-13997
Franzoi M., Niero G., Meoni G., Tenori L., LuChinat C., Penasa M., et al. (2023). Effectiveness of mid-infrared spectroscopy for the prediction of cow milk metabolites. J. Dairy Sci. 106, 5288–5297. doi: 10.3168/jds.2023-23226
Gaddis K. L. P., VanRaden P. M., Tempelman R. J., Weigel K. A., White H. M., Peñagaricano F., et al. (2021). Implementation of feed saved evaluations in the u.s (Leeuwarden, The Netherlands: INTERBULL BULLETIN). Available at: https://www.ars.usda.gov/ARSUserFiles/80420530/Publications/Scientific/Conferences/2021/IB_56_147-152_ParkerGaddisEtAl.pdf.
Ghaffari M. H., Jahanbekam A., Sadri H., Schuh K., Dusel G., Prehn C., et al. (2019). Metabolomics meets machine learning: Longitudinal metabolite profiling in serum of normal versus overconditioned cows and pathway analysis. J. Dairy Sci. 102, 11561–11585. doi: 10.3168/jds.2019-17114
Hailemariam D., Hashemiranjbar M., Manafiazar G., Stothard P., Plastow G. (2023). Milk metabolomics analyses of lactating dairy cows with divergent residual feed intake reveals physiological underpinnings and novel biomarkers. Frontiers 10. doi: 10.3389/fmolb.2023.1146069
Hailemariam D., Mandal R., Saleem F., M. Dunn S., S. Wishart D., N. Ametaj B. (2014). Metabolomics approach reveals altered plasma amino acid and sphingolipid profiles associated with patholological state in transition dairy cows. Curr. Metabolomics 2, 184–195. doi: 10.2174/2213235X03666141216201446
Humer E., Khol-Parisini A., Metzler-Zebeli B. U., Gruber L., Zebeli Q. (2016). Alterations of the lipid metabolome in dairy cows experiencing excessive lipolysis early postpartum. PloS One 11, e0158633. doi: 10.1371/journal.pone.0158633
Kenéz Á., Dänicke S., Rolle-Kampczyk U., von Bergen M., Huber K. (2016). A metabolomics approach to characterize phenotypes of metabolic transition from late pregnancy to early lactation in dairy cows. Metabolomics 12, 165. doi: 10.1007/s11306-016-1112-8
Koek M. M., Muilwijk B., van der Werf M. J., Hankemeier T. (2006). Microbial metabolomics with gas chromatography/mass spectrometry. Anal. Chem. 4, 1272–1281. doi: 10.1021/ac051683+
Koltes J. E., Kumar D., Kataria R. S., Cooper V., Reecy J. M. (2015). Transcriptional profiling of prkg2-null growth plate identifies putative down-stream targets of prkg2. BMC Res. Notes 8. doi: 10.1186/s13104-015-1136-6
Kunes R., Bartos P., Iwasaka G. K., Lang A., Hankovec T., Smutny L., et al. (2021). In-line technologies for the analysis of important milk parameters during the milking process: A review. Agriculture 11, 239. doi: 10.3390/agriculture11030239
Kvidera S., Dickson M., Abuajamieh M., Snider D., Fernandez M. S., Johnson J., et al. (2017). Intentionally induced intestinal barrier dysfunction causes inflammation, affects metabolism, and reduces productivity in lactating holstein cows. J. dairy Sci. 100, 4113–4127. doi: 10.3168/jds.2016-12349
Loften J. R., Linn J. G., Drackley J. K., Jenkins T. C., Soderholm C. G., Kertz A. F. (2014). Invited review: palmitic and stearic acid metabolism in lactating dairy cows. J. Dairy Sci. 97, 4661–4674. doi: 10.3168/jds.2014-7919
Marchi M. D., Toffanin V., Cassandro M., Penasa M. (2014). Invited review: Mid-infrared spectroscopy as phenotyping tool for milk traits. J. dairy Sci. 97, 1171–1186. doi: 10.3168/jds.2013-6799
Marinho M. N., Santos J. E. P. (2022). Association of residual feed intake with blood metabolites and reproduction in holstein cows. Frontiers 3. doi: 10.3389/fanim.2022.847574
Matsuura K., Canfield K., Feng W., Kurokawa M. (2016). “Chapter two - metabolic regulation of apoptosis in cancer,” International review of cell and molecular biology (United States: Academic Press). doi: 10.1016/bs.ircmb.2016.06.006
McFadden J., Rico J. (2019). Invited review: Sphingolipid biology in the dairy cow: The emerging role of ceramide. J. Dairy Sci. 102, 7619–7639. doi: 10.3168/jds.2018-16095
Navarrete J. E. R. (2016). Sphingolipid metabolism and insulin resistance in dairy cattle. West Virginia University. Available at: https://researchrepository.wvu.edu/cgi/viewcontent.cgi?article=8281&context=etd. Master’s thesis.
Pang Z., Chong J., Zhou G., D. M., Chang L., Barrette M., et al. (2021). Metaboanalyst 5.0: narrowing the gap between raw spectra and functional insights. Nucl. Acids Res. doi: 10.1093/nar/gkab382
Quinville B. M., Deschenes N. M., Ryckman A. E., Walia J. S. (2021). A comprehensive review: Sphingolipid metabolism and implications of disruption in sphingolipid homeostasis. Int. J. Mol. Sci. 22, 5793. doi: 10.3390/ijms22115793
Ragaller V., Lebzien P., Südekum K.-H., Hüther L., Flachowsky G. (2011). Pantothenic acid in ruminant nutrition: a review. J. Anim. Physiol. Anim. Nutr. 95, 6–16. doi: 10.1111/j.1439-0396.2010.01004.x
R Core Team (2013). R: A Language and Environment for Statistical Computing (Vienna, Austria: R Foundation for Statistical Computing).
R Core Team (2021). R: A Language and Environment for Statistical Computing (Vienna, Austria: R Foundation for Statistical Computing).
Rico J. E., Sandri E. C., Sarmiento A. C., Lévesque J., Kenéz Á., Rico D. E. (2021). Modulation of plasma and milk sphingolipids in dairy cows fed high-starch diets. Metabolites 11, 711. doi: 10.3390/metabo11100711
Schnuck J. K., Sunderland K. L., Kuennen M. R., Vaughan R. A. (2016). Characterization of the metabolic effect of -alanine on markers of oxidative metabolism and mitochondrial biogenesis in skeletal muscle. J. Exercise Nutr. Biochem. 20, 34–41. doi: 10.20463/jenb.2016.06.20.2.5
Schwarz D. (2018). Quality assurance tools in milk-testing laboratories– the view of an instrument manufacturer. Available online at: https://www.icar.org/Documents/Auckland-2018/Daniel%20Schwarz%20Quality%20Assurance%20Tools%20in%20Milk-Testing.pdf. (accessed September 18, 2023)
Siberski C. J. (2019). Utilizing automated sensors as indicator traits for feed intake in lactating Holstein dairy cattle and the influence of health status. Iowa State University. Available at: https://dr.lib.iastate.edu/entities/publication/8023745b-2f38-4f31-b9f1-52821fc1ad0d. Master’s thesis.
Siberski–Cooper C. J., Mayes M. S., Healey M., Goetz B. M., Baumgard L. H., Koltes J. E. (2022). Associations of wearable sensor measures with feed intake, production traits, lactation, and environmental parameters impacting feed efficiency in dairy cattle. Front. Anim. Sci. 3. doi: 10.3389/fanim.2022.841797
Siberski-Cooper C. J., Mayes M. S., Gorden P. J., Hayman K., Hardie1 L., Shonka-Martin B. N., et al. (2023). The impact of health disorders on automated sensor measures and feed intake in lactating holstein dairy cattle. Frontiers 3. doi: 10.3389/fanim.2022.1064205
Smith C. A., Maille G. O., Want E. J., Qin C., Trauger S. A., Brandon T. R., et al. (2005). Metlin: a metabolite mass spectral database. Ther. Drug Monit 27. doi: 10.1097/01.ftd.0000179845.53213.39
Storey J. D., Bass A. J., Dabney A., Robinson D. (2022). qvalue: Q-value estimation for false discovery rate control. R package version 2.30.0.
Tempelman R. J., Spurlock D. M., Coffey M., Veerkamp R. F., Armentano L. E., Weigel K. A., et al. (2015). Heterogeneity in genetic and nongenetic variation and energy sink relationships for residual feed intake across research stations and countries. J. Dairy Sci. 98, 2013–2026. doi: 10.3168/jds.2014.8510
USDA-ERS (2022). National milk cost of production. Available online at: https://www.ers.usda.gov/data-products/milk-cost-of-production-estimates/. (accessed February 3, 2023)
van Gastelen S., Mollenhorst H., Antunes-Fernandes E., Hettinga K., van Burgsteden G., Dijkstra J., et al. (2018). Predicting enteric methane emission of dairy cows with milk fourier-transform infrared spectra and gas chromatography–based milk fatty acid profiles. J. Dairy Sci. 101, 5582–5598. doi: 10.3168/jds.2017-13052
Wallén S., Prestløkken E., Meuwissen T., McParland S., Berry D. (2018). Milk mid-infrared spectral data as a tool to predict feed intake in lactating norwegian red dairy cows. J. Dairy Sci. 101, 6232–6243. doi: 10.3168/jds.2017-13874
Wang X., Kadarmideen H. N. (2019). Metabolomics analyses in high-low feed efficient dairy cows reveal novel biochemical mechanisms and predictive biomarkers. metabolites 9, 151. doi: 10.3390/metabo9070151
Wen Y., Shang Y., Wang Q. (2022). Exploration of the mechanism of linoleic acid metabolism dysregulation in metabolic syndrome. Genet. Res., 6793346. doi: 10.1155/2022/6793346
Wishart D. S., Tzur D., Knox C., Eisner R., Guo A. C., Young N., et al. (2007). HMDB: the human metabolome database. Nucleic Acids Res. 35, D521–D526. doi: 10.1093/nar/gkl923
Xia J., Psychogios N., Young N., Wishart D. S. (2009). Metaboanalyst: a web server for metabolomic data analysis and interpretation. Nucleic Acids Res. 37, W652–W660. doi: 10.1093/nar/gkp356
Keywords: dairy cattle, feed intake, feed efficiency, biomarker, milk metabolites
Citation: James LM, Mayes MS, Siberski-Cooper CJ, Breitzman MW, Vandehaar MJ and Koltes JE (2024) Association of milk metabolites with feed intake and traits impacting feed efficiency in lactating Holstein dairy cows. Front. Anim. Sci. 5:1393996. doi: 10.3389/fanim.2024.1393996
Received: 29 February 2024; Accepted: 26 July 2024;
Published: 04 September 2024.
Edited by:
Angela Cánovas, University of Guelph, CanadaReviewed by:
Jon Schoonmaker, Purdue University, United StatesBradley Heins, University of Minnesota Twin Cities, United States
Copyright © 2024 James, Mayes, Siberski-Cooper, Breitzman, Vandehaar and Koltes. This is an open-access article distributed under the terms of the Creative Commons Attribution License (CC BY). The use, distribution or reproduction in other forums is permitted, provided the original author(s) and the copyright owner(s) are credited and that the original publication in this journal is cited, in accordance with accepted academic practice. No use, distribution or reproduction is permitted which does not comply with these terms.
*Correspondence: James E. Koltes, amVrb2x0ZXNAaWFzdGF0ZS5lZHU=