
95% of researchers rate our articles as excellent or good
Learn more about the work of our research integrity team to safeguard the quality of each article we publish.
Find out more
ORIGINAL RESEARCH article
Front. Anim. Sci. , 25 October 2023
Sec. Animal Nutrition
Volume 4 - 2023 | https://doi.org/10.3389/fanim.2023.1260787
This article is part of the Research Topic Alternative Feed Ingredients for Sustainable Livestock Production. View all 10 articles
 Philip Wagali1
 Godliver Ngomuo1
 Justine Kilama1
 Chris Sabastian1
 Shiran Ben-Zeev2Yehoshav A. Ben-Meir3
 Nurit Argov-Argaman1
 Yehoshua Saranga2
 Sameer J. Mabjeesh1*
Teff (Eragrostis tef) is a drought-tolerant, multi-harvest, high-quality summer forage crop. We conducted a study aiming at assessing the effect of replacing wheat hay with teff hay in diets on the feed intake, digestibility, and lactational performance of dairy cows. Thirty-four multiparous (≥3rd parity) Israeli Holstein Friesian dairy cows averaging (± SD) 182 days in milk ± 8 days in milk, 45 kg/d ± 4.8 kg/d of milk yield, and a body weight of 647.1 kg ± 51 kg at the beginning of the study were recruited to a 6-week feeding trial. Cows were randomly divided into two balanced groups based on parity, days in milk, and milk yield. Cows were subjected to two low-roughage dietary treatments (~30% roughage): a control wheat hay-based diet and a teff hay-based diet. Production performances, dry matter intake, and nutrient digestibility were measured. Milk samples were analyzed for their composition and fatty acids profile. Blood samples were used to measure metabolite concentrations. The statistical model included fixed effects of dietary treatments, time, and random effects of cows nested in treatment. Production data and feed intake were analyzed as repeated measures using a covariance structure. Dietary treatments did not affect dry matter intake (26 kg/d). However, the teff-fed cows demonstrated higher crude protein digestibility than control cows (61.9% vs. 59.2%). Dietary teff inclusion increased milk yield by 1.5 kg/d. Polyunsaturated fatty acids and omega-3 fatty acids profiles in milk were greater in the teff cows than in the control cows (4.77 g/100 g vs. 4.36 g/100 g and 3.71 g/100 g vs. 3.43 g/100 g, respectively). Non-esterified fatty acids, beta-hydroxybutyrate, and blood urea nitrogen concentrations in circulation were higher in the control group than in the teff group. The acetic-to-propionic-acid ratio in the rumen fluid was higher in control cows than in teff cows (2.90 vs. 2.43). However, the ruminal ammonia-N concentration was higher in the teff cows than in the control cows (18.5 mg/dL vs. 15.8 mg/dL). In conclusion, teff hay inclusion in the rations of high-producing dairy cows increased milk yield, which could be attributed to improved crude protein digestibility and energy partition to production.
Global milk production increased to 887 million tons per annum in 2021, with 81.0% of the total milk produced coming from cows, and this figure is projected to reach 1,060 million tons per annum by 2031 (OECD-FAO, 2022). The increase in milk production is mainly due to a continuous increase in the number of herds, rain-fed fodder availability, and the intensification of modern production systems. However, dairy production is dependent on traditional forages that are often scarce, expensive, and seasonal, which highlights the importance of improving forage production and feeding efficiencies to meet the milk demand.
In dairy production, the cost of feeding constitutes 60.0% of the total production costs (Lawrence et al., 2008). To address this issue and offset the higher prices of feeds in the dairy industry and their limited availability, there is a need to identify cost-effective and well-adapted forages. Teff (Eragrostis tef), a C4 warm-season annual crop from the Chloridoideae subfamily of grasses, is one such alternative, with over 4,000 varieties identified (Miller, 2011; Assefa et al., 2013). Moreover, it is tolerant to a wider range of biotic and abiotic stresses and rarely requires irrigation during the growing period (Davison and Creech, 2011; Roseberg et al., 2018). Teff is a multipurpose crop used for both human and livestock consumption (NRC, 1996; Miller, 2011; Habte et al., 2019).
The crop has been used mainly by humans in the horn of Africa for over 6,000 years to make the traditional Ethiopian bread “Injera” and other meals (Roseberg et al., 2018; Chanyalew et al., 2019; Girija et al., 2022). Teff grain is gluten-free and contains higher levels of minerals such as calcium, iron, and magnesium than wheat, barley, and sorghum grains (Mengesha, 1966). Teff can also be used to feed livestock as it is a multi-harvest forage that performs better during summer. It can produce high-quality hay in a short growing period, unlike most common forages such as Timothy grass (Miller, 2011; Roseberg et al., 2018; Habte et al., 2019). Teff straw, after grain harvest, is also used to feed farm animals. Teff can be ensiled and preserved as a high-quality forage.
Teff silage has been proven to have high-quality in vitro DM digestibility (IVDMD) (57.0% to 66.1%) (Wagali et al., 2023) and teff straw is also considered to have high digestibility values compared with barley and wheat straw (Assefa et al., 2013). Several studies have investigated the nutritional value of teff hay and silages. For example, CP concentration was shown to range from 7.5%–18.7%, whereas NDF concentration ranged from 58.6%–70.8% in teff hay (Vinyard et al., 2018; Ream et al., 2020; Wagali et al., 2023). The IVDMD of teff silage and in vivo DMD of teff hay ranged from 58.0% to 67.0% (Ream et al., 2020; Wagali et al., 2023). The in vitro NDF digestibility of teff silage was up to 55.0% (Wagali et al., 2023), and the in vivo NDF digestibility of teff hay in beef cattle was up to 69.0% (Ream et al., 2020). However, the nutritional composition of teff, similar to that of other forages, may vary greatly depending on its variety, growth conditions, and maturity stage at harvest, as elaborated by Buxton (1996) and Wagali et al. (2023).
Although previous studies have investigated the effect of teff forage digestibility in horses, beef cattle, and sheep (Hagos and Melaku, 2009; Staniar et al., 2010; Vinyard et al., 2018), the effect of feeding teff-based rations to high-producing dairy cows has scarcely been studied. Our goal is to establish teff as a multi-harvest summer fodder crop in Israeli dairy cows’ rations. We hypothesized that a teff-based diet fed to high-producing dairy cows might be an alternative feeding strategy that could replace the wheat hay-based diet that is common in Israel. Therefore, the objective of this study was to evaluate the effect of a teff-based diet compared with a wheat-based diet on the feed intake, digestibility, and lactational performance of high-yielding dairy cows.
The experiment was conducted for 42 consecutive days, and all procedures followed the ethical guidelines of the Volcani Center Animal Committee (approval number B17051), and all procedures involving the use of animals for in situ experiments were approved by the Institutional Animal Care and Use Committee (IACUC) of the Hebrew University of Jerusalem (ethical approval number AG-14102). The study recruited 34 multiparous high-yielding Israeli Holstein dairy cows for a feeding experiment, and they were housed in covered loose pens at the Volcani Center experimental farm in Rishon LeZion, Israel. The pens were equipped with real-time electronic individual feeders that could record the individual feed intake of cows via sensors that opened specific feeders for each cow (ID tag, S.A.E Kibbutz Afikim, Israel).
Cows were randomly divided into two balanced groups, each containing 17 cows, on the basis of their DIM, BW, parity, and milk yield (MY). After a covariate period of 14 days, to allow the cows to adapt to the feeders and diets, we began to take measurements. The cows were fed basal diets formulated to meet the net energy of lactation (NEL) and metabolizable protein (MP) requirements (NRC, 2001) based on real production data collected.
The control group, with an average (± SD) 50.0 kg/d ± 6.0 kg/d MY, 178.0 ± 88.5 DIM, 3.0 ± 1.1 parity, and 647.4 kg ± 47.0 kg BW, was fed a wheat-based TMR. The teff group, with 49.9 kg/d ± 3.5 kg/d MY, 185.3 ± 73.0 DIM, 3.1 ± 1.3 parity, and 646.8 kg ± 55.0 kg BW, was fed a TMR containing 11.9% teff hay as a replacement for wheat hay. Both diets were prepared and delivered by Yavne feed center, Kibbutz Yavne, Israel (Table 1). Rations were designed to have similar nutrient concentrations and NEL.
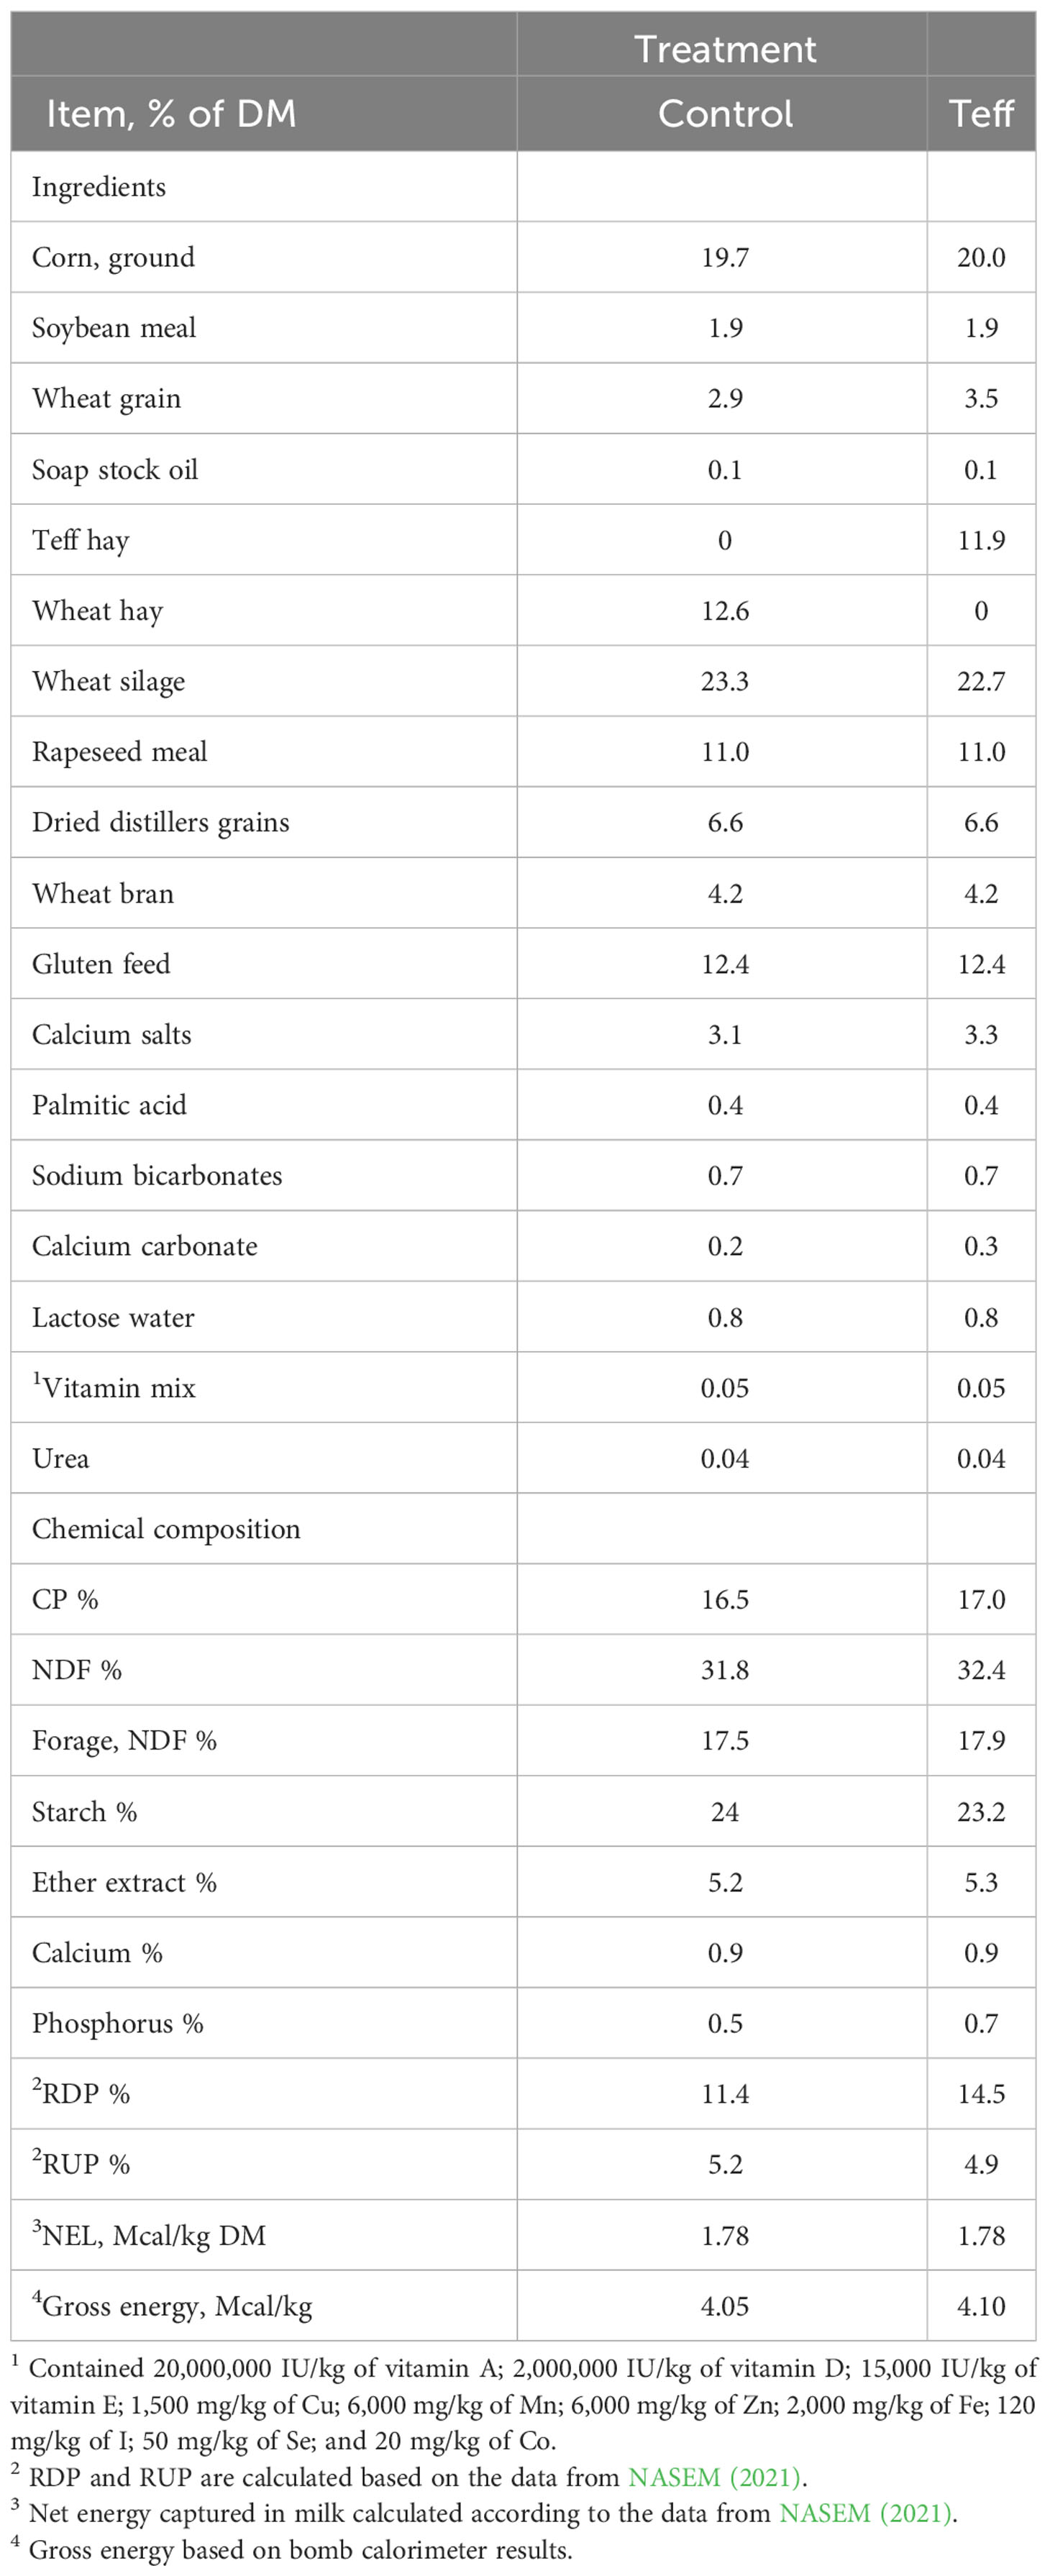
Table 1 Ingredients and chemical composition of the experimental diets.
The cows were fed daily at 11:00 by a feeder wagon (RMH Mixell 14, Lachish Industries Ltd, Israel) at 105% of the expected intake, which was then adjusted based on each cow’s intake data recorded on the previous day. The actual feeding trial was conducted for 28 consecutive days, after a 14-day adaptation period to feeders and diets, during which samples were collected. Feed samples for evaluation of digestibility, intake, and chemical composition were collected twice per week. Ort samples were collected from each feeder at 07:00, before the feeders were cleaned and fresh feed was added for 3 consecutive days per week and sorted by cow and week for digestibility and intake analysis. Particle size fractions of the two diets (teff and control) and ort samples were determined once every week using the Penn State Particle Size Separator (PSPS) as summarized in Table 2. The PSPS is designed to separate particles by repeated 40 shaking motions through screens of 19.0 mm, 8.0 mm, and 4.0 mm and the bottom pan (Kononoff et al., 2003). Before analysis, feed and ort samples were dried at 60°C for 48 hours and ground using a hammer mill with a 4.0-mm screen, and later to finer particles in a knife mill (Thomas–Willey Laboratory Mill, model 4, Arthur H. Thomas Company, Philadelphia, PA, USA) to pass through a 2-mm screen. Samples of the two diets and ort samples were then analyzed for CP, DM, EE, and OM content in accordance with AOAC (1990) methods. Fiber analyses, i.e., α-amylase heat-stable-treated aNDF, ADF, hemicellulose, cellulose, and ADL were conducted in accordance with the method described by Van Soest et al. (1991), utilizing an Ankom200 Fiber Analyzer, model 200l (ANKOM Technology Corp., Macedon, NY, USA).
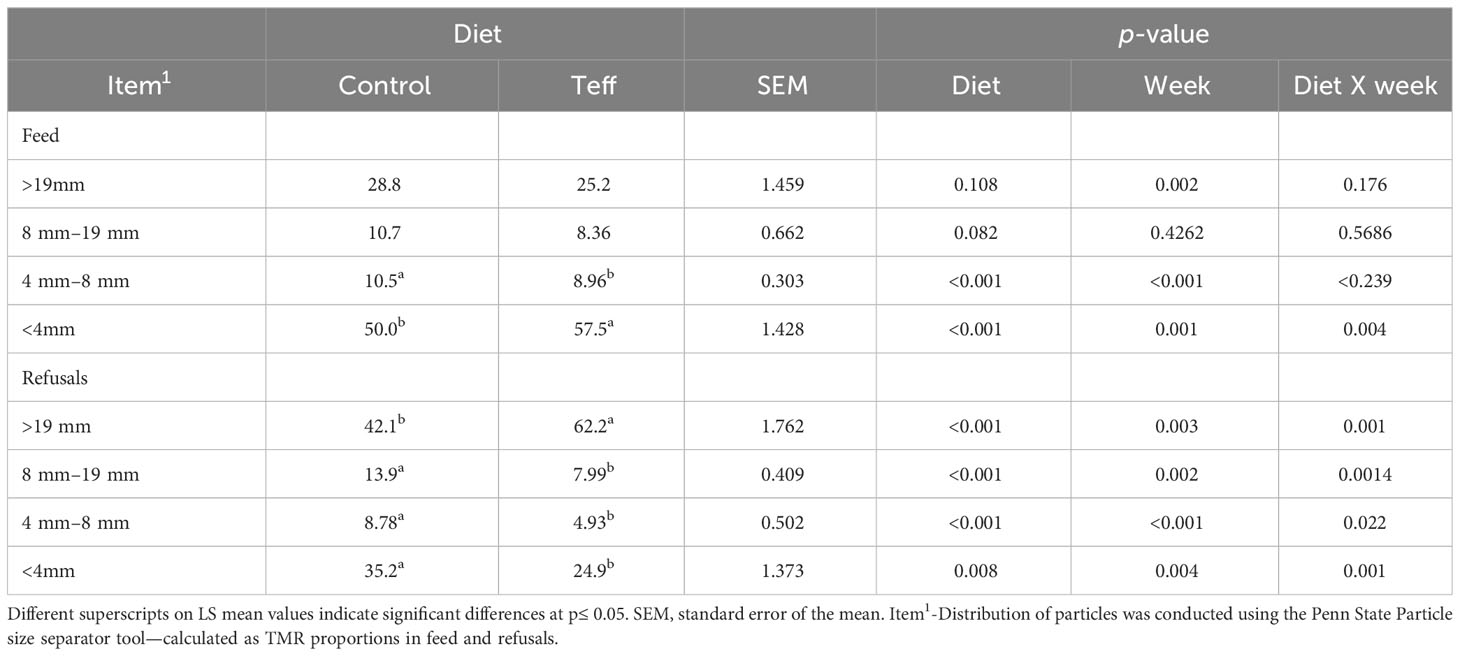
Table 2 Particle size distribution (DM-Basis) in feed and refusal samples.
The gross energy contents of the two diets, ort, and fecal samples were determined using a 6100 Compensated Calorimeter (Parr Instrument Company, Moline, IL, USA). Dry matter intake, CP intake (CPI), NDF intake (NDFI), OM intake (OMI), and ADF intake (ADFI) were computed from pooled weekly samples. The intake of each nutrient was computed as the difference between the content of a specific nutrient found in the feed offered and that found in the orts. The nutrient composition of the two diets was calculated from the chemical composition as presented in Table 3. The balances of rumen-degradable protein (RDP), rumen-undegradable protein (RUP), NEL, and MP were estimated based on the method described (NRC, 2001) using the average DMI, MY, milk composition, and BW of the cows during the experimental period.
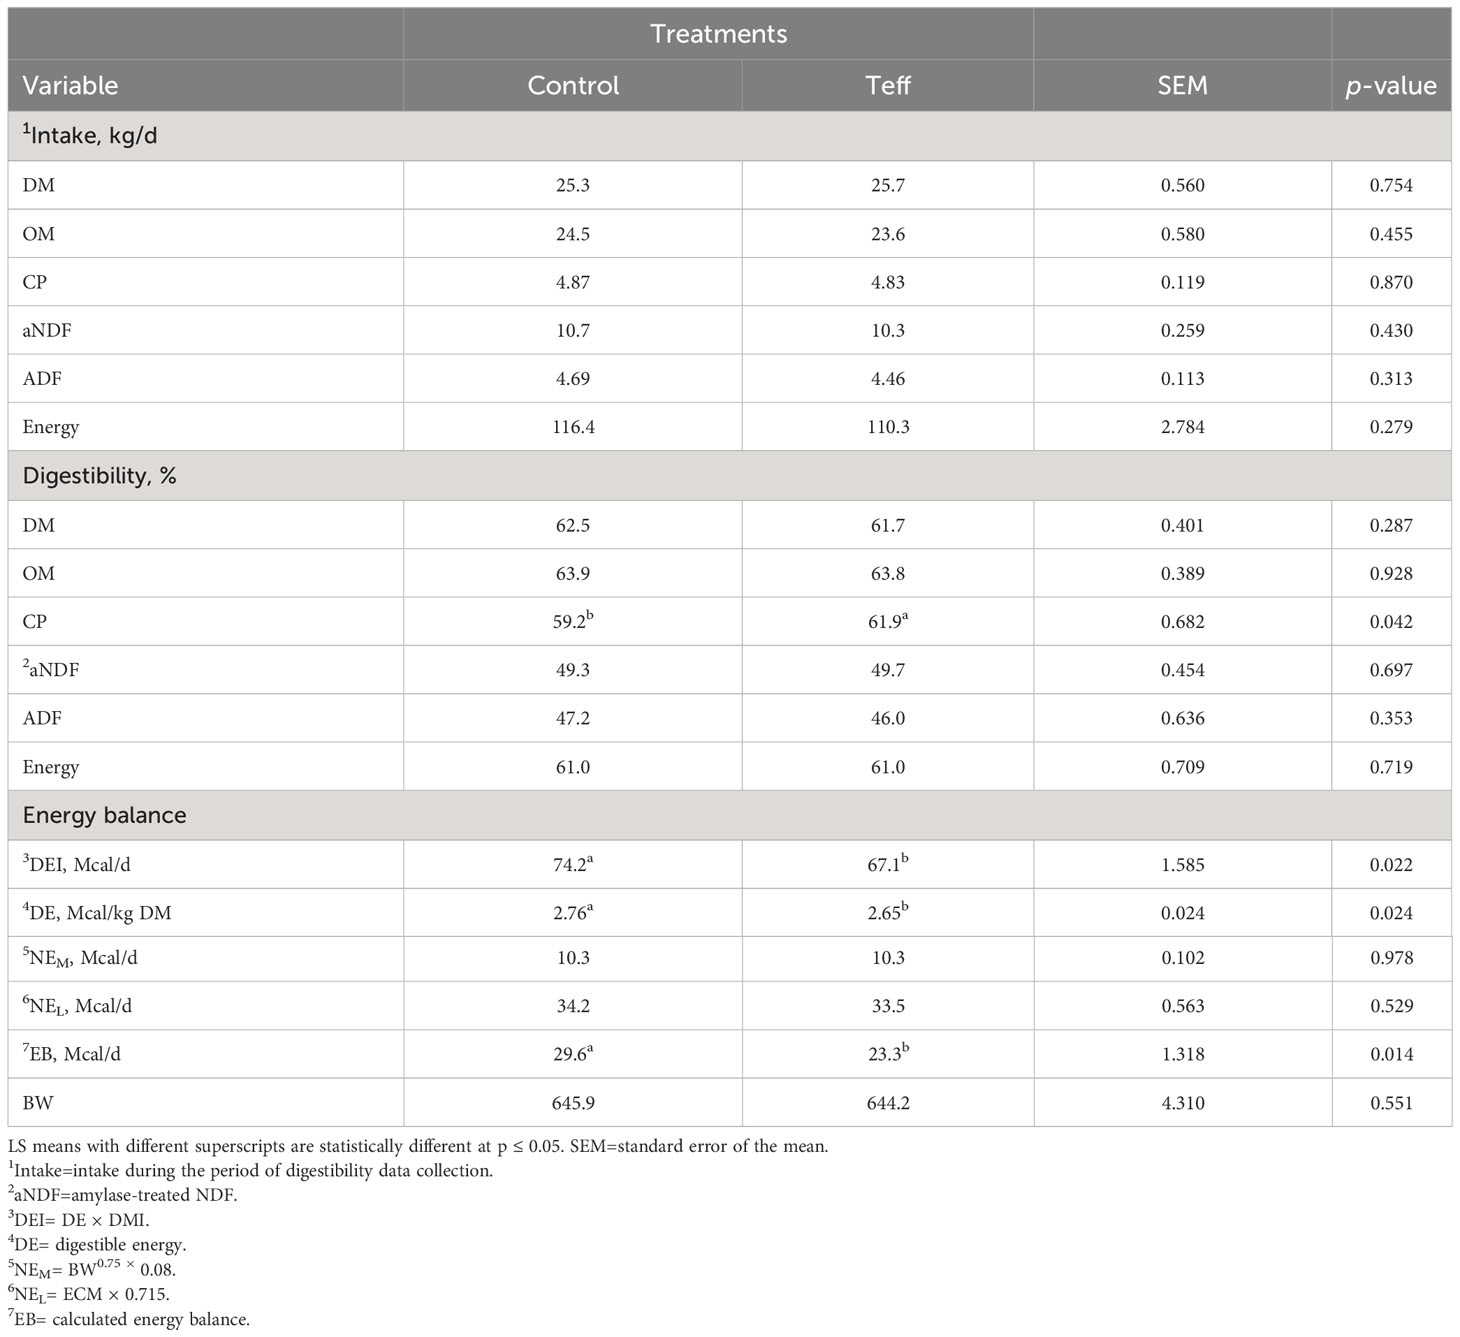
Table 3 Effects of diets on the intake and digestibility of nutrients in dairy cows.
To determine the apparent total tract digestibility of treatment diets, fecal samples were collected by rectal grab sampling from each cow during week 6 of the experiment. Samples were taken for 2 consecutive days at 07:00, 10:30, 15:00, and 22:00. Eight samples were collected from each cow, pooled, then dried in an air-forced oven at 60°C for 48 hours and ground to pass through a 2-mm screen using a knife mill (Thomas–Willey Laboratory Mill, model 4, Arthur H. Thomas Company, Philadelphia, PA, USA). Ground fecal samples were subjected to chemical fiber-based analysis if DM, OM, CP, AND EE, and gross energy was calculated in accordance with the method described above. Approximately 500 mg of each of the sorted fecal, orts, and diet samples were weighed into F57 Dacron filter bags with 25-micron porosity and incubated for 240 hours using a DaisyII220 incubator (ANKOM Corp, Fairport, NY, USA) to determine the indigestible NDF (iNDF). The iNDF was used as an internal marker to estimate the fecal amount and calculate nutrient digestibility (Huhtanen et al., 1994). The digestibility of CP, NDF, ADF, OM, and DM were calculated based on the relationship between the feed intake and fecal output of each cow (Adin et al., 2009).
To determine in situ degradability of teff and wheat hay, approximately 4.0 g of teff sample were weighed into Ankom R510, a 5 cm×10 cm Dacron bags with 50-micron porosity and incubated in duplicates inside rumen utilizing two cannulated wether Assaf sheep fed a standard diet containing 2.42 Mcal ME, 120.0 g of CP per kg DM basis. Sheep diets comprised 73.0% roughage feeds including wheat silage, wheat hay, clover hay, concentrates, minerals, and vitamins to meet the maintenance requirements (NRC, 2007). Bags were incubated in duplicates at 0 hours, 3 hours, 6 hours, 9 hours, 12 hours, 24 hours, 48 hours, and 96 hours. It is worth noting that incubation at time 0, bags were placed in a hot water bath at 39°C for 1 hour and agitated intermittently to determine the solubility of the samples. After the incubation, the bags were hand-washed until the water was clear and dried at 60°C for 48 hours to determine the degradability of nutrients in accordance with the method described by Ørskov and McDonald (1979). Degradability parameters: a (solubility, %), b (potential degradability by time, %), and kd (rate of degradability, %/hours). DM degradability (DMD), crude protein degradability (CPD), NDF degradability (NDFD), and OM degradability (OMD) were computed using a passage rate (kp) of 8.0%.
Cows were milked three times a day at 06:00, 14:00, and 21:00, and milk yield was recorded automatically during each milking using the Afifarm software, v. 5.2.1 (Afimilk Ltd, Kibbutz Afikim, 1514800, Israel), installed at the milking parlor. Cows were weighed automatically after each milking by a walk-on scale in the system when exiting the milking parlor. Milk samples were collected from three consecutive milking occasions once every 7 days, four different tests using these samples were conducted. Milk samples were collected into 50.0-mL tubes containing bromo-2-nitropropane-1,3-diol tablets (Advanced Instruments Inc, Two-technology way, Norwood, MA 02062) as a preservative and sent to the Central Laboratory in Caesarea, Israel, for compositional analysis. Milk percentages of fat, lactose, true protein, urea, and somatic cell count were analyzed. Prior to sending the milk samples, 5.0 mL from each milking occasion were pooled from cows to make a total of 15 mL for further analysis. A 2-mL volume of milk was transferred from 15.0-mL tubes to Eppendorf tubes for fatty acid profile analysis as described by Mesilati-Stahy and Argov-Argaman (2014) using an Agilent 6890N network gas chromatograph (Agilent Technologies, Santa Clara, CA, USA).
Energy-corrected milk (ECM) was calculated using the formula: ECM, kg/d = milk yield (kg/d) × {[0.3887 × milk fat (%)] + [0.2356 × milk protein (%)] + [0.1653 × milk lactose (%)]}/3.1338 kg/d of standard milk containing 3.5% fat, 5% lactose, and 3.5% protein, and an energy value of 0.715 Mcal/d (NRC, 2001). The efficiency of milk production was calculated as ECM/DMI. The energy content in milk was computed following (NRC, 2001) equations. The energy balance (EB) was also calculated on a daily basis using values from NRC (1989) as shown in the equations below.
In which, EB = energy balance, NEL = net energy of lactation, NEm = net energy required for maintenance, DE = digestible energy, and DEI = digestible energy intake.
During week 6 of the experiment, blood samples were collected twice from each cow. Blood was withdrawn from the coccygeal blood vessel during the last day of the experiment using a 20-gauge×2.54 mm needle into 9-mL vacutainer tubes containing Lithium Heparin (BD Vacutainer, Plymouth, UK). The first sampling was carried out in the morning (07:00) before feeding (i.e., rations were removed from feeders) and the second collection was carried out 3 hours after feeding (10:00). Blood glucose and β-hydroxybutyrate (βHB) were measured immediately after sampling (Pichler et al., 2014) using the Freestyle Optimum β-ketone test strips and Freestyle Optimum glucose test strips (Abbott Diabetes Care Ltd, Berkshire, UK). The rest of the blood samples were kept on ice for 4 hours before being centrifuged at 1,500xg at 4°C for 20 minutes to obtain plasma. Plasma samples were stored at −20°C until the further analysis of non-esterified fatty acids (NEFA) was carried out in accordance with the method described by Johnson and Peters (1993) using the Wako NEFA kit (Wako chemicals, GmbH, Neuss, Germany). Blood urea nitrogen (BUN) was also analyzed using a calorimetric method read in 96-well plates (96 MaxisorpNunc- Immuno plates, Roskilde, Denmark) in a spectrophotometer (Biotek ELx808, Lumitron Ltd) in accordance with the method described by Coulombe and Favreau (1963).
Rumen fluid samples were collected from each cow twice during the last day of the experiment in 50-mL tubes to determine the changes in the concentration of volatile fatty acids (VFA) and ammonia nitrogen (N–NH3) with time. The first collection was conducted at 07:00, after milking and before feeding. The second collection was conducted 3 hours after feeding. All collections were conducted with great care by trained personnel in accordance with the method described in the study by Ben Meir et al. (2021). Rumen fluid (400 mL) was collected from each cow using a self-made esophageal metal-coated rubber pipe (2 m length, 15 mm internal diameter, with 24 pores of 4 mm diameter each around the edge of a metal head) connected to a vacuum pump. To avoid saliva contamination and to ensure an adequate volume of fiber-containing rumen fluid, the vacuum pump was turned on only after the sampler pipe was inserted and the first 200 mL of rumen fluid was discarded to prevent contamination with saliva. The pH of each rumen fluid sample was measured immediately using a pH meter (Sartorius Company, Göttingen, Germany). After centrifugation at 2,000×g at 4°C for 10 minutes, samples were stored at −20°C for further analysis. The VFA concentrations were analyzed as described in the study by Erwin et al. (1961) using a Hewlett Packard HP 5890 gas chromatograph (Conquer Scientific Company, Poway, CA, USA). Ammonia concentrations were measured as explained by Bower and Holm-Hansen (1980).
Statistical analyses of the data collected were conducted using JMP Pro (version 16.0.0, SAS Institute Inc., Cary, NC, USA). The production data collected during the second week of the experiment were treated as a covariate when relevant. Continuous data, including DMI, OMI, milk yield, milk composition (lactose, fat, protein, urea, and somatic cell count), production efficiency, and ECM were averaged per experimental week and analyzed using a MIXED procedure and a suitable covariance structure with data from the covariate period. The autoregressive order 1 (AR1) structure was found to be the most suitable to be used. Blood metabolites (NEFA, βHB, and blood glucose), milk FA profile, and rumen metabolites (N–NH3, VFA, and rumen pH) were also analyzed using a two-way ANOVA, with the treatment and time of sampling as fixed factors. The statistical model included the fixed effects of treatment (diet), week, and their interaction, and cow as a random effect nested within treatment.
In which µ = overall mean, Ti = fixed effect of treatment i, C(T)ij = random effect of cow j = nested within treatment i, Lk = fixed effect of week k, Lk × Ti = the fixed effect of interaction between treatment and week, Eijk = residual error.
Nutrient intake (CP, ADF, and NDF), nutrient digestibility, energy balance, and whole-chemical composition (i.e., CP, OM, DM, ADL, EE, NDF, ADF, hemicellulose, cellulose, and starch) were analyzed using MIXED procedures as previously described, but without the repeated measurements and week effect. The data are presented as LS means with adjusted standard error of the mean (SEM). Statistical differences were considered significant at p ≤ 0.05 and tendencies at 0.05< p≤ 0.10.
The feed particle size distribution (Table 2) was similar for both diets, except for minor differences in the 4 mm–8 mm fraction, in which the particle size was greater in the control group than in the teff group (p< 0.001), and the< 4 mm fraction had an interaction between diet and week (p = 0.004), with these particles being fewer in the control group than in the teff group in week 2 and week 4 (≈ 17 and ≈8% units, respectively), but slightly more numerous in the control group than in the teff group during week 5 of the trial. On average the 4-mm fraction in teff was greater than the control. Refusals differed between diets, with an interaction between diet and week observed. The greatest differences were noted in week 5 of the trial, with the control group having more than twice the particle distribution than the teff group. In terms of refusal particles > 19 mm in size, we observed that there was a larger number of these in the teff-fed group than in the control group, whereas for<19-mm refusal particles, the teff-fed group had fewer of these than the control group (Table 2).
Feed intake and digestibility did not differ among diets, except in terms of crude protein digestibility, which was greater in teff cows than in control cows by 2.7% (Table 3; p = 0.042, 61.9% vs. 59.2%, respectively). Digestible energy intake was higher in control cows than in teff-fed cows (p = 0.022; 74.2 Mcal/d vs. 67.1 Mcal/d, respectively). A similar trend was noted with regard to energy balance (p = 0.014; 29.6 Mcal/d vs. 23.3 Mcal/d; Table 3).
The in situ degradability of teff and wheat hay used for formulating the diets showed that NDF was almost insoluble, with a lower solubility for OM in teff than wheat hay (Figure S1) as elaborated in Table S1. However, CP solubility in teff hay was higher than it was in wheat hay by 18% (55.1% vs. 37.5%, respectively). Despite the potential CPD of teff hay with time being lower than that of wheat hay, its potential OMD with time was higher. Interestingly, despite being almost insoluble, teff hay had a very high potential degradability with time, and its NDFD was up to 80.0%, similar to that of wheat hay. Teff hay had lower rates of degradability per hour than wheat hay for all the parameters (DMD, OMD, CPD, and NDFD) in situ. A comparison between the effective degradabilities of teff hay and wheat hay showed that teff hay had higher CPD values than wheat hay Figure S1, and as detailed in Table S1.
Despite the lack of difference in intake between the diets, teff increased the daily milk yield by 1.5 kg/d (p< 0.001; 43.1 kg/d vs. 44.6 kg/d, respectively). Similarly, a higher trend in milk protein (p = 0.009; 1.42 kg/d vs. 1.51 kg/d, respectively) and milk lactose yields (p = 0.003; 2.10 kg/d vs. 2.26 kg/d, respectively; Table 4) was observed in the teff group than in the control group. There was an interaction between diet and week, which was nearly statistically different for daily milk fat yield (p = 0.094), with a higher milk fat yield in teff cows than in control cows in the last week of the experiment (1.73 kg/d vs. 1.60 kg/d, respectively). Milk lactose showed a nearly significant effect of time (p = 0.078) as it decreased from 4.90% in week 5 to 4.73% in week 6. Milk yield efficiency expressed per DMI was also nearly significant (p = 0.063), with that in the teff-fed group at week 5 being higher than that in the control group (1.75 kg/d vs. 1.64 kg/d, respectively). The ECM yield efficiency expressed per DMI tended to have an interaction effect between diet and week (p = 0.086) and tended to be higher in the teff group than in the control group during week 5 of the trial (1.77 kg/d vs. 1.54 kg/d, respectively; Table 4).
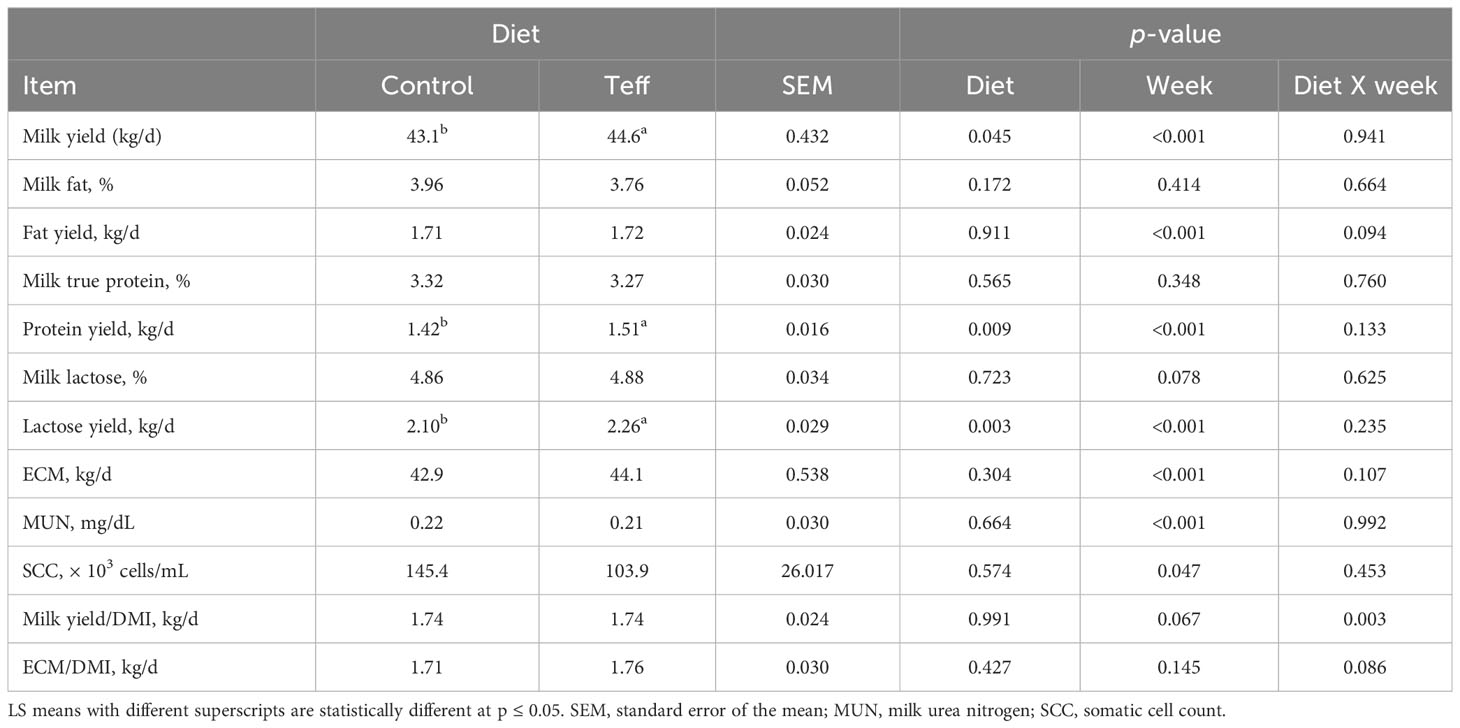
Table 4 Effects of diets on dry matter intake, milk yield, and components in dairy cows.
A comparison between the two diets showed that teff led to an increase in the levels of some fatty acids, such as C18:1, trans 9, C18:2n6cis, polyunsaturated fatty acids (PUFA), omega-3, and total trans fatty acids concentration, and that the increase associated with C20:0 and this tended to be statistically significant (Table 5). However, levels of C16:0 and saturated fatty acids were reduced in the teff treatment compared with the control, and this tended to be statistically significant. The levels of the rest of the fatty acids were similar among the diets. The analysis of the TMR FA profiles of the control and teff diets showed that the teff diet had higher levels of PUFA than the control diet (Table S2).
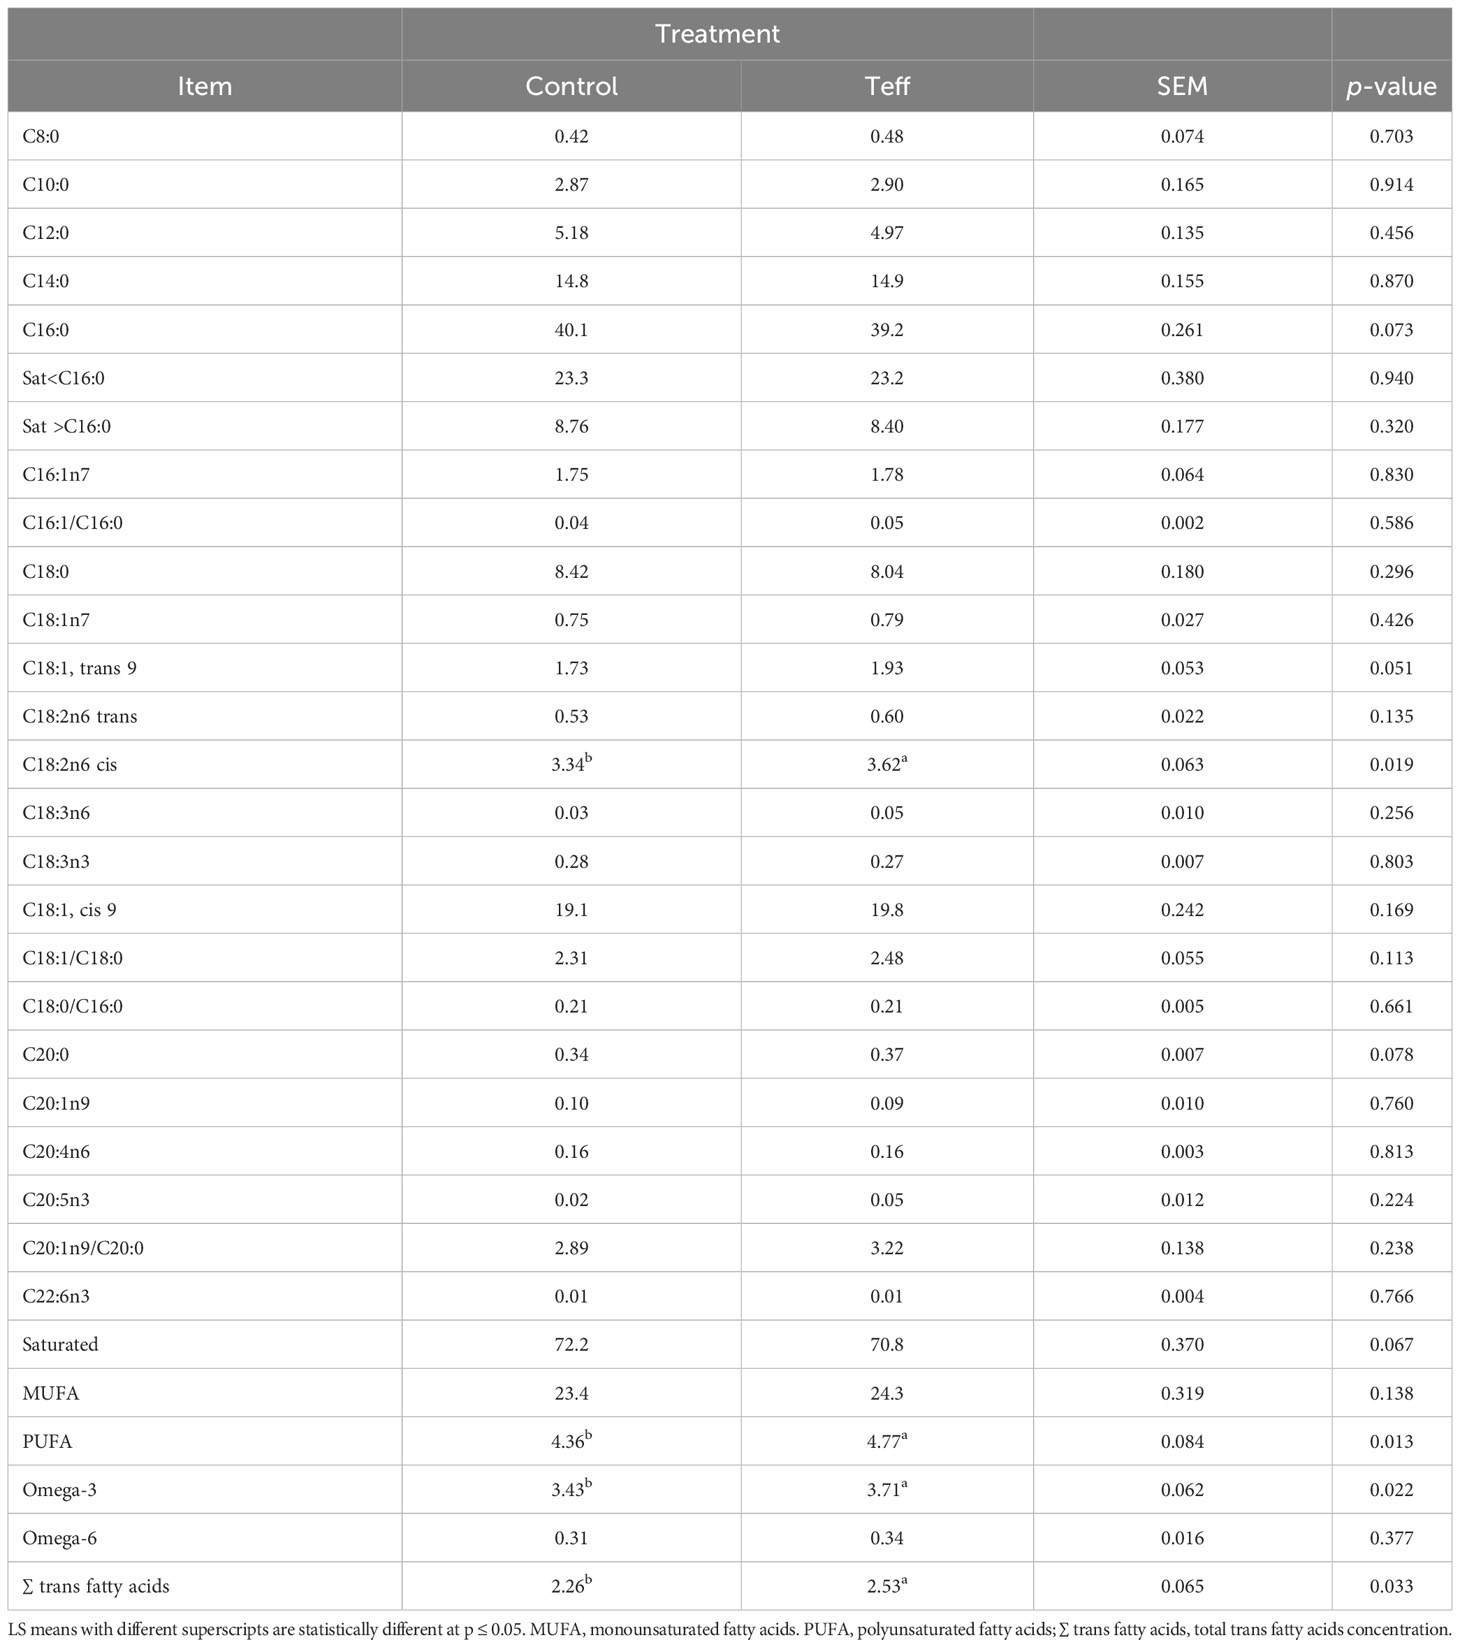
Table 5 Effects of diets on the fatty acid composition of milk fat (g/100 g of total fatty acids) in dairy cows.
The pH tended to be statistically different and was higher in the control treatment than in the teff treatment (p = 0.075), whereas the concentration of N–NH3 was higher in the teff treatment than in the control treatment (p = 0.004, 18.50 mg/dL vs. 15.83 mg/dL, respectively; Table 6). A comparison of the volatile fatty acids concentration between the teff and control diets showed that the concentration of acetic acid (C2) was higher in the control treatment than in the teff treatment (p = 0.040, 61.7 mmol/dL vs. 58.8 mmol/dL, respectively), propionic acid (C3) was higher in the teff treatment than in the control treatment (p = 0.001, 26.2 vs. 22.5 mmol/100 mmol, respectively), and the ratio of C2 to C3 was higher in the control treatment than in the teff treatment (p = 0.014). The rumen pH decreased between 0 hours and 3 hours in a similar pattern in both the teff and control groups (Δ 0.40, teff vs. Δ 0.22, control). A similar trend was observed for C2 and isovaleric acid [I-C5 (Δ 12.7, teff vs. Δ 14.7, control, and Δ 0.14, teff vs. Δ 0.12, control, respectively]. The rumen N–NH3 increased between 0 hours and 3 hours (Δ 16.6, teff vs. Δ 14.9, control). In addition, C3, butyric acid (C4), valeric acid (C5), and total VFAs increased between 0 hours and 3 hours (C3; Δ 6.42 vs. Δ 6.86, C4; Δ 5.09 vs. Δ 6.47, C5; Δ 0.99 vs. Δ 1.07 and total VFAs concentration; Δ 39.67 vs. Δ 32.49, for teff vs. control, respectively). It is worth noting that the ratio of C2 to C3 decreased between 0 hours and 3 hours (Δ 1.24, teff vs. Δ 1.60, control).
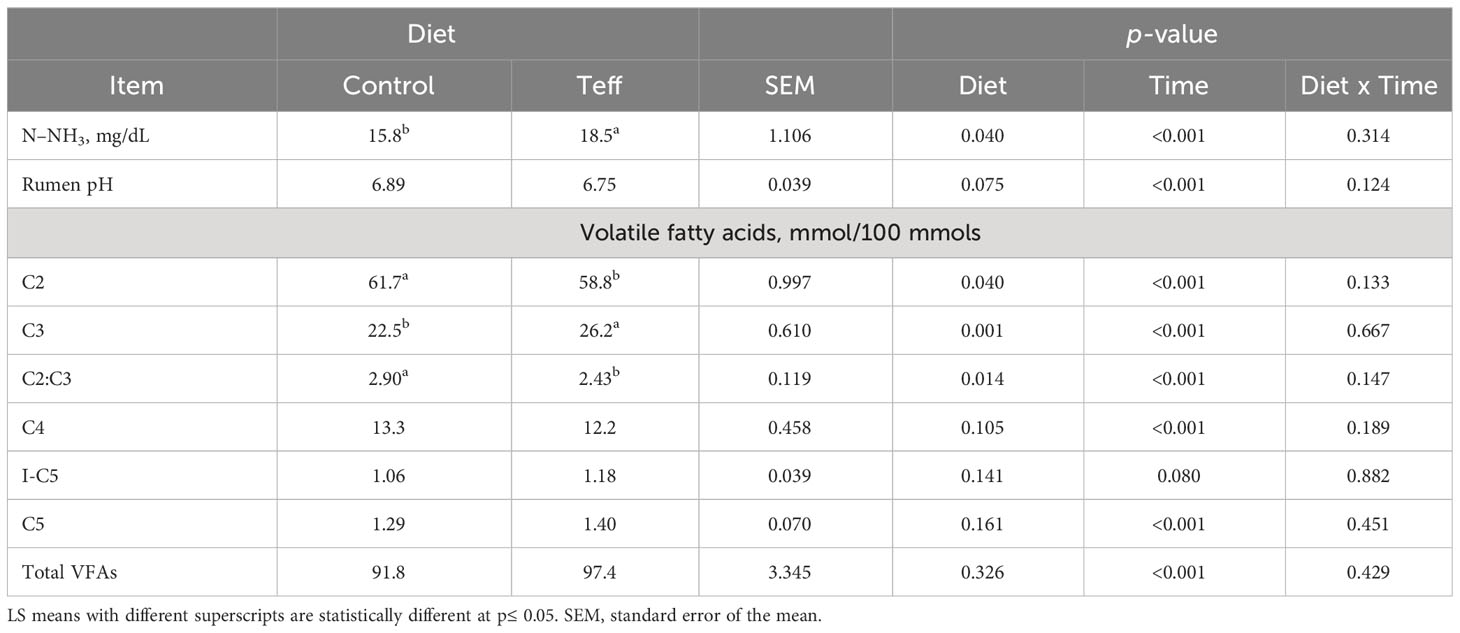
Table 6 Effects of diet on N–NH3, rumen pH and VFA in dairy cows.
The glucose level was similar between the treatments and averaged 46.2 mg/dL. Beta-hydroxybutyrate tended to be statistically different with higher concentrations in the control treatment than in the teff treatment (p = 0.072, 1.02 mmol vs. 0.83 mmol, respectively). A similar trend was noted in NEFA (p = 0.015, 201.8 µEq/L vs. 166.1 µEq/L, respectively), whereas the BUN was lower in the control treatment than in the teff treatment (p = 0.0460, 24.4 mg/dL vs. 27.8 mg/dL, respectively; Table 7). Blood glucose and BUN decreased in both diets between 0 hours and 3 hours (glucose; Δ 4.35 vs. Δ 1.71, BUN; Δ 2.78 vs. Δ 2.99 for teff vs. control, respectively) whereas NEFA and βHB increased between 0 hours and 3 hours (NEFA; Δ 17.5 vs. Δ 51.3, βHB; Δ 0.70 vs. Δ 0.83 for teff vs. control, respectively).
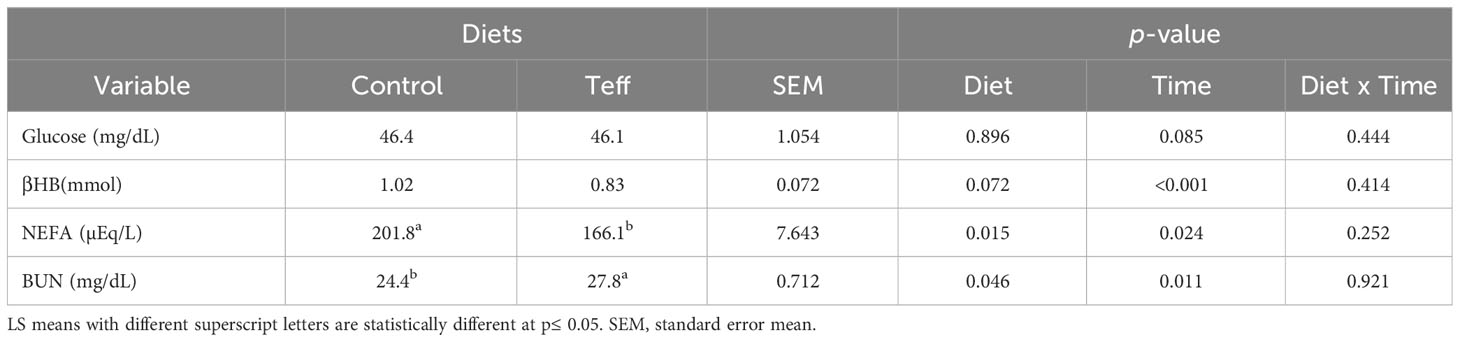
Table 7 Effects of diets on blood concentration of glucose, βHB, NEFA, and BUN in dairy cows.
In this study, we aimed to assess the effect of teff hay inclusion in rations on dairy cows’ production and performance. We compared feed intake and digestibility, milk yield and composition, fatty acids composition, rumen fluid parameters (pH and N–NH3 and VFA concentrations), and blood metabolites (glucose, βHB, NEFA, and BUN) between teff- and wheat-based rations. The inclusion of teff led to increased milk production, milk protein, and lactose yields.
Feed intake was similar for both diets, with an average DMI of 25.5 kg/d and DM and OM digestibilities having similar averages (62.1% and 63.9%, respectively). Factors such as particle size, particle fragility, NDF content, forage-to-concentrate ratio, the passage rate of feed in the reticulorumen, and the ruminal distension of the reticulorumen resulting from gut fill may influence intake in ruminants (Allen, 1996; Allen, 2000; Zebeli et al., 2007). The NDF content tended to be higher in teff hay than in wheat hay (70% vs. 62%; respectively) as reported by Beck et al. (2009) and Staniar et al. (2010). Hence, we expected to observe differences in the intake of nutrients between the two diets. However, there were no actual differences observed, probably because of the different inclusion levels of dietary forage (11.9% teff vs. 12.6% wheat in DM). In addition, cows in the control group consumed more of the long particles (>19 mm), whereas those in the teff group consumed more of the short particles (<19 mm) which could partially explain the similarities in intake. Longer particle size leads to greater fill as a result of a slow passage rate, whereas a reduction in particle size increases the passage rate (Allen, 2000; Yansari et al., 2004). Longer particles contain more NDF and ADF content than finely chopped particles (Sudweeks et al., 1979; Bal et al., 2000). Similar DMI results (ranging from 25 kg/d–27 kg/d) were reported by Rezac et al. (2012) between the cows fed 20% tall prairie hay (68.0% NDF) and cows fed corn silage (43.0% NDF), alfalfa hay (44.0% NDF), and wet corn gluten feed (38.0% NDF). Saylor et al. (2018) also reported a similar intake averaging 28 kg/d in cows fed different forages (teff vs. corn silage, alfalfa, and prairie hay).
The higher CPD in the teff diet (61.9%) might be attributable to the higher level of RDP in and solubility of teff hay than in wheat hay. However, digestibility in ruminants can be influenced by other factors such as their eating patterns, the retention time of feed in the rumen, fiber composition, level of intake, passage rate, and particle size of feed (Van Soest, 1994). In our case, similarities in DMD, OMD, NDFD, and ADFD could be attributed to similar intakes of nutrients, as discussed earlier, and differences in the inclusion levels of forage, but most importantly, the similarities in their retention time in the rumen. The selective consumption of particles between the two groups could also explain the similar digestibilities observed, which was in agreement with a study by Yansari et al. (2004), who reported a similar digestibility of nutrients in TMR diets containing different particle sizes in dairy cows. A study by Saylor et al. (2018) also found no differences in DMD and NDFD when teff hay was used solely to replace alfalfa hay, corn silage, and prairie hay in dairy cows. It might be concluded that cows consuming the teff-based TMR diet selected and consumed smaller particles, which in turn might support the similar retention time in the rumen and apparent total tract digestibility of nutrients in both the teff-based and wheat-based diets.
The DEI, DE, and EB were lower in the teff treatment than in the control treatment, whereas the BW, NEM, and NEL were similar between the teff and control treatments. Despite the lower energy balance values in the teff than in the control diets, the cows fed the teff diet had higher milk yields, which would imply that they had more efficient energy utilization. We postulated that the energy in the teff-fed cows was retained for production purposes rather than losses in heat production.
An increment of 1.5 kg/d milk yield was recorded for cows fed the teff diet compared with cows fed the control diet, with a similar trend in milk lactose and true protein yields. The concentrations of milk fat, milk true proteins, milk lactose, and ECM were similar in both diets. The milk parameters assessed in our study were within acceptable ranges in high-yielding dairy cows, as reported by Ben Meir et al. (2021) and Habel et al. (2022). Our results are also similar to the findings of Saylor et al. (2018), who reported a tendency to increase milk protein yield and milk urea nitrogen (MUN) associated with a teff-based diet compared with a control diet. The ECM and ECM/DMI results were similar to earlier findings reported in dairy cows by Saylor et al. (2018) and Ben Meir et al. (2021). However, our results pertaining to milk protein concentration and lactose yield were contradictory to the earlier findings of Saylor et al. (2018). The differences between our findings and those of Saylor et al. (2018) could be attributed to the use of teff hay as the sole feed in their study; in our study, teff was mixed in TMR. The milk produced by cows consuming a teff-based diet had numerically higher total VFAs concentrations than that produced by those consuming a control diet with predominantly C2, C3, and C4, constituting approximately 70% of ME in ruminants (Dijkstra, 1994; Reynolds et al., 2003; Seymour et al., 2005). Our results showed that the fermentation of the teff-based diet increased propionate, lowering the ratio of C2 to C3 in the rumen. The increased C3 is a major glucogenic precursor (Larsen and Kristensen, 2009; Aschenbach et al., 2010; Dijkstra et al., 2012) supplying over 65% net glucose in lactating cows (Reynolds et al., 2003; Seymour et al., 2005) partitioned for the higher milk, lactose, and protein yields in the teff-based diet than in the control diet. The propionate and total VFA concentrations were positively correlated with milk yield, protein, and acetate, which was negatively correlated with milk yield (Seymour et al., 2005). Hence, feeding teff to high-yielding dairy cows could be beneficial as it increased propionate associated with increased milk yield and proteins.
In both treatments, N–NH3 concentration was within normal ranges as reported by (Schaefer et al., 1980; Pengpeng and Tan, 2013) which is usually sufficient for rumen microbial growth and below toxicity levels (Patra, 2015). The teff-based diet had higher concentrations of ruminal N–NH3. It increased 3 hours post-feeding and was still higher in the teff diet than in the control diet. The ruminal N–NH3 concentrations in the teff diet in our study were higher than previously reported values in the diets of beef cattle (Vinyard et al., 2018; Ream et al., 2020). The differences between our findings and the earlier findings of Vinyard et al. (2018) and Ream et al. (2020) could be attributed to the level of feed intake (beef heifers and steers vs. dairy cows). In addition, the teff variety might affect its composition and nutritional value (Wagali et al., 2023). Nonetheless, the teff hay used in the earlier studies by Vinyard et al. (2018) and Ream et al. (2020) was harvested at boot, early heading, or late heading, whereas our teff hay was harvested at early heading. It is probable that the elevated concentrations of N–NH3 observed in the teff-based diet are attributable to the high solubility of CP in teff hay compared with that in wheat hay and the salivary supply of urea that is converted to N–NH3 (Bailey and Balch, 1961). However, the accumulation of N–NH3 implies that there were inadequate levels of the ruminally degradable carbohydrates which initiate the fermentation of amino acids as an energy source, causing nitrogen loss (Nocek and Russell, 1988; Hristov and Jouany, 2005). The utilization of rumen N–NH3 is dependent on the carbohydrate and nitrogen supply balance, synchronization, and availability for microbes (Hristov and Jouany, 2005). Carbohydrate availability influences the microbial growth rate and the efficient utilization of N–NH3 in the rumen (Russell et al., 1983). The higher N–NH3 concentration in the teff-based diet implies asynchrony between protein and available energy, in turn hindering the efficient conversion of nitrogen into MCP and amino acids. Thus, it is necessary to ensure the synchronization of available nitrogen and energy in the diet to improve ruminal fermentation, feed utilization, and MPS (Cabrita et al., 2006).
The pH of both diets was within the optimal range (6–7) for rumen physiology (Patra, 2015). Ruminal pH tended to have a lower value in the teff-based diet than in the control diet. A decrease (Δ 0.31) in pH was observed 3 hours post-feeding (6.98, control, vs. 6.67, teff). Similar findings were reported on dairy cows fed TMR containing mixed hay and haylage in the study by Duffield et al. (2004). The total VFA concentration had a greater influence on the rumen pH than the concentrations of individual VFAs (Dijkstra, 1994). The slightly lower ruminal pH in the teff-based diet was attributed to the total VFA. A slight decline in the ruminal pH post-feeding (3 hours) could be due to the production of VFA during the fermentation process, as postulated by Allen (1997). That being said, it should be kept in mind that both TMRs in the current study contained a buffering agent (sodium bicarbonates) that might have compromised the real effect of fermentation on the pH values.
Our VFA results are within the acceptable ranges (≤ 130 mM) previously reported by Bannink and Tamminga (2005). Although slightly lower, the results were also similar to the VFA ranges summarized in the study by Seymour et al. (2005). A teff-based diet decreased the molar proportion of acetic acid, which is often correlated with decreased milk yield, but favored the production of more total VFA concentration and increased the molar proportion of propionic acid. This is desirable in increasing milk yield and proteins as propionic acid is glucogenic, constituting over 65% of the net glucose supply that could be partitioned for milk production in lactating cows, as reported by Reynolds et al. (2003) and Seymour et al. (2005).
The glucose levels were similar in both diets (averaged 46.3 mg/dL). However, during the pre-feeding period, the glucose level was higher than average 3 hours after feeding. Our results agree with the findings of Piantoni et al. (2015), who reported a decrease in plasma glucose levels 4 hours post-feeding in early and late lactating dairy cows. The increased production of propionate in the rumen, followed by higher absorption into the circulation, prompts insulin secretion and gluconeogenesis, resulting in lower levels of glucose 3 hours post-feeding compared with pre-feeding (Aschenbach et al., 2010). It was also postulated that immediately after feeding, glucose was converted into glycogen and stored in the liver during the absorptive phase of digestion to be used during the post-absorptive phase (Aschenbach et al., 2010).
Blood urea N concentrations were significantly higher in cows consuming the teff-based diet than those consuming the control diet. Despite the levels of BUN concentration dropping over time, teff steadily demonstrated elevated concentrations compared with the control. Teff proteins are highly soluble and rapidly degraded to N–NH3; consequently, detoxification of N–NH3 to urea-N in the liver triggers the accumulation of BUN in the blood (Satter, 1986; Nocek and Russell, 1988; Hristov et al., 2011). It is proposed that the increase in BUN could be related to the higher ruminal N–NH3 concentrations. In this study, we showed that teff hay had a higher soluble CP fraction than wheat hay (this was demonstrated in situ). Apart from the dietary source, the continuous secretion of saliva by the parotid and sublingual glands enhances the urea supply to the rumen (Bailey and Balch, 1961). This could perhaps contribute to the higher concentration of BUN in the cows fed the teff diets. The decreased ruminal concentrations of BUN observed 3 hours post-feeding could be related to recycling it back to the rumen N–NH3 pool, saliva, and excretion in urine and feces (Lapierre and Lobley, 2001; Marini and Van Amburgh, 2003), causing a decline in BUN concentration over time.
Cows fed the teff-based diet had lower plasma NEFA concentrations, with a slight decrease in βHB levels compared with the control group. The plasma NEFA concentrations and βHB levels declined with time, with those in the cows on the teff-based diet being consistently lower than in those cows on the control diet. Comparable findings on βHB were reported in dairy cows 4 hours post-feeding by Piantoni et al. (2015). High levels of plasma NEFA indicate negative energy balance (NEB) in ruminants, which is typically associated with low blood glucose concentrations and increased levels of plasma βHB (Bell, 1995). Although plasma NEFA and βHB were significantly lower in teff-fed cows, the blood glucose concentration was similar between the two dietary treatments. Ospina et al. (2010) benchmarked ≥ 600 µEq/L of NEFA as a higher concentration in dairy cows. Thus, the plasma concentrations of NEFA and βHB observed were within the tolerance threshold of high-yielding dairy cows in mid-lactation. The plasma concentrations of NEFA and βHB reduced as the cows’ EB decreased, which contrasts with the findings of Gross et al. (2011), who reported elevated plasma NEFA and βHB levels along with a decrease in EB in dairy cows. The differences between our results and those of Gross et al. (2011) could be due to the fact that the cows studied in their experiment were in early lactation and ours were in late lactation. Furthermore, in the cows in their study, in contrast to ours, NEB was induced by physiological feed intake restriction. According to Craninx et al. (2008), reductions in the concentrations of short- and medium-chain fatty acids (SMCFA; C4:0-C14:0) in milk fat indicate elevated plasma NEFA concentrations. However, the SMCFA concentrations were similar in both dietary groups, suggesting that the plasma NEFA was within normal limits. Bjerre-Harpøth et al. (2012) also found no discernible effect of partial feed restriction on plasma βHB levels in mid- and late-lactating dairy cows. This suggests that the increase in plasma NEFA and βHB concentrations of mid-lactating dairy cows was not solely related to the NEB. It is worth noting that energy losses in heat production were not calculated in the current study. It is therefore likely that the EB in teff-fed cows might have been retained for production purposes, sparing fat mobilization and hence lowering NEFA and βHB concentrations.
The FA profile was within the normal ranges reported in previous studies (Jensen et al., 1991; Palmquist et al., 1993; Fant et al., 2023). The higher concentration of C16:0 in the control diet is similar to that found previously by (Gross et al., 2011), who demonstrated that the increase in C16:0 was correlated with the increased EB of animals. However, in our study, we found that the teff diet was associated with an increase in the total trans FA concentration with decreased EB (relative to the control). This finding contradicts the report by Stoop et al. (2009), who found an increase in trans FA with improved EB. The differences in our results and the aforementioned study could be ascribed to differing stages of lactation. In Stoop et al. (2009), samples were collected from early-lactation cows, which could have had a higher NEB, whereas, we studied mid-to late-lactation cows, which could have had a lower NEB. In addition, in the study by Stoop et al. (2009), primiparous Holstein–Friesian cows were used, whereas we used multiparous Holstein–Friesian cows. Triglycerides constitute approximately 98% of total milk fat (Jensen et al., 1991; Moate et al., 2007). Milk FA synthesis occurs through biohydrogenation or bacterial degradation in the rumen, de novo synthesis in the mammary gland, mobilization of body fats, and direct incorporation from the diet (Stoop et al., 2009; Mesilati-Stahy and Argov-Argaman, 2018). Alteration in these processes influences the FA composition of milk fat during lactation (van Knegsel et al., 2005; Stoop et al., 2009). The FA profile of the teff diet had numerically higher concentrations of PUFA than that of the control diet. In line with this, El-Alfy et al. (2012) showed that higher levels of oleic acids, linolenic acids, and PUFA existed in teff. This may explain the higher concentration of long-chain fatty acids (LCFA) in milk fat observed in the present study due to the fact that LCFA is sourced mostly from diet rather than fat immobilization (Craninx et al., 2008). In addition, calcium soap supplements that were added to rations in the current study to support NEL requirements, might protect C18:2 against rumen biohydrogenation (Palmquist et al., 1993). Thus, the slightly higher calcium soaps incorporated in the teff diet to balance the NEL could be a possible reason for higher levels of C18:2 in the milk fat observed. These findings agree with a study by (Palmquist et al., 1993) which demonstrated a higher concentration of C18:2 in the calcium soaps diet than in other dietary treatments. The higher level of dietary C18:2 may have been the source of the trans fatty acids that were found at higher concentrations in the milk of cows in the teff group. Trans fatty acids originate from the rumen biohydrogenation of PUFA (Lock and Bauman, 2004; Lock et al., 2005; Lock et al., 2006) In addition, LCFA transfer from plasma to milk FA inhibits the de novo synthesis of short-chain fatty acids (Garnsworthy and Huggett, 1992; Palmquist et al., 1993). It is likely that the trivial concentration of SCFA in teff could be due to the repressive effect of LCFA in cows. The decrease in the EB of dairy cows can impact their FA profile by reducing the supply of acetate and glucose for the de novo synthesis of SCFA (Palmquist et al., 1993; Gross et al., 2011), thus triggering an increase in LCFA (C18:0-C22:0). On the other hand, the high concentration of C16:0 in the control diet could be linked to a higher level of acetate production, similar to that in a study by Ørskov et al. (1969).
We assessed the effect of teff hay inclusion in rations on dairy cows’ production and performances. We compared the feed intake, digestibility, energy balance, milk yield and composition, fatty acids profile, rumen parameters (N–NH3, rumen pH, and VFA), and blood metabolites (glucose, NEFA, and βHB) of the teff and control diets. Our results showed that teff inclusion in dairy cow rations did not affect intake, but increased crude protein digestibility. It also increased milk, milk protein, and lactose yields, and levels of polyunsaturated fatty acids and omega-3 fatty acids (which would improve human health). Teff inclusion also increased propionic acid, ruminal ammonia nitrogen, and blood urea nitrogen in circulation, but decreased non-esterified fatty acids and beta-hydroxybutyrate in the blood circulation of the cows. These results suggest that teff can be used to improve the production and performance of dairy cows.
The raw data supporting the conclusions of this article will be made available by the authors, without undue reservation.
The animal study was approved by the Volcani Center Animal Committee. The study was conducted in accordance with the local legislation and institutional requirements.
PW: Data curation, Formal Analysis, Investigation, Methodology, Validation, Writing – original draft. GN: Data curation, Formal Analysis, Methodology, Validation, Writing – original draft, Writing – review & editing. JK: Formal Analysis, Methodology, Writing – review & editing. CS: Formal Analysis, Methodology, Writing – review & editing. SB-Z: Methodology, Writing – review & editing, Validation, Visualization. YB-M: Methodology, Writing – review & editing. NA-A: Methodology, Writing – review & editing, Validation. YS: Validation, Writing – review & editing, Conceptualization, Funding acquisition, Project administration, Supervision. SM: Funding acquisition, Project administration, Supervision, Validation, Writing – review & editing, Data curation, Formal Analysis, Investigation, Methodology, Visualization.
The author(s) declare financial support was received for the research, authorship, and/or publication of this article. This research was funded by The Chief Scientist of the Ministry of Agriculture, grant number 12-01-0032, and The Israeli Dairy Board, grant number 820-0328-17.
The authors thank The Chief Scientist of the Ministry of Agriculture and The Israeli Dairy Board for partially funding this research.
The authors declare that the research was conducted in the absence of any commercial or financial relationships that could be construed as a potential conflict of interest.
All claims expressed in this article are solely those of the authors and do not necessarily represent those of their affiliated organizations, or those of the publisher, the editors and the reviewers. Any product that may be evaluated in this article, or claim that may be made by its manufacturer, is not guaranteed or endorsed by the publisher.
The Supplementary Material for this article can be found online at: https://www.frontiersin.org/articles/10.3389/fanim.2023.1260787/full#supplementary-material
Adin G., Solomon R., Nikbachat M., Zenou A., Yosef E., Brosh A., et al. (2009). Effect of feeding cows in early lactation with diets differing in roughage-neutral detergent fiber content on intake behavior, rumination, and milk production. J. Dairy Sci. 92, 3364–3373. doi: 10.3168/jds.2009-2078
Allen M. S. (1996). Physical constraints on voluntary intake of forages by ruminants. J. Anim. Sci. 74, 3063. doi: 10.2527/1996.74123063x
Allen M. S. (1997). Relationship between fermentation acid production in the rumen and the requirement for physically effective fiber. J. Dairy Sci. 80, 1447–1462. doi: 10.3168/jds.S0022-0302(97)76074-0
Allen M. S. (2000). Effects of diet on short-term regulation of feed intake by lactating dairy cattle. J. Dairy Sci. 83, 1598–1624. doi: 10.3168/jds.S0022-0302(00)75030-2
AOAC (1990). ““Plants and animals,”,” in AOAC: official methods of analysis. Ed. Helrich K. (Arligton: The Association of Agricultural Chemists), 40–82.
Aschenbach J. R., Kristensen N. B., Donkin S. S., Hammon H. M., Penner G. B. (2010). Gluconeogenesis in dairy cows: The secret of making sweet milk from sour dough. IUBMB Life 62, 869–877. doi: 10.1002/iub.400
Assefa K., Chanyalew S., Tedele Z. (2013). “Achievements and prospects of tef improvement,” in Proceedings of the second international workshop, november 7-9, 2013, debre zeit, Ethiopia. Eds. Solomon K., Chanyalew S., Tadele Z. (Debre Zeit, Ethiopia: Universität Bern), 33–51.
Bailey C. B., Balch C. C. (1961). Saliva secretion and its relation to feeding in cattle. Br. J. Nutr. 15, 383–402. doi: 10.1079/BJN19610048
Bal M. A., Shaver R. D., Jirovec A. G., Shinners K. J., Coors J. G. (2000). Crop processing and chop length of corn silage: effects on intake, digestion, and milk production by dairy cows. J. Dairy Sci. 83, 1264–1273. doi: 10.3168/jds.S0022-0302(00)74993-9
Bannink A., Tamminga S. (2005). ““Rumen function.,”,” in Quantitative aspects of ruminant digestion and metabolism (UK: CABI Publishing), 263–288. doi: 10.1079/9780851998145.0263
Beck P. A., Stewart C. B., Gray H. C., Smith J. L., Gunter S. A. (2009). Effect of wheat forage maturity and preservation method on forage chemical composition and performance of growing calves fed mixed diets12. J. Anim. Sci. 87, 4133–4142. doi: 10.2527/jas.2009-2184
Bell A. W. (1995). Regulation of organic nutrient metabolism during transition from late pregnancy to early lactation. J. Anim. Sci. 73, 2804. doi: 10.2527/1995.7392804x
Ben Meir Y. A., Nikbachat M., Portnik Y., Jacoby S., Adin G., Moallem U., et al. (2021). Effect of forage-to-concentrate ratio on production efficiency of low-efficient high-yielding lactating cows. Animal 15, 100012. doi: 10.1016/j.animal.2020.100012
Bjerre-Harpøth V., Friggens N. C., Thorup V. M., Larsen T., Damgaard B. M., Ingvartsen K. L., et al. (2012). Metabolic and production profiles of dairy cows in response to decreased nutrient density to increase physiological imbalance at different stages of lactation. J. Dairy Sci. 95, 2362–2380. doi: 10.3168/jds.2011-4419
Bower C. E., Holm-Hansen T. (1980). A salicylate–hypochlorite method for determining ammonia in seawater. Can. J. Fisheries Aquat. Sci. 37, 794–798. doi: 10.1139/f80-106
Buxton D. R. (1996). Quality-related characteristics of forages as influenced by plant environment and agronomic factors. Anim. Feed Sci. Technol. 59, 37–49. doi: 10.1016/0377-8401(95)00885-3
Cabrita A. R. J., Dewhurst R. J., Abreu J. M. F., Fonseca A. J. M. (2006). Evaluation of the effects of synchronising the availability of N and energy on rumen function and production responses of dairy cows – a review. Anim. Res. 55, 1–24. doi: 10.1051/animres:2005045
Chanyalew S., Ferede S., Damte T., Fikre T., Genet Y., Kebede W., et al. (2019). Significance and prospects of an orphan crop tef. Planta 250, 753–767. doi: 10.1007/s00425-019-03209-z
Coulombe J. J., Favreau L. (1963). A new simple semimicro method for colorimetric determination of urea. Clin. Chem. 9, 102–108. doi: 10.1093/clinchem/9.1.102
Craninx M., Steen A., Van Laar H., Van Nespen T., Martín-Tereso J., de Baets B., et al. (2008). Effect of lactation stage on the odd- and branched-chain milk fatty acids of dairy cattle under grazing and indoor conditions. J. Dairy Sci. 91, 2662–2677. doi: 10.3168/jds.2007-0656
Davison M. L., Creech E. (2011)The potential for teff as an alternative forage crop for irrigated regions. In: 2011 western alfalfa & Forage conference (Las Vegas, Nevada: UC Cooperative Extension, Plant Sciences Department, University of California, Davis, CA 95616). Available at: https://alfalfa.ucdavis.edu/+symposium/2011/index.aspx (Accessed May 15, 2023).
Dijkstra J. (1994). Production and absorption of volatile fatty acids in the rumen. Livest Prod Sci. 39, 61–69. doi: 10.1016/0301-6226(94)90154-6
Dijkstra J., Ellis J. L., Kebreab E., Strathe A. B., López S., France J., et al. (2012). Ruminal pH regulation and nutritional consequences of low pH. Anim. Feed Sci. Technol. 172, 22–33. doi: 10.1016/j.anifeedsci.2011.12.005
Duffield T., Plaizier J. C., Fairfield A., Bagg R., Vessie G., Dick P., et al. (2004). Comparison of techniques for measurement of rumen pH in lactating dairy cows. J. Dairy Sci. 87, 59–66. doi: 10.3168/jds.S0022-0302(04)73142-2
El-Alfy T. S., Ezzat S. M., Sleem A. A. (2012). Chemical and biological study of the seeds of Eragrostis tef (Zucc.) Trotter. Nat. Prod Res. 26, 619–629. doi: 10.1080/14786419.2010.538924
Erwin E. S., Marco G. J., Emery E. M. (1961). Volatile fatty acid analyses of blood and rumen fluid by gas chromatography. J. Dairy Sci. 44, 1768–1771. doi: 10.3168/jds.S0022-0302(61)89956-6
Fant P., Leskinen H., Ramin M., Huhtanen P. (2023). Effects of replacement of barley with oats on milk fatty acid composition in dairy cows fed grass silage-based diets. J. Dairy Sci. 106, 2347–2360. doi: 10.3168/jds.2022-22327
Garnsworthy P. C., Huggett C. D. (1992). The influence of the fat concentration of the diet on the response by dairy cows to body condition at calving. Anim. Sci. 54, 7–13. doi: 10.1017/S000335610002050X
Girija A., Jifar H., Jones C., Yadav R., Doonan J., Mur L. A. J. (2022). Tef: a tiny grain with enormous potential. Trends Plant Sci. 27, 220–223. doi: 10.1016/j.tplants.2021.11.011
Gross J., van Dorland H. A., Bruckmaier R. M., Schwarz F. J. (2011). Milk fatty acid profile related to energy balance in dairy cows. J. Dairy Res. 78, 479–488. doi: 10.1017/S0022029911000550
Habel J., Chapoutot P., Koch C., Sundrum A. (2022). Estimation of individual glucose reserves in high-yielding dairy cows. Dairy 3, 438–464. doi: 10.3390/dairy3030033
Habte E., Muktar M. S., Negawo A. T., Lee S.-H., Lee K.-W., Jones C. S. (2019). An overview of teff (Eragrostis teff zuccagni) trotter) as a potential summer forage crop in temperate systems. J. Korean Soc. Grassland Forage Sci. 39, 185–188. doi: 10.5333/KGFS.2019.39.3.185
Hagos T., Melaku S. (2009). Feed intake, digestibility, body weight and carcass parameters of Afar rams fed tef (Eragrostis tef) straw supplemented with graded levels of concentrate mix. Trop. Anim. Health Prod 41, 599–606. doi: 10.1007/s11250-008-9230-6
Hristov A. N., Hanigan M., Cole A., Todd R., McAllister T. A., Ndegwa P. M., et al. (2011). Review: Ammonia emissions from dairy farms and beef feedlots. Can. J. Anim. Sci. 91, 1–35. doi: 10.4141/CJAS10034
Hristov A. N., Jouany J.-P. (2005). ““Factors affecting the efficiency of nitrogen utilization in the rumen. In Nitrogen and phosphorus nutrition of cattle: reducing the environmental impact of cattle operations,”,” in Nitrogen and phosphorus nutrition of cattle. Eds. Haristov A. N., Jouarny J. P. (Wallingford UK: CABI Publishing), 117–166.
Huhtanen P., Kaustell K., Jaakkola S. (1994). The use of internal markers to predict total digestibility and duodenal flow of nutrients in cattle given six different diets. Anim. Feed Sci. Technol. 48, 211–227. doi: 10.1016/0377-8401(94)90173-2
Jensen R. G., Ferris A. M., Lammi-Keefe C. J. (1991). The composition of milk fat. J. Dairy Sci. 74, 3228–3243. doi: 10.3168/jds.S0022-0302(91)78509-3
Johnson M. M., Peters J. P. (1993). Technical note: an improved method to quantify nonesterified fatty acids in bovine plasma. J. Anim. Sci. 71, 753–756. doi: 10.2527/1993.713753x
Kononoff P. J., Heinrichs A. J., Buckmaster D. R. (2003). Modification of the penn state forage and total mixed ration particle separator and the effects of moisture content on its measurements. J. Dairy Sci. 86, 1858–1863. doi: 10.3168/jds.S0022-0302(03)73773-4
Lapierre H., Lobley G. E. (2001). Nitrogen recycling in the ruminant: A review. J. Dairy Sci. 84, E223–E236. doi: 10.3168/jds.S0022-0302(01)70222-6
Larsen M., Kristensen N. B. (2009). Effect of abomasal glucose infusion on splanchnic and whole-body glucose metabolism in periparturient dairy cows. J. Dairy Sci. 92, 1071–1083. doi: 10.3168/jds.2008-1453
Lawrence J. D., Mintert J., Anderson J. D., Anderson D. P. (2008). Feed grains and livestock: impacts on meat supplies and prices. CHOICES 23, 11–15.
Lock A. L., Bauman D. E. (2004). Modifying milk fat composition of dairy cows to enhance fatty acids beneficial to human health. Lipids 39, 1197–1206. doi: 10.1007/s11745-004-1348-6
Lock A. L., Overton T. R., Harvatine K. J., Giesy J., Bauman D. E. (2006). Milk fat depression: impact of dietary components and their interaction during rumen fermentation, in Proc. Cornell nutr. Conf. Eds. Lock A. L., Overton T. R., Harvatine K. J., Giesy J., Bauman D. E. (Ithaca, New York: Cornell University), 75–85.
Lock A. L., Parodi P. W., Bauman D. E. (2005). The biology of trans fatty acids: implications for human health and the dairy industry. Aust. J. Dairy Technol. 60, 134–142.
Marini J. C., Van Amburgh M. E. (2003). Nitrogen metabolism and recycling in Holstein heifers12. J. Anim. Sci. 81, 545–552. doi: 10.2527/2003.812545x
Mengesha M. H. (1966). Chemical composition of teff (Eragrostis tef) compared with that of wheat, barley and grain sorghum. Econ Bot. 20, 268–273. doi: 10.1007/BF02904277
Mesilati-Stahy R., Argov-Argaman N. (2014). The relationship between size and lipid composition of the bovine milk fat globule is modulated by lactation stage. Food Chem. 145, 562–570. doi: 10.1016/j.foodchem.2013.08.077
Mesilati-Stahy R., Argov-Argaman N. (2018). Changes in lipid droplets morphometric features in mammary epithelial cells upon exposure to non-esterified free fatty acids compared with VLDL. PloS One 13, e0209565. doi: 10.1371/journal.pone.0209565
Miller D. (2011) Teff grass: crop overview and forage production guide (California). Available at: http://www.calwestseeds.com/products/teff/ (Accessed May 15, 2023).
Moate P. J., Chalupa W., Boston R. C., Lean I. J. (2007). Milk fatty acids. I. Variation in the concentration of individual fatty acids in bovine milk. J. Dairy Sci. 90, 4730–4739. doi: 10.3168/jds.2007-0225
NASEM (2021). Nutrient requirements of dairy cattle. 8th ed (NASEM Washington, D.C: National Academies Press). doi: 10.17226/25806
Nocek J. E., Russell J. B. (1988). Protein and energy as an integrated system. Relationship of ruminal protein and carbohydrate availability to microbial synthesis and milk production. J. Dairy Sci. 71, 2070–2107. doi: 10.3168/jds.S0022-0302(88)79782-9
National Research Council (NRC) (1989). Food and Nutrition Board Recommended Dietary Allowances. 10th Edition (National Academies Press), 82. doi: 10.17226/1349
NRC (2001). Nutrient requirements of dairy cattle. (Washington, D.C: National Academies Press). doi: 10.17226/9825
NRC (2007). Nutrient requirements of small ruminants. (Washington, D.C: National Academies Press). doi: 10.17226/11654
OECD/FAO (2022). OECD-FAO Agricultural Outlook 2022-2031 (Paris: OECD Publishing). doi: 10.1787/f1b0b29c-en
Ørskov E. R., Flatt W. P., Moe P. W., Munson A. W., Hemken R. W., Katz I. (1969). The influence of ruminal infusion of volatile fatty acids on milk yield and composition and on energy utilization by lactating cows. Br. J. Nutr. 23, 443–453. doi: 10.1079/BJN19690054
Ørskov E. R., McDonald I. (1979). The estimation of protein degradability in the rumen from incubation measurements weighted according to rate of passage. J. Agric. Sci. 92, 499–503. doi: 10.1017/S0021859600063048
Ospina P. A., Nydam D. V., Stokol T., Overton T. R. (2010). Associations of elevated nonesterified fatty acids and β-hydroxybutyrate concentrations with early lactation reproductive performance and milk production in transition dairy cattle in the northeastern United States. J. Dairy Sci. 93, 1596–1603. doi: 10.3168/jds.2009-2852
Palmquist D. L., Denise Beaulieu A., Barbano D. M. (1993). Feed and animal factors influencing milk fat composition. J. Dairy Sci. 76, 1753–1771. doi: 10.3168/jds.S0022-0302(93)77508-6
Patra A. K. (2015). ““Urea/ammonia metabolism in the rumen and toxicity in ruminants,”,” in Rumen microbiology: from evolution to revolution. Eds. Puniya A. K., Singh R., Kamra D. N. (New Delhi: Springer India), 329–341. doi: 10.1007/978-81-322-2401-3_22
Pengpeng W., Tan Z. (2013). Ammonia assimilation in rumen bacteria: A review. Anim. Biotechnol. 24, 107–128. doi: 10.1080/10495398.2012.756402
Piantoni P., Ylioja C. M., Allen M. S. (2015). Feed intake is related to changes in plasma nonesterified fatty acid concentration and hepatic acetyl CoA content following feeding in lactating dairy cows. J. Dairy Sci. 98, 6839–6847. doi: 10.3168/jds.2014-9085
Pichler M., Damberger A., Schwendenwein I., Gasteiner J., Drillich M., Iwersen M. (2014). Thresholds of whole-blood β-hydroxybutyrate and glucose concentrations measured with an electronic hand-held device to identify ovine hyperketonemia. J. Dairy Sci. 97, 1388–1399. doi: 10.3168/jds.2013-7169
Ream C. N., Stevens A. V., Hall J. B., Chibisa G. E. (2020). Harvest maturity of Eragrostis tef ‘Moxie’: Effects on ruminal fermentation, total-tract nutrient digestibility, and growth performance in backgrounding beef cattle. Appl. Anim. Sci. 36, 600–609. doi: 10.15232/aas.2020-02008
Reynolds C. K., Aikman P. C., Lupoli B., Humphries D. J., Beever D. E. (2003). Splanchnic metabolism of dairy cows during the transition from late gestation through early lactation. J. Dairy Sci. 86, 1201–1217. doi: 10.3168/jds.S0022-0302(03)73704-7
Rezac D. J., Grigsby K. N., Bello N. M., Bradford B. J. (2012). Effects of varying rates of tallgrass prairie hay and wet corn gluten feed on productivity of lactating dairy cows. J. Dairy Sci. 95, 842–849. doi: 10.3168/jds.2011-4752
Roseberg R., Norberg S., Charlton B. (2018)Teff Grass for Forage: Nitrogen and irrigation requirements (Corvallis, Oregon). Available at: https://catalog.extension.oregonstate.edu/pnw709/html (Accessed May 15, 2023).
Russell J. B., Sniffen C. J., Van Soest P. J. (1983). Effect of carbohydrate limitation on degradation and utilization of casein by mixed rumen bacteria. J. Dairy Sci. 66, 763–775. doi: 10.3168/jds.S0022-0302(83)81856-6
Satter L. D. (1986). Protein supply from undegraded dietary protein. J. Dairy Sci. 69, 2734–2749. doi: 10.3168/jds.S0022-0302(86)80722-6
Saylor B. A., Min D. H., Bradford B. J. (2018). Productivity of lactating dairy cows fed diets with teff hay as the sole forage. J. Dairy Sci. 101, 5984–5990. doi: 10.3168/jds.2017-14118
Schaefer D. M., Davis C. L., Bryant M. P. (1980). Ammonia saturation constants for predominant species of rumen bacteria. J. Dairy Sci. 63, 1248–1263. doi: 10.3168/jds.S0022-0302(80)83076-1
Seymour W. M., Campbell D. R., Johnson Z. B. (2005). Relationships between rumen volatile fatty acid concentrations and milk production in dairy cows: a literature study. Anim. Feed Sci. Technol. 119, 155–169. doi: 10.1016/j.anifeedsci.2004.10.001
Staniar W. B., Bussard J. R., Repard N. M., Hall M. H., Burk A. O. (2010). Voluntary intake and digestibility of teff hay fed to horses1. J. Anim. Sci. 88, 3296–3303. doi: 10.2527/jas.2009-2668
Stoop W. M., Bovenhuis H., Heck J. M. L., van Arendonk J. A. M. (2009). Effect of lactation stage and energy status on milk fat composition of Holstein-Friesian cows. J. Dairy Sci. 92, 1469–1478. doi: 10.3168/jds.2008-1468
Sudweeks E. M., Ely L. O., Sisk L. R. (1979). Effect of particle size of corn silage on digestibility and rumen fermentation. J. Dairy Sci. 62, 292–296. doi: 10.3168/jds.S0022-0302(79)83238-5
van Knegsel A. T. M., van den Brand H., Dijkstra J., Tamminga S., Kemp B. (2005). Effect of dietary energy source on energy balance, production, metabolic disorders and reproduction in lactating dairy cattle. Reprod. Nutr. Dev. 45, 665–688. doi: 10.1051/rnd:2005059
Van Soest P. J. (1994) Nutritional ecology of the ruminant. (Soest Ithaca, New York: Cornell University Press). Available at: https://www.jstor.org/stable/10.7591/j.ctv5rf668 (Accessed June 20, 2023).
Van Soest P. J., Robertson J. B., Lewis B. A. (1991). Methods for dietary fiber, neutral detergent fiber, and nonstarch polysaccharides in relation to animal nutrition. J. Dairy Sci. 74, 3583–3597. doi: 10.3168/jds.S0022-0302(91)78551-2
Vinyard J. R., Hall J. B., Sprinkle J. E., Chibisa G. E. (2018). Effects of maturity at harvest on the nutritive value and ruminal digestion of Eragrostis tef (cv. Moxie) when fed to beef cattle. J. Anim. Sci. 96, 3420–3432. doi: 10.1093/jas/sky202
Wagali P., Sabastian C., Saranga Y., Ben-Zeev S., Mabjeesh S. J. (2023). The effects of irrigation, genotype and additives on tef silage making. Animals 13, 470. doi: 10.3390/ani13030470
Yansari T. A., Valizadeh R., Naserian A., Christensen D. A., Yu P., Eftekhari Shahroodi F. (2004). Effects of alfalfa particle size and specific gravity on chewing activity, digestibility, and performance of holstein dairy cows. J. Dairy Sci. 87, 3912–3924. doi: 10.3168/jds.S0022-0302(04)73530-4
Keywords: teff hay, dairy cows, milk production, digestibility, productivity
Citation: Wagali P, Ngomuo G, Kilama J, Sabastian C, Ben-Zeev S, Ben-Meir YA, Argov-Argaman N, Saranga Y and Mabjeesh SJ (2023) The effect of teff (Eragrostis tef) hay inclusion on feed intake, digestibility, and milk production in dairy cows. Front. Anim. Sci. 4:1260787. doi: 10.3389/fanim.2023.1260787
Received: 18 July 2023; Accepted: 04 October 2023;
Published: 25 October 2023.
Edited by:
Juana Catarina Cariri Chagas, Swedish University of Agricultural Sciences, SwedenReviewed by:
Gibson Maswayi Alugongo, China Agricultural University, ChinaCopyright © 2023 Wagali, Ngomuo, Kilama, Sabastian, Ben-Zeev, Ben-Meir, Argov-Argaman, Saranga and Mabjeesh. This is an open-access article distributed under the terms of the Creative Commons Attribution License (CC BY). The use, distribution or reproduction in other forums is permitted, provided the original author(s) and the copyright owner(s) are credited and that the original publication in this journal is cited, in accordance with accepted academic practice. No use, distribution or reproduction is permitted which does not comply with these terms.
*Correspondence: Sameer J. Mabjeesh, c2FtZWVyLm1hYmplZXNoQG1haWwuaHVqaS5hYy5pbA==
Disclaimer: All claims expressed in this article are solely those of the authors and do not necessarily represent those of their affiliated organizations, or those of the publisher, the editors and the reviewers. Any product that may be evaluated in this article or claim that may be made by its manufacturer is not guaranteed or endorsed by the publisher.
Research integrity at Frontiers
Learn more about the work of our research integrity team to safeguard the quality of each article we publish.