 Yang Jia
 Kwangwon Son2
 James C. Matthews
94% of researchers rate our articles as excellent or good
Learn more about the work of our research integrity team to safeguard the quality of each article we publish.
Find out more
ORIGINAL RESEARCH article
Front. Anim. Sci., 10 July 2023
Sec. Animal Nutrition
Volume 4 - 2023 | https://doi.org/10.3389/fanim.2023.1165321
Recently, we demonstrated that supplementing (with 3 mg Se per day) the diets of growing beef steers grazing on Se-deficient toxic endophyte-infected tall fescue-based forage with either organic Se (OSe, SEL-PLEX) or a 1:1 blend (MIX) of OSe and inorganic Se (ISe, sodium selenite) in vitamin–mineral mixes, rather than inorganic forms of Se, ameliorated several classic serum symptoms of fescue toxicosis. Importantly, higher levels of hepatic glutamine synthetase activity were observed in MIX and OSe steers. Accordingly, transcriptome level and targeted mRNA expression analyses were conducted on the same liver tissue to determine if Se treatments affected other hepatic metabolic pathways, especially those that are responsible for supplying substrates of glutamine synthetase. The effect of ISe, OSe, and MIX treatments (n = 8/treatment) on the relative abundances of mRNA [determined using microarray and real-time reverse-transcription PCR (RT-PCR)] and protein (determined using Western blotting) in liver tissue was assessed by ANOVA. Fisher’s protected LSD procedure was used to separate treatment means, with significance being declared at p ≤ 0.05. Microarray analysis identified (p< 0.01, false discovery rate of< 33%) 573 annotated differentially expressed gene (DEG) transcripts. Canonical pathway analysis identified the DEGs that are central to glutamine and glutamate biosynthesis/degradation and proline biosynthesis. Targeted RT-PCR analyses found that MIX and OSe steers had lower periportal ammonia-assimilation and urea-synthesizing capacities (lower glutaminase 2, key ornithine cycle enzymes, and mitochondrial ornithine/citrulline exchanger mRNA) than ISe steers. In addition, MIX and OSe steers had a higher capacity for pericentral ammonia assimilation (higher glutamine synthetase activity) and a higher capacity for the production of glutamate in pericentral hepatocytes from α-ketoglutarate (higher levels of glutamine dehydrogenase, and decreased levels of arginase 2 and ornithine aminotransferase and mRNA). The form of supplemental Se also affected steers’ capacity for hepatic proline metabolism, with OSe steers having a higher capacity for proline synthesis and MIX steers having a higher capacity for pyroline-5-carboxylate synthesis. In conclusion, supplementing the diets of growing beef steers grazing on toxic endophyte-infected tall fescue with MIX and OSe in vitamin–mineral mixes, rather than with inorganic forms of Se, shifts hepatic ammonia assimilation from periportal urea production to pericentral glutamine production, thus potentially increasing whole-animal N efficiency by increasing the supply of hepatic-synthesized glutamine.
Grazing-based beef cattle operations in southeastern and southcentral regions of the United States are being economically challenged by the dual negative effects of fescue toxicosis and selenium (Se)-deficient forages. Fescue toxicosis is a comprehensive physiologic syndrome that is caused by the consumption of ergot alkaloids present in toxic endophyte-infected tall fescue (Strickland et al., 2009; Strickland et al., 2011). Multiple studies on mice (Bhusari et al., 2006), rats (Settivari et al., 2006), and steers (Tanaree et al., 2013) seeking to characterize the effect of fescue toxicosis on hepatic transcriptome profiles after these animals’ consumption of endophyte-infected tall fescue seeds have been carried out. Relatedly, a commercially relevant model of summer-long grazing of forage, comparing that containing low (LE) with that containing high levels of toxic endophyte-infected tall fescue (HE) consumed by growing steers, has recently been used to investigate the effect of fescue toxicosis on liver metabolism and function (Brown et al., 2009). The hepatic transcriptome profiling of these steers revealed that the expression of 374 genes functionally involved in carbohydrate (gluconeogenesis) and amino acid (proline and serine) metabolism, cell-mediated immune response, and the glucocorticoid receptor signaling network was altered by the consumption of HE (Liao et al., 2015).
The forages of many HE-based cattle operations are deficient in Se (Ammerman and Miller, 1975) as a result of Se-poor soils. Research concerned with understanding the most biologically efficacious form of supplementing Se into cattle diets has identified important differences when solely inorganic, solely organic, or a mix of inorganic and organic forms of supplemental Se are fed to cattle. Compared with the inorganic form of Se (ISe, sodium selenite), the organic form of Se (OSe, selenium-enriched yeast, SEL-PLEX) shows higher bioavailability in cattle, as evidenced by the higher concentrations of Se in cattle blood and tissue (Nicholson et al., 1991; Gunter et al., 2003; Liao et al., 2011). Supplementing the diets of beef heifers with 3 mg of Se per day via a 1:1 blend of ISe : OSe (MIX) resulted in an equal concentration of Se being present in their whole blood, red blood cells, serum, and liver as when their diets were supplemented with OSe, and the resulting Se levels for both groups were higher than those observed when heifer diets were supplemented with ISe only (Brennan et al., 2011). Moreover, microarray analysis showed that the MIX form of supplemental Se stimulates the expression of genes involved in selenoprotein synthesis and glutamate/glutamine metabolism (Matthews et al., 2014). Interestingly, some of the genes that were upregulated by MIX were found to be downregulated in the livers (Liao et al., 2015) and pituitaries (Li et al., 2017) of steers grazing on HE. This finding suggests that the consumption of the MIX form of supplemental Se might positively affect the physiology of fescue toxicosis steers.
Subsequently, a grazing study using in-pasture Calan gates was conducted (Jia et al., 2018) to evaluate the effects of supplemental Se forms (i.e., ISe, OSe, and MIX) on the physiological parameters of growing steers subjected to summer-long (86 days) grazing of HE. Importantly, higher levels of hepatic glutamine synthetase activity and mRNA content were observed in MIX and OSe steers than in ISe steers, whereas MIX steers had higher levels of hepatic glutamine synthetase protein than ISe or OSe steers.
Given the critical role of glutamine synthetase in ammonia assimilation and glutamate/glutamine metabolism by pericentral hepatocytes, the finding of higher levels of hepatic glutamine synthetase activity in ergot alkaloid-challenged steers consuming organic rather than inorganic forms of Se (Jia et al., 2018) is of special interest from a glutamate/glutamine carbon and nitrogen metabolism perspective because of the ostensibly higher concentration of sinusoidal ammonia resulting from the increased use of amino acid carbons for gluconeogenesis (Brown et al., 2009; Liao et al., 2015). In ruminants, a substantial amount of dietary nitrogen is absorbed as ammonia, which constitutes up to 73% of their nitrogen intake (Huntington and Archibeque, 2000). In non-ruminants, the liver detoxifies ammonia from portal blood by primarily converting it into urea (pericentral hepatocytes) or glutamine (pericentral hepatocytes) (Häussinger et al., 1992). Although not explicitly demonstrated in ruminants, it is assumed that mammalian metabolism of ammonia is similar across species (McGivan et al., 1984; Häussinger, 1990a) and that the same enzymes and transporters responsible for non-ruminant hepatic ammonia/glutamine metabolism are present in cattle liver (Kuo et al., 1991; Howell et al., 2001; Miles et al., 2015). Because of the need for amino acid-derived carbon moieties to support hepatic gluconeogenesis being consistently high in ruminants compared with non-ruminants (Reynolds, 1992), identifying the metabolic factors that may increase the efficiency of hepatic ammonia/urea/glutamine metabolism in ruminants is important.
Overall, the findings of Jia et al. (2018) strongly indicate that the form of supplemental Se fed to these steers altered hepatic ammonia and glutamate/glutamine metabolism. To elaborate and expand on these findings, the first goal of the present experiment was to conduct a transcriptome analysis of the same hepatic tissue (Jia et al., 2018) to determine if the form of supplemental Se also altered the profile of hepatic mRNA for proteins responsible for other metabolic capacities. The second experimental goal was to conduct targeted RT-PCR and Western blot analyses to determine if the form of supplemental Se fed to these steers altered the expression of key enzymes and transporters involved in hepatic ammonia assimilation and glutamate, glutamine, and proline metabolism.
All experimental procedures were approved by the University of Kentucky Institutional Animal Care and Use Committee.
Specific descriptions of the animal model, treatment administration, and liver sample collection procedures used have been given elsewhere (Jia et al., 2018). Briefly, twenty-four suckling predominantly Angus beef steers (BW: 182.6 ± 33.9 kg, age: 165.5 ± 14.2 days) were randomly selected (n = 8) from herds of fall-calving cows grazing on HE. Cows and calves had ad libitum access to common, basal, vitamin–mineral mixes that contained 35 mg/kg Se in inorganic Se (ISe; sodium selenite, Prince Se concentrate; Prince Agri Products, Inc., Quincy, IL), organic Se (OSe; SEL-PLEX, Alltech Inc., Nicholasville, KY), or a 1:1 blend of ISe and OSe (MIX) forms. Over a 98-day period (from 11 March 2015 to 17 June 2015), steers were weaned, trained to consume a vitamin–mineral mix (lacking Se) from in-pasture Calan gates, and, thereby, were all depleted of Se. During this 98-day period, the ADG of steers was 0.82 ± 0.18 kg/day.
Steers then began (day 0) an 86-day (from 17 June 2015 to 9 September 2015) common grazing period in which they collectively grazed on a predominantly endophyte-infected tall fescue-mixed pasture (10.1 ha) and individually consumed their respective Se-form-specific vitamin–mineral mix treatments (ISe, OSe, or MIX) through the use of in-pasture Calan gates. Steers were assigned to receive the same Se-form-specific vitamin–mineral mix treatment that they had received when they were raised and that their dams had received. The Se-specific mixes contained the basal mix plus 35 mg/kg Se as ISe, OSe, or MIX. The composition of the basal vitamin–mineral mix was analyzed by Dairy One (Dairy One Cooperative, Inc., Ithaca, NY) in accordance with the method previously described (Jia et al., 2018). To ensure each individual steers’ consumption of 3 mg Se per day, 85 g of the specific vitamin–mineral mix (35 mg/kg Se) was top-dressed onto 227 g of soyhulls in each individual Calan gate feeder. The consumption of the mixture of soyhulls and vitamin–mineral mix was monitored daily, and all steers consumed all of the mixtures every day. Thus, every steer calf consumed 3 mg of supplemental Se per day. During this 86-day period,two ISe steers were removed from the study due one having an injured hoof and failure of the other to consume their mineral treatment. Thus, the final number of experimental observations were: ISe, n = 6; OSe, n = 8; and MIX n = 8.
Steers were slaughtered over a 26-day period, from days 93 to 119 (17 September 2015 to 13 October 2015) of the study. Details of the slaughter process have been provided elsewhere (Jia et al., 2018). Briefly, one OSe steer and one MIX steer were killed during the first 2 slaughter days. During the remaining 6 slaughter days, one steer from each of the treatment groups (ISe, OSe, and MIX) was killed. Liver samples were collected from the mid-lower right lobe and placed in foil packs, snap-frozen in liquid nitrogen, and stored at –80°C until microarray, real-time RT-PCR, and Western blotting analyses were carried out.
All Western blotting and densitometric analyses for the relative expression of targeted proteins were performed using a standard protocol of our lab as previously described (Miles et al., 2015). Approximately 0.2 g of the liver was homogenized on ice for 30 seconds (setting 11, Polytron Model PT10/35, Kinematic Inc., Lucerne, Switzerland) in 7.5 mL of 4°C sample extraction buffer solution [0.25 mM sucrose, 10 mM HEPES-KOH pH 7.5, 1 mM EDTA, and 50 μL of protease inhibitor (Sigma)]. The protein concentration was quantified using a modified Lowry assay, using bovine serum albumin as a standard (Kilberg, 1989). Proteins were separated using 12% SDS-PAGE and electrotransferred onto a 0.45 μm nitrocellulose membrane (Bio-Rad) and then stained with Fast-Green (Fisher, Pittsburgh, PA). The relative amounts of stained protein per lane per sample were determined by densitometric analysis and are reported as arbitrary units (Brown et al., 2009).
The use of rabbit IgG anti-bovine ornithine aminotransferase (OAT) polyclonal antibody was validated by pre-adsorption assay, using the general procedures of Xue et al. (2011). The immunoreaction product for OAT (Mr = 62 kDa, Additional File 1) in liver homogenates (45 μg) was abolished when pre-adsorbed with increasing amounts of antigen. The relative content of excitatory AA carrier/SLC1A1 (EAAC1), SLC1A2 (GLT-1), glutamate transporter-associated protein 3-18 (GTRAP3-18), and ADP-ribosylation factor-like 6 interacting protein 1 (ARL6IP1) in liver homogenate was evaluated using an antibody as previously described (Miles et al., 2015; Huang et al., 2018). Blots were hybridized with 0.7 μg of IgG anti-bovine OAT polyclonal antibody (Novus Biologicals, Littleton, CO), 1 μg of IgG anti-human EAAC1 polyclonal antibody (Santa Cruz Biotechnology, Inc., Santa Cruz, CA), 1 μg of IgG anti-mouse GLT-1 polyclonal antibody (Abcam Inc., Cambridge, MA), 4 μg of IgG anti-human GTRAP3–18 (Abcam Inc., Cambridge, MA), or 5 μg of IgG anti-human ARL6IP1 (Novus Biologicals, Littleton, CO), per mL of blocking solution [3% non-fat dry milk (wt/vol), 10 mM Tris-Cl (pH 7.5), 100 mM NaCl, 0.1% Tween 20 (vol/vol)] for 1 hour at room temperature with gentle rocking. Protein–primary antibody binding reactions were visualized using a chemiluminescence kit (Pierce, Rockford, IL) after the hybridization of the primary antibody with horseradish peroxidase-conjugated donkey anti-rabbit IgG (Amersham, Arlington Heights, IL; EAAC1, OAT, and ARL6IP1 1:5,000; GLT-1, 1:2,500) and horseradish peroxidase-conjugated donkey anti-goat IgG (Santa Cruz Biotechnology, Inc., Santa Cruz, CA; GTRAP3-18, 1:5,000).
The densitometric analysis of immunoreactive products was carried out as described previously (Miles et al., 2015). After exposure to the auto-radiographic film (Amersham, Arlington Heights, IL), digital images of all observed immunoreactive species were recorded and quantified as described (Dehnes et al., 1998). The apparent migration weights (Mr) were calculated by regression of the distance migrated against the Mr of a 16 to 185 kDa standard (Gibco BRL, Grand Island, NY) using the Versadoc imaging system (Bio-Rad) and Quantity One software (Version 4.2.3, Bio-Rad). The band intensities of all observed immunoreactive species within a sample were quantified using densitometry (as described above for Fast-Green stained proteins) and reported as arbitrary units. Densitometric data were corrected for unequal (15%, ARL6IP1; 12%, EAAC1; 11%, GTRAP3-18; 17%, GLT-1; 22%, OAT) loading, transfer, or both, and the amount of detected protein was normalized to relative amounts of Fast-Green-stained proteins common to all immunoblot lanes/samples (Miles et al., 2015). Digital images were prepared using Microsoft PowerPoint software (Microsoft, PowerPoint 2013, Bellevue, MA).
For each animal, total RNA was extracted from 300 mg of frozen liver tissue using TRIzol Reagent (Invitrogen Corporation, Carlsbad, CA) following the manufacturer’s instructions. The purity and concentration of total RNA samples were analyzed using a NanoDrop ND-100 Spectrophotometer (NanaDrop Technologies, Wilmington, DE, USA). All samples had an average concentration of 1.05 μg/μL and high purity, with 260/280 absorbance ratios ranging from 1.98 to 2.03 and 260/230 absorbance ratios ranging from 1.89 to 2.18. The integrity of total RNA was determined by gel electrophoresis using an Agilent 2100 Bioanalyzer System (Agilent Technologies, Santa Clara, CA) at the University of Kentucky Microarray Core Facility. The visualization of the gel images and electropherograms showed that all RNA samples were of high quality, with the 28S/18S rRNA absorbance ratios being higher than 2 and RNA integrity numbers (RINs) being higher than 8.7.
The effect of Se form on the hepatic transcriptome profile of steers was evaluated using Bovine Gene 1.0 ST Arrays (GeneChip; Affymetrix, Inc., Santa Clara, CA), which were conducted in accordance with the manufacturer’s standard protocol at the University of Kentucky Microarray Core Facility. Briefly, 3 μg of RNA for each sample was first reverse-transcribed to cDNA, and then from cDNA (double-stranded) to complementary RNA (cRNA; single-stranded), which was then labeled with biotin. The biotinylated cRNAs were further fragmented and used as probes to hybridize the gene chips in the GeneChip Hybridization Oven 640 (Affymetrix), using one chip per RNA sample. After hybridization, the chips were washed and stained on a GeneChip Fluidics Station 450 (Affymetrix). The reaction image and signals were read using a GeneChip Scanner (GCS 3000, 7G; Affymetrix), and data were collected using the GeneChip Operating Software (GCOS, version 1.2; Affymetrix). Due to the degradation of one RNA sample, the experimental observations for each treatment were n = 6, n = 7, and n = 8 for the ISe, MIX, and OSe treatments, respectively.
The raw expression intensity values from the GCOS (i.e., the 21 *.cel files from the raw methylation measurements) were imported into Partek Genomics Suite software (PGS, version 6.6; Partek Inc., St. Louis, MO). For GeneChip background correction, the algorithm of Robust Multichip Averaging adjusted with probe length and GC oligo contents was implemented (Irizarry et al., 2003; Wu et al., 2004). The background-corrected data were converted into expression values using quantile normalization for all the chips and median polish summarization of multiple probes for each probe set.
All GeneChip transcripts were annotated using the NetAffx annotation database for Gene Expression on Bovine GeneChip Array ST 1.0 provided by the manufacturer (http://www.affymetrix.com/analysis/index.affx, last accessed in April 2018, annotation file last updated in March 2016). Quality control assessment of Affymetrix chip hybridization was performed by MA plot analysis of gene expression values, and by box plot analysis of binding by control probe sets. Pearson's (linear) correlation analysis was used to generate the similarity matrix (last accessed in April 2018, Partek Genomics Suite 6.6 6.15.0422). The average correlation between any pair of the 21 GeneChips was 0.96 (Additional File 2), and all GeneChips were further analyzed. Principal component analysis (Additional File 3) was carried out to determine the quality of the microarray hybridization and visualize the general data variation among the chips (Partek, 2009).
To exclude the meaningless and unnecessary gene probes in the analysis and reduce the multiple comparison errors (expected false positives), total gene probe sets (26,773 gene transcripts) were reduced using a multistep filtering algorithm with some modifications (Blalock et al., 2003) (Figure 1A). Briefly, first, gene transcripts that had a signal intensity of less than 3.6 in every gene chip (and thus deemed to be not expressed) were removed from subsequent analyses. This signal intensity cutoff was determined based on the signal intensity histogram, which showed a clear plateau before an intensity of 3.6 (Figure 1B). Consequently, 25,767 gene transcripts were deemed to be expressed. Second, the multiple gene probe sets designed for one gene transcript were sorted by signal intensity, and the gene probe set with the highest signal intensity was considered to be most representative and kept (24,947 gene transcripts) for further analysis. To assess treatment effects on the relative expression of the hepatic gene transcripts, qualified microarray data were subjected to one-way ANOVA using the same PGS software. All gene chip transcripts were annotated using the NetAffx annotation database for Gene Expression on Bovine GeneChip Array ST 1.0 provided by the manufacturer (http://www.affymetrix.com/analysis/index.affx, last accessed in April 2018, annotation file last updated in March 2016). A total of 738 transcripts showed treatment effects at a significance level of p< 0.01, with a false discovery rate (FDR) of< 33%. These differentially expressed genes/gene transcripts (DEGs) were subjected to hierarchical clustering analysis (Figure 2) using PGS software. After annotation, 573 out of 738 DEGs were found (p< 0.01) to be annotated (Additional File 6). Differentially expressed genes were subjected to canonical, functional, and network pathway analyses (Figure 1) using the Core Analysis program of Ingenuity Pathway Analysis online software [IPA, build version 481437M, content version 44691306; http://www.ingenuity.com (accessed in September 2018)]; Ingenuity Systems, Inc., Redwood City, CA).
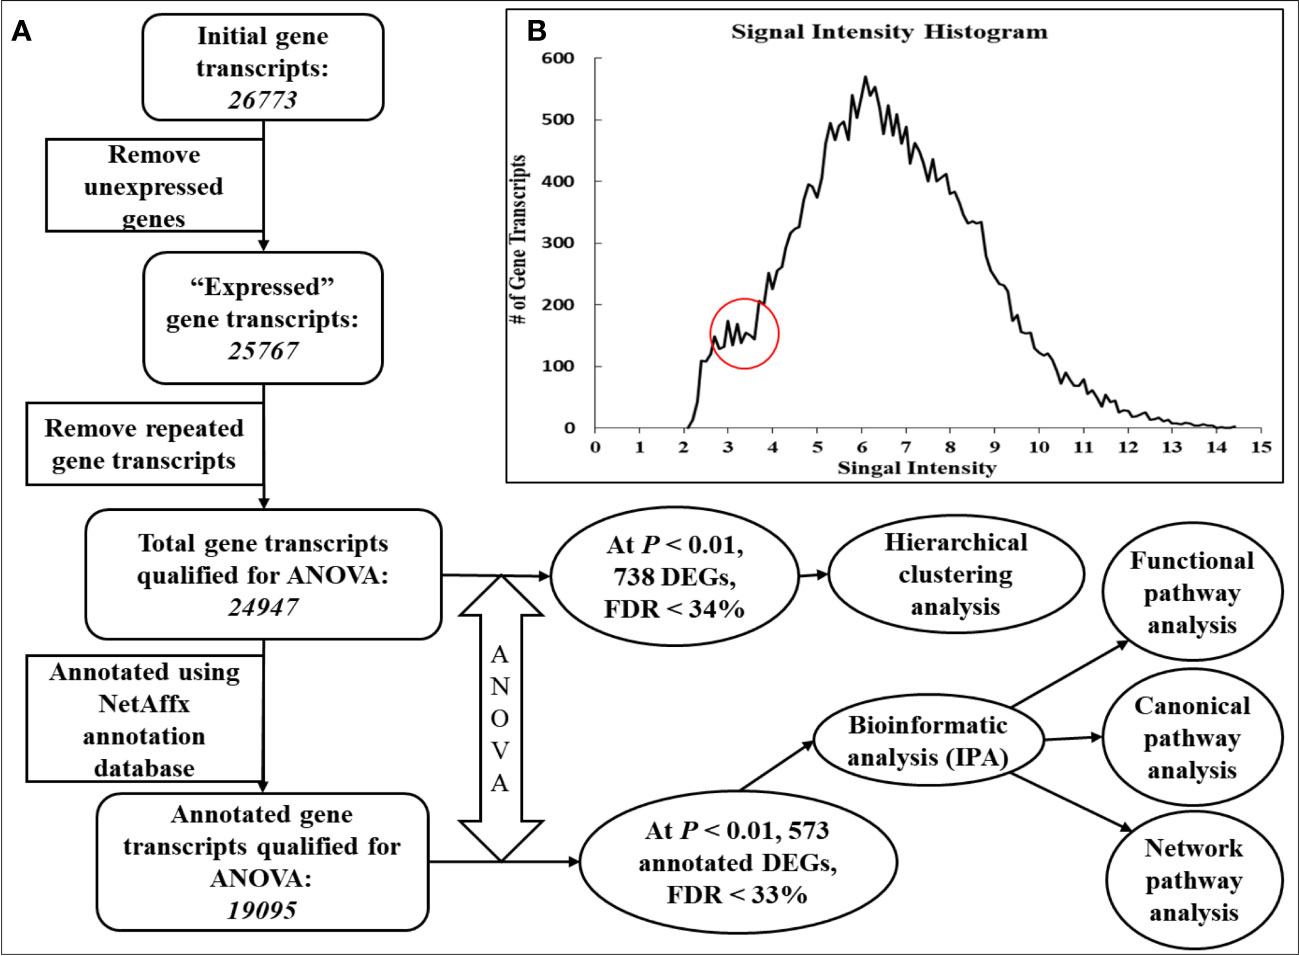
Figure 1 Flowchart of filtering algorithm and procedures used to identify differentially expressed genes. To exclude meaningless and unnecessary gene probes in the analysis, and to reduce multiple comparison errors (expected false positives), the initial number of total gene probe sets (26,773 gene transcripts) was reduced using a multistep filtering algorithm (Blalock et al., 2003), with some modifications (A). To eliminate non-expressed gene transcripts from subsequent analyses, gene transcripts with a signal intensity of less than 3.6 were removed from every gene chip. This signal intensity cutoff was determined based on the signal intensity histogram (B), which showed a clear plateau before an intensity of 3.6. Consequently, 25,767 gene transcripts were declared to be expressed. For genes with multiple gene probe sets, the gene probe sets were sorted by signal intensity, and the gene probe set with the highest signal intensity was considered the most representative (24,947 gene transcripts) and was kept for further analysis.
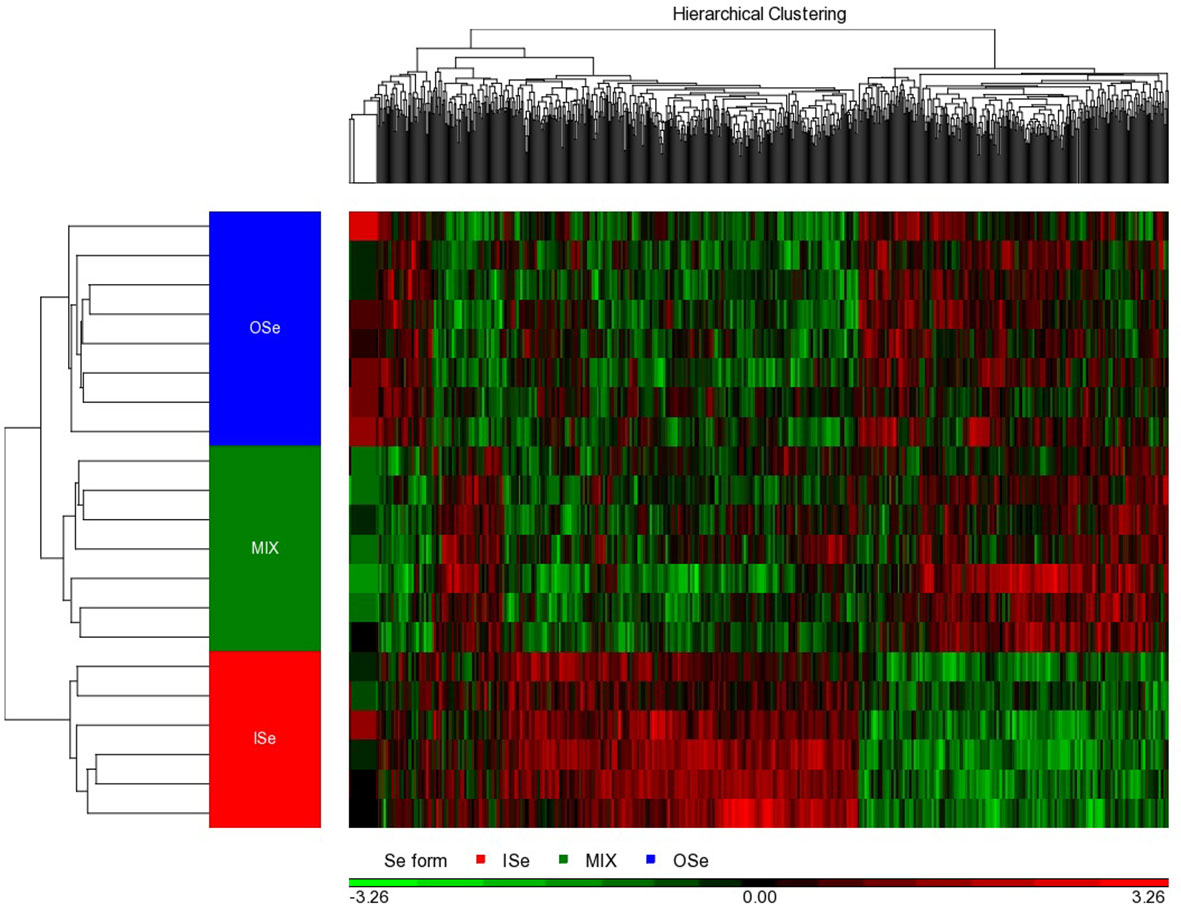
Figure 2 Hierarchical cluster analysis of hepatic DEG induced by selenium treatments in steers grazing on HE. The differential expression (ANOVA p-values of< 0.01 and false discovery rates of ≤ 33%) of 738 genes were identified in the livers of steers grazing on HE and the diets of whom had been supplemented with 3 mg Se per day in vitamin–mineral mixes as sodium selenite (ISe, n = 6), SEL-PLEX (OSe, n = 8), or a 1:1 blend of ISe and OSe (MIX, n = 7). As indicated by the legend color box, the black color in the middle represents the mean value, 0; the red color represents gene expression levels above the mean; and the green color denotes gene expression levels below the mean. The intensity of the color reflects the relative intensity of the fold change.
The microarray*.cel files and GC Robust Multichip Averaging-corrected data are accessible in the National Center for Biotechnology Information's Gene Expression Omnibus (GEO; http://www.ncbi.nlm.nih.gov/geo/) [released July 13, 2018], accession number GSE115802), and are compliant with minimum information about a microarray experiment (MIAME) standards.
The quantification of relative mRNA for genes of interest was conducted using the standard procedures in our laboratory, as previously described (Cerny et al., 2016). Briefly, 1 µg of each steer’s liver RNA was reverse-transcribed to cDNA using the SuperScript III 1st Strand Synthesis System (Invitrogen). Real-time RT-PCR was performed using an Eppendorf Mastercycler ep realplex2 system (Eppendorf, Hamburg, Germany) with iQ SYBR Green Supermix (Bio-RAD, Hercules, CA). A volume of 25 µL containing 5 µL of cDNA, 1 µL of a 10 µM stock of each primer (forward and reverse), 12.5 µL of 2× SYBR Green PCR Master Mix, and 5.5 µL of nuclease-free water was used in each real-time RT-PCR reaction. The relative abundance of each transcript was calculated using the 2-ΔΔCT method (Livak and Schmittgen, 2001). Primer sets (Additional File 4) for genes of interest were designed using the NCBI Primer-BLAST tool (https://www.ncbi.nlm.nih.gov/tools/primer-blast/) against appropriate RefSeq sequences (accessed February to April 2018).
All real-time RT-PCR cDNA products were validated by DNA sequencing verification and were between 99% and 100% identical to their RefSeq sequences (Additional File 4). The validated cDNA sequences were deposited in GenBank and their accession numbers were assigned (Additional File 4). Briefly, the PCR-amplified cDNA products were electrophoresed in a 1.2% agarose (UltraPure™ Agarose, Invitrogen, Carlsbad, CA) slab gel. A single cDNA band of the desired size was identified under a UV light, excised from the gel, purified using the PureLink Quick Gel Extraction Kit (Invitrogen, Carlsbad, CA), and then sequenced by Eurofins Genomics (Eurofins MWG Operon LLC, Louisville, KY). The resulting sequences (Additional File 5) were compared with the NCBI RefSeq mRNA sequences that were used as templates for primer pair set design. From nine constitutively expressed gene candidates (i.e., ACTB, GAPDH, SDHA, PCK2, UBC, YWHAZ, HPRT1, PPIA, and TBP), three constitutively expressed genes (i.e., YWHAZ, HPRT1, and PPIA) were selected based on their lowest average stability value of M = 0.19, calculated using the geNorm software v3.5 (Vandesompele et al., 2002). The relative mRNA expression of the targeted genes was calibrated to the geometric mean of YWHAZ, HPRT1, and PPIA. For the RT-PCR analysis, the number of steers studied was n = 6, n = 8, and n = 8 for the ISe, OSe, and MIX treatments, respectively. All RT-PCR reactions were performed in triplicate. The abundance of gene transcripts was normalized to the mean expression of the ISe treatment group.
Data are presented as least square means (± SEM). Steers were the experimental units. Microarray hybridization data (relative expression of hepatic gene transcripts) were subjected to a one-way ANOVA using the PGS software, as described above in the “Microarray analysis” section, with significance declared at p< 0.01. The effect of Se supplementation on the relative abundances of hepatic mRNA (RT-PCR) and protein (Western blotting) was assessed by ANOVA, using the PROC GLM procedure of SAS, with significance declared at p ≤ 0.05. Fisher’s protected LSD procedure was used to separate treatment means, with significance declared at p ≤ 0.05. The relationship between whole-blood selenium concentration and endpoint liver mRNA content at different days was evaluated using Pearson’s correlation analysis. The Pearson’s correlation coefficients and p-values were calculated using the PROC CORR procedure of SAS 9.4, with significance declared at p ≤ 0.05.
Principal component analysis of all microarray data was performed to evaluate the correlation and variation among the gene chips. The score plot (Additional File 3) showed that the first principal component (PC #1, x-axis) explained 7.9% of the total variance, whereas PC #2 (x-axis) and PC #3 (z-axis) explained 7.35% and 6.77% of the variance, respectively. Overall, the score plot indicated that the gene chips within each treatment group were clustered closely together.
Individual ANOVAs were conducted to determine the effect of Se treatment on the expression of RNA transcripts in the livers of ISe, OSe, and MIX steers. At p< 0.01 and a false discovery rate of< 34%, a total of 738 differentially expressed gene (DEG) transcripts were identified, of which 573 were annotated (p< 0.01, FDR< 33%; Additional File 6). Hierarchical clustering analysis of the 738 DEGs indicated that there was a clear separation among the Se treatment groups (Figure 2). More specifically, the pattern of hepatic genes expressed differed markedly among ISe, MIX, and OSe steers, whereas the pattern between MIX and OSe steers was similar but differed slightly.
To determine the physiological significance of Se treatment-induced annotated DEGs (Additional File 6), bioinformatics analysis of canonical, functional, and network pathway analyses were performed. In these analyses, the critical criterion was the ratio, which is calculated as the number of differentially expressed genes (p< 0.01) in a given pathway divided by the total number of genes that make up that pathway. Canonical pathway analysis (Table 1) indicated that the top six pathways were HER-2 signaling in breast cancer (10 genes), tyrosine degradation I (three genes), PEDF signaling (eight genes), sumoylation pathway (nine genes), LPS-stimulated MAPK signaling (nine genes), and induction of apoptosis by HIV I (seven genes). In addition, several affected pathways closely involved in glutamate/glutamine and nitrogen metabolism were identified (Table 2), including glutamine biosynthesis I, glutamine degradation I, glutamate biosynthesis II, glutamate degradation X, arginine biosynthesis IV, and proline biosynthesis II (from arginine).

Table 1 Top IPA-identified canonical pathways of hepatic DEGs induced by selenium treatments.
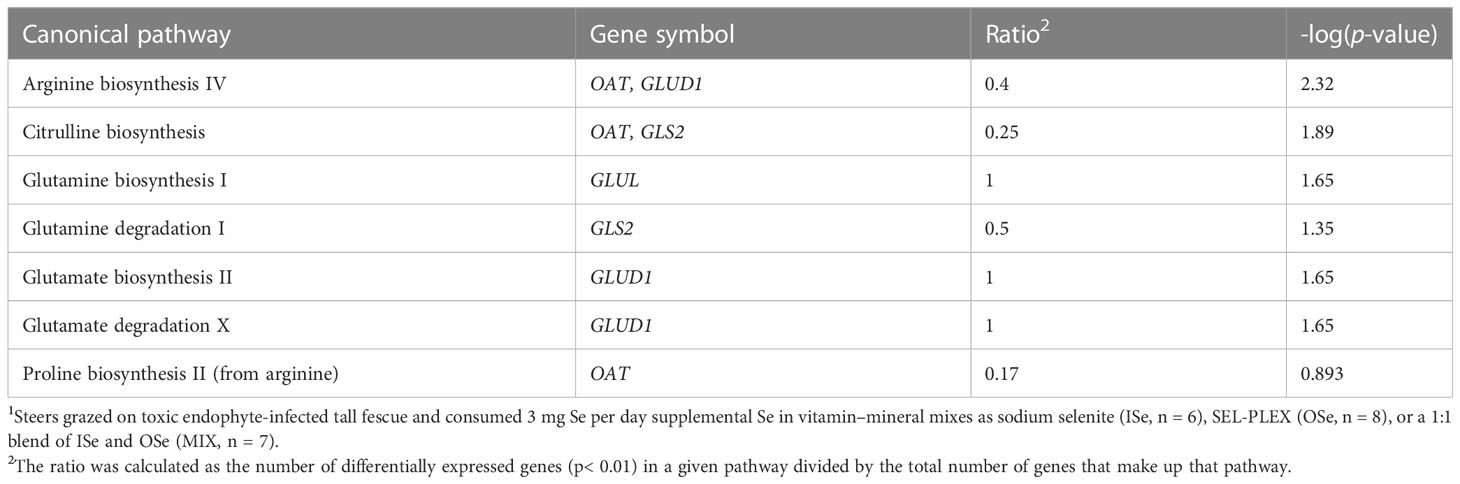
Table 2 IPA-identified glutamate/glutamine and nitrogen metabolism pathways of hepatic DEGs induced by selenium treatment1.
Corroboration of the altered expression of the critical DEGs involved in glutamate/glutamine, proline, asparagine, and ureagenesis metabolism that had been identified using microarray analysis or in accordance with the method described by Jia et al. (2018) was carried out using real-time RT-PCR analysis (Table 3). For the genes responsible for glutamate/glutamine metabolism, both analyses found that the relative expression of hepatic glutamine synthetase (GLUL) mRNA was higher (p< 0.05) in MIX and OSe steers than in ISe steers, whereas the expression of glutaminase 2 (GLS2) mRNA was lower (p< 0.05). Although microarray analysis identified a higher (p< 0.01) expression of glutamate dehydrogenase 1 (GLUD1) in MIX and OSe steers, RT-PCR analysis did not (p ≥ 0.29).
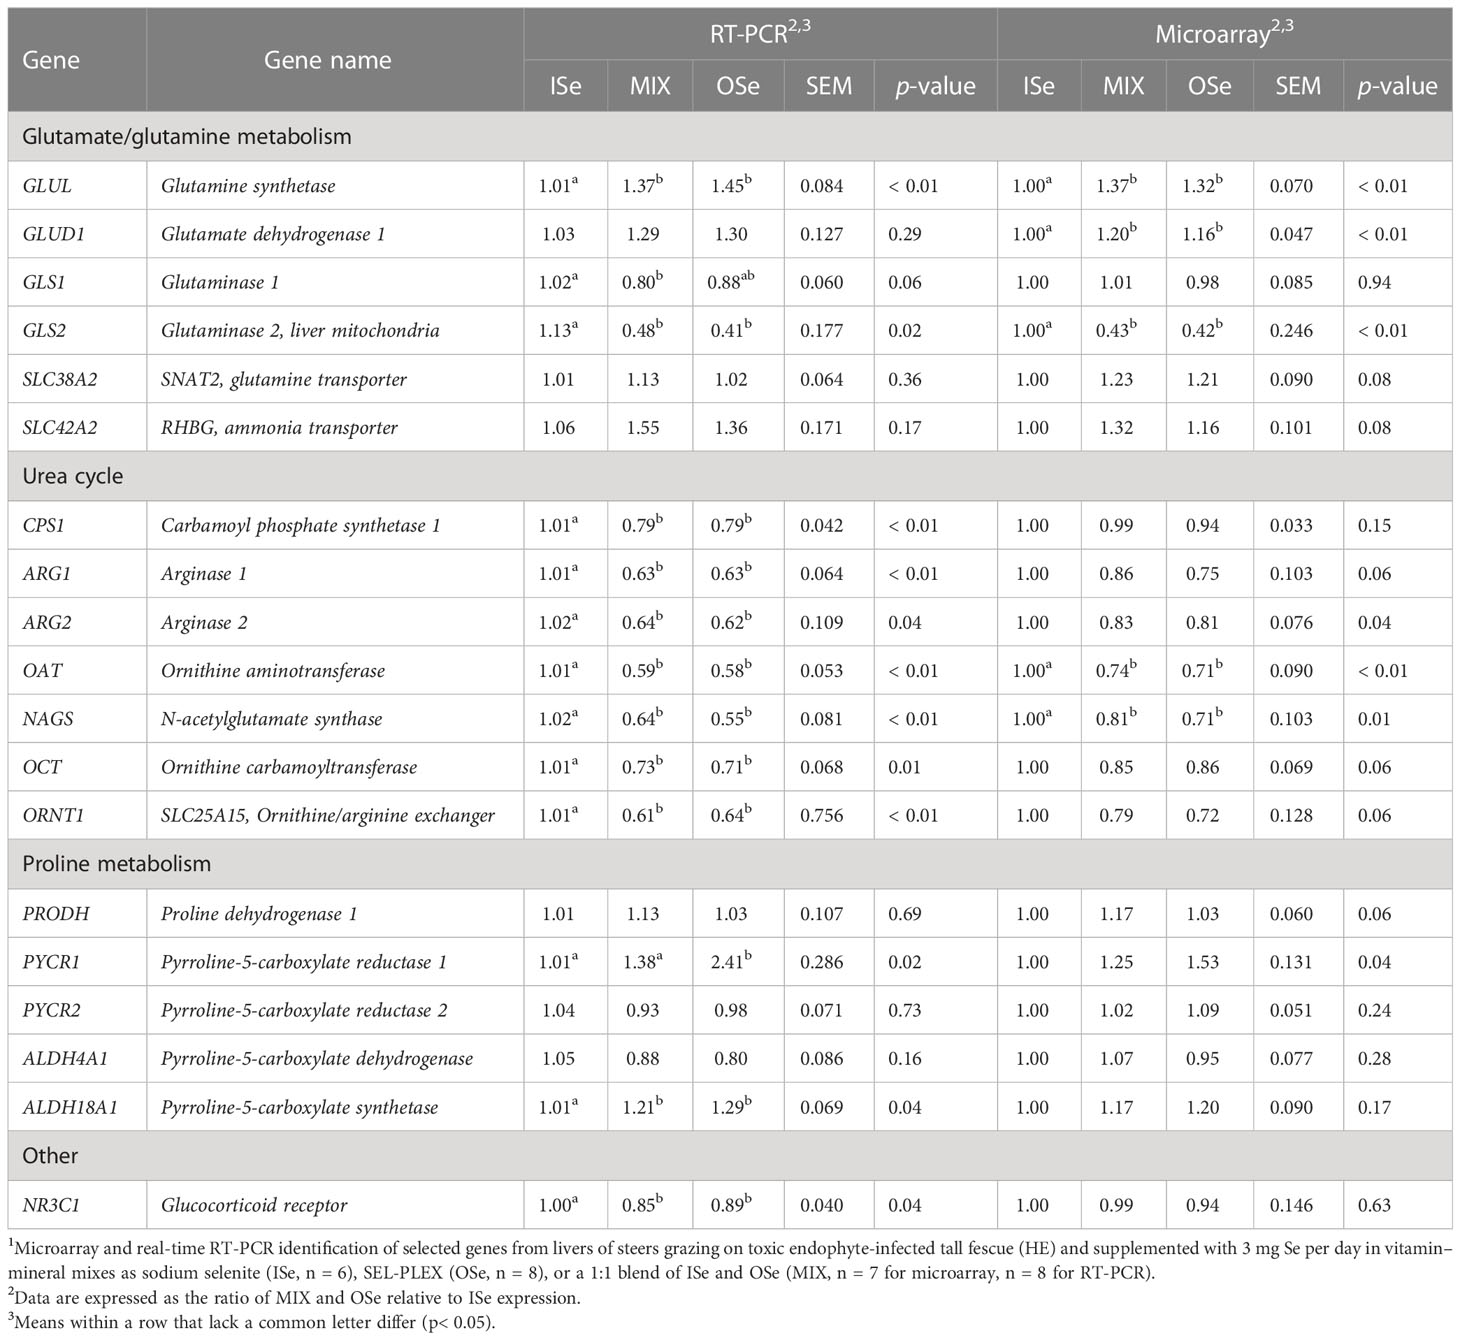
Table 3 Selenium form treatment effects on selected mRNA content in the livers (days 93 to 119) of steers grazing on HE forage1.
For the genes involved in proline metabolism, both analyses showed that the expression of proline dehydrogenase 1 (PRODH), pyrroline-5-carboxylate reductase 2 (PYCR2), and pyrroline-5-carboxylate dehydrogenase (ALDH4A1) were not (p ≥ 0.06) affected by Se treatment. Although both analyses found that the numerical expression of pyrroline-5-carboxylate reductase 1 (PYCR1) and pyrroline-5-carboxylate synthetase (ALDH18A1) was higher in MIX and OSe than in ISe steers; these differences were statistically higher (p = 0.04) in the RT-PCR analysis only.
A high congruency between microarray and RT-PCR analyses was observed in genes involved in the urea cycle (Table 3). Specifically, RT-PCR and microarray analyses both found that the expression of OAT and N-acetylglutamate synthase (NAGS) was lower (p ≤ 0.01) in MIX and OSe steers. Both RT-PCR and microarray analyses revealed similar numerical reductions in the levels of arginase 1 (ARG1), arginase 2 (ARG2), ornithine carbamoyltransferase (OCT), and ornithine/arginine exchanger (ORNT1) in MIX and OSe steers, although only the RT-PCR results were statistically significant (p ≤ 0.04). In contrast, RT-PCR analyses found that levels of carbamoyl phosphate synthase 1 (CPS1) and glucocorticoid receptor (NR3C1) were lower (p< 0.04) in both MIX and OSe steers, whereas microarray analysis found that CPS1 and NR3C1 were not affected (p ≥ 0.15) by the form of Se treatment.
Within a day and across Se treatments, correlation analysis was conducted to determine the relationships between experimental day and liver mRNA content at slaughter (Table 4). Within sample day, GLUL mRNA content was positively and moderately correlated with whole-blood Se concentration on day 43 (r = 0.49, p = 0.02) whereas PYCR1 mRNA was on day 0 (r = 0.49, p = 0.02). In contrast, the mRNA content of five proteins was negatively and moderately correlated with whole-blood Se concentration, with four of these being associated with the urea cycle at day 64. CPS1 mRNA was correlated on days 22 (r = –0.47, p = 0.04) and 64 (r = –0.63, p = 0.01). OAT mRNA was correlated on days 22 (r = –0.45, p = 0.03), 43 (r = –0.48, p = 0.02), and 64 (r = –0.69, p = 0.01), whereas NAGS (r = –0.48, p = 0.03) and ORNT1 (r = –0.48, p = 0.04) mRNA contents were correlated with whole-blood Se concentration on day 64. GLS1 mRNA was negatively and moderately correlated with whole-blood Se concentration on day 86 (r = –0.49, p = 0.03).
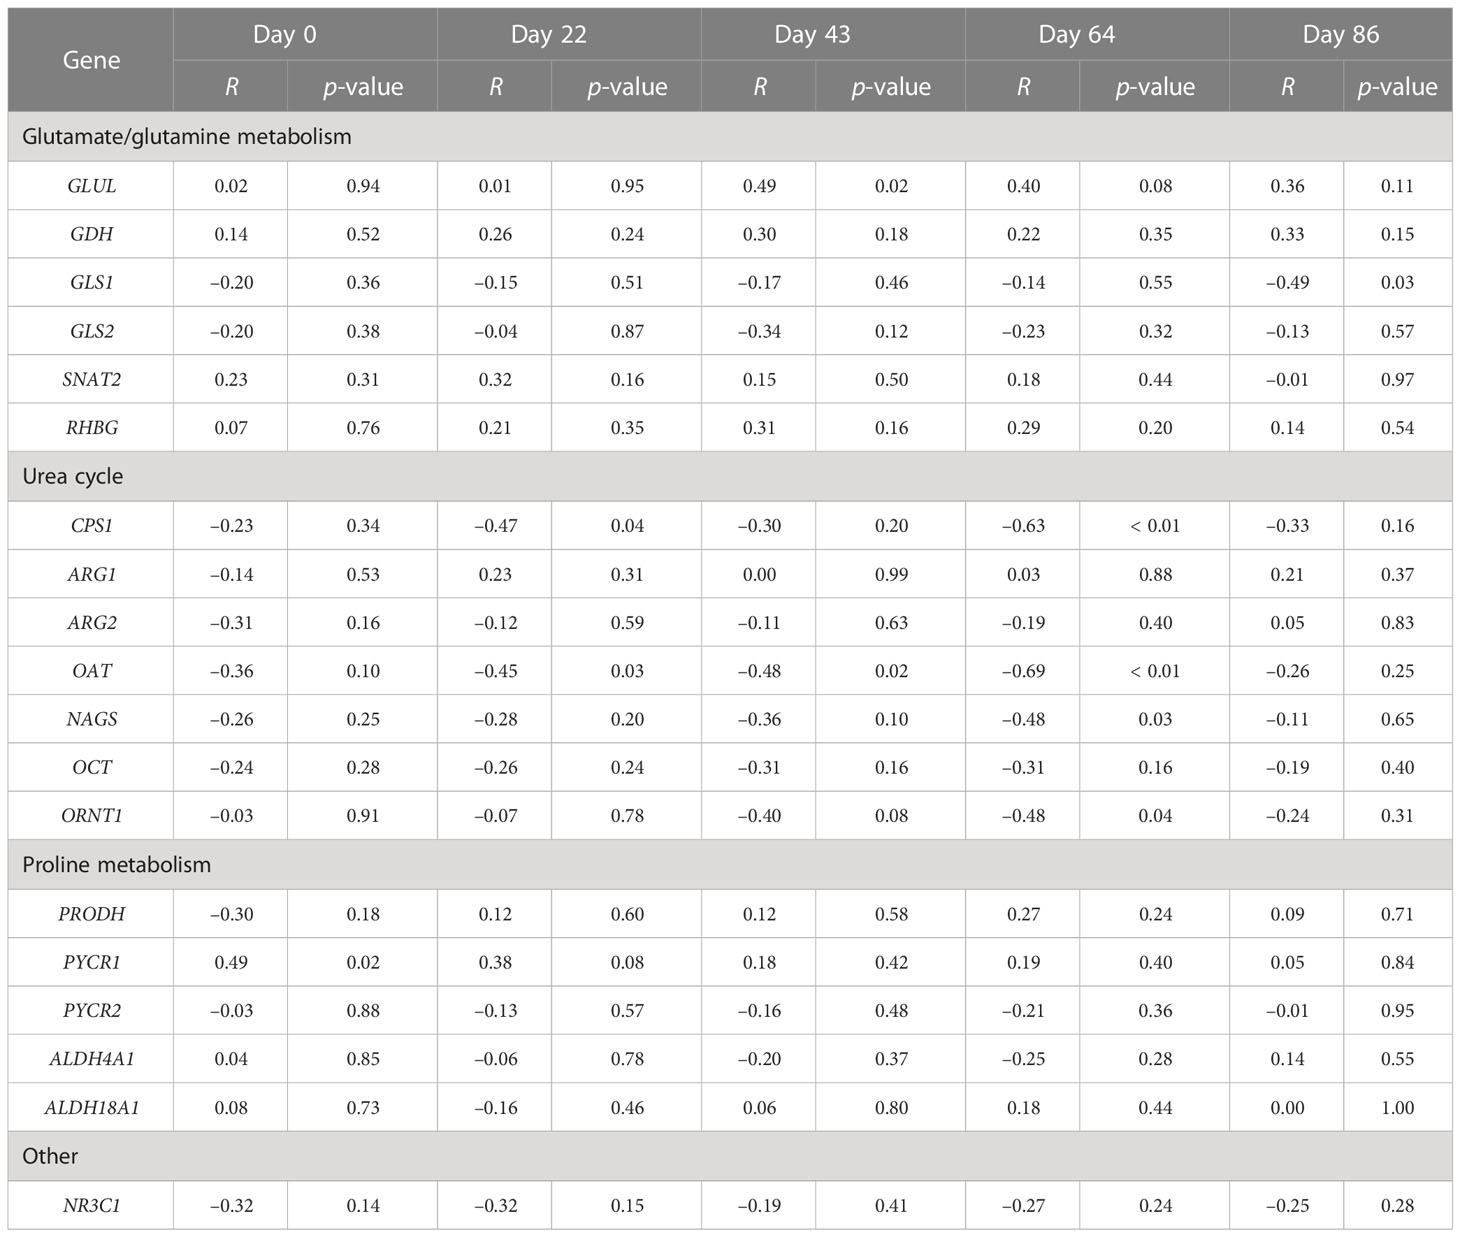
Table 4 Correlation analysis between whole-blood selenium concentration on collection day with endpoint liver mRNA content.
Similar to OAT mRNA expression (Table 3), the relative content of OAT protein was decreased (p< 0.05) in OSe steers compared with MIX and ISe steers (Figure 3; Table 5). To further explore the change in potential glutamate metabolism, the relative hepatic content of high-affinity, system glutamate transporters (EAAC1 and GLT-1) and their regulatory proteins (GTRAP3-18 and ARL6IP1) was assessed by Western blot (Figure 3) and densitometric analysis (Table 5), despite the fact that their mRNA expression was not affected by the form of Se treatment. The form of supplemental Se did not affect the expression of EAAC1 and GLT-1 glutamate transporters (p ≥ 0.24), or the expression of GTRAP3-18 and ARL6IP1 (p ≥ 0.88), regulators of EAAC1 and GLT-1 abundance and activity.
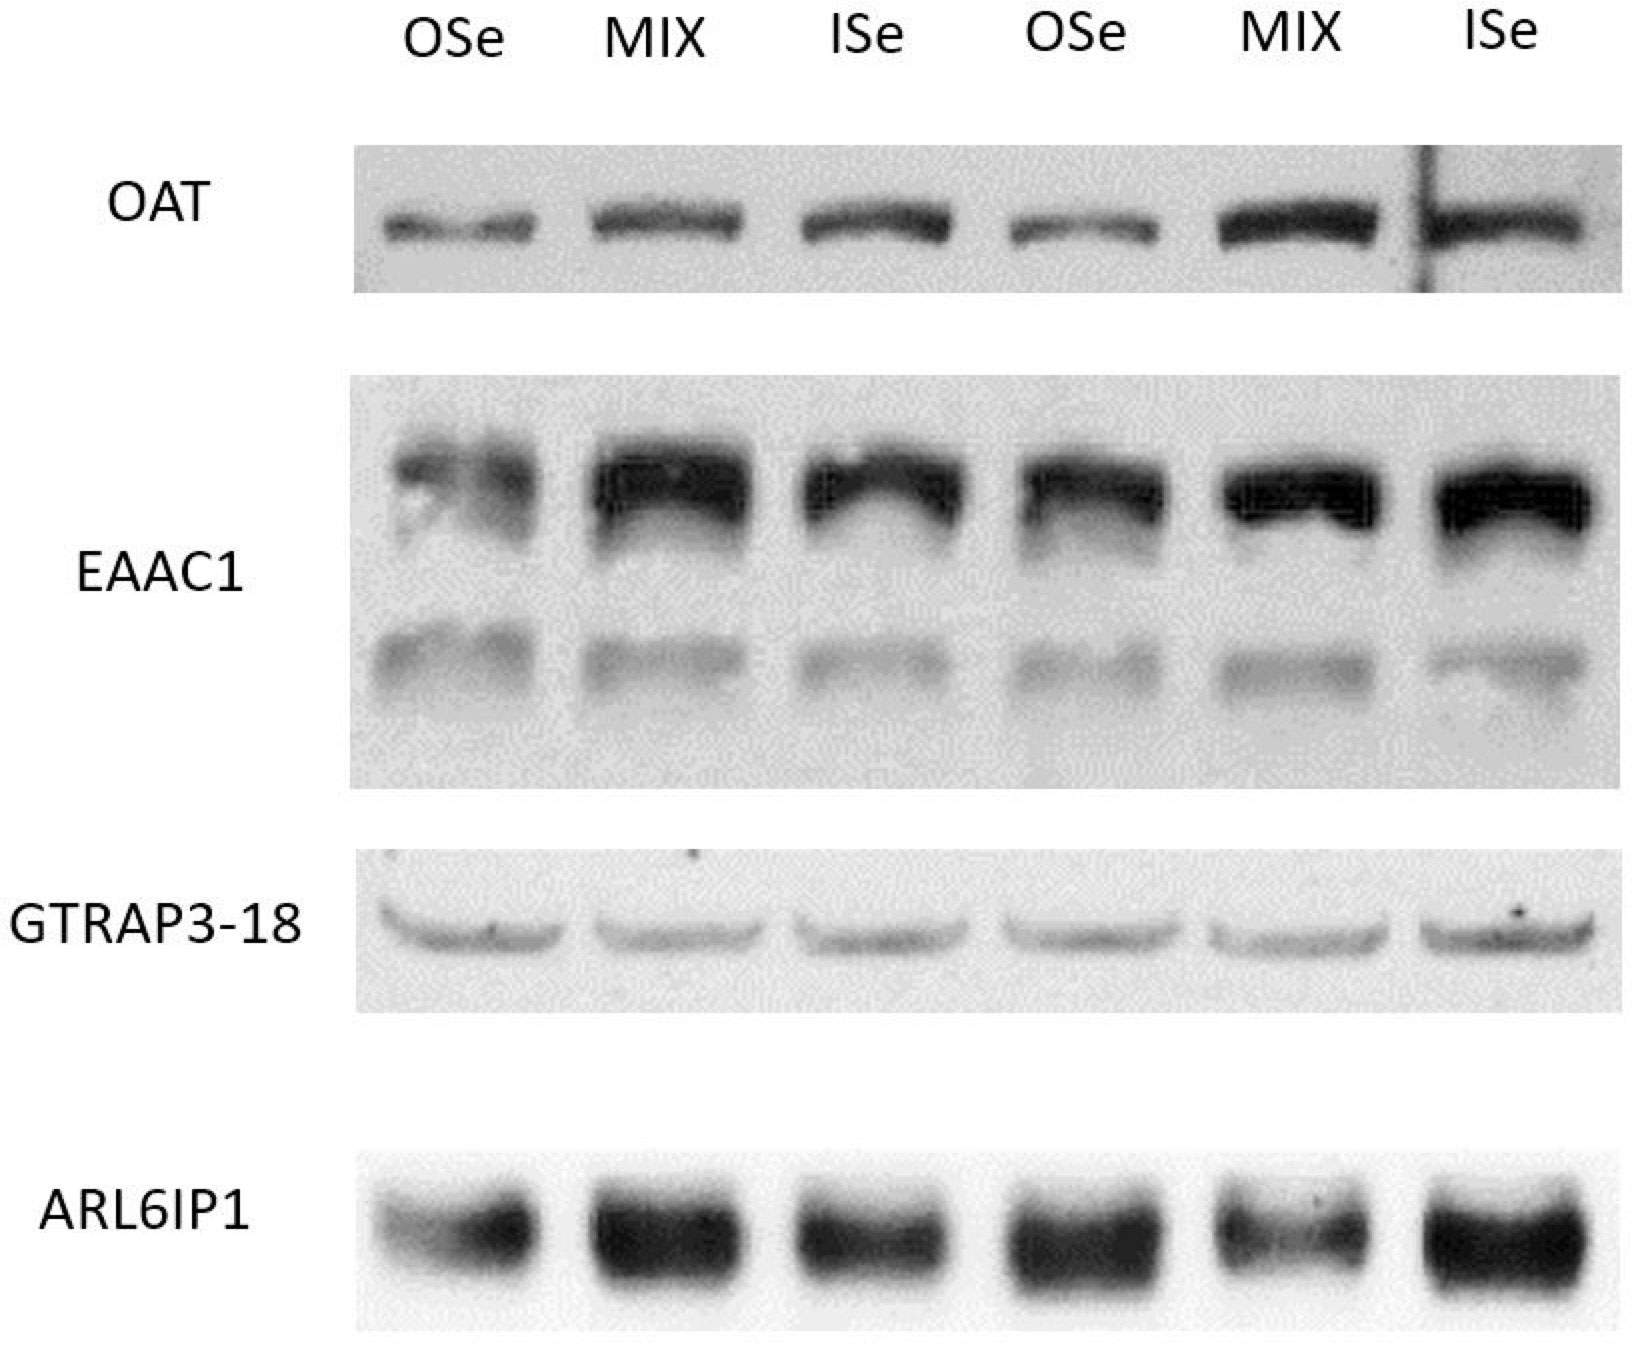
Figure 3 Western blot analysis of selenium treatment effects on hepatic proteins in steers grazing on HE. Liver homogenate (35 μg per lane for EAAC1, GLT-1, GTRAP3–18, and ARL6IP1; 45 μg per lane for OAT) data are representative of ISe (n = 6), OSe (n = 8), and MIX (n = 8) steers grazing on toxic endophyte-infected tall fescue and consuming 3 mg Se per day in vitamin–mineral mixes as sodium selenite (ISe), SEL-PLEX (OSe), or a 1:1 blend of ISe and OSe (MIX). The apparent migration weights (kDa) for the predominant immunoreactants were 57 for the lower, and 75 for the upper, bands of EAAC1; 75 for GLT-1; 42 for GTRAP3-18; 31 for ARL6IP1; and 67 for OAT.
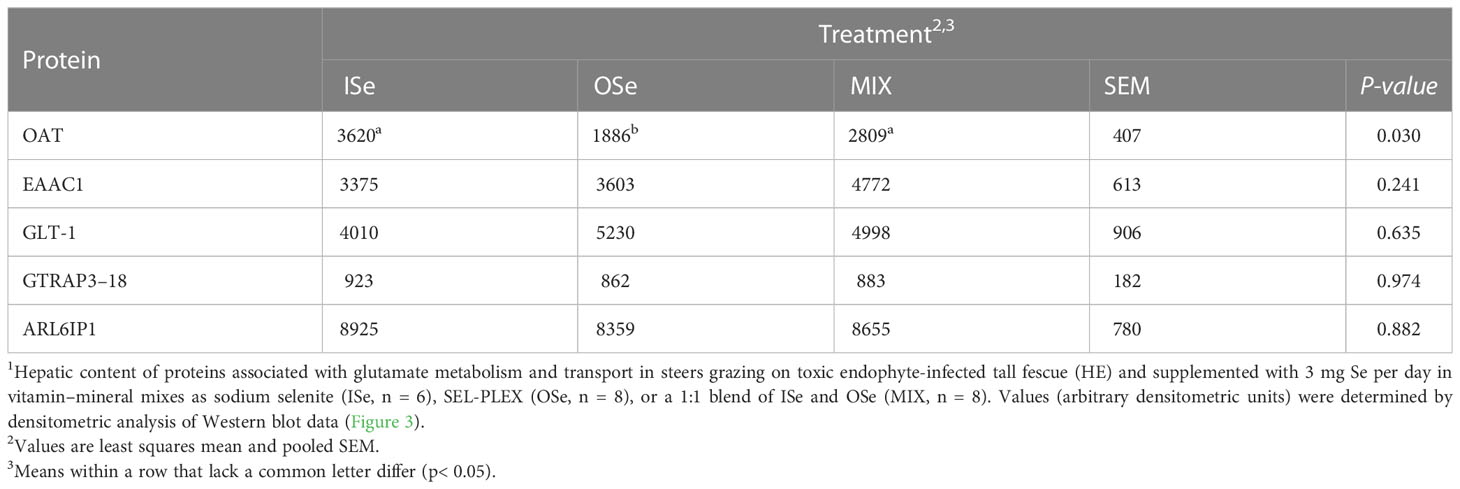
Table 5 Selenium form treatment effects on selected protein content in livers of steers grazing on HE forage1.
The overall goal of the present study was to compare the relative effectiveness of different forms of supplemental Se in ameliorating symptoms of fescue toxicosis in Se-adequate steers grazing on the same TE pasture. Most commercial producers use a free-choice vitamin–mineral mix that contains ISe as the form of supplemental Se. Thus, ISe was our de facto control treatment that was compared with the effects of OSe and MIX forms of Se. In two previous studies, we compared the lack of Se supplementation to ISe and OSe supplementation on blood and liver Se concentrations, and the hepatic transcriptome, after 105–106 days of supplementation (Liao et al., 2011). Next, a time-course (on days 0, 28, 56, 112, 168, and 224) study was conducted to determine the effects of no-Se supplementation compared with supplementation with the ISe, OSe, or MIX on Se levels in the blood and liver tissue of maturing beef heifers (Brennan et al., 2011). Using their biopsied liver tissue, we characterized the effects of no-Se, ISe, OSe, and MIX treatments on the day-168 hepatic transcriptome profile of these steers (Matthews et al., 2014). The results from these studies informed the experimental design used in the present study with regard to the length of Se depletion and repletion periods and time of periodic blood sampling, and the knowledge that supplementing growing beef cattle with ISe, OSe, or MIX in vitamin–mineral mixes differentially affects their hepatic transcriptome profiles.
Thus, the objective of the present study was to evaluate the effect of supplemental Se forms (ISe, OSe, and MIX) on the transcriptome profiles, and targeted mRNA content of critical enzymes involved in glutamate/glutamine and amino acid nitrogen metabolism, in the liver tissue of ISe, MIX, and OSe steers (Jia et al., 2018). As noted in the Introduction, the finding that levels of glutamine synthetase activity in steers for the three Se-treatment groups were ISe<OSe< MIX, indicated that we ought to carry out global gene expression analysis to identify other potential changes in the calves’ N metabolic capacity. In these steers (Jia et al., 2018), the concentration of Se in whole blood increased rapidly and then stabilized for all three Se-treatment experimental groups. The whole-blood Se concentration was higher for the OSe and MIX steers than for the ISe steers. These two observations are consistent with our previous Se depletion/repletion regimens with growing cattle, whether they were fed set amounts of total mix ration with their assigned supplemental Se form in a vitamin–mineral mix (Brennan et al., 2011; Liao et al., 2011), or grazed on toxic and non-toxic endophyte-infected tall fescue and had ad libitum access to the assigned supplemental Se form in vitamin–mineral mixes (Webb et al., 2022). Importantly, these findings indicate that there was successful administration of the ISe, OSe, and MIX forms of supplemental Se.
Over the course of the study, the mean ergot alkaloid (ergovaline and ergovalinine) concentration of the commonly grazed-on HE pasture was 0.51 ppm (Jia et al., 2018). In a previous study, growing steers that grazed on HE of a similar concentration of ergovaline and ergovalinine (0.52 ppm) and consumed a vitamin–mineral mix that contained ISe as the form of supplemental Se developed symptoms of fescue toxicosis, including reductions in their serum prolactin concentrations and levels of alkaline phosphatase activity (Brown et al., 2009; Jackson et al., 2015). Similarly, we also observed reductions in the serum prolactin concentrations and serum alkaline phosphatase activity levels of the ISe-treatment steers in the present study (Jia et al., 2019). In addition, we reported previously that the hepatic alkaline phosphatase content observed in the ISe steers in the present study was lower than that observed in the MIX and OSe steers (Jia et al., 2019). Moreover, we found that hepatic glutamine synthetase mRNA content and activity levels were higher in MIX and OSe steers than in ISe steers (Jia et al., 2018), as were serum albumin levels (Jia et al., 2019). The average daily gain (kg/day) over the grazing period did not differ significantly and was 0.43, 0.47, and 0.53 kg/day for the ISe, MIX, and OSe steers, respectively (Jia et al., 2018).
As is evident from the score plot of the PCA analysis of all microarray chips (Additional File 3), the hierarchical cluster analysis of the DEGs (Figure 2), and the top IPA-identified canonical pathways (Table 1), the hepatic transcriptome profiles of steers consuming the three forms of supplemental Se differed, indicating that there were different metabolic capacities among steers in the three groups. Moreover, as found previously in a study of the livers of slow-maturing beef heifers (Matthews et al., 2014) and neonatal calf testis (Matthews and Bridges, 2014; Cerny et al., 2016), the MIX treatment (comprising 50% inorganic and 50% organic Se sources) resulted in beef heifers and calves having a unique hepatic transcriptomic profile that was not simply an intermediate profile between the ISe (100% inorganic Se sources) and OSe (100% organic Se sources) treatment groups. These non-proportional responses to the Se form included in vitamin–mineral mixes indicate that the form of Se affects other tissue systems to which the liver is responding and/or that the Se form has a direct effect on the genetic mechanisms affecting hepatic gene expression.
The canonical analysis of microarray data (Table 2) revealed that there were changes in the potential capacities of steers for glutamate/glutamine and urea nitrogen metabolism consistent with the increased hepatic glutamine synthetase activity levels observed in MIX and OSe steers (Jia et al., 2018). Therefore, the effect of Se form on the expression of enzymes and transporters critical to these processes was assessed further by RT-PCR analysis (Table 3), and then interpreted in the context of their reputed expression along the mammalian hepatic acinus (Figure 4). In mouse and rat livers, the activities of critical enzymes and transporters responsible for a plethora of metabolic pathways are expressed heterogeneously along the hepatic acinus. This metabolic zonation between periportal and pericentral hepatocytes gives rise to the separation of urea (periportal) and glutamine (pericentral) hepatocyte synthesis (Jungermann and Sasse, 1978; Gebhardt, 1992) (Figure 4). From a glutamate/glutamine and ammonia metabolism perspective, glutamine and ammonia from portal blood are absorbed and metabolized for urea synthesis in periportal hepatocytes, whereas glutamate and excess ammonia are taken up by pericentral hepatocytes and used as substrates (catalyzed by glutamine synthetase) for glutamine synthesis. It should be noted that it remains unclear if ruminant livers display this metabolic zonation. Nevertheless, it has been reported that sheep livers exhibit the simultaneous release and removal of glutamine, as evidenced by the observation that the net removal of glutamine was 2.6 times lower than that of unidirectional removal in sheep (Bergman and Heitmann, 1978). This finding has been interpreted (Reynolds, 1992) as being indicative of functional liver heterogeneity in sheep. Therefore, it is probable that the differential hepatic acinar zonation of these enzymes and transporters is present in ruminant livers, just as it is in rodent livers. The decreased abundance of mRNA for urea-synthesizing enzymes, and increased glutamine synthetase activity and activity levels, observed in steers in the MIX and OSe groups indicate that in the hepatic tissue of MIX and OSe steers ammonia was being conserved and used for synthetic purposes, whereas in the hepatic tissue of ISe steers, it was being used for urea synthesis. The higher serum concentration of albumin in OSe and MIX steers is consistent with there being higher levels of hepatic protein synthesis activity in OSe and MIX steers than in ISe steers.
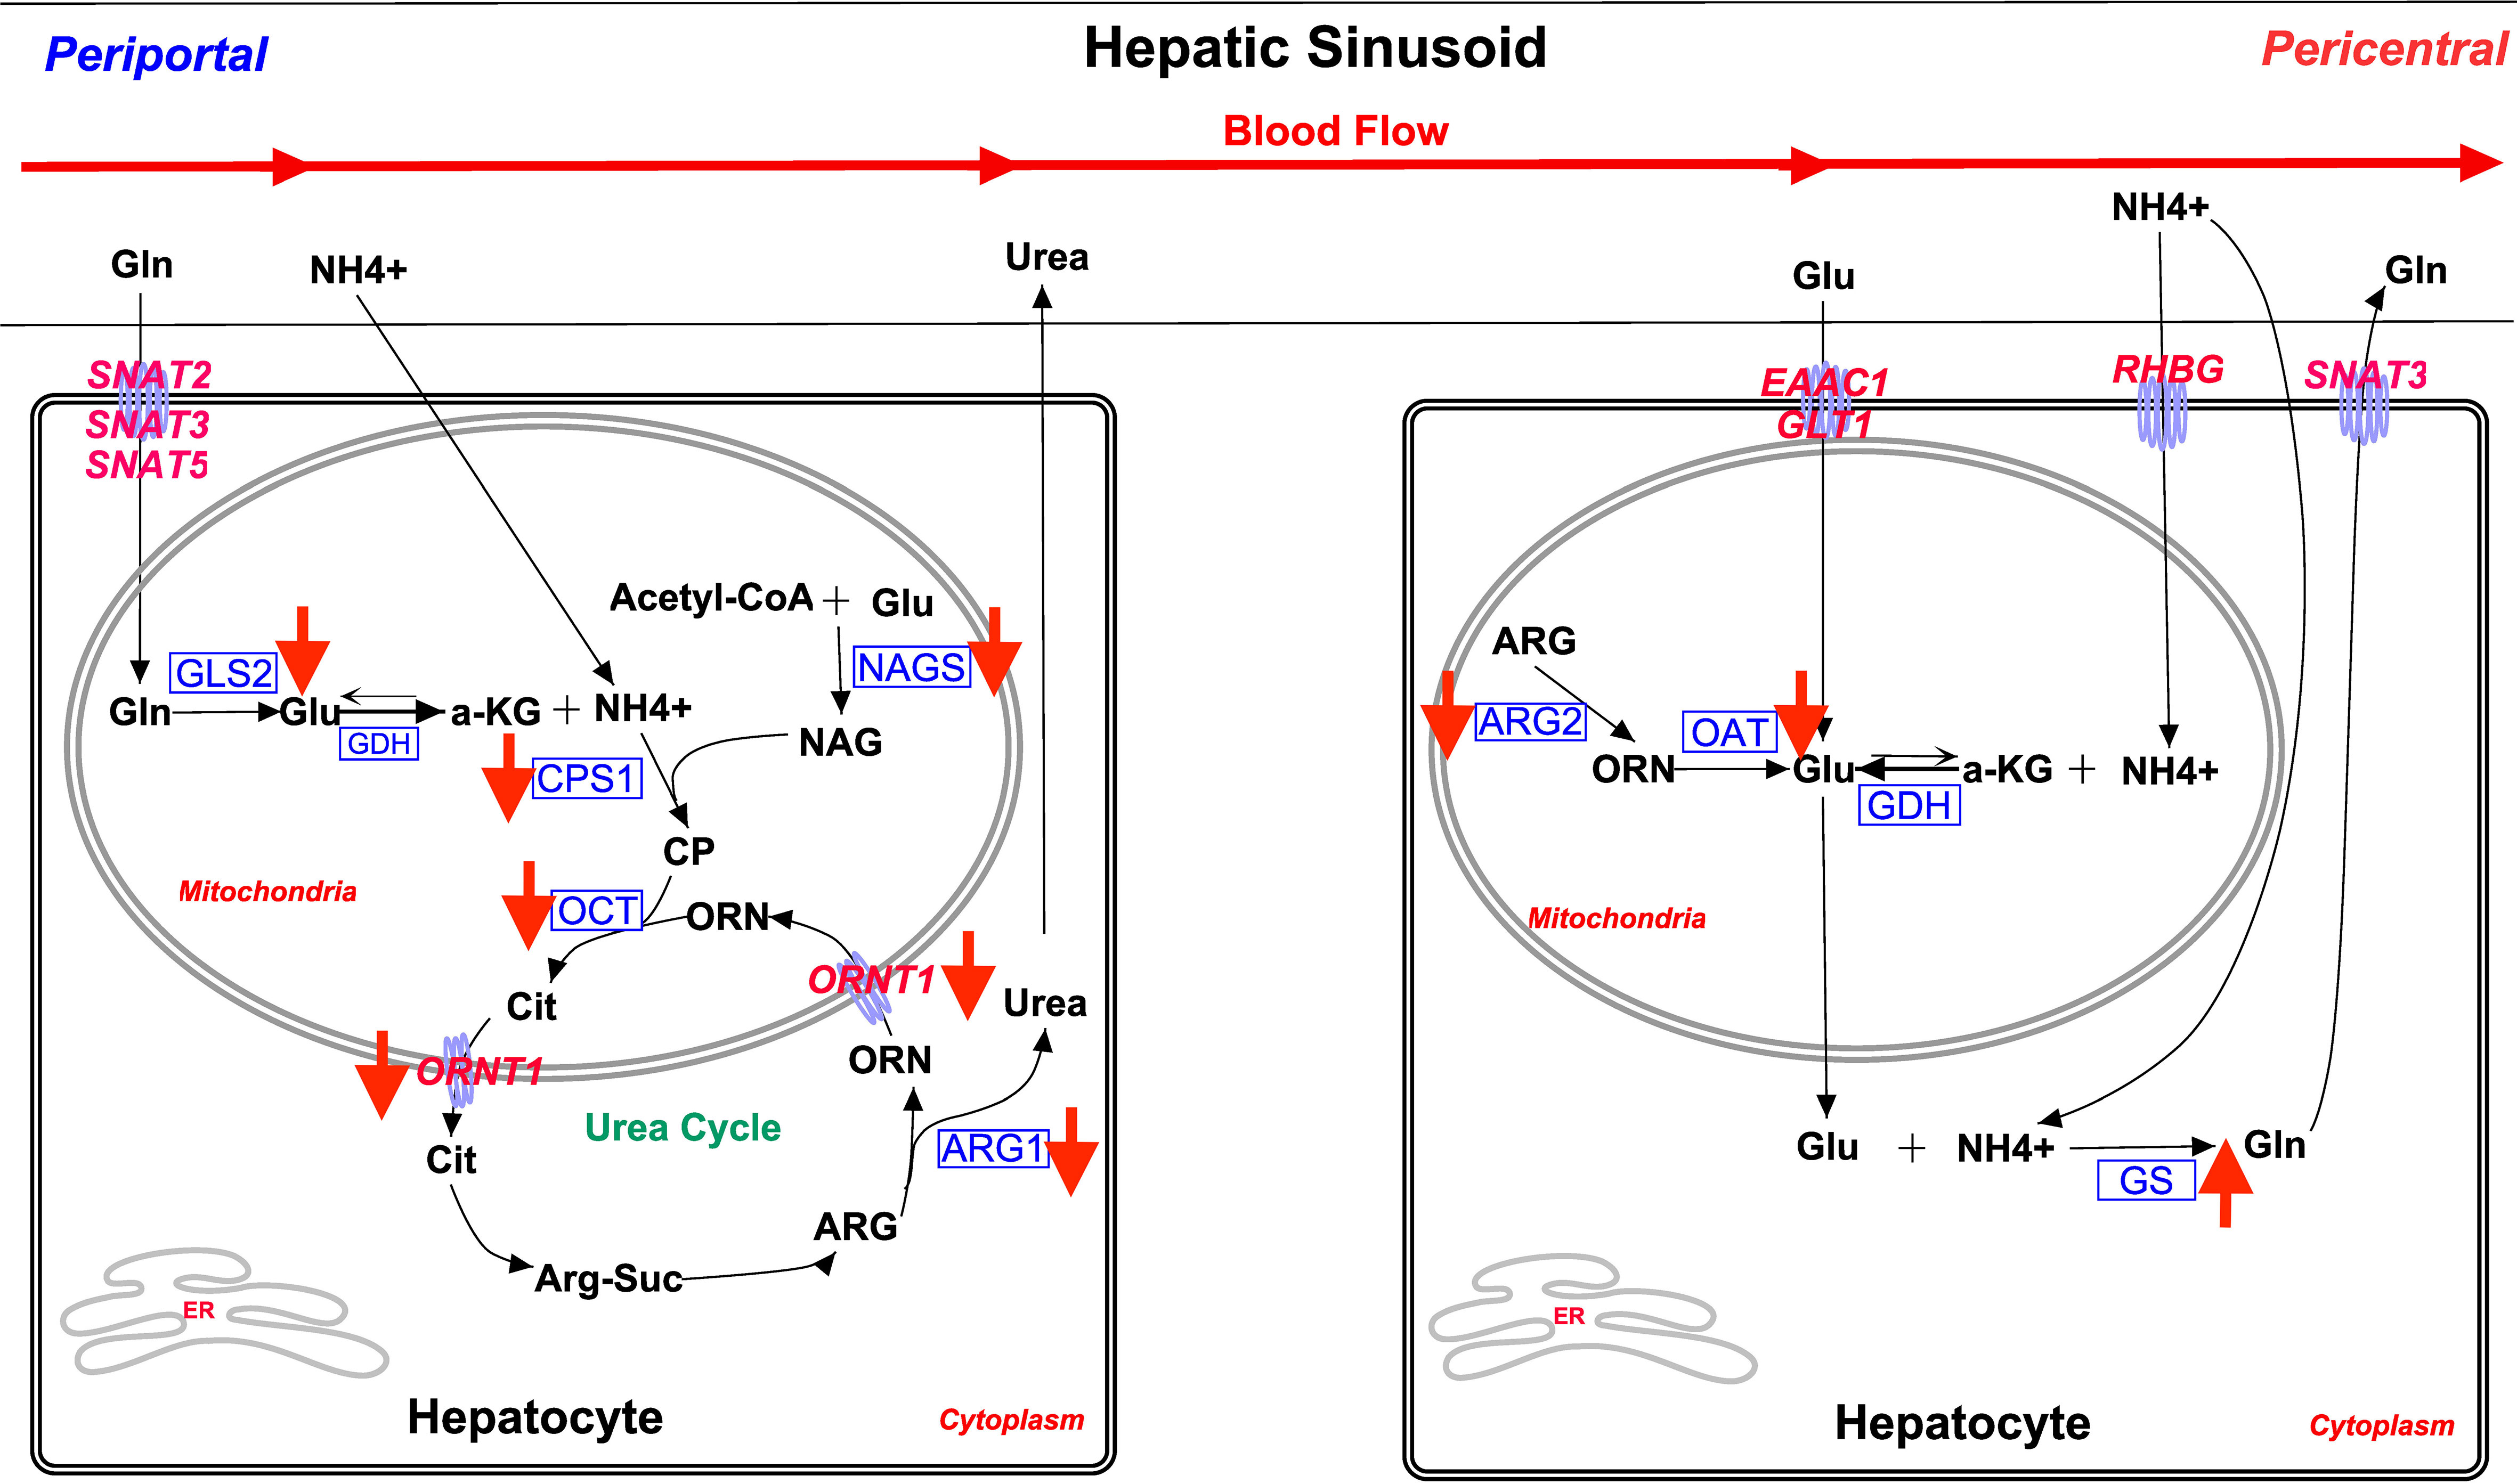
Figure 4 Overview of main glutamine/glutamate cycle and ammonia metabolism pathways in periportal and perivenous hepatocytes. The assignment of a process and its related enzyme and transporter expression is based on rodent model literature. The activities of critical enzymes and transporters responsible for a plethora of metabolic pathways have been found to be heterogeneously expressed along the hepatic acini of mice and rats (Boon et al., 1999). Collectively, this portrayal of metabolic zonation between the periportal and pericentral hepatocytes gives rise to the separation of urea (periportal) and glutamine (pericentral) synthesis (Jungermann and Sasse, 1978; Gebhardt, 1992). Briefly, from a glutamate/glutamine and ammonia metabolism perspective, glutamine and ammonia from portal blood are absorbed and metabolized for urea synthesis in periportal hepatocytes, whereas glutamate and excess ammonia are taken up by pericentral hepatocytes, and used as substrates (glutamine synthetase) for glutamine synthesis. More detailed decriptions of these metabolic pathways, as well as exprimental results, supporting the existence of this zonation pattern are presented in the text. Not all steps are shown. All transporters are in pink font. All enzymes are in blue font. The red arrow indicates the treatment effect of both MIX and OSe. SNAT2, glutamine transporter encoded by SLC38A2; SNAT3, glutamine transporter encoded by SLC38A3; SNAT5, glutamine transporter encoded by SLC38A5; EAAC1, glutamate/aspartate transporter encoded by SLC1A1; GLT1, glutamate/aspartate transporter encoded by SLC1A2; RHBG, ammonia transporter encoded by SLC42A2; GLS2, liver mitochondria glutaminase 2 encoded by GLS2; GDH, glutamate dehydrogenase encoded by GLUD1; CPS1, carbamoyl phosphate synthetase encoded by CPS1; NAGS, N-acetylglutamate synthase encoded by NAGS; OCT, ornithine carbamoyltransferase encoded by OCT; ARG1, arginase 1 encoded by ARG1; ORNT1, ornithine/arginine exchanger encoded by SLC25A15; ARG2, arginase 2 encoded by ARG2; OAT, ornithine aminotransferase encoded by OAT; GS, glutamine synthetase encoded by GLUL.
As shown in Figure 4, mitochondrial glutaminase (GLS2) is predominantly expressed by periportal hepatocytes in rats (Häussinger, 1990a; Moorman et al., 1994). Periportal-specific mitochondrial glutaminase deaminates sinusoidal-derived glutamine (Curthoys and Watford, 1995), which is then taken up by SNAT2 (SLC38A2) (Kondou et al., 2013; Broer, 2014), SNAT3 (SLC38A3), and/or SNAT5 (SLC38A5) (Schioth et al., 2013) activity. The GLS2-derived ammonia is then used for urea synthesis by the ornithine cycle enzymes co-localized in periportal hepatocytes (Meijer et al., 1990; Häussinger et al., 1992). With regard to glutamine-uptake capacity in the current study, neither microarray nor RT-PCR analyses found that hepatic SNAT2 mRNA expression was affected by Se treatment (Table 3). Because the microarray analysis also did not find that SNAT3 or SNAT5 mRNA expression was affected by Se treatment, the capacity for glutamine uptake by periportal hepatocytes was probably not affected by Se treatment.
However, the lower expression of GLS2 mRNA identified by both microarray and RT-PCR analyses in the livers of MIX and OSe steers indicates that there is a reduced capacity for glutamine deamination in the periportal hepatocytes of MIX and OSe steers compared with in those of ISe steers. Rat liver metabolic studies using radio isotopes have reported that up to 13% of ammonia used in urea synthesis is from portal glutamine (by GLS2 activity) (Cooper et al., 1988; Meijer et al., 1990). Therefore, the level of ammonia available in periportal hepatocytes for urea synthesis was probably decreased, consistent with their increased capacity for hepatic glutamine synthesis compared with that of ISe steers.
Concomitant with a potentially decreased capacity for ammonia availability, the mRNA expression of several key enzymes for urea synthesis was decreased in the livers of MIX and OSe steers compared with those of ISe steers (Table 3; Figure 4). The lower with mRNA abundance of carbamoyl phosphate synthetase 1 (CPS1) (Meijer et al., 1990), N-acetylglutamate synthase (NAGS) (Morris, 2002), and ornithine aminotransferase (OCT) strongly indicates that the capacity to form carbamoyl phosphate (the first committed step of the ornithine cycle for ureagenesis) and conjugate it to ornithine to form mitochondrial citrulline was decreased in MIX and Ose steers, consistent with their decreased mRNA content of hepatic glutaminase 2 (GLS2). This finding is reinforced by another, namely, that MIX and Ose steers also had a lower expression of the mRNA-encoding mitochondrial ORNT1 [essential for ureagenesis and responsible for exporting ornithine into the cytosol (Palmieri, 2013)], and ARG1 and ARG2, which are responsible for the cleavage of urea from arginine during ureagenesis (Jenkinson et al., 1996). From a transcriptional regulation perspective, the simultaneous downregulation of key enzymes (CPS1, NAGS, OCT, and ARG1) and transporters (ORNT1) important to ureagenesis is in agreement with the finding that genes for ureagenesis enzymes are usually regulated in a coordinated manner (Takiguchi and Mori, 1995).
Taken together, the lower mRNA content of both ureagenesis enzymes and the ornithine/citrulline exchanger in the liver tissue of MIX and OSe steers strongly indicates that their periportal hepatocytes have a reduced urea-synthesis capacity. However, the concentration of blood urea nitrogen observed in MIX and OSe steers was higher than that in ISe steers over the 86-day grazing period (Jia et al., 2019). This discrepancy between an apparent reduced hepatic-ureagenesis capacity and higher serum blood urea concentrations could be due to the decreased removal of renal urea and/or the decreased gastrointestinal tract and saliva recycling of urea. That is, in ruminants, a considerable amount of urea is recycled to the gastrointestinal tract by direct diffusion across the gut epithelium or extraction by salivary glands, leading to altered blood urea concentrations (Archibeque et al., 2001).
As previously reported (Jia et al., 2018), in addition to our observation that the capacity for hepatic ureagenesis was reduced in MIX and OSe steers, we found that levels of hepatic glutamine synthetase mRNA, protein, and activity all were higher in the liver tissue of MIX and OSe than in that of ISe steers. Given the crucial roles of glutamine synthetase activity in the scavenging of ammonia by pericentral hepatocytes (Figure 4), we expected to find an elevated pericentral ammonia-assimilation capacity in MIX and OSe steers. From a substrate availability and functional capacity perspective, the elevated ammonia-assimilation capacity derived from the increased glutamine synthetase activity of MIX and OSesteers, compared with ISe steers, could be due to an increased supply of intra-cellular substrates (ammonia and glutamate). With regard to an enhanced ammonia supply, the RHBG (SLC42A2) ammonia transporter is solely localized to the basolateral membrane of mouse pericentral hepatocytes (Weiner et al., 2003; Braeuning et al., 2006). However, although a similar numerical increase was observed in RHBG mRNA content by microarray and RT-PCR analyses (Table 3), no statistical difference was found. Thus, these findings may indicate that a greater ammonia-importing capacity was not the reason for the higher levels of hepatic glutamine synthetase activity observed in MIX and OSe steers. Regarding a possible increased extracellular source of glutamate, the high-affinity system glutamate uptake activity expressed on the basolateral membrane of pericentral hepatocyte (Figure 4) (Cadoret et al., 2002; Matthews, 2005; Braeuning et al., 2006) is responsible for importing sinusoidal glutamate to support glutamine synthesis. However, neither the expressions of EAAC1 and GLT-1 nor of their activity-regulating proteins GTRAP3-18 and ARL6IP1, differed among the Se-treated steers (Figure 3; Table 5), indicating that the glutamate-uptake capacity in the pericentral zone was not affected by Se treatments.
With regard to a possible increased intracellular supply of glutamate to support glutamine synthetase-mediated glutamine production in pericentral hepatocytes of OSe and MIX steers, glutamate could have been derived from arginine and/or ornithine carbons (Figure 4). More specifically, the co-localization of arginase 2, ornithine aminotransferase, and glutamine synthetase to pericentral hepatocytes facilitates the serial production of ornithine from arginine by arginase 2, followed by glutamate production from ornithine by ornithine aminotransferase activity (Colombatto et al., 1994; Boon et al., 1999). However, in the current study, arginase 2 and ornithine aminotransferase mRNA contents were lower in the livers of both MIX and OSe than in those of ISe steers (Table 3). Moreover, the hepatic protein content of ornithine aminotransferase in OSe steers (Figure 3; Table 5) was lower than in ISe and MIX steers. Thus, arginine and ornithine likely were not the intracellular source of glutamate for glutamine synthesis by glutamine synthetase activity by OSe and MIX steers, with both groups displaying amelioration of higher hepatic urea enzyme mRNA and lower glutamine synthetase mRNA of ISe steers.
Glutamate dehydrogenase 1 (GDH) catalyzes the conversion between glutamate and alpha-ketoglutarate plus ammonium in both directions (amination and deamination). Studies with rodents show that hepatic GDH acts in a bi-directional manner (Brosnan et al., 1996; Nissim et al., 1999) and that GDH mRNA expression (Geerts et al., 1996; Boon et al., 1999) and activity (Maly and Sasse, 1991) are greatest in pericentral hepatocytes where GDH mediates the amination of α-ketoglutarate to produce glutamate. Therefore, in the current study, another potential source of intracellular glutamate in pericentral hepatocytes is the GDH-mediated amination of α-ketoglutarate. Importantly, the mRNA expression of GDH (microarray results; Table 3; Additional File 6) was higher in the livers of MIX and OSe steers compared with ISe steers. Thus, the livers of MIX and OSesteers likely had a greater capacity for the production of glutamate from α-ketoglutarate and ammonia mediated by GDH activity, and not from arginine or ornithine, thereby supplying glutamate for glutamine synthetase-mediated production of glutamine. If so, then the increased expression of GDH mRNA together with the elevated glutamine synthetase activity in the liver of growing steers is consistent with the role of GDH in regulating hepatic pericentral amination demonstrated in rodents (Bera et al., 2016).
The decreased expression of enzymes responsible for periportal hepatocyte-specific glutamine deamination and ureagenesis, together with higher levels of pericentral hepatocyte-specific glutamine synthetase activity, suggests that there is a difference in ammonia metabolism along the hepatic acini of MIX and OSe steers and those of ISe steers. More specifically, compared with ISe steers, the periportal hepatocytes of MIX and OSe steers showed a decreased capacity for ammonia assimilation, and a compensatory, enhanced capacity for ammonia assimilation was observed in their pericentral hepatocytes, as evidenced by the lower expression of periportal glutaminase 2 and ureagenesis enzymes and transporters, and the higher expressions and activity levels of glutamine synthetase observed in pericentral hepatocytes.
The exact mechanisms underlying these types of changes in hepatic glutamate-glutamine and ammonia metabolism, induced by Se treatment, are not clear. However, as demonstrated for rodents, hepatic ureagenesis enzymes (Morris et al., 1987; Nebes and Morris, 1988) and glutaminase (Häussinger, 1990b; Curthoys and Watford, 1995) are regulated by a variety of hormones, including glucocorticoids. Both rat and cow hepatic GDH activities were increased following glucocorticoid administration (Heitzman et al., 1972). In the current study, the glucocorticoid receptor (NR3C1) mRNA content was lower in the livers of MIX and OSe steers than in those of ISe steers (Table 3). The mechanism of this change in glucocorticoid receptor mRNA content is not clear, but a potential interaction between Se and the liver glucocorticoid receptor has been reported (Tashima et al., 1989), in which selenite had an inhibitory effect on hormone binding of the liver glucocorticoid receptor. Moreover, transcriptome profiling (microarray and RT-PCR) of the pituitaries from ISe, OSe, and MIX steers in the current study indicates that the expression of genes involved in pituitary POMC/ACTH synthesis was differentially altered by the form of supplemental Se (Li et al., 2019). Therefore, it is reasonable to suggest that different glucocorticoid-stimulating capacities existed in the adrenal cortex among ISe, OSe, and MIX steers, given the stimulating role of ACTH on glucocorticoid secretion, and that these different capacities were responsible for the observed differences in the relative abundance of mRNA for genes responsible for hepatic glutamate/glutamine and ammonia metabolismsm. Indeed, a previous study examining the effect of fescue toxicosis on the hepatic mRNA and protein profiles of steers that had grazed on HE forage and consumed ISe (Brown et al., 2009; Liao et al., 2015) indicated that fescue toxicosis induces protein catabolic-like metabolism through glucocorticoid receptor-mediated signaling.
As previously reported by Jia et al. (2018), whole-blood Se concentrations were affected by the form of Se supplementation used. Specifically, the whole-blood Se concentrations observed in MIX and OSe steers did not differ but were 11% and 7.5% higher, respectively, than those in ISe steers. An important finding that was applicable to all Se supplementation treatments was that whole-blood Se concentrations increased by 49% between day 0 and day 22, and remained stable from day 22 to day 86. To identify the potential relationships between whole-blood Se concentrations and selected hepatic mRNA content at slaughter (i.e., days 93 to 119), Pearson’s correlation analysis was performed on individual experimental day (Table 4). The salient finding was that the mRNA content of GLS1 and four urea-cycle proteins (i.e., CPS1, OAT, NAGS, and ORNT1) was negatively correlated with whole-blood Se concentrations on days 64 and 86. The mRNA content of these same proteins was lower in the livers of MIX and OSe steers than in those of ISe steers (Table 3). In addition, the mRNA content of GLUL was higher in MIX and OSe steers, was positively correlated with the whole-blood Se concentration on day 43, and tended to be correlated with the whole-blood Se concentration on day 64. Because the whole-blood Se concentrations of the MIX and OSe steers were higher from days 22 to 86 (Jia et al., 2018), a priori, this relationship suggests that urea cycle capacity is inversely related to both whole-blood Se concentrations in blood and an increased capacity for glutamine synthesis. However, the mRNA content of GLS2 and three urea-cycle proteins (i.e., ARG1, ARG2, and OCT) was decreased in the livers of MIX and OSe steers but was not correlated with whole-blood Se concentration. This apparent discrepancy of differential correlations between whole-blood Se concentration and the expression of proteins in the pathways responsible for hepatic N recycling may be indicative of separate liver functions. That is, selenoprotein P (SelP) constitutes 50% of plasma Se (Burk and Hill, 2005), and hepatic SelP is a circulating source of Se for tissues, the levels of which increase in response to Se deficiency and decrease in response to Se surfeit (Labunskyy et al., 2014; Burk and Hill, 2015). With regard to the effect of supplemental Se treatment on hepatic SelP mRNA content in the present study, microarray analysis revealed that there was no treatment effect (p > 0.49, data not shown) and RT-PCR analysis found that Se treatment also did not affect hepatic SelP mRNA content (Li et al., 2022).
Because the grazing of HE by growing beef steers consuming ISe as a Se supplement increases the steers’ capacity for hepatic proline synthesis (Liao et al., 2015), and because the metabolism of proline and glutamate/glutamine are linked through pyrroline-5-carboxylate (Figure 5), the potential effects of Se treatment on the expression of genes involved with proline synthesis and degradation were evaluated (Table 3). That the expression of pyrroline-5-carboxylate synthetase (ALDH18A1) mRNA was higher (RT-PCR analysis) in the livers of MIX and OSe steers than in those of ISe steers indicates that the capacity for pyrroline-5-carboxylate production was greater in MIX and OSe steers than in ISe steers. This finding, when combined with the much higher expression of PYCR1 mRNA in OSe steers than in MIX and ISe steers, indicates that OSe steers, at least, had a greater capacity than ISe steers for the production of proline from glutamate.
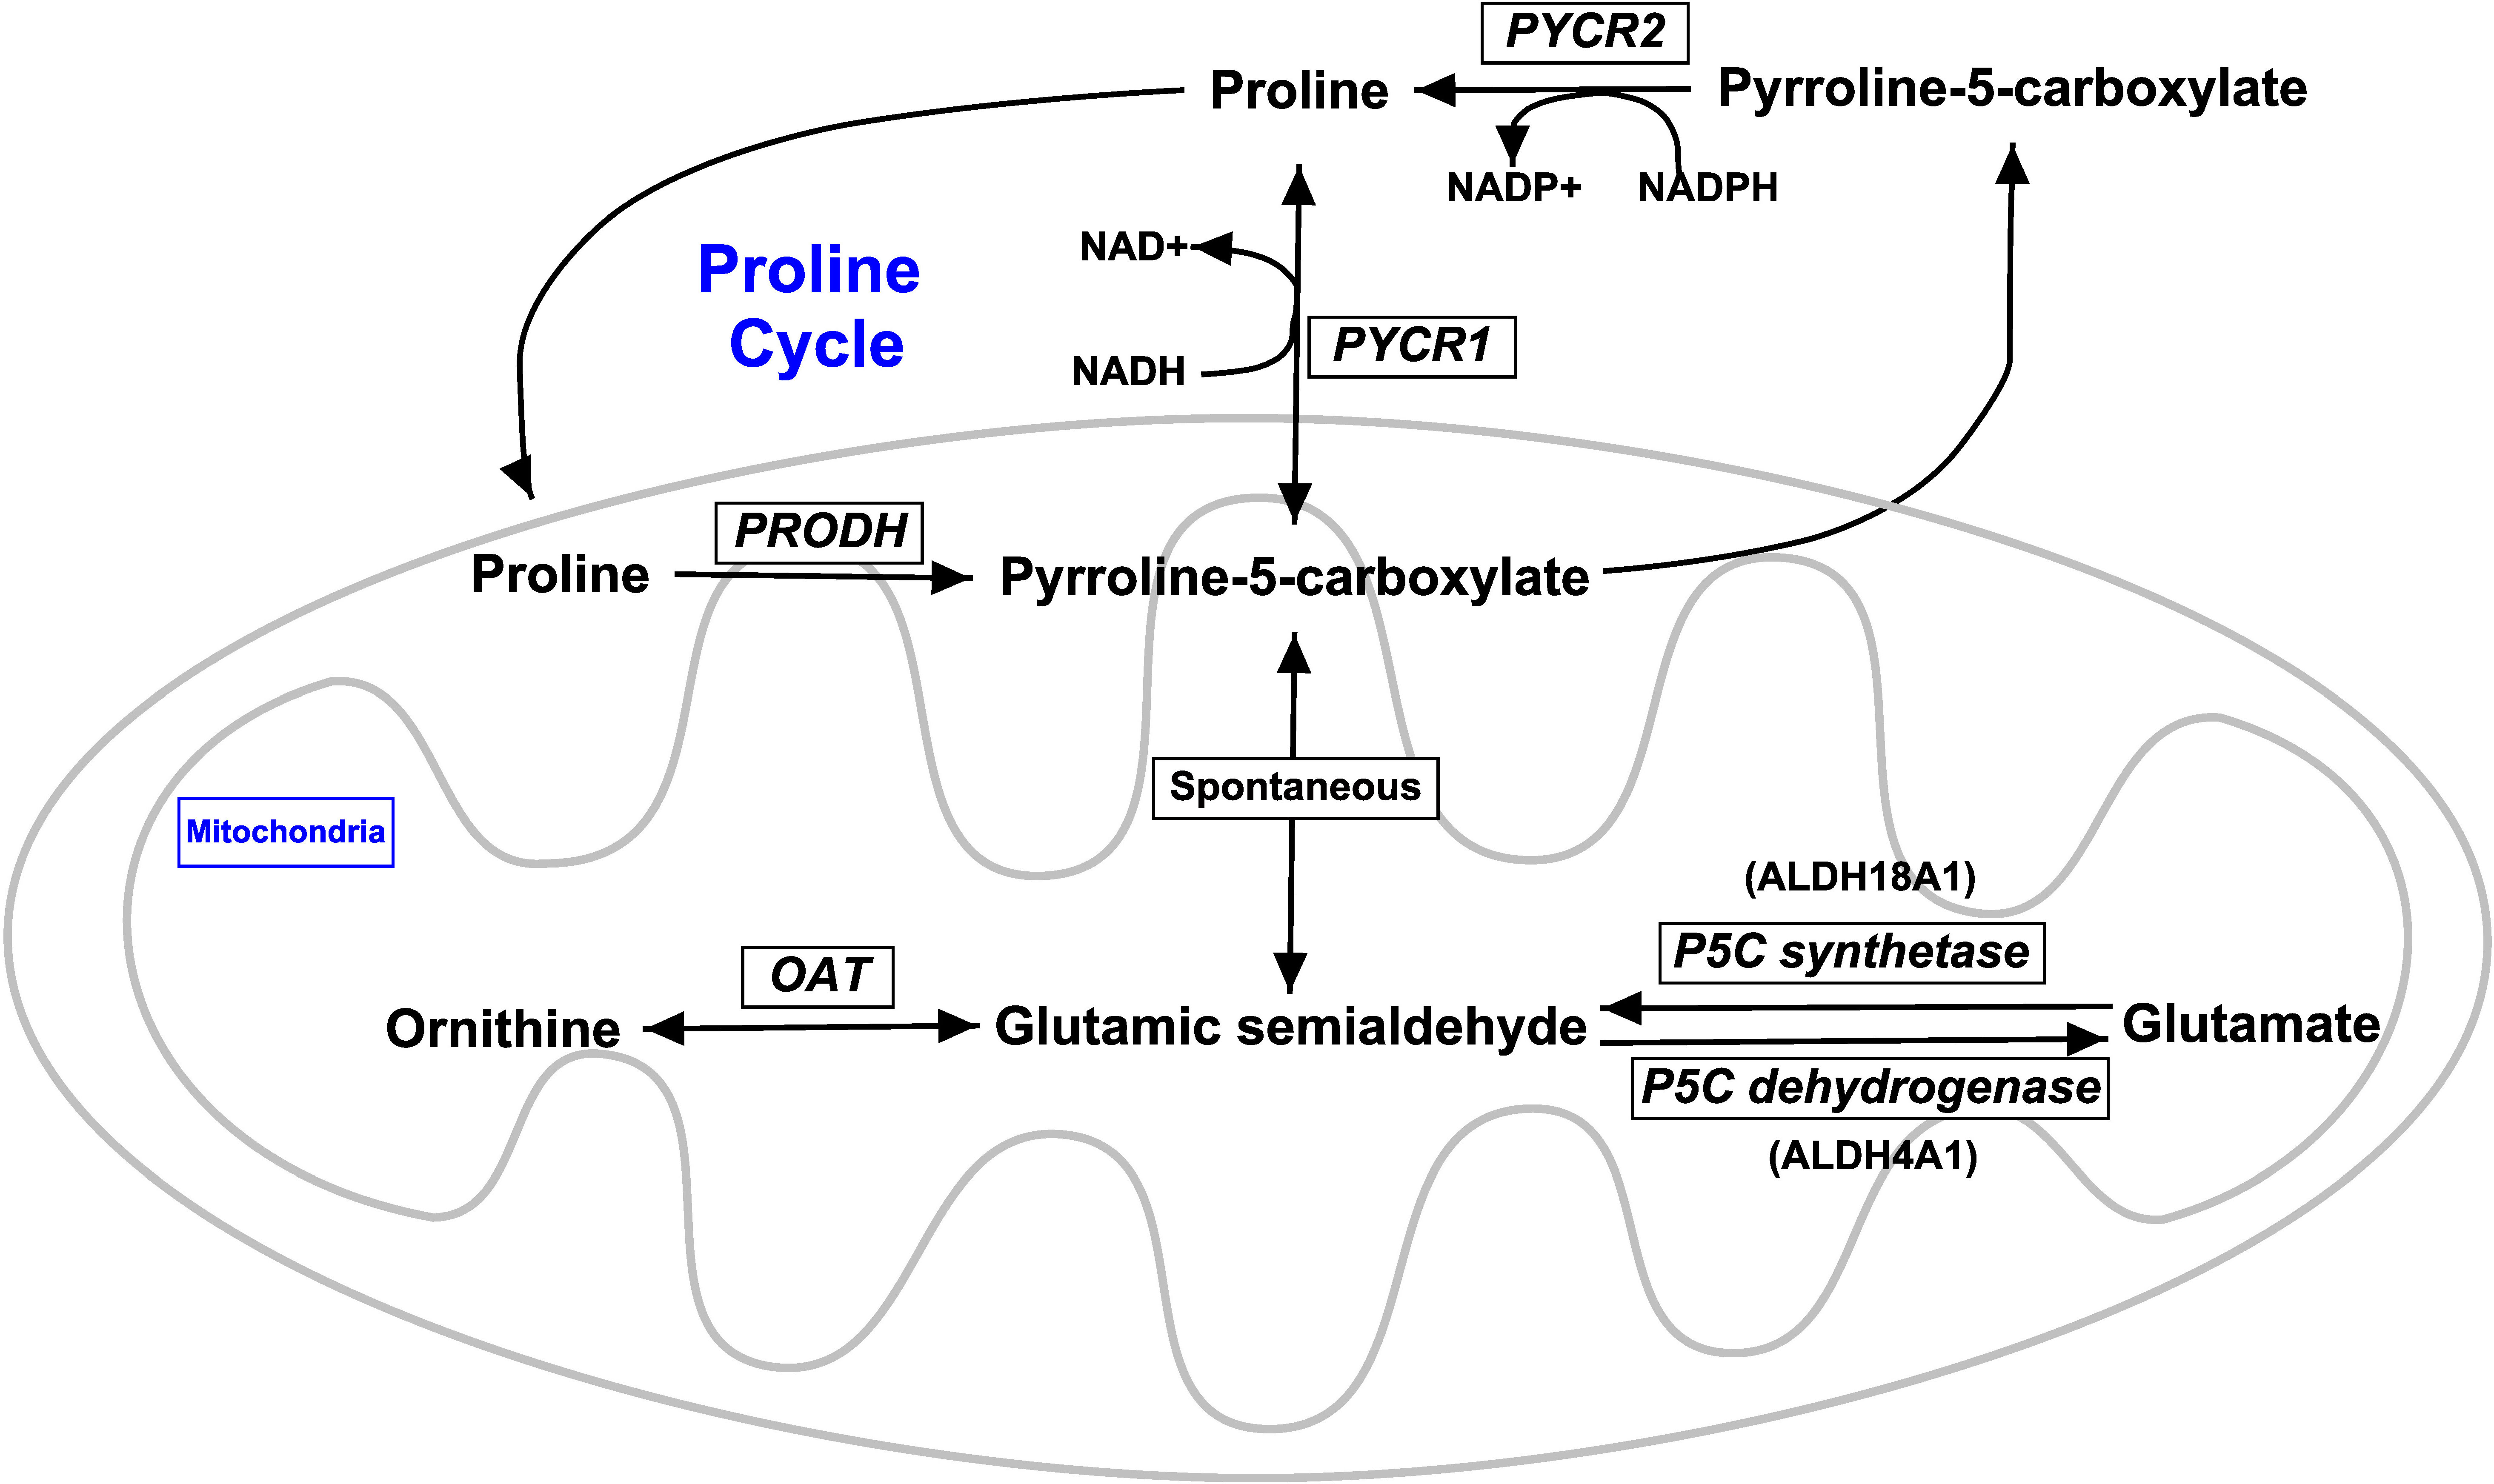
Figure 5 Overview of proline metabolic pathways. A schematic representation of the key steps in proline metabolism, as adapted and modified from a previous study (Phang et al., 2010). Proline and pyrroline-5-carboxylate interconvert and form the proline cycle, wherein proline dehydrogenase 1 converts proline to pyrroline-5-carboxylate and pyrroline-5-carboxylate reductase 1 and/or 2 reduce pyroline-5-carboxylate to proline. Ornithine and glutamate indirectly feed into the proline cycle by conversion into a central intermediate, glutamic semialdehyde, which undergoes spontaneous conversion to pyrroline-5-carboxylate. Not all steps are shown. PRODH, proline dehydrogenase 1 (a.k.a. proline oxidase) encoded by PRODH; PYCR1, pyrroline-5-carboxylate reductase 1 encoded by PYCR1; PYCR2, pyrroline-5-carboxylate reductase 2 encoded by PYCR2; OAT, ornithine aminotransferase encoded by OAT; P5C synthetase (a.k.a. pyrroline-5-carboxylate synthetase) encoded by ALDH18A1; P5C dehydrogenase (a.k.a, pyrroline-5-carboxylate dehydrogenase) encoded by ALDH4A1.
The form of supplemental Se (ISe, MIX, or OSe) affected the hepatic transcriptome profiles of growing beef steers subjected to summer-long grazing of HE pasture. The potential for altered capacities in several canonical metabolic pathways, including glutamate and glutamine biosynthesis and degradation, and proline biosynthesis was identified. Targeted RT-PCR and Western blot analyses identified that MIX and OSe steers had a reduced capacity for periportal urea synthesis, and a compensatory, elevated capacity for pericentral ammonia assimilation through a higher capacity for glutamine synthesis, consistent with an increased potential for protein synthesis. Accompanying these differences, we observed that ISe steers had, in comparison with MIX and OSe steers, decreased serum prolactin concentrations and alkaline phosphatase activity levels that are typical of fescue toxicosis (Jia et al., 2018). However, the positive metabolic parameters indicating a reduced state of fescue toxicosis in the MIX and OSe steers did not result in a statistically significant difference in body weight (Jia et al., 2018). This apparent discrepancy needs to be investigated in future research.
All data generated or analyzed during this study can be found in the article/Supplementary Material. Sequences for the RT-PCR products can be accessed from GenBank (https://www.ncbi.nlm.nih.gov/genbank/), accession numbers in Additional File 4. Microarray data (.cel files) are MIAME compliant and can be accessed from the Gene Expression Omnibus (GEO; http://www.ncbi.nlm.nih.gov/geo/), accession number GSE115802.
The animal study was reviewed and approved by The University of Kentucky Institutional Animal Care and Use Committee.
YJ: conceived and carried out the experiments, analyzed the data, and wrote the manuscript; KS: managed the experimental samples and carried out the Western blot analyses; JM: conceived and obtained funding for the study, designed and oversaw experiments, and revised the manuscript. All authors contributed to the article and approved the submitted version.
This work was supported by a United States Department of Agriculture Agricultural Research Service Specific Cooperative Agreement (JM) and by the National Institute of Food and Agriculture, United States Department of Agriculture, Hatch project No.1010352.
The authors declare that the research was conducted in the absence of any commercial or financial relationships that could be construed as a potential conflict of interest.
All claims expressed in this article are solely those of the authors and do not necessarily represent those of their affiliated organizations, or those of the publisher, the editors and the reviewers. Any product that may be evaluated in this article, or claim that may be made by its manufacturer, is not guaranteed or endorsed by the publisher.
The Supplementary Material for this article can be found online at: https://www.frontiersin.org/articles/10.3389/fanim.2023.1165321/full#supplementary-material
Ammerman C. B., Miller S. M. (1975). Selenium in ruminant nutrition: a review. J. Dairy Sci. 58 (10), 1561–1577. doi: 10.3168/jds.S0022-0302(75)84752-7
Archibeque S. L., Burns J. C., Huntington G. B. (2001). Urea flux in beef steers: effects of forage species and nitrogen fertilization. J. Anim. Sci. 79 (7), 1937–1943. doi: 10.2527/2001.7971937x
Bera S., Lamba S., Rashid M., Sharma A. K., Medvinsky A. B., Acquisti C., et al. (2016). Robust regulation of hepatic pericentral amination by glutamate dehydrogenase kinetics. Integr. Biol. (Camb). 8 (11), 1126–1132. doi: 10.1039/C6IB00158K
Bergman E., Heitmann R. (1978). Metabolism of amino acids by the gut, liver, kidneys, and peripheral tissues. Fed. Proc. 37 (5), 1228–1232.
Bhusari S., Hearne L. B., Spiers D. E., Lamberson W. R., Antoniou E. (2006). Effect of fescue toxicosis on hepatic gene expression in mice. J. Anim. Sci. 84 (6), 1600–1612. doi: 10.2527/2006.8461600x
Blalock E. M., Chen K. C., Sharrow K., Herman J. P., Porter N. M., Foster T. C., et al. (2003). Gene microarrays in hippocampal aging: statistical profiling identifies novel processes correlated with cognitive impairment. J. Neurosci. 23 (9), 3807–3819. doi: 10.1523/JNEUROSCI.23-09-03807.2003
Boon L., Geerts W. J., Jonker A., Lamers W. H., Van Noorden C. J. (1999). High protein diet induces pericentral glutamate dehydrogenase and ornithine aminotransferase to provide sufficient glutamate for pericentral detoxification of ammonia in rat liver lobules. Histochem Cell Biol. 111 (6), 445–452. doi: 10.1007/s004180050380
Braeuning A., Ittrich C., Kohle C., Hailfinger S., Bonin M., Buchmann A., et al. (2006). Differential gene expression in periportal and perivenous mouse hepatocytes. FEBS J. 273 (22), 5051–5061. doi: 10.1111/j.1742-4658.2006.05503.x
Brennan K. M., Burris W. R., Boling J. A., Matthews J. C. (2011). Selenium content in blood fractions and liver of beef heifers is greater with a mix of inorganic/organic or organic versus inorganic supplemental selenium but the time required for maximal assimilation is tissue-specific. Biol. Trace Elem Res. 144 (1-3), 504–516. doi: 10.1007/s12011-011-9069-y
Broer S. (2014). The SLC38 family of sodium-amino acid co-transporters. Pflugers Arch. 466 (1), 155–172. doi: 10.1007/s00424-013-1393-y
Brosnan J. T., Brosnan M. E., Charron R., Nissim I. (1996). A mass isotopomer study of urea and glutamine synthesis from 15N-labeled ammonia in the perfused rat liver. J. Biol. Chem. 271 (27), 16199–16207. doi: 10.1074/jbc.271.27.16199
Brown K. R., Anderson G. A., Son K., Rentfrow G., Bush L. P., Klotz J. L., et al. (2009). Growing steers grazing high versus low endophyte (Neotyphodium coenophialum)-infected tall fescue have reduced serum enzymes, increased hepatic glucogenic enzymes, and reduced liver and carcass mass. J. Anim. Sci. 87 (2), 748–760. doi: 10.2527/jas.2008-1108
Burk R. F., Hill K. E. (2005). Selenoprotein p: an extracellular protein with unique physical characteristics and a role in selenium homeostasis. Annu. Rev. Nutr. 25, 215–235. doi: 10.1146/annurev.nutr.24.012003.132120
Burk R. F., Hill K. E. (2015). Regulation of selenium metabolism and transport. Annu. Rev. Nutr. 35, 109–134. doi: 10.1146/annurev-nutr-071714-034250
Cadoret A., Ovejero C., Terris B., Souil E., Levy L., Lamers W. H., et al. (2002). New targets of beta-catenin signaling in the liver are involved in the glutamine metabolism. Oncogene 21 (54), 8293–8301. doi: 10.1038/sj.onc.1206118
Cerny K. L., Garbacik S., Skees C., Burris W. R., Matthews J. C., Bridges P. J. (2016). Gestational form of selenium in free-choice mineral mixes affects transcriptome profiles of the neonatal calf testis, including those of steroidogenic and spermatogenic pathways. Biol. Trace Elem Res. 169 (1), 56–68. doi: 10.1007/s12011-015-0386-4
Colombatto S., Giribaldi G., Vargiu C., Grillo M. A. (1994). Modulation of ornithine aminotransferase activity by oxygen in rat hepatocyte cultures. Biochim. Biophys. Acta 1224 (3), 329–332. doi: 10.1016/0167-4889(94)90264-X
Cooper A. J., Nieves E., Rosenspire K. C., Filc-DeRicco S., Gelbard A. S., Brusilow S. W. (1988). Short-term metabolic fate of 13N-labeled glutamate, alanine, and glutamine(amide) in rat liver. J. Biol. Chem. 263 (25), 12268–12273. doi: 10.1016/S0021-9258(18)37750-0
Curthoys N. P., Watford M. (1995). Regulation of glutaminase activity and glutamine metabolism. Annu. Rev. Nutr. 15 (1), 133–159. doi: 10.1146/annurev.nu.15.070195.001025
Dehnes Y., Chaudhry F. A., Ullensvang K., Lehre K. P., Storm-Mathisen J., Danbolt N. C. (1998). The glutamate transporter EAAT4 in rat cerebellar purkinje cells: a glutamate-gated chloride channel concentrated near the synapse in parts of the dendritic membrane facing astroglia. J. Neurosci. 18 (10), 3606–3619. doi: 10.1523/JNEUROSCI.18-10-03606.1998
Gebhardt R. (1992). Metabolic zonation of the liver: regulation and implications for liver function. Pharmacol. Ther. 53 (3), 275–354. doi: 10.1016/0163-7258(92)90055-5
Geerts W. J., Verburg M., Jonker A., Das A. T., Boon L., Charles R., et al. (1996). Gender-dependent regulation of glutamate dehydrogenase expression in periportal and pericentral zones of rat liver lobules. J. Histochem Cytochem. 44 (10), 1153–1159. doi: 10.1177/44.10.8813080
Gunter S. A., Beck P. A., Phillips J. K. (2003). Effects of supplementary selenium source on the performance and blood measurements in beef cows and their calves. J. Anim. Sci. 81 (4), 856–864. doi: 10.2527/2003.814856x
Häussinger D. (1990a). Nitrogen metabolism in liver: structural and functional organization and physiological relevance. Biochem. J. 267 (2), 281–290. doi: 10.1042/bj2670281
Häussinger D. (1990b). Liver glutamine metabolism. JPEN J. Parenter Enteral Nutr. 14 (4 Suppl), 56S–62S. doi: 10.1177/014860719001400405
Häussinger D., Lames W. H., Moorman A. F. M. (1992). Hepatocyte heterogeneity in the metabolism of amino acids and ammonia. Enzyme 46 (1-3), 72–93.
Heitzman R., Herriman I., Mallinson C. (1972). Some effects of glucocorticoids on the subcellular distribution of the activities of citrate synthase and phosphoenolpyruvate carboxykinase in livers of rats and cows. FEBS letters. 20 (1), 19–21. doi: 10.1016/0014-5793(72)80006-1
Howell J. A., Matthews A. D., Swanson K. C., Harmon D. L., Matthews J. C. (2001). Molecular identification of high-affinity glutamate transporters in sheep and cattle forestomach, intestine, liver, kidney, and pancreas. J. Anim. Sci. 79 (5), 1329–1336. doi: 10.2527/2001.7951329x
Huang J., Jia Y., Li Q., Burris W. R., Bridges P. J., Matthews J. C. (2018). Hepatic glutamate transport and glutamine synthesis capacities are decreased in finished vs. growing beef steers, concomitant with increased GTRAP3-18 content. Amino Acids 50 (5), 513–525. doi: 10.1007/s00726-018-2540-8
Huntington G., Archibeque S. (2000). Practical aspects of urea and ammonia metabolism in ruminants. J. Anim. Sci. 77 (E-Suppl), 1–11. doi: 10.2527/jas2000.77E-Suppl1y
Irizarry R. A., Hobbs B., Collin F., Beazer-Barclay Y. D., Antonellis K. J., Scherf U., et al. (2003). Exploration, normalization, and summaries of high density oligonucleotide array probe level data. Biostatistics 4 (2), 249–264. doi: 10.1093/biostatistics/4.2.249
Jackson J. J., Lindemann M. D., Boling J. A., Matthews J. C. (2015). Summer-long grazing of high vs. low endophyte (Neotyphodium coenophialum)-infected tall fescue by growing beef steers results in distinct temporal blood analyte response patterns, with poor correlation to serum prolactin levels. Front. Vet. Sci. 2, 77. doi: 10.3389/fvets.2015.0007
Jenkinson C. P., Grody W. W., Cederbaum S. D. (1996). Comparative properties of arginases. Comp. Biochem. Physiol. B Biochem. Mol. Biol. 114 (1), 107–132. doi: 10.1016/0305-0491(95)02138-8
Jia Y., Li Q., Burris W. R., Aiken G. E., Bridges P. J., Matthews J. C. (2018). Forms of selenium in vitamin-mineral mixes differentially affect serum prolactin concentration and hepatic glutamine synthetase activity of steers grazing endophyte-infected tall fescue. J. Anim. Sci. 96 (2), 715–727. doi: 10.1093/jas/skx068
Jia Y., Son K., Burris W. R., Bridges P. J., Matthews J. C. (2019). Forms of selenium in vitamin-mineral mixes differentially affect serum alkaline phosphatase activity, and serum albumin and blood urea nitrogen concentrations, of steers grazing endophyte-infected tall fescue. J. Anim. Sci. 97 (6), 2569–2582. doi: 10.1093/jas/skz109
Jungermann K., Sasse D. (1978). Heterogeneity of liver parenchymal cells. Trends Biochem. Sci. 3 (3), 198–202. doi: 10.1016/S0968-0004(78)91764-4
Kilberg M. S. (1989). Measurement of amino acid transport by hepatocytes in suspension or monolayer culture. Methods Enzymol. 173, 564–575. doi: 10.1016/S0076-6879(89)73039-1
Kondou H., Kawai M., Tachikawa K., Kimoto A., Yamagata M., Koinuma T., et al. (2013). Sodium-coupled neutral amino acid transporter 4 functions as a regulator of protein synthesis during liver development. Hepatol. Res. 43 (11), 1211–1223. doi: 10.1111/hepr.12069
Kuo F. C., Hwu W. L., Valle D., Darnell J. E. Jr. (1991). Colocalization in pericentral hepatocytes in adult mice and similarity in developmental expression pattern of ornithine aminotransferase and glutamine synthetase mRNA. Proc. Natl. Acad. Sci. U. S. A. 88 (21), 9468–9472. doi: 10.1073/pnas.88.21.9468
Labunskyy V. M., Hatfield D. L., Gladyshev V. N. (2014). Selenoproteins: molecular pathways and physiological roles. Physiol. Rev. 94 (3), 739–777. doi: 10.1152/physrev.00039.2013
Li Q., Chen K. C., Bridges P. J., Matthews J. C. (2022). Pituitary and liver selenoprotein transcriptome profiles of grazing steers and their sensitivity to the form of selenium in vitamin-mineral mixes. Front. Anim. Sci. 91. doi: 10.3389/fanim.2022.911094
Li Q., Hegge R., Bridges P. J., Matthews J. C. (2017). Pituitary genomic expression profiles of steers are altered by grazing of high vs. low endophyte-infected tall fescue forages. PloS One 12 (9), e0184612. doi: 10.1371/journal.pone.0184612
Li Q., Jia Y., Burris W. R., Bridges P. J., Matthews J. C. (2019). Forms of selenium in vitamin-mineral mixes differentially affect the expression of genes responsible for prolactin, ACTH, and alpha-MSH synthesis and mitochondrial dysfunction in pituitaries of steers grazing endophyte-infected tall fescue. J. Anim. Sci. 97 (2), 631–643. doi: 10.1093/jas/sky438
Liao S. F., Boling J. A., Matthews J. C. (2015). Gene expression profiling indicates an increased capacity for proline, serine, and ATP synthesis and mitochondrial mass by the liver of steers grazing high vs. low endophyte-infected tall fescue. J. Anim. Sci. 93 (12), 5659–5671. doi: 10.2527/jas.2015-9193
Liao S. F., Brown K. R., Stromberg A. J., Burris W. R., Boling J. A., Matthews J. C. (2011). Dietary supplementation of selenium in inorganic and organic forms differentially and commonly alters blood and liver selenium concentrations and liver gene expression profiles of growing beef heifers. Biol. Trace Elem Res. 140 (2), 151–169. doi: 10.1007/s12011-010-8685-2
Livak K. J., Schmittgen T. D. (2001). Analysis of relative gene expression data using real-time quantitative PCR and the 2(-delta delta C(T)) method. Methods 25 (4), 402–408.
Maly I. P., Sasse D. (1991). Microquantitative analysis of the intra-acinar profiles of glutamate dehydrogenase in rat liver. J. Histochem Cytochem. 39 (8), 1121–1124. doi: 10.1177/39.8.1856459
Matthews J. C. (2005). Expression of non-organelle glutamate transporters to support peripheral tissue function. Glutamate Receptors Peripheral Tissue: Excitatory Transm. Outside CNS: Springer; p, 47–75.
Matthews J. C., Bridges P. J. (2014). NutriPhysioGenomics applications to identify adaptations of cattle to consumption of ergot alkaloids and inorganic versus organic forms of selenium: altered nutritional, physiological and health states? Anim. Prod Sci. 54 (10), 1594–1604. doi: 10.1071/AN14274
Matthews J. C., Zhang Z., Patterson J. D., Bridges P. J., Stromberg A. J., Boling J. A. (2014). Hepatic transcriptome profiles differ among maturing beef heifers supplemented with inorganic, organic, or mixed (50% inorganic:50% organic) forms of dietary selenium. Biol. Trace Elem Res. 160 (3), 321–339. doi: 10.1007/s12011-014-0050-4
McGivan J., Bradford N., Verhoeven A., Meijer A. (1984). Liver glutaminase. Glutamine Metab. Mamm. tissues: Springer;, 122–137. doi: 10.1007/978-3-642-69754-8_8
Meijer A. J., Lamers W. H., Chamuleau R. A. (1990). Nitrogen metabolism and ornithine cycle function. Physiol. Rev. 70 (3), 701–748. doi: 10.1152/physrev.1990.70.3.701
Miles E. D., McBride B. W., Jia Y., Liao S. F., Boling J. A., Bridges P. J., et al. (2015). Glutamine synthetase and alanine transaminase expression are decreased in livers of aged vs. young beef cows and GS can be upregulated by 17beta-estradiol implants. J. Anim. Sci. 93 (9), 4500–4509. doi: 10.2527/jas.2015-9294
Moorman A. F. M., de Boer P. A. J., Watford M., Dingemanse M. A., Lamers W. H. (1994). Hepatic glutaminase mRNA is confined to part of the urea cycle domain in the adult rodent liver lobule. FEBS Letters. 356 (1), 76–80. doi: 10.1016/0014-5793(94)01230-X
Morris S. M. Jr. (2002). Regulation of enzymes of the urea cycle and arginine metabolism. Annu. Rev. Nutr. 22 (1), 87–105. doi: 10.1146/annurev.nutr.22.110801.140547
Morris S. M. Jr., Moncman C. L., Rand K. D., Dizikes G. J., Cederbaum S. D., O’Brien W. E. (1987). Regulation of mRNA levels for five urea cycle enzymes in rat liver by diet, cyclic AMP, and glucocorticoids. Arch. Biochem. Biophys. 256 (1), 343–353. doi: 10.1016/0003-9861(87)90455-3
Nebes V. L., Morris S. M. Jr. (1988). Regulation of messenger ribonucleic acid levels for five urea cycle enzymes in cultured rat hepatocytes. requirements for cyclic adenosine monophosphate, glucocorticoids, and ongoing protein synthesis. Mol. Endocrinol. 2 (5), 444–451. doi: 10.1210/mend-2-5-444
Nicholson J. W. G., McQueen R. E., Bush R. S. (1991). Response of growing cattle to supplementation with organically bound or inorganic sources of selenium or yeast cultures. Can. J. Anim. Sci. 71 (3), 803–811. doi: 10.4141/cjas91-095
Nissim I., Brosnan M. E., Yudkoff M., Nissim I., Brosnan J. T. (1999). Studies of hepatic glutamine metabolism in the perfused rat liver with 15N-labeled glutamine. J. Biol. Chem. 274 (41), 28958–28965. doi: 10.1074/jbc.274.41.28958
Palmieri F. (2013). The mitochondrial transporter family SLC25: identification, properties and physiopathology. Mol. Aspects Med. 34 (2-3), 465–484. doi: 10.1016/j.mam.2012.05.005
Partek D. (2009). Partek documentation: turning data into discovery (St Louis: Partek Incorporated).
Phang J. M., Liu W., Zabirnyk O. (2010). Proline metabolism and microenvironmental stress. Annu. Rev. Nutr. 30, 441–463. doi: 10.1146/annurev.nutr.012809.104638
Reynolds C. K. (1992). Metabolism of nitrogenous compounds by ruminant liver. J. Nutr. 122 (3 Suppl), 850–854. doi: 10.1093/jn/122.suppl_3.850
Schioth H. B., Roshanbin S., Hagglund M. G., Fredriksson R. (2013). Evolutionary origin of amino acid transporter families SLC32, SLC36 and SLC38 and physiological, pathological and therapeutic aspects. Mol. Aspects Med. 34 (2-3), 571–585. doi: 10.1016/j.mam.2012.07.012
Settivari R. S., Bhusari S., Evans T., Eichen P. A., Hearne L. B., Antoniou E., et al. (2006). Genomic analysis of the impact of fescue toxicosis on hepatic function. J. Anim. Sci. 84 (5), 1279–1294. doi: 10.2527/2006.8451279x
Strickland J. R., Aiken G. E., Spiers D. E., Fletcher L. R., Oliver J. W. (2009). Physiological basis of fescue toxicosis. Tall fescue twenty-first century 4, 203–227. doi: 10.2134/agronmonogr53.c12
Strickland J. R., Looper M. L., Matthews J. C., Rosenkrans C. F. Jr., Flythe M. D., Brown K. R. (2011). Board-invited review: st. anthony’s fire in livestock: causes, mechanisms, and potential solutions. J. Anim. Sci. 89 (5), 1603–1626. doi: 10.2527/jas.2010-3478
Takiguchi M., Mori M. (1995). Transcriptional regulation of genes for ornithine cycle enzymes. Biochem. J. 312 (Pt 3), 649–659. doi: 10.1042/bj3120649
Tanaree D., Duringer J., Bohnert D., Craig A. (2013). Microarray evaluation of bovine hepatic gene response to fescue toxicosis. World Mycotoxin J. 6 (4), 419–426. doi: 10.3920/WMJ2012.1482
Tashima Y., Terui M., Itoh H., Mizunuma H., Kobayashi R., Marumo F. (1989). Effect of selenite on glucocorticoid receptor. J. Biochem. 105 (3), 358–361. doi: 10.1093/oxfordjournals.jbchem.a122668
Vandesompele J., De Preter K., Pattyn F., Poppe B., Van Roy N., De Paepe A., et al. (2002). Accurate normalization of real-time quantitative RT-PCR data by geometric averaging of multiple internal control genes. Genome Biol. 3 (7), 34–46. doi: 10.1186/gb-2002-3-7-research0034
Webb K. L., Trotta R. J., Jia Y., Bridges P. J., Matthews J. C. (2022). Influence of form of Se supplementation and tall fescue endophyte toxicity on growth performance, serum metabolites, and tissue masses of grazing beef steers. Trans. Anim. Sci. 6 (4), 1–10. doi: 10.1093/tas/txac122
Weiner I. D., Miller R. T., Verlander J. W. (2003). Localization of the ammonium transporters, Rh b glycoprotein and Rh c glycoprotein, in the mouse liver. Gastroenterology 124 (5), 1432–1440. doi: 10.1016/S0016-5085(03)00277-4
Wu Z., Irizarry R. A., Gentleman R., Martinez-Murillo F., Spencer F. (2004). A model-based background adjustment for oligonucleotide expression arrays. J. Am. Stat. Assoc. 99 (468), 909–917. doi: 10.1198/016214504000000683
Keywords: ammonia, glutamine, growing cattle, proline, selenium supplementation, ureagenesis
Citation: Jia Y, Son K and Matthews JC (2023) Gene expression profiling indicates a shift in ammonia assimilation capacity along the hepatic acinus induced by different forms of selenium in vitamin–mineral mixes fed to beef steers grazing on toxic endophyte-infected tall fescue. Front. Anim. Sci. 4:1165321. doi: 10.3389/fanim.2023.1165321
Received: 14 February 2023; Accepted: 05 June 2023;
Published: 10 July 2023.
Edited by:
Susan Kay Duckett, Clemson University, United StatesReviewed by:
Jon Schoonmaker, Purdue University, United StatesCopyright © 2023 Jia, Son and Matthews. This is an open-access article distributed under the terms of the Creative Commons Attribution License (CC BY). The use, distribution or reproduction in other forums is permitted, provided the original author(s) and the copyright owner(s) are credited and that the original publication in this journal is cited, in accordance with accepted academic practice. No use, distribution or reproduction is permitted which does not comply with these terms.
*Correspondence: James C. Matthews, amFtZXMubWF0dGhld3NAdWt5LmVkdQ==
Disclaimer: All claims expressed in this article are solely those of the authors and do not necessarily represent those of their affiliated organizations, or those of the publisher, the editors and the reviewers. Any product that may be evaluated in this article or claim that may be made by its manufacturer is not guaranteed or endorsed by the publisher.
Research integrity at Frontiers
Learn more about the work of our research integrity team to safeguard the quality of each article we publish.