 Beth Anna Scott
 Mekonnen Haile-Mariam
 Iona M. MacLeod
 Ruidong Xiang
 Jennie E. Pryce
94% of researchers rate our articles as excellent or good
Learn more about the work of our research integrity team to safeguard the quality of each article we publish.
Find out more
ORIGINAL RESEARCH article
Front. Anim. Sci., 17 April 2023
Sec. Animal Breeding and Genetics
Volume 4 - 2023 | https://doi.org/10.3389/fanim.2023.1142673
This article is part of the Research TopicGenetic Factors affecting the Nutritional and Processing Quality of MilkView all 5 articles
Selection decisions are generally based on estimated breeding values (EBV) for a combination of traits that are polygenic (e.g. milk production). However, in some cases, there is additional intense selection for a single allele, or SNP, for a perceived benefit, such as selection for polled or A2 milk. Using a dataset where the A2 mutation was imputed using a reference population with whole genome sequence, we tested the hypothesis that intense selection in Australian Holstein cattle for the A2 allele in the β-casein gene may have resulted in increased inbreeding. We also estimated the average difference in performance between animals homozygous for the A1 or A2 allele for a range of traits. Using high-density genotypes we compared differences in genome-wide and regional inbreeding between Holstein cows homozygous for either the A1 or A2 β-casein alleles i.e. A1/A1 or A2/A2. This study shows that between the years 2000 to 2017, the frequency of the A2/A2 genotype increased by 20% in Holstein cows (from 32% to 52%). Our results suggest that selection for homozygosity at the β-casein A2 allele has increased inbreeding both across the genome and on chromosome 6 in A2/A2 Holstein cows. Animals that were A2/A2 were twice as likely to have a run of homozygosity of at least 1Mb long across the β-casein locus compared to animals that were A1/A1. Cows that are homozygous for the A2 allele had an average protein yield EBV advantage of 0.24 genetic standard deviations (SD) compared to A1/A1 homozygous cows. In contrast, A2/A2 homozygous animals were on average 0.2 genetic SD inferior on fertility EBV. As a result, the difference in the overall economic index (that includes traits contributing to profitability) there was only a small advantage of 0.05 SD for A2/A2 cows compared to A1/A1 cows. However, strong selection for the A2 allele has likely led to a higher level of regional and overall inbreeding which in the long term could harm genetic progress for some or all economic traits. Therefore, applying approaches that mitigate rapid inbreeding while selecting for preferred alleles and quantitative traits may be desirable.
In recent years breeding goals have become broader (Miglior et al., 2005; Cole and VanRaden, 2018). Specific traits considered for selection have evolved in response to changes in the needs of producers, consumers, and society (Boichard and Brochard, 2012) with the aid of advances in technology and the ability to record many traits (Fuerst-Waltl et al., 2016). At the same time, methods to account for farmer opinions in index weights (Martin-Collado et al., 2015; Fuerst-Waltl et al., 2016) and consumer perceptions have been developed (Neilson and Wichmann, 2014). Irrespective of these measures to broaden the breeding objectives, the introduction of genomic selection has resulted in increases in the rate of inbreeding per year in several countries (Doekes et al., 2018; Doublet et al., 2019; CDCB, 2020; Scott et al., 2021).
In general, selection decisions are made on polygenic traits using estimated breeding values (EBVs) that are computed using statistical methods that sum allele effects of genome-wide markers. The EBV for individual traits can also be combined in an economically weighted index to enable a balanced approach to select for multiple traits simultaneously. In some cases, there can be independent intense selection for a single allele or SNP that has a very large effect on a key trait, such as polled phenotype for animal welfare and “A2” milk for perceived human health benefits. Animal welfare concerns or other economic benefits are likely to continue to play an important role in decision-making of breeding programs. For example, there are welfare concerns regarding the disbudding or dehorning of calves, which has resulted in global and national animal health organizations recommending breeding for polled cattle whenever possible (AHA, 2014; AVMA, 2014; OIE, 2022). Selecting alleles that are thought to be beneficial to human health are also likely to remain of great interest to the dairy industry (Liu et al., 2019; Knutsen et al., 2022).
An example, in Australia and some other countries1, selection for the A2 beta (β) casein allele has increased rapidly possibly due to attractive milk contracts arising from the commercialization of milk products by the a2 Corporation. The β-casein gene falls within a casein gene cluster on BTA 6 that spans ~250kb (Boettcher et al., 2004). The alleles present at the β-casein locus (referred to as A1 and A2) of genotyped sires are often published in promotional material alongside the EBVs and selection index values and are therefore available to farmers when making selection decisions. Additionally, genotyping of females for the β-casein locus can be pursued by farmers who wish to build an A2 homozygous herd for commercial sales of A2 milk.
However, this could lead to an increased risk of inbreeding due to intense selection for homozygosity at a given locus. This is especially the case for polled, where the polled locus is comparatively rare in dairy breeds: 0.71% in US Holsteins and <1% in Jerseys (Null et al., 2015). However, even when the allele is more common, as with A2, there could also be a risk of increased inbreeding because of the desire to quickly build an entire herd of homozygous A2 cows to fulfill milk sales contracts. It is well known that inbreeding can result in a loss of genetic diversity, decreased response to selection, reduced animal performance, and ultimately, decreased farm profitability (Leroy, 2014). While traditional methods that use pedigree to calculate inbreeding often underestimate the level of inbreeding due to incomplete pedigree and pedigree errors, genomic data can be used to calculate inbreeding coefficients more accurately and can distinguish between recent and ancient inbreeding using runs of homozygosity (MacLeod et al., 2007; Keller et al., 2011). In assessing the accuracy of different methods of calculating inbreeding, runs of homozygosity (ROHs) are more accurate than other methods of genomic inbreeding for recent inbreeding and have high correlations with traditional measures of inbreeding (Forutan et al., 2018).
We hypothesized that intense selection for a specific allele would result in greater inbreeding levels across both the whole genome and regionally compared to selection only for improved polygenic traits and not for a specific allele. In this study, we determined the change in frequency of the β-casein alleles across 18 years (2000-2017) in genotyped Australian Holstein bulls and cows. In cows, we compared differences in genome-wide and regional inbreeding between the two homozygotes of the β-casein alleles (A1 and A2) using high-density genotypes. We also compared differences in EBVs in A2 and A1 animals based on important dairy traits.
A total of 139,898 genotyped individuals were available for Holsteins, Jerseys, and their crosses from DataGene (https://datagene.com.au). The genotyping was carried out by various commercial providers using a range of SNP array densities (~7K to 50K SNP).
As described by Scott et al. (2021), DataGene imputed the genotypes to a standard set of 45,685 (“50k”) SNP genotypes for routine national dairy cattle genomic evaluations. These 50k genotypes were imputed to the high-density Bovine SNP array (HD: BovineHD BeadChip, Illumina Inc) using a reference set of 2,700 animals with 716,217 real HD genotypes. These 2,700 animals included Holstein, Jersey, and Australian Red breeds. Before imputation, the SNP positions were converted from reference genome UMD3.1 to the ARS-UCD1.2 reference genome positions (Rosen et al., 2020) and imputed using Fimpute3 (Sargolzaei et al., 2014). We have previously tested the empirical accuracy of imputation from an overlapping low-density genotype set of 7K SNP to 50K and then HD genotypes using the same approach as described here. The accuracy of imputation for the autosomal chromosomes was found to be 0.96 measured as the correlation between real and imputed genotypes (Nguyen et al., 2021).
The A1/A2 SNP was not imputed as part of the HD genotype set; therefore the HD genotypes were subsequently imputed to whole genome sequence (WGS) to recover genotypes for this SNP at the β-casein locus. The 1000 Bull Genomes Project Run 7 was used as a WGS reference population. The process of imputation to sequence genotypes has been described by Xiang et al. (2021). Briefly, the HD genotypes were converted from top format to forward sequence format, then phased using Eagle V2 (Loh et al., 2016). The Run 7 imputation reference of 3090 animals was also phased using Eagle V2. Then the phased HD genotypes were imputed to whole-genome sequence (WGS) using Minimac3 (Howie et al., 2012). We cross-checked the imputation accuracy of genotypes at the imputed A1/A2 SNP on a set of 443 bulls with published real genotypes for the β-casein locus and found 98.4% concordance with their imputed genotypes. The final set of HD genotypes used in the analysis with the added β-casein locus genotype contained 716,218 SNP.
We extracted only Holstein animals and cross-checked the on-farm pedigree recorded breed assignment of genotyped cows using the ADMIXTURE program (Alexander et al., 2009) using the 50k SNP genotypes as described in Scott et al. (2021). Briefly, two ancestral breed populations were defined (k = 2) and the likelihood that a given proportion of all markers came from either population, based on a postulated allele frequency for each marker in both populations was calculated. Individuals whose likelihood of their markers being from a given breed exceeded 0.8 were considered to belong to the selected breed population. After validating the breed assignment using ADMIXTURE program (Alexander et al., 2009), 114,567 Holsteins remained for subsequent analysis. To ensure enough records within each year, only 80,816 cows born between 2000 and 2017 were considered. Before 2000, there was very selective female genotyping whilst after 2017 there was only 30% of the genotypes were available compared to the previous year. Data of bulls were analyzed separately to gain a greater understanding of the impact of selecting for A2 in the female population. Therefore, we only included genotyped bulls that were registered for artificial breeding in Australia over the same period, resulting in 4,460 bulls used in the subsequent analysis. Figure 1 shows the number of animals by birth year for each of the β-casein loci.
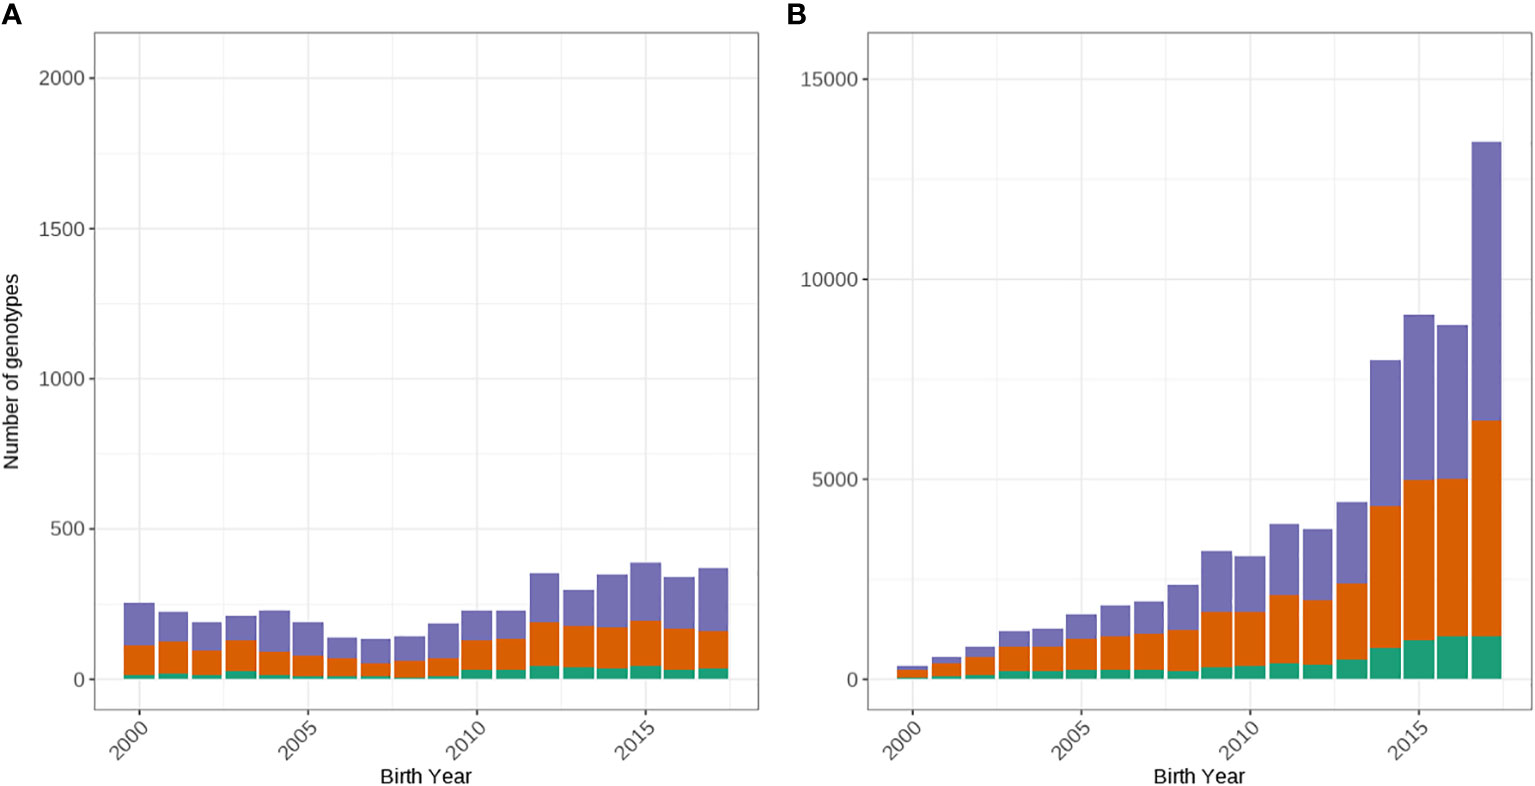
Figure 1 Distribution of genotypes by year of birth from 2000 to 2017 for the A1/A1 (green), A1/A2 (orange) and A2/A2 (purple) β-Casein loci for males (A) and females (B).
EBVs for different traits were obtained from the official April 2020 genetic evaluation conducted by DataGene Limited (Bundoora, Australia; the organization that undertakes routine national dairy cattle evaluations in Australia). The EBVs were available for 93.6% of genotyped cows and 98.7% of genotyped bulls and included milk (L), protein (kg), and fat (kg) yields, fertility (% of daughters pregnant by 6 weeks after the mating start compared to the mean), somatic cell count (SCC; cells/mL converted to have an average of 100% with above average being desirable, representing lower SCC)), and the national index (Balanced Performance index; BPI). In cows, this reduced number of animals with EBVs could be due to a range of factors such as they didn’t meet the minimum EBV reliability, a lack of known or genotyped sire, or genotyped as a calf and didn’t make it to the milking herd. Details of the BPI and a summary of the trait units of EBVs are described in (Byrne et al., 2016). The mean of the EBVs included in the analysis are shown in Table 1. For production trait EBVs the base population mean is zero, whilst for functional traits (fertility, SCC), the mean is 100, where selecting animals with a higher breeding value (e.g., above 100) is considered beneficial. The BPI index is an aggregate of EBVs contributing to profit multiplied by their respective index weights. In Australia, the indices are developed using a combination of bioeconomic principles and farmer preferences (Byrne et al., 2016).
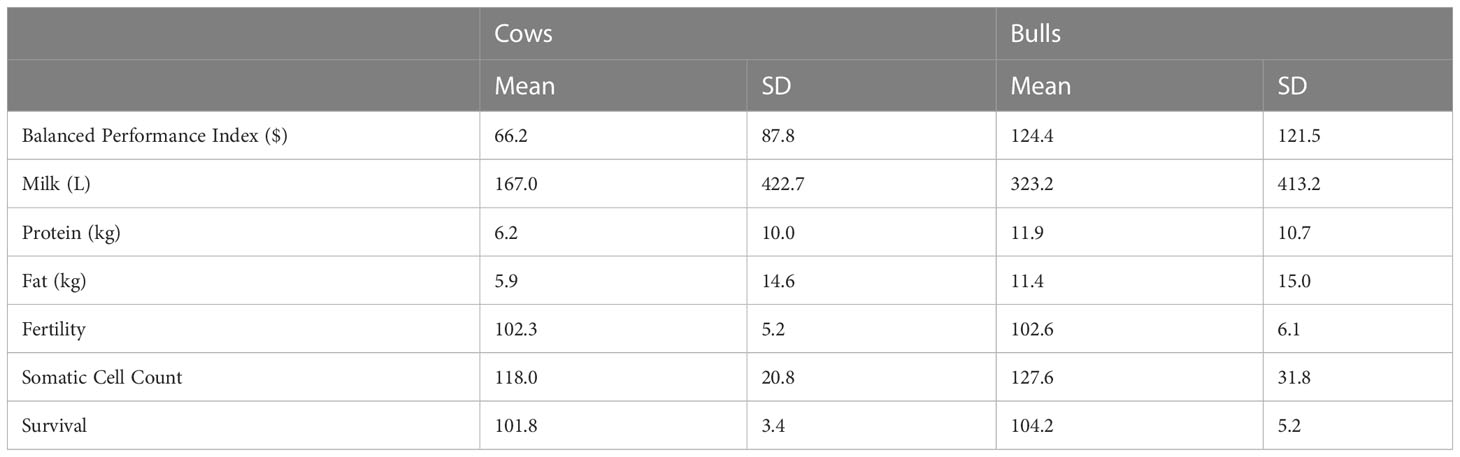
Table 1 Estimated breeding value means and standard deviations (SD) for the national selection index (Balanced Performance Index), production (milk, protein, and fat yields) and health traits (fertility, somatic cell count (SCC) and Survival) in cows (N=61,634) and bulls (N=4,460).
A fixed-effects model was fitted, similar to that of Cole and Null (2019), to test for differences in the breeding values of A1 versus A2 homozygous animals for all traits using ASReml 4.1 (Gilmour et al., 2016). The fixed effect of sire was fitted into the model to correct for the differences in genetic merit and to some extent the year of birth.
where yijk is the breeding value for each of the six traits evaluated for cow or bull i, μ is the overall mean, sirej is the fixed effect of the animal’s sire, statusk is the fixed effect of the β-casein locus (coded as 0, 1, or 2 copies of the A2 β-casein locus), and eijk is the random residual error term.
The HD genotypes were used to locate runs of homozygosity (ROH) across all autosomes in each individual using the Plink v1.9 software (Purcell et al., 2007). The parameter settings used in Plink were as follows: a scanning window was defined as 500 adjacent SNPs with at most 3 heterozygous SNP (to account for potential imputation errors). A segment was considered an ROH if it included at least 500 SNPs and was at least 1000 kb long, with at least one SNP per 5 kb. If two consecutive SNPs were more than 35 kb apart this was considered too large a gap and this region was then discounted from the ROH assessment. (command line: plink –cow –bfile genotyping_data_filename –homozyg –homozyg-kb 1000 –homozyg-snp 500 –homozyg-window-snp 500 –homozyg-density 5 –homozyg-window-het 3 –homozyg-gap 35 –out output_filename). Plink calculates the proportion of the genome that could be considered for detecting the presence of ROH given the HD SNP positions (that is, discounting gaps between SNPs of > 35 kb).
The ROH-based inbreeding, FROH,i, was calculated for each individual as the proportion of the genome that was within ROH as follows:
,
where , the total length (kb) of ROH for individual i, and Lauto is the length of the autosomal genome covered by SNPs after discounting gaps between two SNPs of more than 35 kb, corresponding to the length of the autosomal genome on which ROH can be detected. This parameter allowed for the detection of ROH on 89.2% of the autosomal genome where the final autosomal length was 2,216,390,000 bp.
For each individual, we also calculated the mean ROH length, which is defined as:
,
where the total length of ROH for individual i in kb, and the total number of ROH for individual i.
Genomic inbreeding (ROH) was calculated as above, but specifically on chromosome 6 for Holstein cows that were homozygous for either the A2 or A1 alleles. The total length of the genome on chromosome 6 was 111,484,000 bp which allowed for the detection of ROH on 94.5% of the chromosome.
We then checked for animals that had a local ROH over the A1/A2 SNP position on chromosome 6 (Chr6:87,181,619). We used a Wilcoxon Mann-Whitney test, a nonparametric rank-sum test for two independent samples, to determine if there were significant differences in FROH between the two homozygote groups (A1/A1 versus A2/A2). This was first performed on all animals (born between 2000-2017) as well as between the same groups and then on the younger animals (born after 2012). Younger animals were also evaluated separately as genomic selection has been shown to have an impact on both genetic gain and inbreeding (Scott et al., 2021). A Chi-squared test was used to determine if there was a difference between the observed versus expected number of cows with ROH over the A2 position. A total of 6,503 cows were homozygous for the A1/A1 (663) or A2/A2 (5,840) genotype and had both a known ROH over the β-casein locus and an inbreeding coefficient.
There was more than four times the number of A2/A2 cows (31,815) compared to A1/A1 (7,336) in the dataset. There were 30,602 A1/A2 cows. Figure 2 shows how the frequency of the β-casein allele genotypes has changed over time in genotyped Holstein males and females since the year 2000. In bulls, the genotype frequencies have fluctuated whilst, in females, the A2/A2 frequency has increased from 32% in 2000 to 52% in 2017 at the same time the A1/A1 and A1/A2 frequencies have declined.
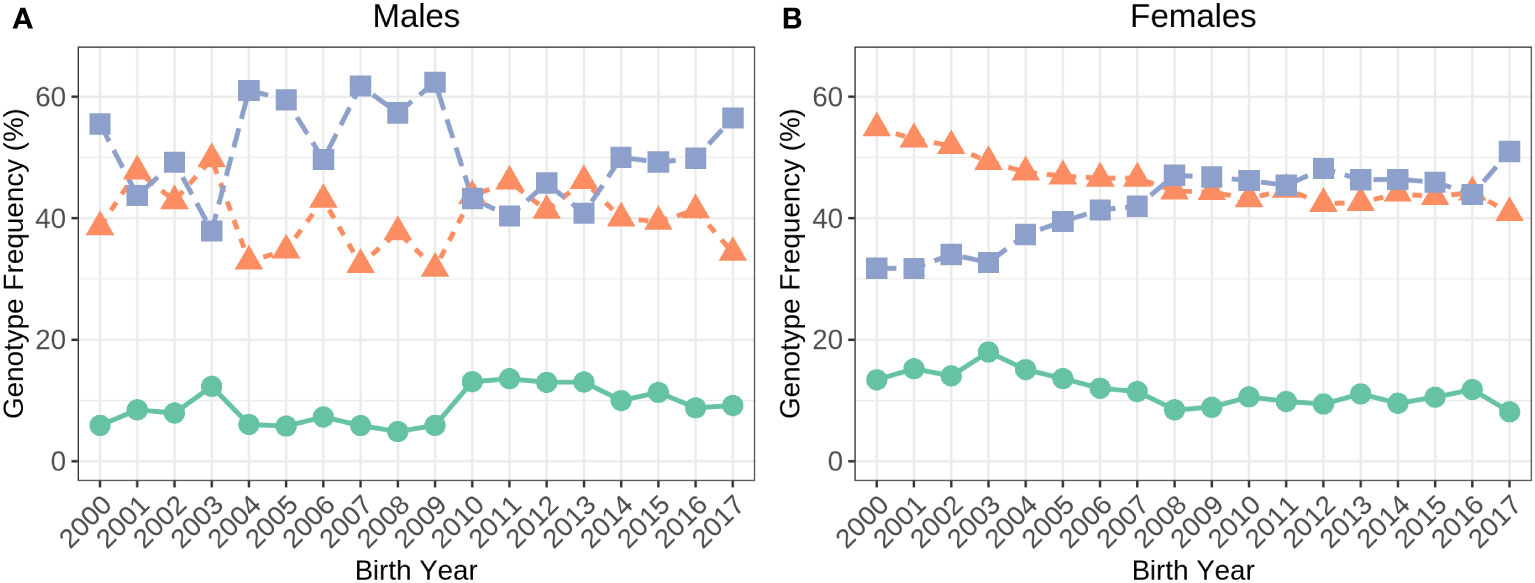
Figure 2 Frequency of the A1/A1 (green), A1/A2 (orange) and A2/A2 (purple) genotypes in Holstein males (A; N=4,460) and females (B; N=69,753) born in 2000 to 2017.
We observed significant differences in breeding values between β-casein genotypes. Animals that carried one or two copies of the A2 allele had superior EBVs for production traits and inferior for EBVs for health and fertility traits; the largest advantage was A2/A2 cows had on average a 2.4 kg protein advantage (0.24 genetic standard deviations, SDs) compared to A1/A1 (Table 2), while they were 0.2 genetic SDs inferior for fertility EBVs. We observed that A1/A2 cows fell in between the A1/A1 and A2/A2 homozygotes. Interestingly, there was only a small advantage of A2/A2 for the BPI (4.5 units; 0.05 genetic SDs), which is likely because the economic advantage of A2/A2 in production was almost entirely canceled by the disadvantage in health and fertility EBVs.
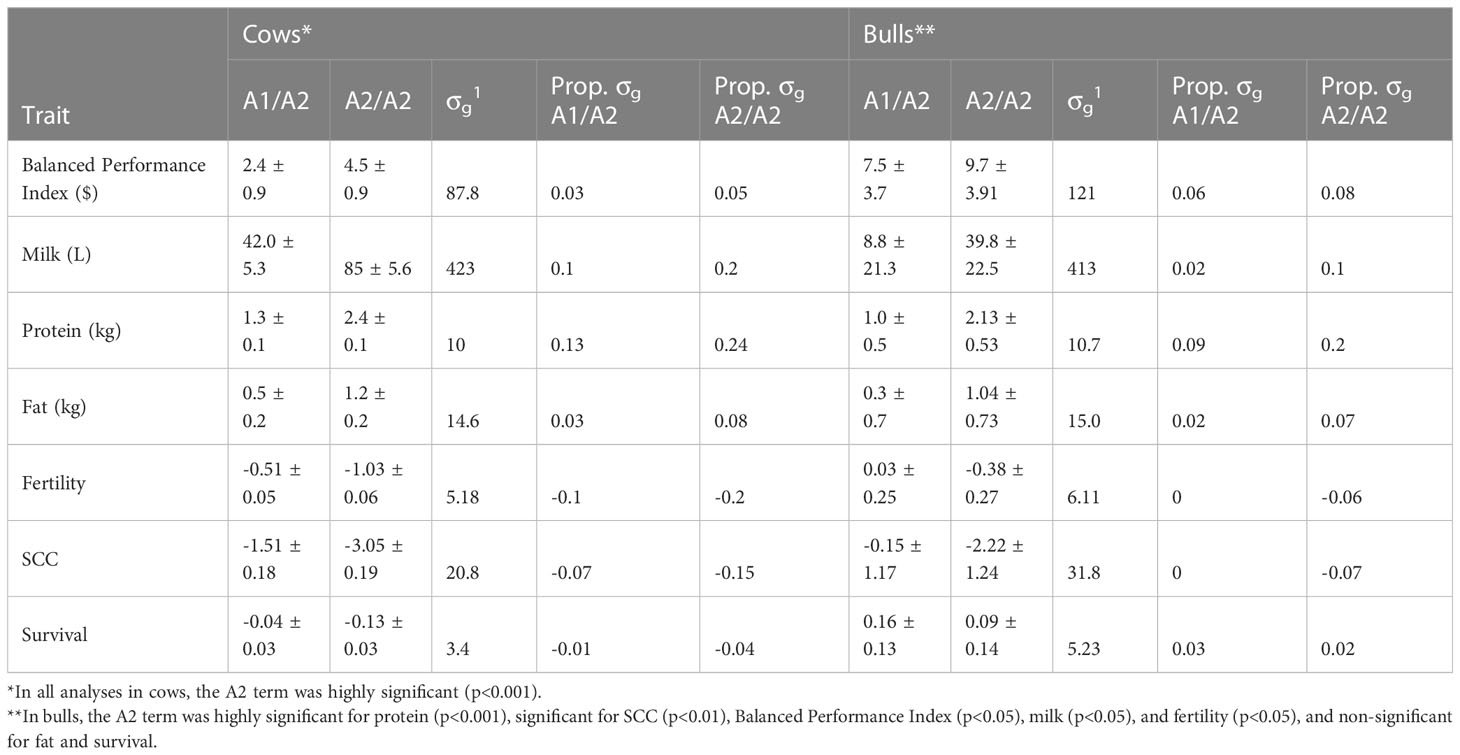
Table 2 Mean differences in estimated breeding values of bulls and cows that are A1A2 and A2A2 at the β-casein locus as a deviation from A1/A1 in EBV units and as a proportion of genetic standard deviations (σg) for the national selection index (Balanced Performance Index), production (milk, protein, and fat yields), fertility and health traits (somatic cell count (SCC) and Survival).
The median genome-wide FROH was consistently higher in A2/A2 than in A1/A1 cows (Table 3). More recently, the difference between genome-wide inbreeding coefficients between A1/A1 and A2/A2 cows has reduced (Figure 3A). We observed significant differences in median FROH which was greater when all animals were included (difference of 0.44) than only young animals (animals born after 2012; difference 0.19).
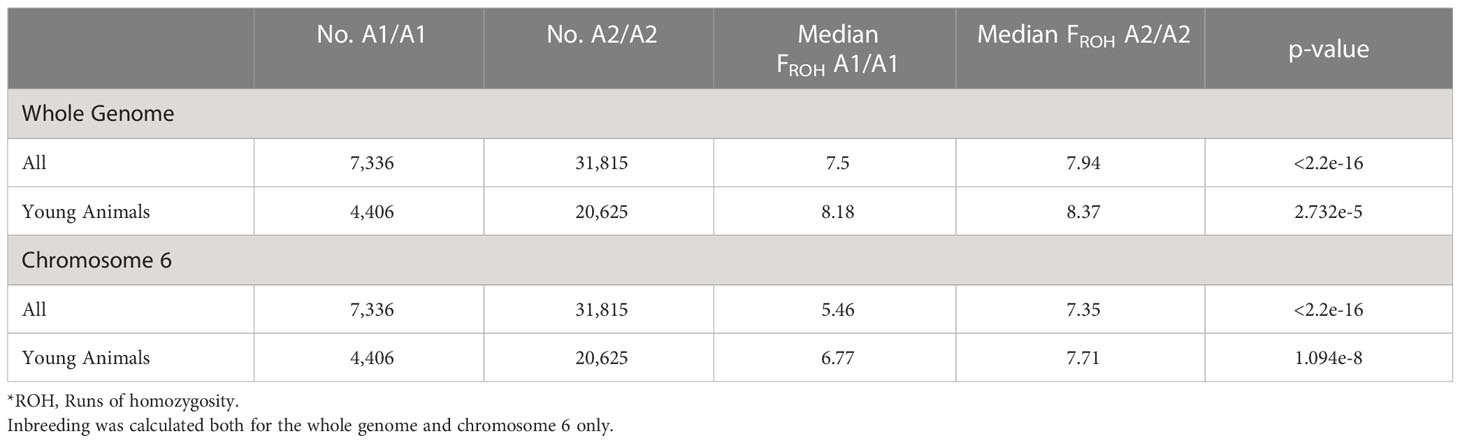
Table 3 The median genomic inbreeding values (FROH*) for all cows (born in 2000-2017) or young animals (born in 2013-2017) homozygous for the β-casein A1 or A2 allele and the Wilcoxon-Mann Whitney significance test p-values.
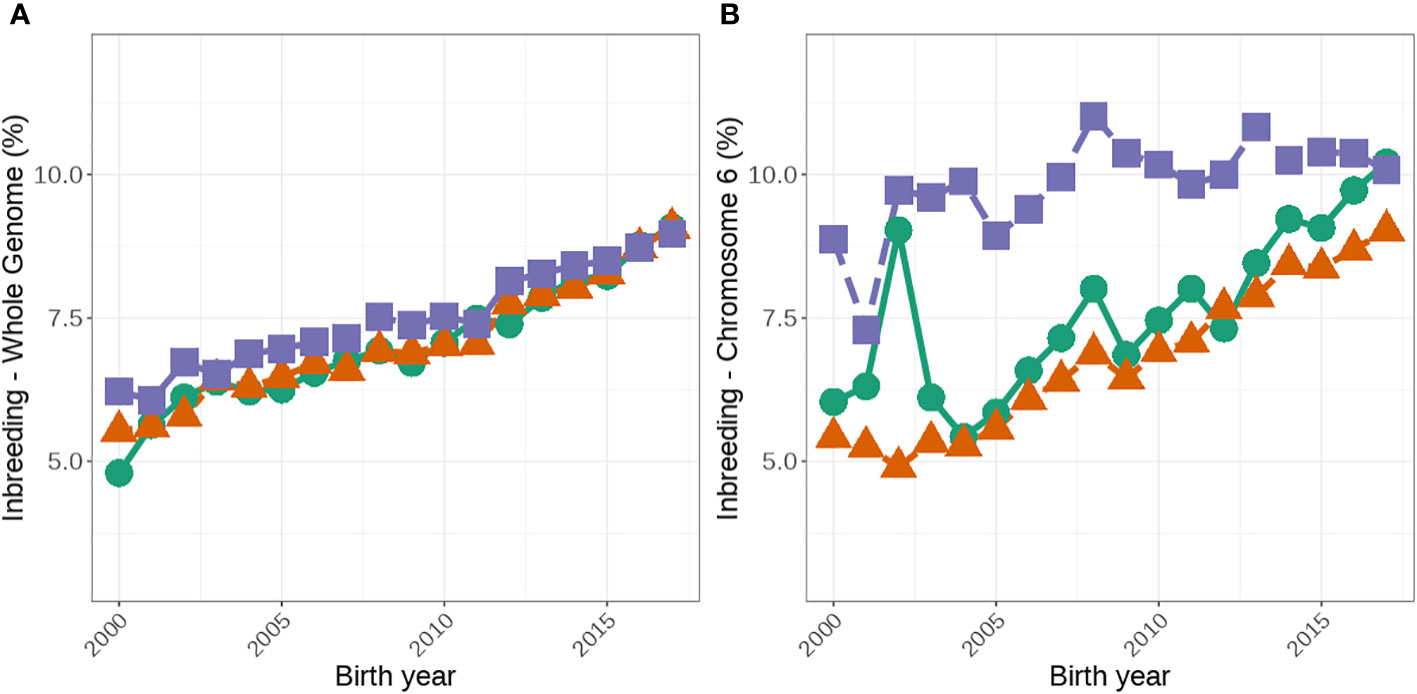
Figure 3 Average genomic inbreeding coefficients (%) for the whole genome (A) and on chromosome 6 (B) for females that are A1/A1, A1/A2 and A2/A2. The green lines with circles represent A1/A1, the orange lines with triangles represent A1/A2, and the purple lines with squares represent A2/A2.
A2/A2 animals were also more likely to have increased genomic inbreeding on chromosome 6 than A1/A1 animals. Eighty-two percent of A2/A2 animals compared with 77% of A1/A1 animals had at least one ROH on chromosome 6. Additionally, A2/A2 animals had significantly more regional inbreeding over all of chromosome 6 than A1/A1 animals (Figure 3B), with a median FROH of 7.35% and 5.46%, respectively (Table 3).
We found that A2/A2 animals were more likely to have an ROH over the β-casein locus (chi-square test, p < 2.2e-16). However, the median ROH for A1/A1 was longer than the median of A2/A2 (median ROH length 6,491 kb vs. 4,935 kb). When comparing the A1/A1 subset of animals that had an ROH over the β-casein locus to the median inbreeding observed over the whole genome for all A1/A1 animals, we found that this subset of animals had a higher overall level of inbreeding (median FROH 10.2% subset vs. 7.87% population and 10.2% subset vs. 8.48% population for A1/A1 and A2/A2 animals, respectively).
In this study, we found that the frequency of A2/A2 cows in Australia has increased rapidly since 2000 from 32% to 52%. This frequency is similar to a subpopulation of Italian Holstein cows where they found a frequency of 60.7% for the A2 allele and 30.4% for the A1 allele (Sebastiani et al., 2020). Our findings suggest that many farmers may be actively selecting for A2. This is supported by the national semen survey which has observed increases in the proportion of A2/A2 semen sold in Australia (NHIA, 2019; NHIA, 2020) and mating records where the proportion of animals mated to A2/A2 bulls has increased (Haile-Mariam, unpublished data). Although the frequency of A2/A2 bulls registered for AI in Australia (Figure 1) has decreased, the available bulls are more intensively used compared to A1/A2 or A1/A1 bulls, which agrees with the increase in the number of A2/A2 cows.
We observed no clear trend in the frequency of A1/A1 and A2/A2 bulls registered for AI. These results are similar to results from New Zealand where the frequency of A2/A2 bulls fluctuated between 28-60% over the same period (DairyNZ, 2021), however, these findings were more varied than a population of French bulls where the differences were observed over the same period (between 55-60%; Sanchez et al. (2020). The differences between the frequencies in Australia and New Zealand could be due to a smaller sample size (a subset of bulls registered for AI versus all genotyped bulls) resulting in more variation when compared to Sanchez et al. (2020). It could also be that selection for A2 is practiced by some farmers in Australia and New Zealand.
We observed differences in the proportion of A1/A1 and A2/A2 annually for both cows and bulls, where the proportion of A2/A2 cows has increased annually, whilst bulls have fluctuated. This could be due to several factors: firstly, farmers who select A2/A2 individuals may be more inclined to genotype their cows compared to those ignoring A2/A2 from their breeding program, leading to an overestimation of A2/A2 genotype frequencies. For example, there were 23% of herds (with animals born in 2017) had at least 67% of animals that were A2/A2. However, overall, there was no clear trend observed for the 226 herds selecting for homozygosity at the A2 allele and therefore it is unlikely to have caused a strong bias in our results. Of these 226 herds, only two had more than 90% A2/A2 cows genotyped for the most recent year they genomically tested. We further validated this by extracting herds that have been routinely genotyped for research due to their superior data collection i.e. these herds should not have a bias in A2/A2 and have the majority of the herd genotyped (GInfo; see Pryce et al. (2018)) and we observed similar frequencies. Secondly, Australia imports approximately 80% of semen, and selection for A2 may not be a priority in the countries exporting dairy semen to Australia, however, does seem to come into buying preferences (NHIA, 2019; NHIA, 2020). Finally, bull companies aim to provide a team of bulls to meet a diverse range of breeding objectives and A2 is only one of the selection criteria for bulls to become available in the AI market.
We observed that all differences in EBVs between A1/A1 and A2/A2 cows were less than 0.25 genetic SDs. The differences in the BPI (national selection index) were small, which could be due to the dollar advantage in production EBVs in A2/A2 cows being almost entirely canceled by inferiority in EBVs for fertility and SCC. Similarly, the difference in survival EBV between the two genotypes is minor, perhaps because the EBV for survival is affected by both voluntary selection on milk yield traits, particularly protein, and by involuntary selection for all other reasons including health and fertility. As expected, one of the biggest differences in EBVs was protein yield. In genome-wide association analyses of sequence variants, there is a highly significant putative QTL in the CSN2 gene region for protein % and yield (MacLeod et al., 2016; Pausch et al., 2017; van den Berg et al., 2020) and the most significant alleles associated with increased protein are in strong LD with the A2 allele. Likewise, there are markers on the Illumina bovine 50K beadchip (used for genomic prediction in Australia) in strong LD with the A2 allele. It is therefore plausible that selection for increased protein yield has led to a small increase in the A2 allele. However, it is unlikely this would be the main cause of an increase in A2/A2 genotypes because protein yield has been under selection since 1985 (Jones and Goddard, 1990) and is a quantitative trait influenced by many QTLs and is one trait amongst several under-selection in dairy populations. Furthermore, Kemper et al. (2014) found only weak evidence of recent selection signatures in dairy cattle for QTL affecting milk traits. This finding is supported by the variation seen in the frequency of A2 bulls registered for artificial breeding. We observed fluctuations suggesting there isn’t a clear preference for A2 bulls therefore bull companies are likely providing bulls to meet a variety of farmer preferences.
The higher level of inbreeding detected in A2/A2 animals (genome-wide, chromosome 6 and ROH across the A1/A2 position) could pose a greater risk for regional inbreeding depression compared to their A1/A1 counterparts. Several studies have identified regional inbreeding depression for both production and fertility traits (Pryce et al., 2014; Martikainen et al., 2020; Makanjuola et al., 2021). For production traits, these estimates range from -114.6 to -410.7 kg for milk yield, − 3.4 to − 16.1 kg for protein yield, and − 8.3 to − 15.8 kg for fat yield (Pryce et al., 2014; Martikainen et al., 2020; Makanjuola et al., 2021). Whilst unfavorable ROHs for fertility have been shown to increase the number of services and the number of days until conception in both Holsteins and Ayrshires (Pryce et al., 2014; Martikainen et al., 2020; Makanjuola et al., 2021), further work is required to determine if specific allele selection has a greater impact on regional inbreeding depression. For example, Makanjuola et al. (2021) identified two ROH regions on chromosome 6 that had an unfavorable impact on two fertility traits and it is possible that A2/A2 individuals are affected by inbreeding depression arising from these ROH, although this needs to be quantified. It should be noted that in recent years, the rate increases in inbreeding has been greater on chromosome 6 for A1/A1 animals (Figure 3) than in A2/A2 cows. This could be due to several factors including decrease in the number of A1/A1 animals over time, lack of diversity in A1/A1 bulls and better inbreeding management of herds that own A2/A2 cows compared to those who own A1/A1 cows. Regardless understanding the impact of regional inbreeding depression on economic traits may assist in managing inbreeding on chromosome 6 and across the genome.
Our results suggest that intense selection for A2 has had a significant effect on inbreeding. As a result, farmers that select for A2 should be advised to take steps to monitor and control inbreeding. The narrowing of the difference between A2 and A1 cows (Figure 3) in inbreeding in recent years shows that owners of A2 cows seem to be able to manage inbreeding better than owners of A1 at least when inbreeding on chromosomes 6 is considered. However, regardless selection for specific alleles to meet niche markets needs to be weighed up against the economic impact of the accumulation of inbreeding. In this study, we focused on the A2 allele, however, the principles of this study may also apply to other mutations, such as polled (Cole and Null, 2019) and SLICK (Littlejohn et al., 2014), that are currently at lower frequencies in the population. Unlike the findings from this study, selecting for a single allele (that has a low frequency in the population) is expected to reduce genetic progress due to a population bottleneck, leading to lower selection intensities and accordingly less genetic progress of animals under selection in addition to greater rates of inbreeding (Windig et al., 2015). It should be noted that the polled and SLICK mutations are dominant and in theory, this could help slow the rate of inbreeding compared to the A2 example presented in this study. That is, selection for homozygous alleles could be restricted to the elite, or nucleus bulls, but in commercial herds use of these bulls is only required to generate offspring that are heterozygous at the allele but have the desired dominant phenotype. However, breeding companies in dairy cattle populations are operating in a competitive space and therefore, their focus tends to be on short-term genetic gain through intense marketing of bulls (Howard et al., 2017) and thus a bottleneck effect due to only a few homozygous polled bulls being available and high demand could still result in the population of polled animals quickly becoming inbred without careful management of inbreeding. This is particularly challenging around traits controlled by a single allele at low frequency in the population. For example, in the dataset used for this study, out of the top 100 Holstein bulls based on the national selection index (BPI), only four carry at least one polled allele and these four bulls are descendants of the same sire within four generations. When the genetic diversity of the population of available bulls is wider, as is the case with A2, then the effect of inbreeding could be managed relatively easily compared to the polled gene. Advanced reproductive or gene editing technologies (e.g., Mueller et al., 2019) could be used to increase the frequency of polled animals in these breeds without undesirable effects on the traits studied.
The best way for the dairy industry to manage inbreeding in the genomic era is still an active area of research (Howard et al., 2017). A recent study that considered inbreeding depression found limited benefits by accounting for region-specific inbreeding depression in selection schemes compared to inbreeding measures that summarize homozygosity across the genome (Doekes et al., 2020). However, Doekes et al. (2020) did not consider the additional impact of selecting specific alleles for Mendelian traits. In this case, there may be advantages in approaches that mitigate rapid inbreeding while selecting for desired Mendelian traits and quantitative traits. Balancing the need to select for “desirable” Mendelian mutations without increasing the level of both regional and genome-wide inbreeding is important especially if the frequency of the desirable allele is low.
This study shows that the frequency of the A2/A2 genotype in Holstein cows has increased by 20% since the year 2000. Our results suggest that A2/A2 animals were more inbred over the whole genome as well as on chromosome 6 and were more likely to have an ROH over the β-casein locus. A2/A2 animals have some level of superiority in milk production EBVs and inferiority in functional trait EBVs, such as fertility and survival. However, there is no significant difference between A2/A2 and A1/A1 when compared to the Balanced Performance Index (of overall genetic merit for production and functional traits).
The data analyzed in this study is subject to the following licenses/restrictions: The data that supported this study were obtained from third party by permission/license. Data will be shared upon reasonable request to the corresponding author with permission from third party. Third parties in this case are DataGene and AU farmers. Requests to access these datasets should be directed to Mekonnen Haile-Mariam, bWVrb25uZW4uaGFpbGVtYXJpYW1AYWdyaWN1bHR1cmUudmljLmdvdi5hdQ==.
JP and MH-M conceived and designed the study. JP, MH-M, and IM supervised the analyses. IM and RX assisted in the preparation of imputed genotype data. BS performed the analyses and wrote the first draft. All authors contributed to the formal data analysis, result interpretation, and discussions; edited and approved the manuscript.
The authors are grateful for the financial support of DairyBio (Melbourne, Australia), funded by Dairy Australia (Melbourne, Australia), the Gardiner Foundation (Melbourne, Australia), and Agriculture Victoria Research (Melbourne, Australia). The funders had no role in the study design, data collection, analysis, decision to publish, or preparation of the manuscript.
The authors thank DataGene Ltd. (Melbourne, Australia) and their staff for the provision of both phenotype and genotype data.
The authors declare that the research was conducted in the absence of any commercial or financial relationships that could be construed as a potential conflict of interest.
All claims expressed in this article are solely those of the authors and do not necessarily represent those of their affiliated organizations, or those of the publisher, the editors and the reviewers. Any product that may be evaluated in this article, or claim that may be made by its manufacturer, is not guaranteed or endorsed by the publisher.
AHA (2014). Australian Animal welfare standards and guidelines for cattle. 1 ed (Canberra, Australia: Animal Health Australia (AHA). Available at: https://www.animalwelfarestandards.net.au/.
Alexander D. H., Novembre J., Lange K. (2009). Fast model-based estimation of ancestry in unrelated individuals. Genome Res. 19 (9), 1655–1664. doi: 10.1101/gr.094052.109
AVMA (2014). Literature review on the welfare implications of dehorning and disbudding of cattle (Chicago, United States: American Veterinary Medical Association (AVMA).
Boettcher P. J., Caroli A., Stella A., Chessa S., Budelli E., Canavesi F., et al. (2004). Effects of casein haplotypes on milk production traits in Italian Holstein and brown Swiss cattle. J. Dairy Sci. 87 (12), 4311–4317. doi: 10.3168/jds.S0022-0302(04)73576-6
Boichard D., Brochard M. (2012). New phenotypes for new breeding goals in dairy cattle. Animal 6 4, 544–550. doi: 10.1017/S1751731112000018
Byrne T. J., Santos B. F. S., Amer P. R., Martin-Collado D., Pryce J. E., Axford M. (2016). New breeding objectives and selection indices for the Australian dairy industry. J. Dairy Sci. 99 (10), 8146–8167. doi: 10.3168/jds.2015-10747
CDCB (Council on Dairy Cattle Breeding) (2020). Washington, United States. Available at: https://webconnect.uscdcb.com/#/summary-stats/inbreeding-information (Accessed June 2020).
Cole J. B., Null D. J. (2019). Short communication: Phenotypic and genetic effects of the polled haplotype on yield, longevity, and fertility in US brown Swiss, Holstein, and Jersey cattle. J. Dairy Sci. 102 (9), 8247–8250. doi: 10.3168/jds.2019-16530
Cole J. B., VanRaden P. M. (2018). Symposium review: Possibilities in an age of genomics: The future of selection indices. J. Dairy Sci. 101 (4), 3686–3701. doi: 10.3168/jds.2017-13335
DairyNZ (2021). Animal evaluation - bull search, Vol. 2021. (DairyNZ Limited, Hamilton, New Zealand). Available at: https://www.dairynz.co.nz/animal/animal-evaluation/bull-search/. (Accessed June 16, 2021).
Doekes H. P., Bijma P., Veerkamp R. F., de Jong G., Wientjes Y. C. J., Windig J. J. (2020). Inbreeding depression across the genome of Dutch Holstein friesian dairy cattle. Genet. Selection Evol. 52 (1), 64. doi: 10.1186/s12711-020-00583-1
Doekes H. P., Veerkamp R. F., Bijma P., Hiemstra S. J., Windig J. J. (2018). Trends in genome-wide and region-specific genetic diversity in the Dutch-Flemish Holstein-friesian breeding program from 1986 to 2015. Genet. Sel Evol. 50 (1), 15. doi: 10.1186/s12711-018-0385-y
Doublet A.-C., Croiseau P., Fritz S., Michenet A., Hozé C., Danchin-Burge C., et al. (2019). The impact of genomic selection on genetic diversity and genetic gain in three French dairy cattle breeds. Genet. Selection Evol. 51 (1), 52. doi: 10.1186/s12711-019-0495-1
Forutan M., Ansari Mahyari S., Baes C., Melzer N., Schenkel F. S., Sargolzaei M. (2018). Inbreeding and runs of homozygosity before and after genomic selection in north American Holstein cattle. BMC Genomics 19 (1), 98. doi: 10.1186/s12864-018-4453-z
Fuerst-Waltl B., Fuerst C., Obritzhauser W., Egger-Danner C. (2016). Sustainable breeding objectives and possible selection response: Finding the balance between economics and breeders’ preferences. J. Dairy Sci. 99 (12), 9796–9809. doi: 10.3168/jds.2016-11095
Gilmour A. R., Gogel B. J., Cullis B. R., Welham S. J., Thompson R. (2016). ASReml user guide release 4.1 functional specification (Hemel Hempstead, HP1 1ES, UK: VSN International Ltd).
Howard J. T., Pryce J. E., Baes C., Maltecca C. (2017). Invited review: Inbreeding in the genomics era: Inbreeding, inbreeding depression, and management of genomic variability. J. Dairy Sci. 100 (8), 6009–6024. doi: 10.3168/jds.2017-12787
Howie B., Fuchsberger C., Stephens M., Marchini J., Abecasis G. R. (2012). Fast and accurate genotype imputation in genome-wide association studies through pre-phasing. Nat. Genet. 44 (8), 955–959. doi: 10.1038/ng.2354
Jones L. P., Goddard M. E. (1990). Five years experience with the animal model for dairy evaluations in Australia. Proc. World Congress Genet. Appl. to livestock production Edinburgh 13, 382–385.
Keller M. C., Visscher P. M., Goddard M. E. (2011). Quantification of inbreeding due to distant ancestors and its detection using dense single nucleotide polymorphism data. Genetics 189 (1), 237–249. doi: 10.1534/genetics.111.130922
Kemper K. E., Saxton S. J., Bolormaa S., Hayes B. J., Goddard M. E. (2014). Selection for complex traits leaves little or no classic signatures of selection. BMC Genomics 15 (1), 246. doi: 10.1186/1471-2164-15-246
Knutsen T. M., Olsen H. G., Ketto I. A., Sundsaasen K. K., Kohler A., Tafintseva V., et al. (2022). Genetic variants associated with two major bovine milk fatty acids offer opportunities to breed for altered milk fat composition. Genet. Selection Evol. 54 (1), 35. doi: 10.1186/s12711-022-00731-9
Leroy G. (2014). Inbreeding depression in livestock species: Review and meta-analysis. Anim. Genet. 45 (5), 618–628. doi: 10.1111/age.12178
Littlejohn M. D., Henty K. M., Tiplady K., Johnson T., Harland C., Lopdell T., et al. (2014). Functionally reciprocal mutations of the prolactin signalling pathway define hairy and slick cattle. Nat. Commun. 5, 5861. doi: 10.1038/ncomms6861
Liu Z., Wang T., Pryce J. E., MacLeod I. M., Hayes B. J., Chamberlain A. J., et al. (2019). Fine-mapping sequence mutations with a major effect on oligosaccharide content in bovine milk. Sci. Rep. 9 (1), 2137.
Loh P.-R., Danecek P., Palamara P. F., Fuchsberger C., Reshef Y. A., Finucane H. K., et al. (2016). Reference-based phasing using the haplotype reference consortium panel. Nat. Genet. 48 (11), 1443–1448. doi: 10.1038/ng.3679
MacLeod I. M., Bowman P. J., Vander Jagt C. J., Haile-Mariam M., Kemper K. E., Chamberlain A. J., et al. (2016). Exploiting biological priors and sequence variants enhances QTL discovery and genomic prediction of complex traits. BMC Genomics 17 (1), 144. doi: 10.1186/s12864-016-2443-6
MacLeod I., Hayes B., Chamberlain A., Savin K., McPartlan H., Haile-Mariam M., et al. (2007). “Use of dense DNA markers to measure chromosome segment homozygosity in dairy cattle.” Proc. Assoc. Advmt. Anim. Breed. Genet., 549–552.
Makanjuola B. O., Maltecca C., Miglior F., Marras G., Abdalla E. A., Schenkel F. S., et al. (2021). Identification of unique ROH regions with unfavorable effects on production and fertility traits in Canadian holsteins. Genet. Selection Evol. 53 (1), 68. doi: 10.1186/s12711-021-00660-z
Martikainen K., Koivula M., Uimari P. (2020). Identification of runs of homozygosity affecting female fertility and milk production traits in Finnish Ayrshire cattle. Sci. Rep. 10 (1), 3804–3804. doi: 10.1038/s41598-020-60830-9
Martin-Collado D., Byrne T. J., Amer P. R., Santos B. F. S., Axford M., Pryce J. E. (2015). Analyzing the heterogeneity of farmers’ preferences for improvements in dairy cow traits using farmer typologies. J. Dairy Sci. 98 (6), 4148–4161. doi: 10.3168/jds.2014-9194
Miglior F., Muir B. L., Van Doormaal B. J. (2005). Selection indices in Holstein cattle of various countries. J. Dairy Sci. 88 (3), 1255–1263. doi: 10.3168/jds.S0022-0302(05)72792-2
Mueller M., Cole J. B., Sonstegard T. S., Van Eenennaam A. L. (2019). Comparison of gene editing versus conventional breeding to introgress the POLLED allele into the US dairy cattle population. Journal of Dairy Science 102, 4215–4226.
Neilson W., Wichmann B. (2014). Social networks and non-market valuations. J. Environ. Economics Manage. 67 (2), 155–170. doi: 10.1016/j.jeem.2013.11.005
Nguyen T. V., Bolormaa S., Reich C. M., Chamberlain A. J., Medley A., Schrooten C., et al. (2021). Exploring imputation accuracy across the bovine X chromosome. Proc. Assoc. Advmt. Anim. Breed. Genet. 24, 267–271.
NHIA (2019). Semen market survey 2019 results (Melbourne, Australia: National Herd Improvement Association of Australia (NHIA).
NHIA (2020). Semen market survey 2020 results (National Herd Improvement Association of Australia (NHIA).
Null D. J., Cole J. B., Sun C., Van Raden P. M. (2015). Assignment of polled status using single nucleotide polymorphism genotypes and predicted gene content. J. Dairy Sci. 98 (Suppl. 2), 800.
OIE (2022). “Animal welfare and dairy cattle production systems,” in Terrestrial animal health code. World Organisation for Animal Health Chapter 7.11. Available at: https://www.woah.org/fileadmin/Home/eng/Health_standards/tahc/current/chapitre_aw_dairy_cattle.pdf.
Pausch H., Emmerling R., Gredler-Grandl B., Fries R., Daetwyler H. D., Goddard M. E. (2017). Meta-analysis of sequence-based association studies across three cattle breeds reveals 25 QTL for fat and protein percentages in milk at nucleotide resolution. BMC Genomics 18 (1), 853. doi: 10.1186/s12864-017-4263-8
Pryce J. E., Haile-Mariam M., Goddard M. E., Hayes B. J. (2014). Identification of genomic regions associated with inbreeding depression in Holstein and Jersey dairy cattle. Genet. Selection Evol. 46 (1). doi: 10.1186/s12711-014-0071-7
Pryce J. E., Nguyen T. T. T., Axford M., Nieuwhof G., Shaffer M. (2018). Symposium review: Building a better cow–the Australian experience and future perspectives. J. Dairy Sci. 101 (4), 3702–3713. doi: 10.3168/jds.2017-13377
Purcell S., Neale B., Todd-Brown K., Thomas L., Ferreira M. A., Bender D., et al. (2007). PLINK: a tool set for whole-genome association and population-based linkage analyses. Am. J. Hum. Genet. 81 (3), 559–575. doi: 10.1086/519795
Rosen B. D., Bickhart D. M., Schnabel R. D., Koren S., Elsik C. G., Tseng E., et al. (2020). De novo assembly of the cattle reference genome with single-molecule sequencing. GigaScience 9.
Sanchez M. P., Fritz S., Patry C., Delacroix-Buchet A., Boichard D. (2020). Frequencies of milk protein variants and haplotypes estimated from genotypes of more than 1 million bulls and cows of 12 French cattle breeds. J. Dairy Sci. 103 (10), 9124–9141. doi: 10.3168/jds.2020-18492
Sargolzaei M., Chesnais J. P., Schenkel F. S. (2014). A new approach for efficient genotype imputation using information from relatives. BMC Genomics 15, 478.
Scott B. A., Haile-Mariam M., Cocks B. G., Pryce J. E. (2021). How genomic selection has increased rates of genetic gain and inbreeding in the Australian national herd, genomic information nucleus, and bulls. J. Dairy Sci. 104 (11), 11832–11849. doi: 10.3168/jds.2021-20326
Sebastiani C., Arcangeli C., Ciullo M., Torricelli M., Cinti G., Fisichella S., et al. (2020). Frequencies evaluation of β-casein gene polymorphisms in dairy cows reared in central Italy. Anim. (Basel) 10 (2), 252. doi: 10.3390/ani10020252
van den Berg I., Xiang R., Jenko J., Pausch H., Boussaha M., Schrooten C., et al. (2020). Meta-analysis for milk fat and protein percentage using imputed sequence variant genotypes in 94,321 cattle from eight cattle breeds. Genet. Selection Evol. 52 (1), 37. doi: 10.1186/s12711-020-00556-4
Windig J. J., Hoving-Bolink R. A., Veerkamp R. F. (2015). Breeding for polledness in Holstein cattle. Livestock Sci. 179, 96–101. doi: 10.1016/j.livsci.2015.05.021
Keywords: dairy cattle, genomic selection, inbreeding, allele specific selection, A2 beta-casein
Citation: Scott BA, Haile-Mariam M, MacLeod IM, Xiang R and Pryce JE (2023) Evaluating the potential impact of selection for the A2 milk allele on inbreeding and performance in Australian Holstein cattle. Front. Anim. Sci. 4:1142673. doi: 10.3389/fanim.2023.1142673
Received: 12 January 2023; Accepted: 29 March 2023;
Published: 17 April 2023.
Edited by:
Angela Cánovas, University of Guelph, CanadaReviewed by:
Hinayah Rojas De Oliveira, Purdue University, United StatesCopyright © 2023 Scott, Haile-Mariam, MacLeod, Xiang and Pryce. This is an open-access article distributed under the terms of the Creative Commons Attribution License (CC BY). The use, distribution or reproduction in other forums is permitted, provided the original author(s) and the copyright owner(s) are credited and that the original publication in this journal is cited, in accordance with accepted academic practice. No use, distribution or reproduction is permitted which does not comply with these terms.
*Correspondence: Mekonnen Haile-Mariam, TWVrb25uZW4uSGFpbGVNYXJpYW1AYWdyaWN1bHR1cmUudmljLmdvdi5hdQ==
Disclaimer: All claims expressed in this article are solely those of the authors and do not necessarily represent those of their affiliated organizations, or those of the publisher, the editors and the reviewers. Any product that may be evaluated in this article or claim that may be made by its manufacturer is not guaranteed or endorsed by the publisher.
Research integrity at Frontiers
Learn more about the work of our research integrity team to safeguard the quality of each article we publish.