 Xiaoyu Feng
 Ward Smith
 Andrew C. VanderZaag
94% of researchers rate our articles as excellent or good
Learn more about the work of our research integrity team to safeguard the quality of each article we publish.
Find out more
ORIGINAL RESEARCH article
Front. Anim. Sci., 28 June 2023
Sec. Animal Physiology and Management
Volume 4 - 2023 | https://doi.org/10.3389/fanim.2023.1134817
This article is part of the Research TopicMitigating the Impact of Animal Production on the Environment: The Ecosystem IntegrationView all 8 articles
Technologies that separate manure or digestate into fractions with different solids and nutrient contents present interesting options to mitigate manure storage emissions (by reducing the quantity of carbon stored anaerobically) and to improve nutrient distribution (by reducing the quantity of water transported with nutrients). In this study, the dairy farm model, DairyCrop-Syst, was used to simulate storage emissions of methane (CH4), nitrous oxide (N2O), and ammonia (NH3), and to simulate nutrient distribution for a case-study farm in Canada. The farm used several types of manure processing, including: anaerobic digestion (AD), solid-liquid separation (SLS), and nutrient recovery (NR). Simulations were done with combinations of the above technologies, i.e., a baseline with only AD that produced a single (unseparated) effluent, compared to AD+SLS, and AD+SLS+NR that produced two separate fractions. With AD+SLS+NR, the processing system isolated a solid fraction with a high concentration of N and P, and a liquid fraction containing less nutrients. Compared to the baseline system, the addition of solid liquid separation and nutrient recovery (i.e. SLS+NR) reduced CH4 emissions from outdoor liquid digestate storage by 87%, with only a small offset from higher N2O and NH3 emissions from storing the solid fraction. The solid fraction was simulated to be transported to fields at least 30 km away from the dairy barns, while the liquid fraction was transported by dragline to fields adjacent to the barn. The advanced nutrient separation system resulted in much lower transport costs for manure nutrients and the ability to transport N and P to greater distances.
The livestock sector is a significant source of greenhouse gas (GHGs) emissions (IPCC, 2014). Manure management contributes an increasingly large proportion to GHG emissions due to the industrialization of animal agriculture and contributes about 12-41% of methane (CH4) and 30-50% of nitrous oxide (N2O) to the total global agricultural emissions (Chadwick et al., 2011; Li et al., 2020). Thus there is an interest in understanding the effects of manure management on direct and indirect GHGs emissions.
Besides emission considerations, manure contains valuable nutrients for crops. Most livestock excrete more than 70% of dietary N and 65% of dietary P in feces and urine (Reijs et al., 2007; Van der Meer, 2008). Hence, the efficient recovery and recycling of livestock manures to fertilize crops and improve soil fertility is an important option for minimizing the reliance on fossil-fuel-derived synthetic N and the depletion of non-renewable P resources (Desmidt et al., 2015; Sharpley et al., 2018).
The distribution of manure nutrients is an important consideration because surplus manure-derived nutrients are a waste of natural resources and can be harmful to water quality and biodiversity. A Canadian study illustrated that the imbalanced distribution of P in agricultural lands occurs in many regions in Canada and this trend was continuing (Reid et al., 2019). They noted about 10% of agricultural regions accumulated significantly high P and were continuously increasing, while 50% of soils were deficient in P and becoming more depleted. The over-accumulation of P in most high soil test P areas was dominated by livestock manure which highlights the need to develop strategies to disperse and rebalance the manure P to land that is low in P. However, due to the high water content of manure, the cost of manure transport is generally more expensive than commercial fertilizers. This transportation issue restricts manure-derived fertilizer application to only those areas located near livestock farms.
New technologies may provide opportunities to mitigate emissions and balance nutrients in manure for more efficient nutrient use. Manure treatment may induce changes to manure properties and therefore influence GHG emissions throughout the management chain (Hou et al., 2017). Manure treatment by anaerobic digester (AD) have demonstrated the potential to reduce GHG emissions (Hou et al., 2017; VanderZaag et al., 2018; Sigurnjak et al., 2020). Compared to untreated slurry, the CH4 emissions with AD treatment can be reduced by 24 to 66% (Amon et al., 2006; Clemens et al., 2006; Chadwick et al., 2011; Battini et al., 2014). The biogas generated from AD can be used as renewable natural gas, or used to produce electricity and heat, thus offsetting fossil energy sources and further reducing GHG emissions. Solid-liquid separation (SLS) can be combined with AD, thereby separating the manure into two fractions, and partitioning some carbon and nutrients to the solid fraction and thus reducing total GHG emissions (Aguirre-Villegas et al., 2019). Compared to untreated dairy manure, SLS has the potential to reduce GHG emissions by 20 – 37% and increasing SLS efficiency can further reduce GHG by 46% (Jayasundara et al., 2016; Guest et al., 2017; Aguirre-Villegas et al., 2019). In doing so, liquid manure storage capacity is increased, and the solid fraction can be used to reduce expenses by providing bedding material or compost for soil amendment. Other technologies such as nutrient recovery by physical and/or chemical processes have been investigated in recent years and have shown the potential to further partition nutrients contained in the liquid manures and digestate (Shi et al., 2018; Porterfield et al., 2020; Camilleri-Rumbau et al., 2019; Camilleri-Rumbau et al., 2021).
A recent measurement study at a dairy farm with AD, SLS, and nutrient recovery (NR) showed the technologies greatly reduced CH4 emissions from liquid storage (VanderZaag and Baldé, 2022). The NR technology used in this case study is based on the case-study farm and local environmental conditions and is consistent with some of the system designs identified by Sobhi et al. (2022). VanderZaag and Baldé (2022) also showed the system partitioned P in the solid fraction, and identified that emissions from the solid fractions should be considered to understand whether those emissions offset the reductions of CH4 from liquid storage. Further analysis of nutrient transport costs with nutrient recovery was also suggested. The present study aims to address these gaps, using the same facility as a case study. The specific objectives were: 1) to evaluate the impacts of anaerobic digestion, solid liquid separation and nutrient recovery on multiple GHG emissions including CH4, NH3, and N2O from both liquid and solid fractions using a modeling approach; and 2) to investigate the cost implications of transporting manure P with separated liquid and solid fractions.
This case study was based on the dairy farm and manure processing facility described in VanderZaag and Baldé (2022). The farm was located in British Columbia, Canada, and utilized an anaerobic digester, SLS, and NR system. Emissions of CH4 from the liquid storages were measured over one year. The present case study does not exactly reflect the real farm conditions; rather, the facility was used as a reference point providing general farm information as inputs for building the case-study. The farm had 375 milking cows and 350 replacement animals on site. The manure management system included an anaerobic digester (AD) receiving the manure and food wastes (source separated organics, fats-oils-grease) and producing upgraded and compressed natural gas. Digestate was first processed through a solid-liquid separator (SLS) to produce bedding for the cows. The liquid fraction was then processed into a nutrient rich “cake” and a liquid fraction “tea”, using a nutrient recovery (NR) system including a dissolved air flotation (DAF) system and a moving disc separator (Trident Processes Inc., Abbotsford, BC).
Three scenarios with different manure treatment systems were developed and analyzed for nutrients budgets, and GHG emissions. In Scenario A (SA), manure is processed by AD and the digestate is stored until field application. In scenario B (SB), the manure processing includes both an AD and a screw press (SLS). In this case digestate passes through a SLS, and the liquid fraction is stored, while the solid fraction is recycled back to the barn as bedding material. In Scenario C (SC), manure is processed by an AD, a SLS and a nutrient recovery (NR) system in series. The NR system includes a dissolved air flotation system and press that produces a solid fraction (“cake”) and the liquid fraction (“tea”) has very low solids and is stored. The flow chart of treatment scenarios is shown in Figure 1.
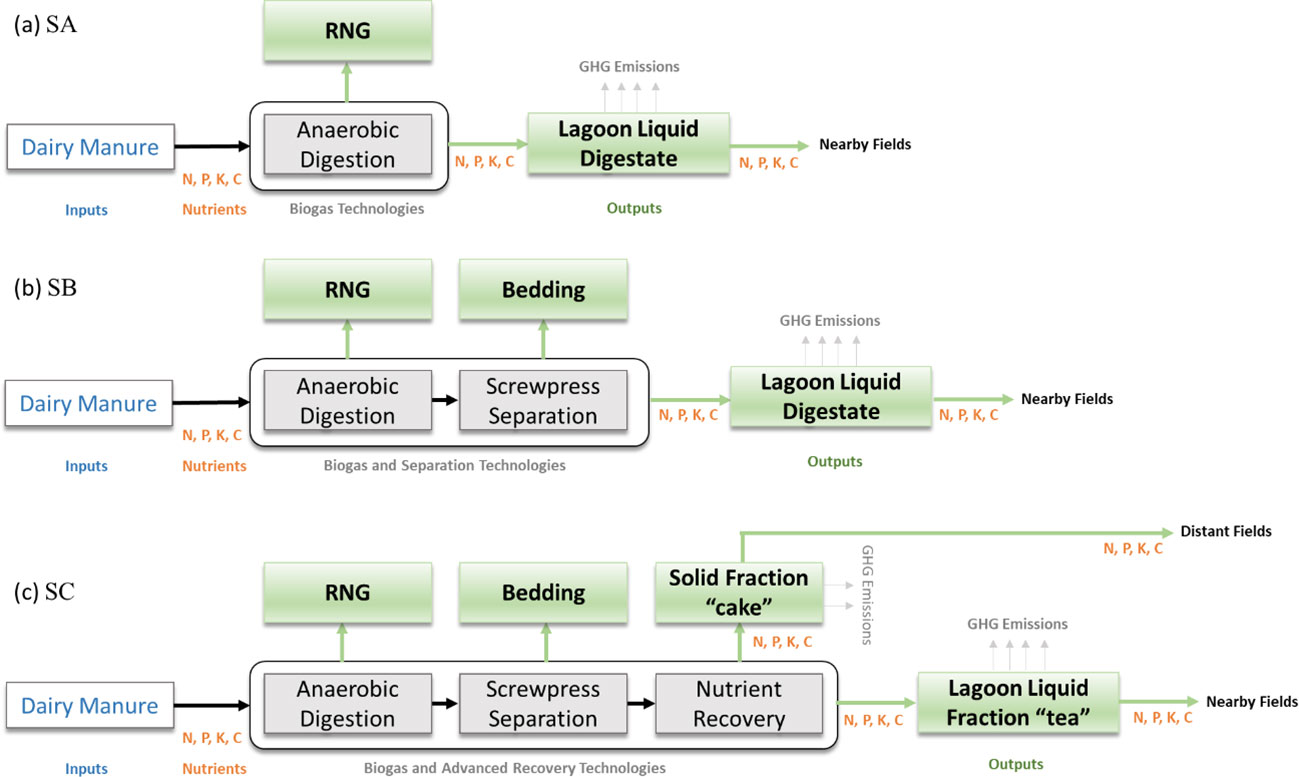
Figure 1 Manure management technologies of three treatment scenarios: (A) Treatment scenario SA; (B) Treatment scenario SB; (C) Treatment scenario SC.
Four transportation scenarios were considered for potential nutrient redistribution strategies, including a baseline reference scenario. The scenarios consider a farm that owns 250 ha of cropland adjacent to the barns, and has 100 ha of land located 30 km away. This is similar to the case study farm in the Fraser Valley, BC where available farmland is rare due to agricultural, commercial, and urban competition. Surplus manure in excess of crop requirements is sold to other farmers located at least 30 km away. The digestate application rate is limited by the N and P requirement for the crop, for which we used values of 300 kg N/ha and 60 kg P/ha (Kowalenko and Bittman, 2000; Sawyer and Mallarino, 2008). In the reference scenario (T0), unprocessed digestate of treatment SA is transported through a dragline pipe and directly applied on a local field of 250 hectare within 1 km distance. The remaining liquid manure is transported by truck to a 100-hectare field that is 30 km away from the farm for application.
The remaining three transportation scenarios are based on the nutrient flows from manure treatment scenario SC (Figure 2) in which solid and liquid fractions are transported separately. In transportation scenario 1 (T1), the liquid fraction is transported and applied by dragline to the same local field as described in T0, in this case the local 250 ha field receives less than 58.7 kg P/ha and is assumed to utilize soil P reserves. The solid fraction is transported by truck to a distant fields located 30 km away. Surplus solid manure is sent to additional fields at the same distance (30 km) by truck. Local transportation and application of the liquid fraction (1 km) and distant transportation and application of the solid fraction (30 km) of transportation scenarios 2 (T2), and scenario 3 (T3), are the same as T1. For T2, surplus solid manure is transported to fields as far as possible by truck (farther than 30 km) while keeping the total transportation cost the same as T0. For T3, the surplus solid manure is transported the same distance as for T2, however, solid manure is transported by train rather than by truck. Transport costs were given in tonne × km, or tkm, the cost to transport one tonne a distance of one km. The unit transportation price (application cost not included) for dragline (liquid), truck for solid, truck for liquid, and train (solid) were $0.06/tkm for dragline, $0.28/tkm for truck, $0.04/tkm for train. Due to inflation these values are higher than those in previous studies (Fleming et al., 1998; Ribaudo et al., 2003; Mahmudi & Flynn, 2006).
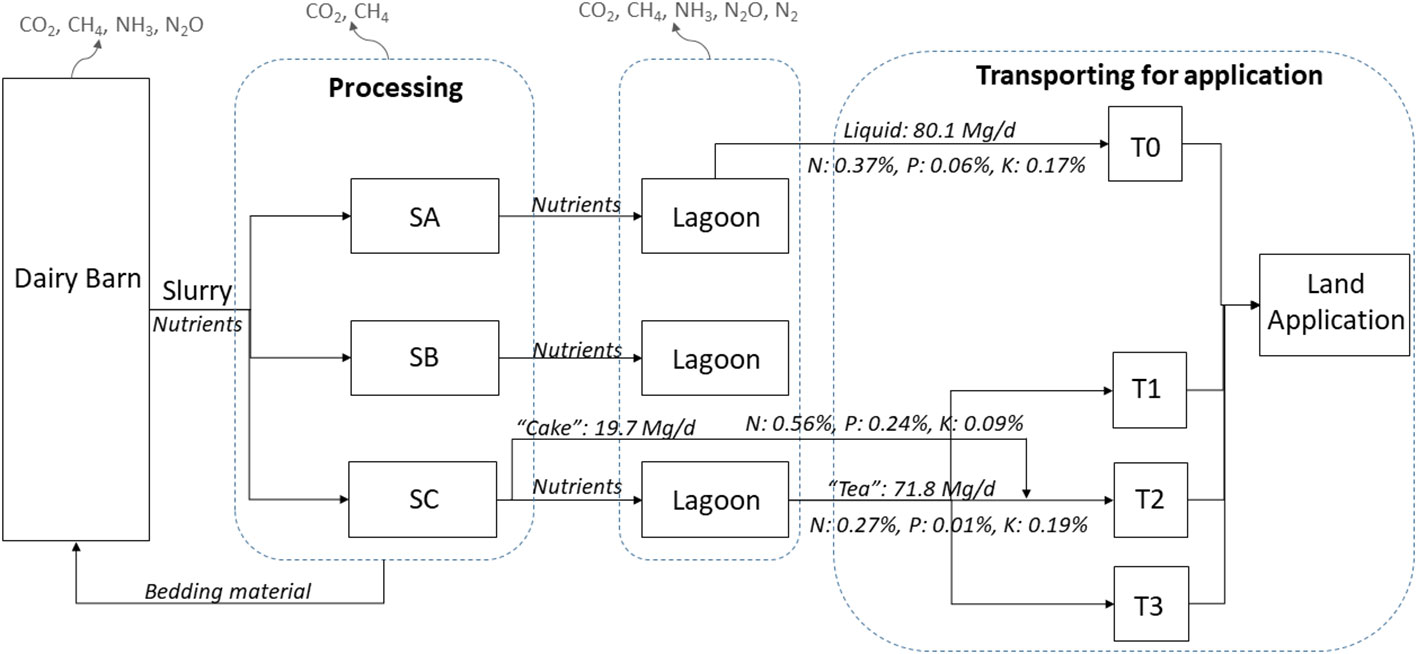
Figure 2 Overview flowchart of the case-study modeling scenarios.
Effects of the management scenarios on gaseous emissions and nutrient budgets were modeled using Dairy-CropSyst, a comprehensive dairy farm and manure management modeling tool developed by Khalil et al. (2019). The model was developed based on standards such as IPCC and ASABE, mass balance, and empirical equations which can be found in the Appendix A of Khalil et al. (2019). The Dairy-CropSyst model considers the impacts from manure treatment processes including AD, SLS, and NR to separate nutrients and fine solids. The model was developed based on integrating existing equations describing the biochemical transformations (e.g., C, N, P) and gas emissions (CO2, CH4, N2O, NH3), as well as performance parameters of manure treatment technologies. In this study, the default model settings for weather input were modified (R. Nelson, personal communication), to represent the target site described in VanderZaag and Baldé (2022). Site-specific inputs to the model included site location and dimensions, dairy characteristics, diet components, manure digestion, treatment, and storage processes (Table 1).
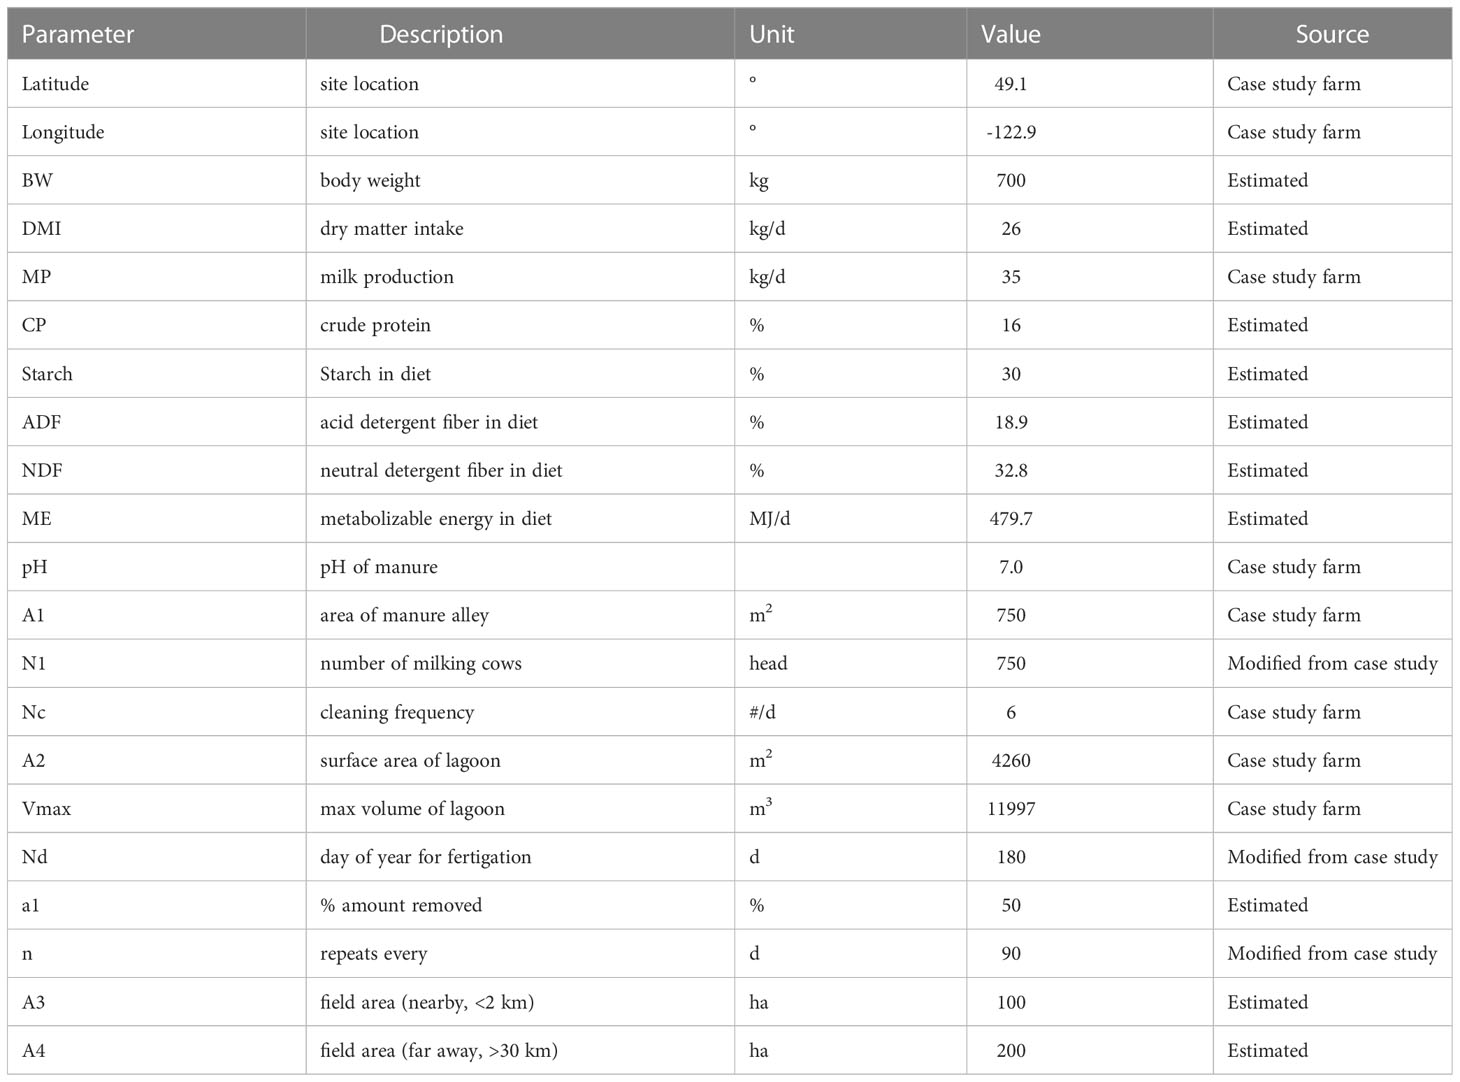
Table 1 Site information and model inputs, either based on the case-study in VanderZaag and Balde 2022, or estimated.
At the facility described in VanderZaag and Baldé (2022), the manure stream was mixed with off-farm feedstocks (e.g. food waste) and the mixture was fed to the AD. The Dairy-CropSyst model, however, can only consider manure produced on the farm as the feedstock for AD. Therefore, to produce a similar mass flow of digestate, the number of dairy cows was doubled in the model simulations, to 750 head (N1; Table 1). This assumption of a manure-only digester likely changes the C, N, and P allocations compared to a digester receiving food-waste as co-feedstocks. The model simulated biogas production of 980 kg/d (CH4), which is about 1/3 the amount produced at the case-study farm. The differences is likely due to the lower biogas potential of manure compared to off-farm co-feedstocks used at the case-study farm.
The model calculated urine and manure production and nutrients in manure slurry as functions of milk production and body weight (Khalil et al., 2019). Manure produced in the barn was assumed to be periodically scraped and flushed out from the floor with water in milking parlors (Khalil et al., 2019). Manure mass flow rates, total solid contents of manure (TS), nutrient concentrations of total nitrogen (TN), total phosphorous (TP), and total potassium (TK) of each manure treatment process were predicted for each liquid and solid stream. Default separation efficiencies (nutrient content in the solid fraction/liquid influent) of the coarse SLS separator are 40%, 12%, 10%, 5%, and 9% for TS, TKN, TON, TP, and TK, respectively. Nutrient concentrations of TN, TP, and TK in the liquid “tea” were estimated for the NR system in treatment SC using the separation efficiency of 36% for N, 85% for P, and 11% for K, respectively based on a previous study (Porterfield et al., 2020).
The Dairy-CropSyst model simulates emissions from the animals and barn surfaces including CH4, N2O and NH3 (biogenic CO2 is simulated but was excluded in our analysis as it is not a net GHG). Biogas produced by the AD was predicted by the model, and fugitive emissions were assumed to be 1% of the total CH4 production (IPCC, 2019). Literature values of volatile solid (VS) to TS ratios are used to estimate VS contents for liquid and solid storage which are 71% and 91%, respectively (Fillingham et al., 2017; VanderZaag & Baldé, 2022). Direct and indirect N2O (via NH3) emissions from lagoon, bedding materials, and solid “cake” were predicted following the IPCC procedures (IPCC, 2019), specifically the Tier 2 method of methane emissions from solid and liquid manure management was used for estimating CH4 emissions. Methane conversion factors (MCF) for solids (bedding and cake) was 2% (IPCC, 2019). The maximum methane-producing capacity of dairy manure (B0) was assumed to be 0.24 m3 CH4/kg VS (IPCC, 2019). Nitrogen loss due to volatilization of NH3 (and NOx) as a fraction of total N excreted for uncovered anaerobic lagoon systems and solid storage systems are 0.35 and 0.30, respectively (IPCC, 2019). Emission factors (EFs) for direct N2O emissions from solid and liquid manure storage are 0.02 and 0.001 kg N2O-N/kg N, respectively (Kebreab et al., 2006).
According to estimates from Dairy-CropSyst the daily manure produced in the barn was 97.6 Mg/d with 8.12% total solids (TS) content. This is approximately double the observed manure production rate at the case study farm (VanderZaag and Baldé, 2022) which makes sense because we assumed the herd size was doubled to make-up for the lack of off-farm feedstocks. Simulated water flow out of the barn (89.65 Mg/d) was slightly greater than the total water excreted by cows (41.69 Mg/d) and water used in the parlor (44.18 Mg/d) and the difference was the amount of water consumed for other cleaning. The liquid manure was subject to further processing using different technologies (Table 2). The initial nutrients in the out-flow stream leaving the barn contained 0.37% N, 0.06% P, and 0.17% K, and the N/P ratio was 6.1:1, which is similar to the observed ratio of 6.7:1 (VanderZaag and Baldé, 2022). Therefore, a total of 2890 Mg of TS per year was generated in the barn with annual production of N, P, and K of 131 Mg/yr, 22 Mg/yr, and 62 Mg/yr, respectively.
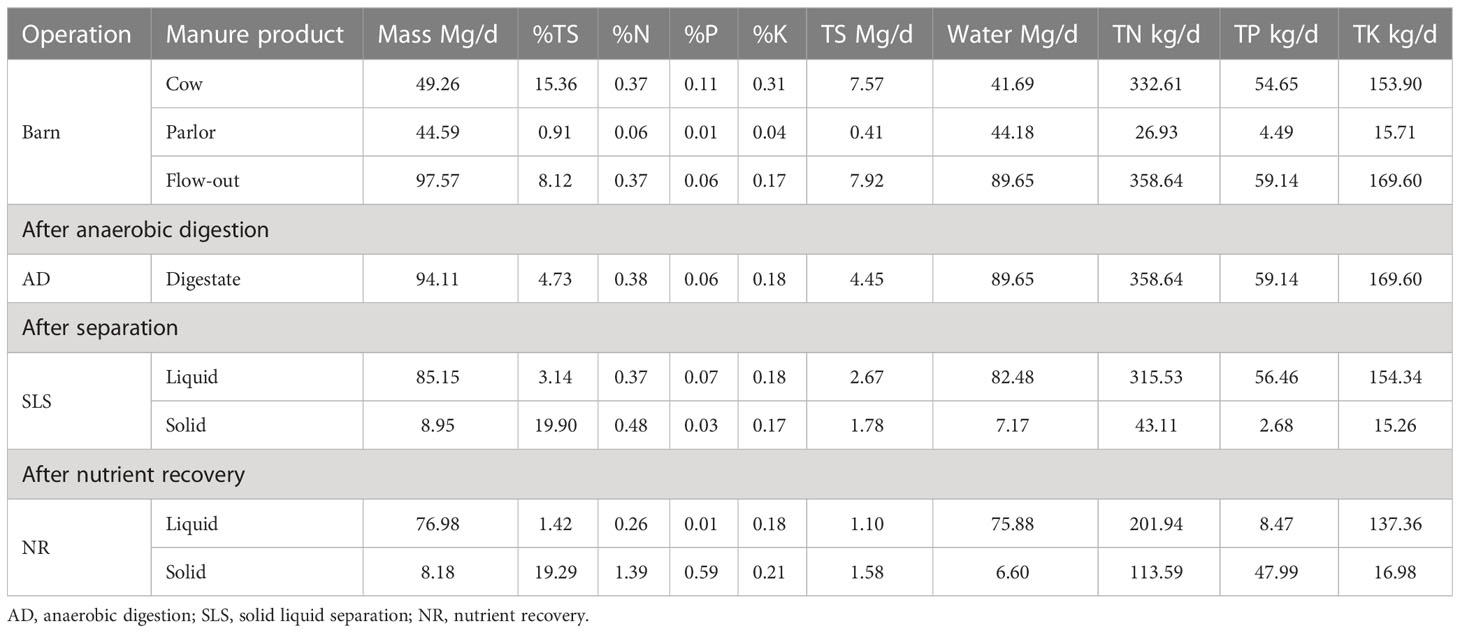
Table 2 Mass and nutrient composition of manure at the out-flow of different treatment stages as estimated by Dairy-CropSyst.
As manure was processed in the AD, organic matter (OM) was decomposed to produce biogas (CH4, CO2) and the mass of total solids in manure dropped from 7.92 Mg/d in barn out-flow to 4.45 Mg/d in AD effluent which was beneficial for reducing CH4 emission during digestate storage (Table 2). Parts of the organic N (TON) was converted to ammoniacal N (TAN) in the digester, but the total N (TN) was unchanged. Total P (TP) and total K (TK) were all retained in the digestate and flowed into the screw press separator.
After passing through SLS, 8.95 Mg/d solid mass was separated from the liquid fraction accounting for 9.5% of the total mass input and the TS content in the liquid fraction was decreased to 3.1%. According to the separation efficiencies of the screw press separator, the TN, TP, and TK remaining in the liquid fraction were 315.5, 56.5, and 154.3 kg/d, respectively. The N/P ratios of liquid and solid fractions were 16:1 and 5.6:1, respectively.
Finally, the nutrient recovery system separated 19.7 Mg/d of mass from the liquid manure to the solid fractions (Table 2). The TS content in the liquid was further reduced to 1.4%, which was somewhat higher than the observed value at the case-study farm (0.8%, VanderZaag and Baldé, 2022). As a result of NR, the liquid “tea” contained only 64% of TN and 15% of TP, compared to the unseparated digestate. Conversely, the solid fraction contained 85% of the TP with only 8% of the mass of water. The majority of K remained in the liquid fraction and only 11% of TK was recovered into the solid “cake” by NR. In general, these simulated results are comparable to the observed values at the case-study farm (VanderZaag and Baldé, 2022). The simulated N/P ratio in the liquid “tea” was 23.8:1 which was significantly higher than that in the solid “cake” of 2.4:1, and this was because most of the P was recovered in the solid “cake” by NR treatment.
Simulated GHG emissions for each treatment scenario is listed in Table 3. Emissions from the dairy barn were primarily in the form of CH4 from enteric fermentation, which are constant across all manure treatment scenarios. In SA, enteric emissions account for less than half of the total emissions from the whole facility, owing to higher emissions from the manure processing and storage. In SC, enteric emissions account for the over 75% of the total due to lower emissions from manure processing. Fugitive emissions from AD are also constant across all scenarios and contribute <2% of the total CO2e in all scenarios.
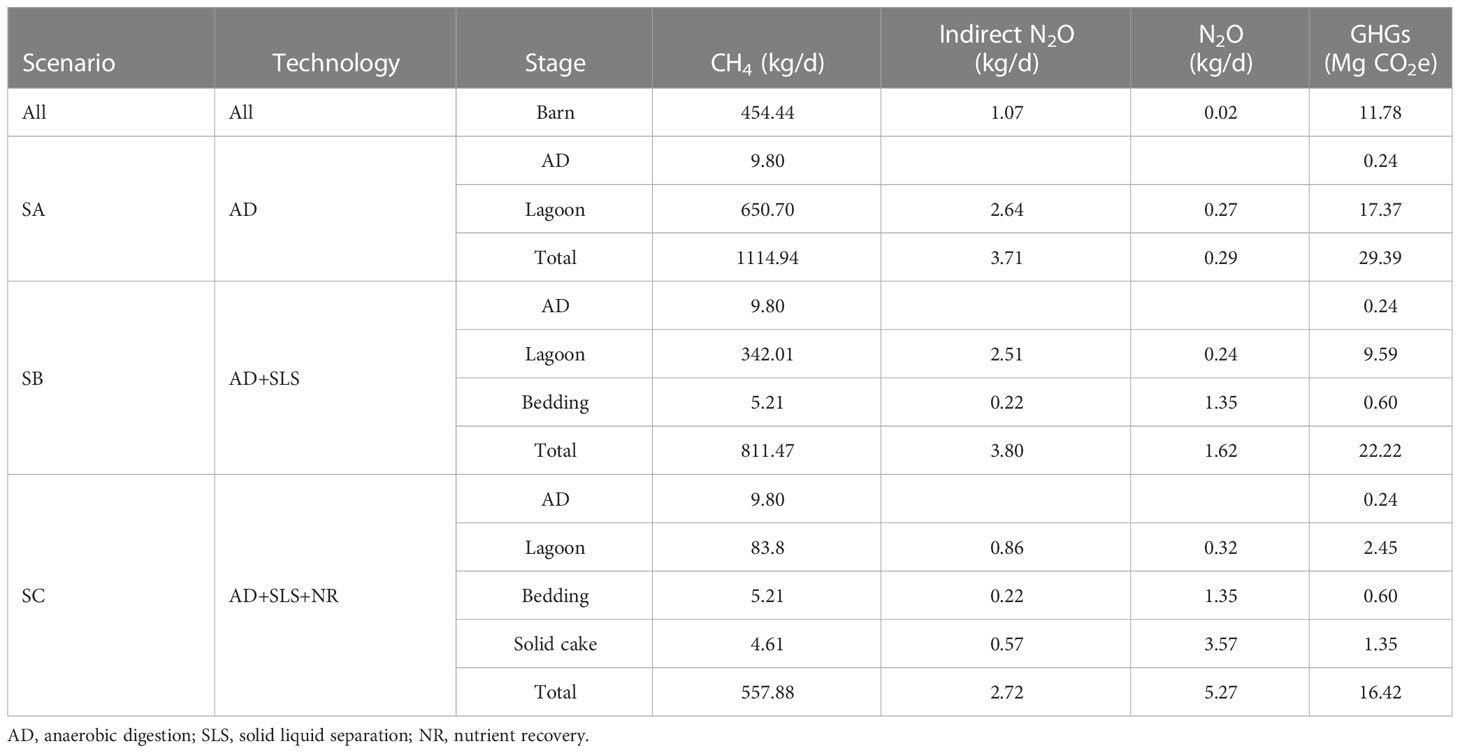
Table 3 Estimated gas emissions from each treatment stage and the total gas and GHG emissions (CH4, N2O, indirect NH3) of the treatment scenarios using Dairy-CropSyst.
In SA, the majority (59%) of the total GHG emissions were from the storage of digestate in the lagoon (Table 3). These emissions were primarily due to CH4, with indirect N2O from ammonia emissions having a small contribution and direct N2O being negligible (Figure 3). Guest et al. (2017) also simulated that emissions from conventional manure storage tanks on a farm in Ontario were high and contributed more than half of the carbon footprint of the farm.
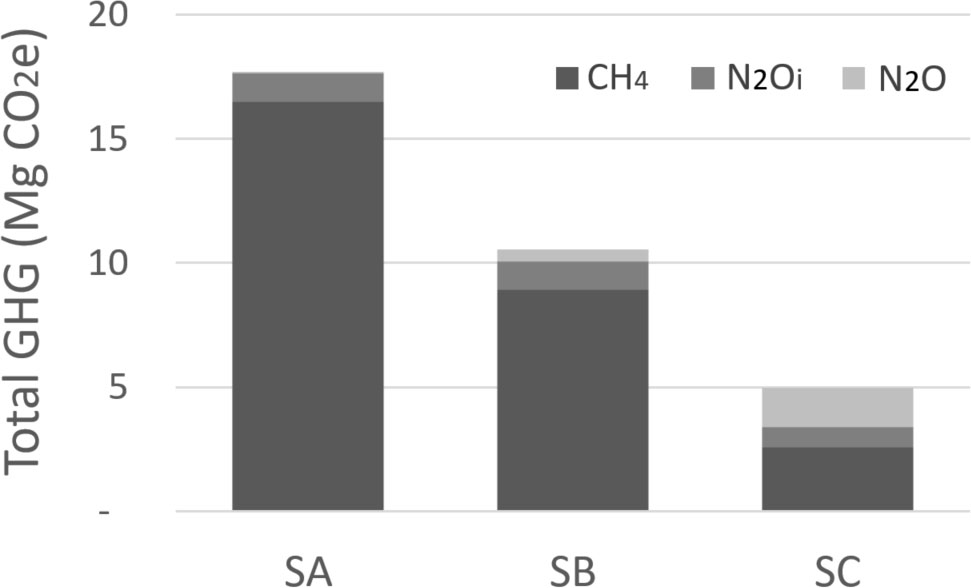
Figure 3 Total GHG emissions from each scenario (excluding barn emissions which are constant). Note that “N2Oi” indicates indirect N2O emissions due to NH3 emissions.
In SB, the addition of SLS led to reduced overall GHG emissions by 24% (including barn emissions), and reduced lagoon emissions by 45%. These reductions were due to less solids (carbon) entering the lagoon resulting in lower CH4 emissions, offset by small increases in emissions from solid storage. Emissions from the solid fraction were mainly direct N2O emissions; however, the contribution of N2O from the solid fraction was small relative to the CH4 emitted from the liquid fraction (Figures 3, 4). Thus, overall liquid and solid manure storage GHG emissions were 42% lower in SB compared to SA (Figure 4).
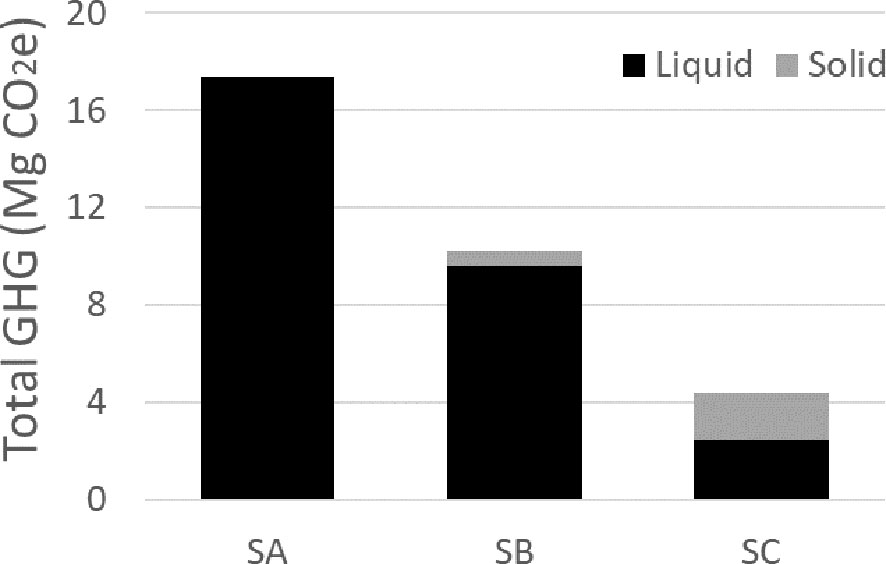
Figure 4 Total GHG emissions from the liquid (storage) and solid (bedding, solid cake) portions in each treatment scenarios.
In SC, the addition of NR technology further reduced overall GHG emissions by 44%, and lagoon emissions by 87%. The simulated CH4 emissions from the lagoon were 83.8 kg/d on average, which is somewhat higher than the observed average of 56 kg/d at the case-study farm (VanderZaag and Baldé, 2022). This difference is reasonable given the differences in feedstocks to the AD, and the higher simulated TS in the liquid tea compared to observed. The simulated CH4 emissions from the lagoon in SC were 75% lower than SB, and 87% lower than SA. Reduced emissions from the liquid fraction were due to much greater carbon and nitrogen content in the solid fraction. This, in-turn, led to higher emissions from the solid fraction. In fact, the solid fraction contributed 44% of the total storage emissions (Figure 4), owing primarily to N2O emissions from the solid cake (Figure 3).
Annual cost of manure transportation and field application for separated liquid and solid fractions in scenario SC was evaluated and compared to transporting unseparated liquid digestate in SA. In the reference transportation scenario, T0, liquid was transported to a nearby 250-ha field through a dragline, and transported 30 km by truck to a 100-ha field to meet the P requirement. Surplus manure in excess of the P requirements of those 300-ha was applied to other fields 30 km-away (Table 4). In this case the total cost of transporting manure for field application was $97,253, due to the relatively high cost of transporting water in the liquid fraction 30 km by truck.
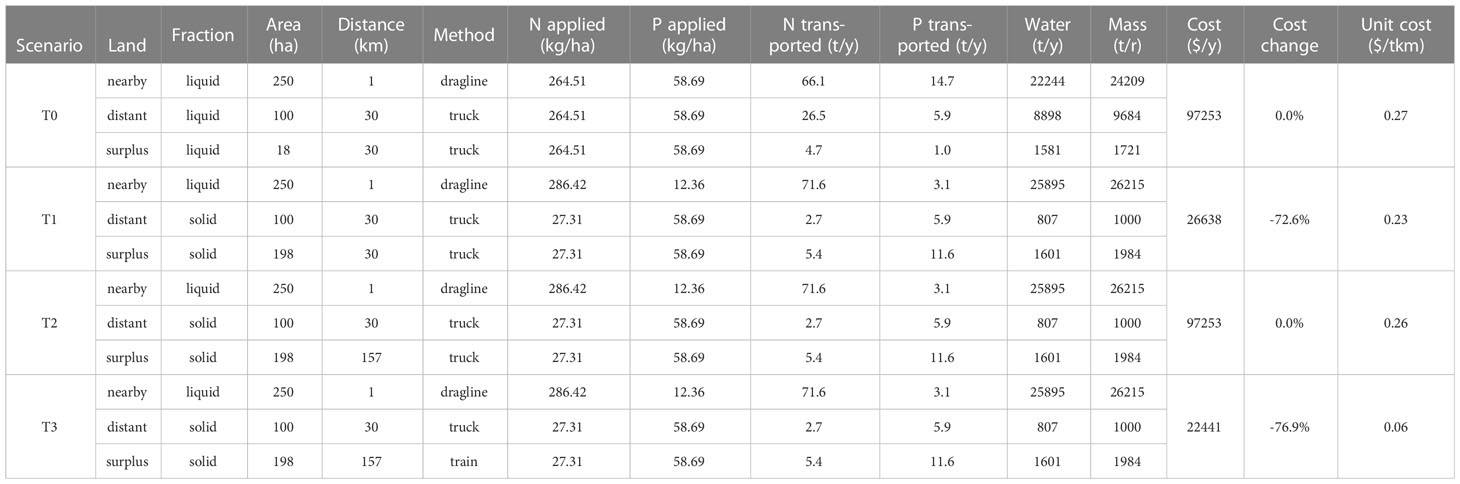
Table 4 Annual cost of reference and four transportation scenarios.
The first transport scenario with separated fractions, T1, the liquid “tea” fraction stored in the lagoon was transported by dragline to the nearby 250 ha field, while the solid “cake” fraction was transported 30 km by truck. The total applied area of T1 was 30 ha greater than T0 to distribute the mass of P in the solid fraction according to P requirements of the soil (Table 4). Nevertheless, despite transporting P to more land, the total transportation cost of T1 dropped more than 72% to $26,638 because the mass of water transported by truck was reduced by 8,071 tonnes compared to T0 (from 10,479 to 2,408). The dramatic cost reduction shows that dewatered solid manure offers a promising opportunity to reduce manure transportation cost by distributing water via dragline rather than by truck.
In the second transportation scenario, T2, the parameters of T1 were kept the same except that the transportation distance for the solid fraction was increased so that the total transportation cost was equal to T0. In this case the solid manure in excess of the requirements for 350 ha was transported by truck to 198 ha of land located over 150 km away.
In the third transportation scenario, T3, the parameters of T2 were kept the same, except that long distance transportation of the excess solid fraction was done by train instead of by truck. Since the transport by rail has a much lower cost than truck, the overall cost in this scenario was more than 75% lower than T0. Further calculation were done to maximize transport distance while maintaining the same transport cost from T0. In this case, the surplus solid fraction could be transported 1,100 km by train for the same overall cost as T0. This illustrates the potential for nutrient recovery to enable transport of manure P out of a manureshed with a high level of manure P, to another agricultural landscape where there is a P deficit (Reid et al., 2019).
Application rates based on N and P generally limit the ability to appropriately distribute digestate or manure without exceeding crop requirements or environmental limits (Feinerman et al., 2004; Carreira et al., 2007; MPCA, 2011; Hanserud et al., 2017). The geographic location of this study – the Fraser Valley, BC – is an intensive agricultural area with a net import of nutrients (mainly in feed, forages, and fertilizer) with a limited amount of land for redistribution due to being constrained by mountains, ocean, and the border. Presently, very little nutrients are recycled back to distant cropland where the imported feed originated. Improving the efficacy of recycling nutrients has been identified as crucial for the reduction of net nutrient imports and sustainability in this area (Franzluebbers et al., 2021; Bittman et al., 2023).
In this study, model simulations showed separation considerably changed the N/P ratio in each fraction. After nutrient recovery, the liquid fraction N/P ratio was reduced in the solid fraction (where P was concentrated) and greatly increased in the liquid. These results were partially consistent to the findings by Hou et al. (2017) who reported that the N/P ratios in liquid fractions with separation treatments were higher than with untreated manure.
At the same time, nutrient recovery resulted in the solid fraction having a much higher concentration of solids and P, with less water. Reduced mass enabled the longer distance of solid fraction. Meanwhile, the higher N/P ratios in liquid fraction can be applied on nearby fields with lower requirements of P fertilizer due to having received manure and digestate for many years. Due to the lower volume of P-rich solid fraction, this material was able to be transported long distances at a lower cost. This is because the majority of the mass of unseparated digestate is in the form of water. After separation, most of the water can be transported to the local field by dragline, which is the most efficient and economical transport method. The use of trucks is then more efficient because less money is used to transport water. For example, transporting the mass of digestate produced in a single day would require five trips for a tanker truck with a 20-tonne capacity. In contrast, after separation and nutrient recovery, the mass of solid cake produced can be transported by a single 20-tonne dump truck taking one load every-other-day. Not surprisingly, therefore, annual transport costs were reduced by more than 90%. Efficient manure dewatering and nutrient recovery technologies show the potential of concentrating the nutrients and reducing the cost of long-distance transport to reduce reliance on mined P in areas farther from livestock. This approach may enable new opportunities for manure trading among different farm types. For example, Franzluebbers et al. (2021) provided an example of using dairy manure solids for fertilizing a newly planted high-bush blueberry field.
Emissions of CH4 from the liquid storage were reduced by half through simple separation with SLS (SB) relative to the baseline (SA). In SB, emissions of N2O were increased; however, this had little impact on the overall GHG emissions from manure management which were reduced by 42% relative to SA. Overall farm GHG emissions were reduced 25% in SB relative to SA. This closely agrees with previous analyses where a 24% reduction in total farm GHG emissions were estimated from a dairy farm with a screwpress separator and composter (Guest et al., 2017), and 25 to 31% for AD and SLS (Holly et al., 2017).
Further treatment with nutrient recovery (SC) resulted in greater CH4 emission reductions from liquid storage, being 87% less than SA. Transferring C and N to the solid cake, however, resulted in much greater N2O and NH3 emissions compared to the baseline condition in SA. Nitrous oxide emitted from solid cake storage in SC were high, which is consistent with previous studies comparing N2O emissions from solid and liquid storage (Pattey et al., 2005; Fangueiro et al., 2008; Petersen et al., 2013). Nevertheless, after considering the global warming potential of each gas, the reduction of CH4 emissions outweighed the increase in N2O and NH3 because CH4 was the main contributor to emissions. Therefore, the overall effect of the nutrient recovery system was beneficial, reducing the total GHG emissions from manure storage. This is an important finding as the potential for pollution-swapping is always a concern in agricultural emission mitigation. Therefore, although N2O emissions from the solid fraction were small compared to the original CH4 emissions that were reduced, there is potential to further improve the GHG balance of nutrient recovery systems by developing technologies or techniques to reduce N2O and NH3 emissions from the solid fraction.
Methane produced by the AD was estimated to be 980 kg/d (1485 m3/d). This is a conservative estimate because the AD was using only manure as feedstock. Like most on-farm AD systems in Canada, the AD at the case-study farm produces ca. 3-times more methane (150-250 m3/h) due to the use of high-yielding co-feedstocks from other sectors (e.g. fats, oils, grease, food waste). This methane is injected on a natural gas pipeline and displaces fossil fuels. Displaced emissions adds GHG benefit that were not considered in the present analysis.
The Dairy-CropSyst model used to simulate the treatment scenarios is a user-friendly tool to assist in decision making of dairy farm nutrient management. However, it was unable to include off-farm streams, customize the treatment process, or easily modify site specific factors such as the recovery rates of N-P-K nutrients. We suggest the model be expanded to include off-farm organic matter addition, enable the use of more site and treatment specified parameters and add more flexibility for simulating mass flow of nutrients and GHG emissions for different technologies.
Although, manure management technologies can be efficient to decrease the transportation cost for redistributing manure P to distant land, the capital cost, maintenance, and operation cost have not been considered in this study. The nutrient recovery system implemented on the case-study farm cost in the range of $650,000 in 2015 and roughly $5,000 per month for operation and purchase of polymer. Meanwhile, this manure treatment system produced valuable bedding materials and greatly reduced manure transport costs, and reduced fossil fuel emissions from trucking liquid manure. Energy produced from AD can replace heat and electricity generated by fossil fuels and therefore reduce CO2 emissions from fossil energy. Economic analysis of cost and revenue, and returns on investment is an area for further research. With greater research, there may be opportunities to reduce costs for this type of nutrient recovery system, or to develop other technologies to achieve similar results.
Distribution of manure nutrients N-P-K could also be economically beneficial provided it is used to substitute chemical fertilizers. Moreover, there is value in viewing P recycling as the recovery and careful use of a precious essential nutrient rather than a waste to manage. It is important to recognize the greater resilience through circular re-use of P and the need to balance net P imports within intensive agricultural regions like the Fraser Valley (Bittman et al., 2017). At a broader scale, effective re-use of P is important for Canada which is completely reliant on import of non-renewable rock P (Nicksy and Entz, 2021). Alternative transportation methods such as pipeline, barge, and other innovative hauling plans may be beneficial for specific regions and should be evaluated for the possibility of manure nutrients redistribution.
Scenario analyses demonstrated that combined manure management technologies can substantially reduce total GHG emissions during manure processing and storage. Using SLS alone reduced liquid storage emissions by 45%, while the combination of SLS and NR partitioned most of the carbon to the solid fraction and reduced CH4 emissions from the lagoon by 87%. There was a modest trade-off with higher emissions of N2O from the solid fraction, the mitigation of which could be an area for further study. With these technologies most of the water in digestate was kept in the liquid fraction and could be applied by dragline, thus reducing the cost associated with long-distance hauling of water. As a result it was economical to transport the P-rich solid fraction long-distance to redistribute nutrients (especially P) from the dairy farm to farther away fields.
The raw data supporting the conclusions of this article will be made available by the authors, without undue reservation.
XF: Formal analysis, data curation, investigation, methodology, software, writing original draft. WS: Funding acquisition, methodology, resources, conceptualization, revision. AV: Conceptualization, funding acquisition (lead), investigation, visualization, resources, supervision, validation, revision. All authors contributed to the article and approved the submitted version.
The study was funded by Agriculture and Agri-Food Canada, with contributions from FortisBC, through the Bioproducts Cluster as part of the Agri-Science Clusters Initiative (Project ASC-03-2A). As per the research agreement, aside from providing financial support, the funders have no role in the design and conduct of the studies, data collection, and analysis or interpretation of the data. Researchers maintain independence in conducting their studies, own their data, and report the outcomes regardless of the results. The decision to publish the findings rests solely with the researchers.
The authors declare that the research was conducted in the absence of any commercial or financial relationships that could be construed as a potential conflict of interest.
All claims expressed in this article are solely those of the authors and do not necessarily represent those of their affiliated organizations, or those of the publisher, the editors and the reviewers. Any product that may be evaluated in this article, or claim that may be made by its manufacturer, is not guaranteed or endorsed by the publisher.
Aguirre-Villegas H., Larson R., Sharara M. (2019). Anaerobic digestion, solid-liquid separation, and drying of dairy manure: measuring constituents and modeling emission. Sci. Total Environ. 696, 134059. doi: 10.1016/j.scitotenv.2019.134059
Amon B., Kryvoruchko V., Amon T., Zechmeister-Boltenstern S. (2006). Methane, nitrous oxide and ammonia emissions during storage and after application of dairy cattle slurry and influence of slurry treatment. Agricult. Ecosyst. Environ. 112 (2-3), 153–162. doi: 10.1016/j.agee.2005.08.030
Battini F., Agostini A., Boulamanti A. K., Giuntoli J., Amaducci S. (2014). Mitigating the environmental impacts of milk production via anaerobic digestion of manure: case study of a dairy farm in the po valley. Sci. Total Environ. 481, 196–208. doi: 10.1016/j.scitotenv.2014.02.038
Bittman S., Sheppard S. C., Poon D., Hunt D. E. (2017). Phosphorus flows in a peri-urban region with intensive production: a case study. J. Environ. Manage. 187, 286–297. doi: 10.1016/j.jenvman.2016.11.040
Bittman S., Worth D., Hunt D., Spiegal S., Kleinman P., Nanayakkara S., et al. (2023). Distribution of livestock sectors in Canada: implications for manureshed management. J. Environ. Qual. Press 52, 596–609. doi: 10.1002/jeq2.20457
Camilleri-Rumbau M., Briceño K., Søtoft L., Christensen K., Roda-Serrat M., Errico M., et al. (2021). Treatment of manure and digestate liquid fractions using membranes: opportunities and challenges. Int. J. Environ. Res. Public Health 18 (6), 3107. doi: 10.3390/ijerph18063107
Camilleri-Rumbau M., Popovic O., Briceño K., Errico M., Søtoft L., Christensen K., et al. (2019). Ultrafiltration of separated digestate by tubular membranes: influence of feed pretreatment on hydraulic performance and heavy metals removal. J. Environ. Manage. 250, 109404. doi: 10.1016/j.jenvman.2019.109404
Carreira R. I., Young K. B., Goodwin H. L. Jr., Wailes E. J. (2007). How far can poultry litter go? a new technology for litter transport. J. Agric. Appl. Economics 39 (1379-2016-112660), 611–623. doi: 10.1017/S1074070800023300
Chadwick D., Sommer S., Thorman R., Fangueiro D., Cardenas L., Amon B., et al. (2011). Manure management: implications for greenhouse gas emissions. Anim. Feed Sci. Technol. 166, 514–531. doi: 10.1016/j.anifeedsci.2011.04.036
Clemens J., Trimborn M., Weiland P., Amon B. (2006). Mitigation of greenhouse gas emissions by anaerobic digestion of cattle slurry. Agricult. Ecosyst. Environ. 112 (2-3), 171–177. doi: 10.1016/j.agee.2005.08.016
Desmidt E., Ghyselbrecht K., Zhang Y., Pinoy L., van der Bruggen B., Verstraete W., et al. (2015). Global phosphorus scarcity and full-scale p-recovery techniques: a review. Crit. Rev. Environ. Sci. Technol. 45 (4), 336–384. doi: 10.1080/10643389.2013.866531
Fangueiro D., Coutinho J., Chadwick D., Moreira N., Trindade H. (2008). Effect of cattle slurry separation on greenhouse gas and ammonia emissions during storage. J. Environ. Qual. 37 (6), 2322–2331. doi: 10.2134/jeq2007.0330
Feinerman E., Bosch D. J., Pease J. W. (2004). Manure applications and nutrient standards. Am. J. Agric. Economics 86 (1), 14–25. doi: 10.1111/j.0092-5853.2004.00559.x
Fillingham M., VanderZaag A., Burtt S., Baldé H., Ngwabie N., Smith W., et al. (2017). Greenhouse gas and ammonia emissions from production of compost bedding on a dairy farm. Waste Manage. 70, 45–52. doi: 10.1016/j.wasman.2017.09.013
Fleming R. A., Babcock B., Wang E. (1998). Resource or waste? the economics of swine manure storage and management. Appl. Economic Perspect. Policy 20 (1), 96–113. doi: 10.2307/1349536
Franzluebbers A., Hunt D., Telford G., Bittman S., Ketterings Q. (2021). Integrated crop-livestock systems: lessons from new York, British Columbia, and the south-Eastern united states. Front. Agr. Sci. Eng. 8, 81. doi: 10.15302/J-FASE-2020365
Guest G., Smith W., Grant B., VanderZaag A., Desjardins R., McConkey B. (2017). A comparative life cycle assessment highlighting the trade-offs of a liquid manure separator-composter in a Canadian dairy farm system. J. Cleaner Prod. 143, 824–835. doi: 10.1016/j.jclepro.2016.12.041
Hanserud O. S., Lyng K. A., Vries J. W. D., Øgaard A. F., Brattebø H. (2017). Redistributing phosphorus in animal manure from a livestock-intensive region to an arable region: exploration of environmental consequences. Sustainability 9 (4), 595. doi: 10.3390/su9040595
Holly M. A., Larson R. A., Powell J. M., Ruark M. D., Aguirre-Villegas H. (2017). Greenhouse gas and ammonia emissions from digested and separated dairy manure during storage and after land application. Agricult. Ecosyst. Environ. 239, 410–419. doi: 10.1016/j.agee.2017.02.007
Hou Y., Velthof G. L., Lesschen J. P., Staritsky I. G., Oenema O. (2017). Nutrient recovery and emissions of ammonia, nitrous oxide, and methane from animal manure in Europe: effects of manure treatment technologies. Environ. Sci. Technol. 51 (1), 375–383. doi: 10.1021/acs.est.6b04524
IPCC (2019). Refinement to the 2006 IPCC guidelines for national greenhouse gas inventories (Geneva, Switzerland: IPCC).
Jayasundara S., Appuhamy J. A. D., Kebreab E., Wagner-Riddle C. (2016). Methane and nitrous oxide emissions from Canadian dairy farms and mitigation options: an updated review. Can. J. Anim. Sci. 96 (3), 306–331. doi: 10.1139/cjas-2015-0111
Kebreab E., Clark K., Wagner-Riddle C., France J. (2006). Methane and nitrous oxide emissions from Canadian animal agriculture: a review. Can. J. Anim. Sci. 86 (2), 135–157. doi: 10.4141/A05-010
Khalil T. M., Stöckle C. O., Carlson B. R., Uslar-Valle N., Nelson R. L., Frear C. S., et al. (2019). Dairy-CropSyst: gaseous emissions and nutrient fate modeling tool. Comput. Electron. Agric. 162, 962–978. doi: 10.1016/j.compag.2019.05.039
Kowalenko C. G., Bittman S. (2000). Within-season grass yield and nitrogen uptake, and soil nitrogen as affected by nitrogen applied at various rates and distributions in a high rainfall environment. Can. J. Plant Sci. 80, 287–301. doi: 10.4141/P98-139
Li Y., Han Y., Zhang Y., Luo W., Li G. (2020). Anaerobic digestion of different agricultural wastes: a techno-economic assessment. Biores. Technol. 315, 123836. doi: 10.1016/j.biortech.2020.123836
Mahmudi H., Flynn P. C. (2006). “Rail vs truck transport of biomass,” in Twenty-seventh symposium on biotechnology for fuels and chemicals. Applied Biochemistry and Biotechnology. doi: 10.1385/abab:129:1:88
MPCA (Minnesota Pollution Control Agency) (2011) Land application of manure: minimum state requirements. Available at: https://www.pca.state.mn.us/sites/default/files/wq-f8-11.pdf.
Nicksy J., Entz M. H. (2021). Recycled nutrients as a phosphorus source for Canadian organic agriculture: a perspective. Can. J. Soil. Sci. 101, 571–580. doi: 10.1139/cjss-2021-0014
Pattey E., Trzcinski M. K., Desjardins R. L. (2005). Quantifying the reduction of greenhouse gas emissions as a resultof composting dairy and beef cattle manure. Nutrient Cycling Agroecosystems 72 (2), 173–187. doi: 10.1007/s10705-005-1268-5
Petersen S. O., Blanchard M., Chadwick D., Del Prado A., Edouard N., Mosquera J., et al. (2013). Manure management for greenhouse gas mitigation. Animal 7, 266–282. doi: 10.1017/S1751731113000736
Porterfield K. K., Faulkner J., Roy E. D (2020). Nutrient recovery from anaerobically digested dairy manure using dissolved air flotation (DAF). ACS Sustain. Chem. Eng. 8 (4), 1964–1970.
Reid K., Schneider K., Joosse P. (2019). Addressing imbalances in phosphorus accumulation in Canadian agricultural soils. J. Environ. Qual. 48 (5), 1156–1166. doi: 10.2134/jeq2019.05.0205
Reijs J. W., Sonneveld M. P., Sørensen P., Schils R. L., Groot J. C., Lantinga E. A. (2007). Effects of different diets on utilization of nitrogen from cattle slurry applied to grassland on a sandy soil in the Netherlands. Agricult. Ecosyst. Environ. 118 (1-4), 65–79. doi: 10.1016/j.agee.2006.04.013
Ribaudo M., Kaplan J. D., Christensen L. A., Gollehon N., Johansson R., Breneman V. E., et al. (2003). Manure management for water quality costs to animal feeding operations of applying manure nutrients to land. USDA-ERS Agric. Economic Rep. 824). doi: 10.2139/ssrn.757884
Sawyer J. E., Mallarino A. P. (2008). Using manure nutrients for crop production (University Extension: Iowa State University).
Sharpley A., Jarvie H., Flaten D., Kleinman P. (2018). Celebrating the 350th anniversary of phosphorus discovery: a conundrum of deficiency and excess. J. Environ. Qual. 47 (4), 774–777. doi: 10.2134/jeq2018.05.0170
Shi L., Simplicio W. S., Wu G., Hu Z., Hu H., Zhan X. (2018). Nutrient recovery from digestate of anaerobic digestion of livestock manure: a review. Curr. pollut. Rep. 4 (2), 74–83. doi: 10.1007/s40726-018-0082-z
Sigurnjak I., Van Poucke R., Vaneeckhaute C., Michels E., Meers E. (2020). “Manure as a resource for energy and nutrients,” in Biorefinery of inorganics: recovering mineral nutrients from biomass and organic waste, Wiley 65–82.
Sobhi M., Guo J., Gaballah M., Li B., Zheng J., Cui X., et al. (2022). Selecting the optimal nutrients recovery application for a biogas slurry based on its characteristics and the local environmental conditions: a critical review. Sci. Total Environ. 814. doi: 10.1016/j.scitotenv.2021.152700
Van der Meer H. G. (2008). Optimising manure management for GHG outcomes. Aust. J. Exp. Agric. 48 (2), 38–45. doi: 10.1071/EA07214
VanderZaag A., Baldé H. (2022). Nutrient recovery abates methane emissions from digestate storage. Biores. Technol. Rep. 18, 101086. doi: 10.1016/j.biteb.2022.101086
Keywords: manure separation, greenhouse gas emissions, liquid manure, nutrient distribution, dairy farm modeling, manure transportation
Citation: Feng X, Smith W and VanderZaag AC (2023) Dairy manure nutrient recovery reduces greenhouse gas emissions and transportation cost in a modeling study. Front. Anim. Sci. 4:1134817. doi: 10.3389/fanim.2023.1134817
Received: 30 December 2022; Accepted: 06 June 2023;
Published: 28 June 2023.
Edited by:
Stephanie A. Terry, Agriculture and Agri-Food Canada (AAFC), CanadaReviewed by:
Mohamed S. Gaballah, China Agricultural University, ChinaCopyright © 2023 Feng, Smith and VanderZaag. This is an open-access article distributed under the terms of the Creative Commons Attribution License (CC BY). The use, distribution or reproduction in other forums is permitted, provided the original author(s) and the copyright owner(s) are credited and that the original publication in this journal is cited, in accordance with accepted academic practice. No use, distribution or reproduction is permitted which does not comply with these terms.
*Correspondence: Xiaoyu Feng, eGlhb3l1LmZlbmcuMUBuZHN1LmVkdQ==; Andrew C. VanderZaag, YW5kcmV3LnZhbmRlcnphYWdAYWdyLmdjLmNh
Disclaimer: All claims expressed in this article are solely those of the authors and do not necessarily represent those of their affiliated organizations, or those of the publisher, the editors and the reviewers. Any product that may be evaluated in this article or claim that may be made by its manufacturer is not guaranteed or endorsed by the publisher.
Research integrity at Frontiers
Learn more about the work of our research integrity team to safeguard the quality of each article we publish.