 Staci McGill
 Robert Coleman2†
 Kimberly Tumlin
 Morgan Hayes
- 1Department of Biosystems and Agricultural Engineering, University of Kentucky, Lexington, KY, United States
- 2Department of Animal and Food Science, University of Kentucky, Lexington, KY, United States
- 3Center for Innovation in Population Health, Department of Athletic Training and Clinical Nutrition, University of Kentucky, Lexington, KY, United States
- 4Department of Statistics, Applied Statistics Laboratory, University of Kentucky, Lexington, KY, United States
Equine indoor arenas are unique infrastructure investments found at equine farms and facilities. Environmental concerns within these facilities (temperature, respirable dust, moisture, and air movement) have been identified through surveys and small research studies. Thirty-seven indoor arenas at equine facilities within 160 km (100 miles) of Lexington, KY, were visited from August 2018 to August 2021. Semi-structured interviews were conducted to gather more information regarding the environment within the indoor arena and information about the equine facility. Site assessments were also conducted and temperatures (footing or ground level, air at 1.37 m above the footing, and roof), air speeds at 1.37 m above the footing, and light levels at 1.37 m above the footing across the indoor arena spaces were measured, in addition to the total number of horses at the facilities and daily average and maximum use of the indoor arenas. Spatial mapping was conducted using ArcMap 10.7 (Esri; Redlands, California), with kriging being used for the interpolation. The created maps were used to determine the variability of the temperatures, air speed, and lighting within the indoor arenas. These variabilities were examined for the statistical significance for variables of the indoor arenas that were determined by structural and design aspects and for facility usage information gathered from the semi-structured interviews. The variables that were statistically significant were roof ventilation for roof temperature variability, roof insulation for footing temperature variability, building enclosure for lighting variability, total number of horses at the facility for lighting variability, and total daily number of horses in the indoor arena for the ambient air temperature variability. One of the most significant results was the lack of air movement observed in the majority of the indoor arenas. Over 80% of the indoor arenas were experiencing still air speed conditions (< 0.51 m/s) during the site assessment. There is a need for more research on the environmental conditions within indoor arenas, the potential health impacts to the humans and horses in the spaces, and how design changes to the facilities could improve these environments.
Introduction
Equine indoor arenas provide locations for horses to be worked or trained and are found on equine farms that have made a significant investment in infrastructure (Wheeler et al., 2005; McGill et al., 2021). Though the definition of an indoor arena varies among the regions of the United States, the consensus is that indoor arenas are facilities that possesses four walls and a roof (McGill et al., 2021). While there are some research-based publications that mention design considerations for indoor arenas, in general the design recommendations tend to focus on barns and stables. Two publications that discuss indoor arenas, Horse Handling Facilities and Horse Facilities Handbook, provide cursory recommendations about dimensions and construction materials and suggest using the same principles used to build outdoor arenas (Kidd et al., 1997; Wheeler et al., 2005). The limitations of this reliable, research-driven information regarding recommendations and considerations when designing and building indoor arenas are exacerbated by a gap in knowledge regarding the interior environments in indoor arenas. Environmental concerns identified within these facilities are humidity, dust, temperature, and air movement. There is a need for a greater understanding of the environment within indoor arenas (Wheeler et al., 2003; Bulfin et al., 2019; McGill et al., 2021). Self-reported health data have indicated that instructors working within indoor arenas have more respiratory issues than instructors who smoke (Elfman et al., 2009). It was surmised that the reported health issues could be linked to the environmental conditions in indoor arenas, but more work is needed to understand whether a link truly exists.
Spatial analysis has been integral for the development of precision agriculture in crop systems (Bregt, 1998). Similarly, to better understand environmental conditions within animal agriculture facilities and other large spaces, precision livestock farming research has been conducted to examine the variability across animal spaces. In these instances, spatial variation is determined by collecting data at select points through the space and then displaying the data through the use of ordinary kriging (OK) and other spatial mapping techniques that interpolate the data between the data points to create a picture of the spaces (Diggle et al., 1998). There has been discussion of the effectiveness of OK, inverse distance weighting (IDW), method of moments (MoM), and residual maximum likelihood (REML) for mapping spatial variation data, especially regarding soil sampling (Kerry and Oliver, 2007; Yasrebi et al., 2009). Yasrebi et al. compared OK with IDW for soil chemical testing spatial variation in Iran and determined that OK performed better than IDW (Yasrebi et al., 2009). Kerry and Oliver’s work specifically examined whether MoM or REML performed better with a smaller sample size. Historically, soil sampling has required at least 100 samples to be taken for the MoM method to be effective for analysis, but evidence indicated that the REML method is more effective for smaller sample sizes (Diggle et al., 1998; Kerry and Oliver, 2007).
While spatial variation research has been used in other animal livestock facilities, such as poultry barns, REML kriging methods have not been used to visualize and understand the interior environment within equine indoor arenas (Corkery et al., 2013; Ferraz et al., 2019). The objectives in this paper were to demonstrate how spatial analysis could be used to assess environmental variability and to evaluate the impact of facility and external environmental parameters on the internal environment. One-time site assessments were conducted at private and competition indoor arenas in and around central Kentucky from August 2018 to August 2021. In addition, semi-structured interviews were conducted during the site assessments to collect information about the facilities and the usage of the indoor arenas. The spatial variability within the indoor arenas was examined for relationships with components within the design and usage of the indoor arenas and weather conditions on the day of the site assessments.
Materials and methods
Enrollment
The site visits performed for this study were conducted at 37 equine facilities in and around central Kentucky from August 2018 to August 2021, with visits occurring throughout the year. Initially, over 100 equine facilities were identified through Cooperative Extension contacts as having indoor arenas, but 37 were selected based on a willingness to engage with the research team. In addition, the 37 facilities were selected because of an intentionality toward including a balanced and diverse set of equestrian disciplines and indoor arena design characteristics. For the purpose of this study, indoor arenas were any facility that had a roof, though most of the facilities had at least a half wall on all four sides. The indoor arenas assessed were related to a variety of equestrian disciplines common to Kentucky. In accordance with IRB protocol (#43857), the facilities were assigned random identifying numbers that only IRB-approved members of the research team had the ability to access. Each facility was required to sign an informed consent form that detailed all the information for the study and outlined that participating in the study presented a minimal risk to the facility as analyses would be performed on the aggregate data and not the individual facilities. The stipulations of the IRB also restricted the ability to use and publish pictures and identifying information.
Site assessments—space and structure
Structural information about the indoor arenas was recorded during the site assessments. This information included the orientation of the structures, presence and type of roof ventilation, the presence of roof insulation, the presence of wall insulation, and the presence and location (roof or wall) of translucent/light-transmitting panels. In the context of this study, the roof was the interior surface of the indoor arena. For most of the facilities, this was the underside of the roofing panels, although in a couple of arenas a ceiling was present and roof temperature and insulation were more precisely ceiling temperature and insulation. In addition, conditions impacting the interior environment of the indoor arenas were also noted. These included whether the facility was climate controlled, how enclosed the building was on the day of assessment, cloud cover during the assessment, amount of artificial lighting in use, and presence and use of fans. The structural information collected was designated as variables and divided into categories (e.g., roof insulation: insulated or not insulated).
The categories that the structural variables were divided into are displayed in Tables 1–3 . Roof ventilation was classified as no ventilation, capped ridge vents, and cupolas. The presence of both roof and wall insulation was simplified to present or not present. Translucent panels were classified by location and presence: top of the wall or roof or none present. The type of climate control used in the facilities was site specific as some facilities were only heated, while larger showing facilities were also air conditioned. All climate-controlled facilities were visited during winter/heating months or when no climate control was being used.
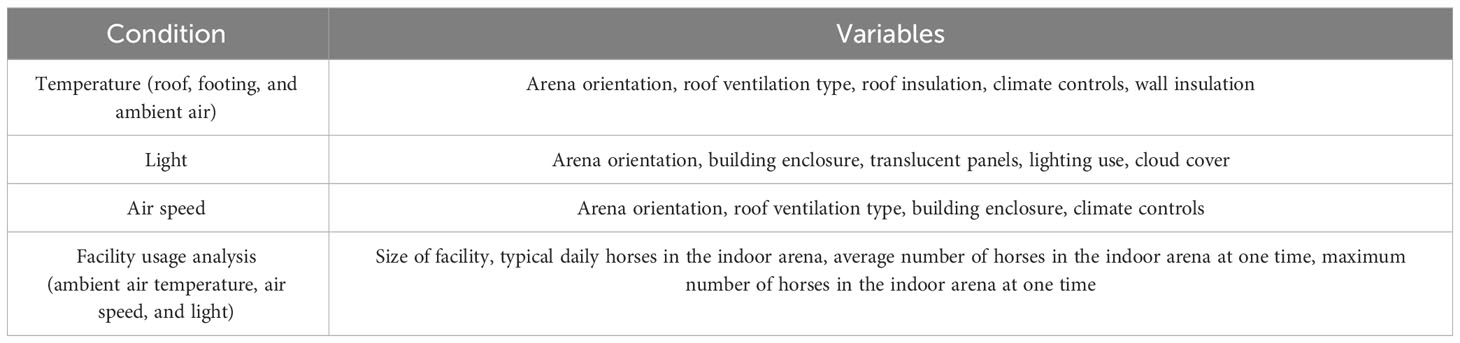
Table 1 The variables for each of the conditions analyzed.
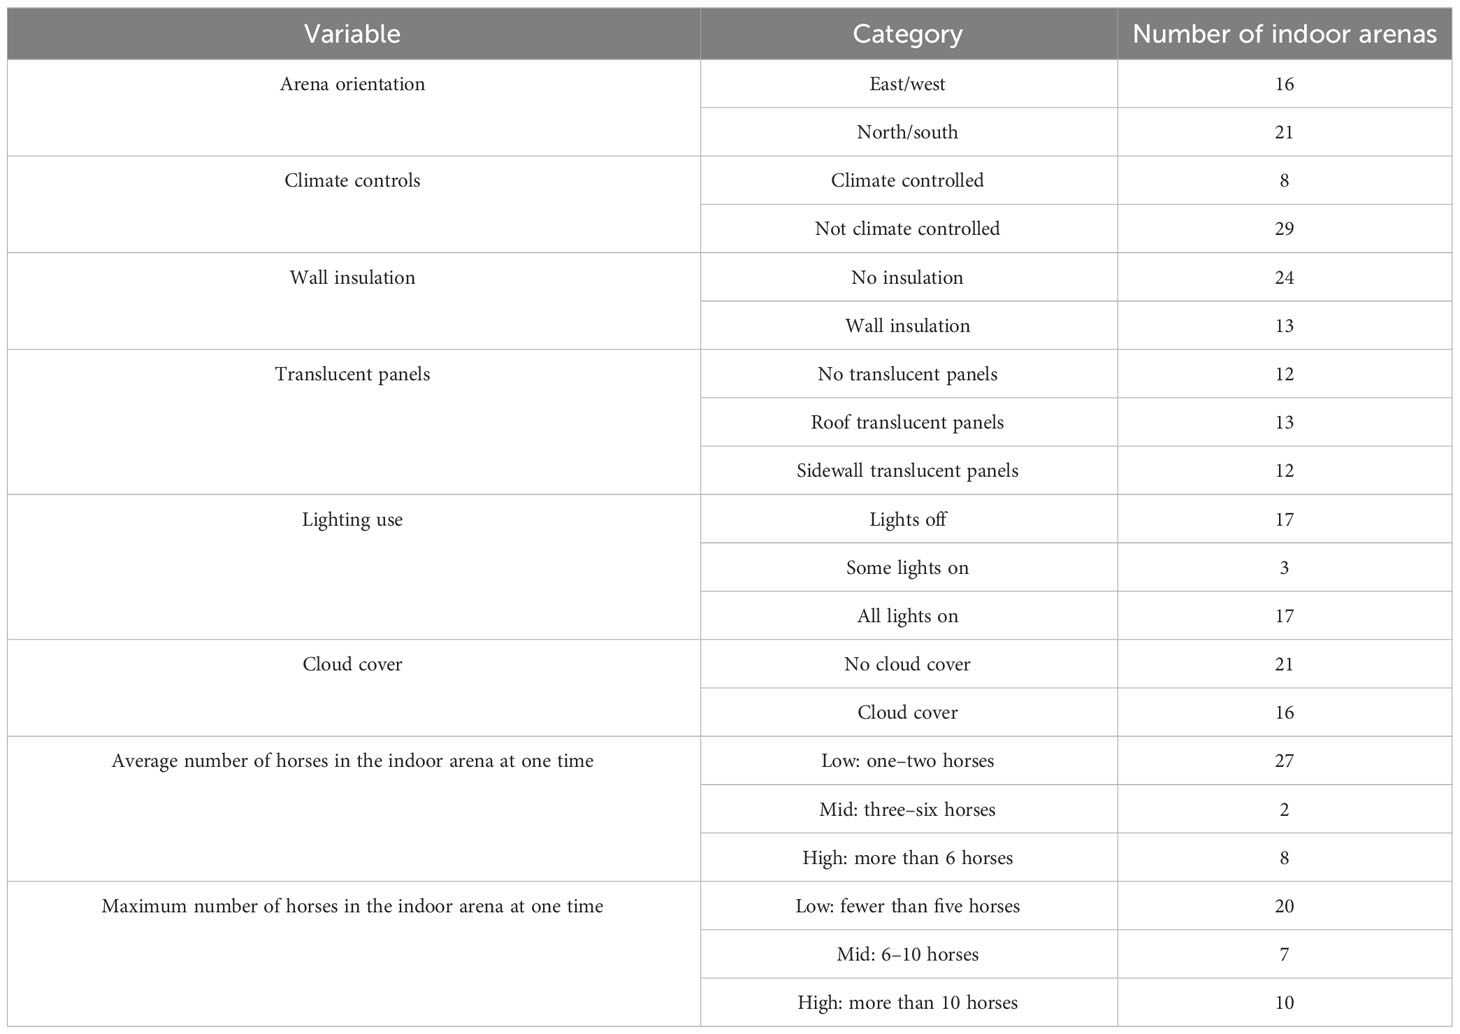
Table 2 The variables and their categories for the non-statistically significant variables.
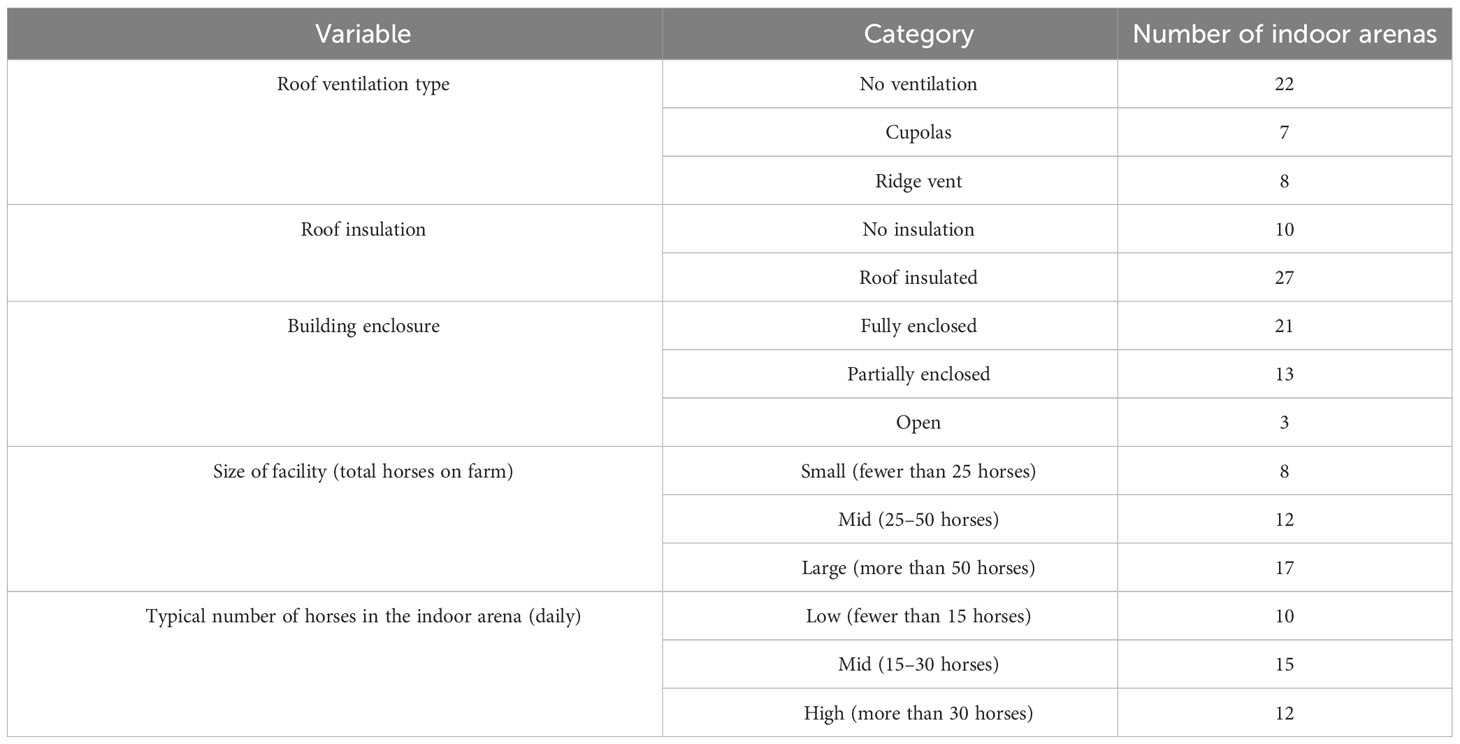
Table 3 Number of facilities for the variables for the conditions with statistically significant variability differences.
The study was truly observational as the research team made no requests to the farms in how they operated the arena while the team was present. Indoor arenas were examined as they were being used on the day of the assessment, and no changes to the building environment were made for the research to be conducted. The team did not open or close any opening nor did they change the status of any mechanical equipment. The building enclosure was labeled as open if the walls were not complete (half walls or larger openings) or non-existent walls; partially enclosed facilities were identified if windows and/or doors were open to the outside at the time of the assessment, while enclosed had one or no direct opening to the outside. Cloud cover was designated as no cloud cover and cloud cover; if it was at least a mostly sunny day, no cloud cover was the assigned distinction. Artificial lighting was identified as no lights on, some lights on, or all lights on. The "some light on" designation was applied to any facility that had only a portion of the lights on. Tables 1–3 provide the number of indoor arenas for each condition, variable, and category.
Site visits included collecting spatial data within the indoor arena regarding temperature of the air, roof, and footing surfaces, relative humidity, light intensity, and air speed. Footing is the surface the horses move over on the ground in the indoor arena. The roof temperature is the temperature of the interior of the roof or ceiling in the indoor arena. All the measurements were taken once in a grid at 15 different locations around the footprint of the footing in the indoor arena (Figure 1). The research team was limited to those individuals on the IRB, and every effort was made to ensure the same research team member operated the same device at each facility. All data collection devices were allowed approximately 5 min to stabilize to the new location, and every effort was made to avoid gust air speed measurements. The grid was sized to fit the individual arena with the three data collection locations oriented on the short axis and the five data collection locations oriented on the long axis. The center data points were located in the center and the outer data points on the rail or edge of the footing area, although the actual distance between the data collection points was different depending on the overall size of the facility to ensure the entire footing area was assessed. The instruments used to take each of the measurements are listed in Table 4. Values for air temperature, air speed, and light intensity were acquired at 1.37 m above the footing as this would represent the environment at the level of someone standing in the indoor arena (Lena et al., 2011; Raymond and Clarke, 2023). Footing depth and samples were taken on a different grid pattern than the other samples, but those data are beyond the scope of this publication. In situ footing moisture content is difficult to accurately determine and was excluded from the data collected during the site assessments.
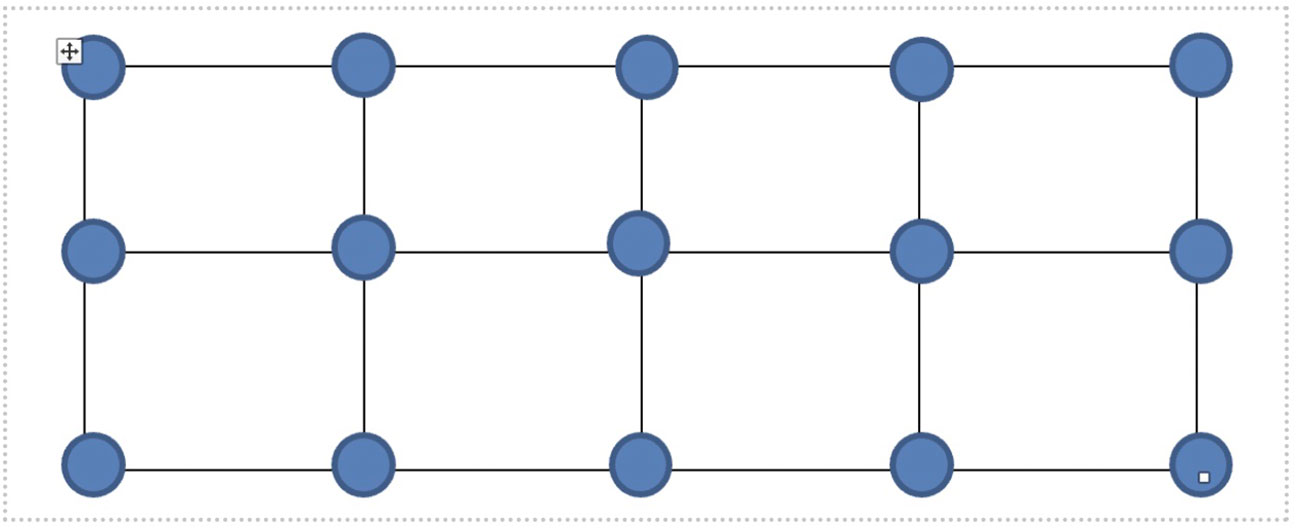
Figure 1 The grid layout used to collect the temperature (roof, footing, and ambient air), air speed, and light data during the indoor arena assessments. The 3 data collection points were oriented on the short axis of the indoor arena and the 5 data collection points were oriented on the long axis. The spacing between points was adjusted so outer ring of data collection locations were along the rail or edge of the footing area. In addition, the center data collection locations were placed along the short and long center line.
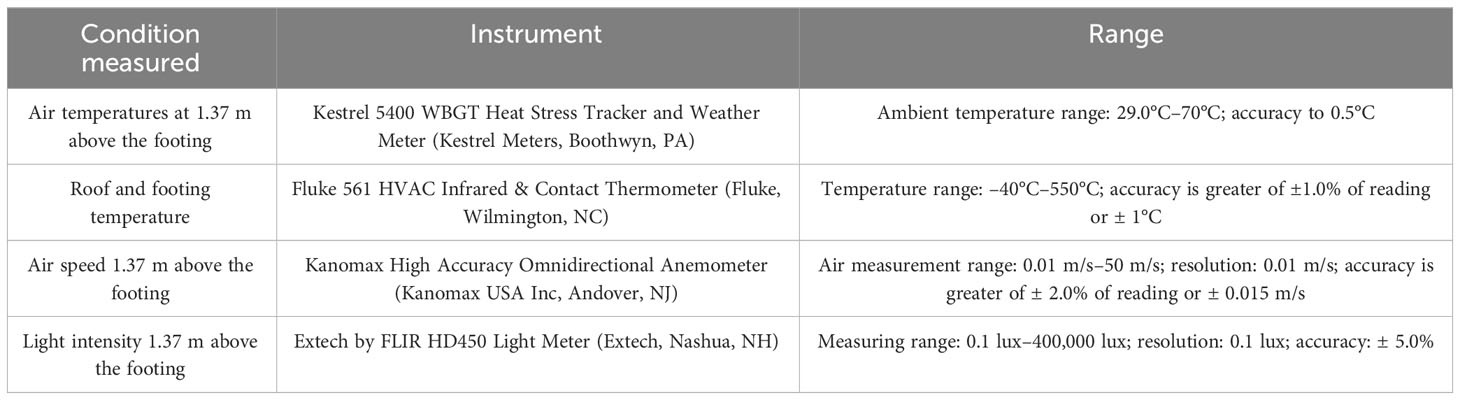
Table 4 Instruments used for each type of measurement.
In order to minimize interference with the operation of the facilities assessed, researchers examined the indoor arenas as they were on the day of the visit. No changes were made to the environment or management of the indoor arena, so if climate control mechanisms were operational during the visit, it was noted in the data collection but not changed. At the behest of the equine facilities, every effort was made to schedule characterization visits when horses were not working in the facilities, which negated the ability to gather dust concentrations or the direct effect of the horses moving air in the space. In the indoor arenas where horses were working, data collection was paused while horses were in the vicinity to limit stress on the horses and distraction of the horses and riders.
Site assessment—semi-structured interviews
In addition to the spatial data collection, interviews were conducted with either the head horse trainer or the owner/manager of the facility. All interviews were conducted by the same member of the research team. Those interviewed were asked questions regarding the age of the arena, any updates that had been completed, general information about the facility such as number of horses on site, how many horses were worked in the arena, the arena maintenance protocol, concerns/challenges regarding the arena environment, and whether any health impacts had been noticed in the people or horses, as well as any information they felt was important for the research team to know. Questions regarding the analysis for this article were as follows:
● What is the total number of horses on site including working and non-working horses?
● What is the maximum number of horses in the indoor arena at one time?
● What is the average number of horses in the indoor arena at one time?
● What is the typical number of horses worked in the arena each day?
All four variables from the semi-structured interview questions were classified as facility usage and were divided into three different categories. They can be found in Tables 1, 2, 3 and described here. The total number of horses on site was divided into low (fewer than 25 horses), mid (25–50 horses), and large (more than 50 horses). The maximum number of horses in the indoor arena at one time was divided into low (fewer than 5 horses), mid (6–10 horses), and high (more than 10 horses). The average number of horses in the indoor arena at one time was divided into low (1–2 horses), mid (3–6 horses), and high (more than 6 horses). Finally, the typical number of horses worked in the arena each day was divided into low (fewer than 15 horses), mid (15–30 horses), and high (over 30 horses). The number of facilities that were in each category can be found in Tables 2, 3.
The analysis conducted with the semi-structured interview questions was not a reflection of the activity in the indoor arena at the time of data collection but an attempt to understand how these characteristics may have impacted aspects related to the design and management of the indoor arena. The data sheet for the collection of information during the one-time site characterization has been provided as Supplemental Material. Answers to the entire interview were documented as were all building characteristics and management information.
Spatial and statistical analyses
Statistical analysis focused on the variance and not the recorded values as seasonal differences in measurements occurred between the assessments of the different indoor arenas. Therefore, raw datasets were loaded into ArcMap 10.7.1 (Esri Redlands, California), and kriging was used to interpolate the values between the points. The “get raster properties” tool in ArcMap was used to acquire the standard deviation/variance of the interpolated raster map for each indoor arena. Due to the large range of values within some of the indoor arenas, the raw data for the air speeds and lighting values were logarithmically transformed prior to conducting kriging. The roof and footing surface temperature variances underwent a square root transformation, while the air temperature variances were logarithmically transformed to ensure a normal distribution of values for statistical analysis. Variables for each of the measured conditions were determined based on arena design characteristics and facility usage as well as weather conditions on the day of the assessment and were defined as follows:
● Temperature (roof, footing, and ambient air)—arena orientation, roof ventilation type, roof insulation, climate controls, and wall insulation.
● Light—arena orientation, building enclosure, translucent panels, lighting use, and cloud cover.
● Air speeds—arena orientation, roof ventilation type, building enclosure, and climate control.
● Facility usage analysis—size of facility, typical number of horses in the indoor arena (daily), average number of horses in the indoor arena at one time, and maximum number of horses in the indoor arena at one time.
Multivariate normality was assessed and verified for the variabilities of the ambient air temperature, roofing temperature, footing temperature, light distribution, and air speed data. A multivariate analysis of variance (MANOVA) was performed to compare the means of the standard deviations from the arenas and whether there were any interactions between the variables for the different conditions. If significance for a variable was determined, an analysis of variance (ANOVA) was performed to determine for which conditions the variable was significant. In addition, interactions between the variables were examined for the different environmental conditions. For example, in the first row of Table 1, a MANOVA examining the impacts of orientation, roof ventilation, roof insulation, climate control, and wall insulation on the variabilities for the roof temperature, ambient air temperature, and footing temperature was conducted. If the p-value was less than 0.15, an ANOVA was conducted for the individual variabilities to identify the variable that was significant. In this instance, roof ventilation and roof insulation were both less than 0.15, and the ANOVAs clarified that the type of roof ventilation was significant for roof temperature variability and the presence of roof insulation was significant for footing temperature variability.
The conditions analyzed were the roof or interior ceiling temperature, the footing surface temperature, the ambient air temperature at 1.37 m (4.5 ft), the air speed at 1.37 m (4.5 ft), the light intensity at 1.37 m (4.5 ft), and facility usage. The variables for each of the conditions are displayed in Table 1. It should be noted that some variables were examined in more than one condition, i.e., arena orientation was examined for the temperature (roofing, footing, and air), the air speeds, and the light intensity. The indoor arena design characteristics were divided into categories for each of the variables. The statistical analysis was conducted using RStudio 2022.07.1. Statistical significance was established when p ≤ 0.15 for the MANOVA and when p ≤ 0.05 for the ANOVAs, and tendency was established when 0.10 > p > 0.05. The non-statistically significant variables are displayed in Table 2, and the variables that were statistically significant are displayed in Table 3.
Results
Statistical analysis results
Components of the indoor arena
Roof ventilation type was associated with roof temperature variability (p = 0.01). The three types of roof ventilation considered were no ventilation, cupolas, and ridge vents with caps. The average variance for the capped ridge vent was the highest at 1.8°C ± 1.2°C (3.2°F ± 2.2°F), followed by the cupola average variance at 1.0°C ± 0.7°C (1.7°F ± 1.2°F), and the lowest variability in roof temperature variance was the no ventilation at 0.6°C ± 0.7°C (1.1°F ± 1.3°F). The presence of roofing insulation significantly impacted the footing surface temperature variances (p = 0.02), with no insulation having the highest variability at 1.1°C ± 0.1°C (1.9°F ± 0.2°F), while the variability with insulation was 0.4°C ± 0.3°C (0.7°F ± 0.5°F). Finally, building enclosure amount was statistically significant for the variability of the lighting across the indoor arena (p < 0.001). The more enclosed the building the lower the variability of the light intensity across the arena, with the average variance for fully enclosed being 0.1 lux ± 0.1 lux, for partially enclosed being 0.18 lux ± 0.13 lux, and for fully open indoor arenas being 0.4 lux ± 0.3 lux. In addition, the interaction between the lights being on in the indoor arena and the cloud cover on the day of facility assessment was a significant interaction (p = 0.008). The mean and standard deviations for the statistically significant structural variables are displayed in Table 5. All other examined variables were not statistically significant.
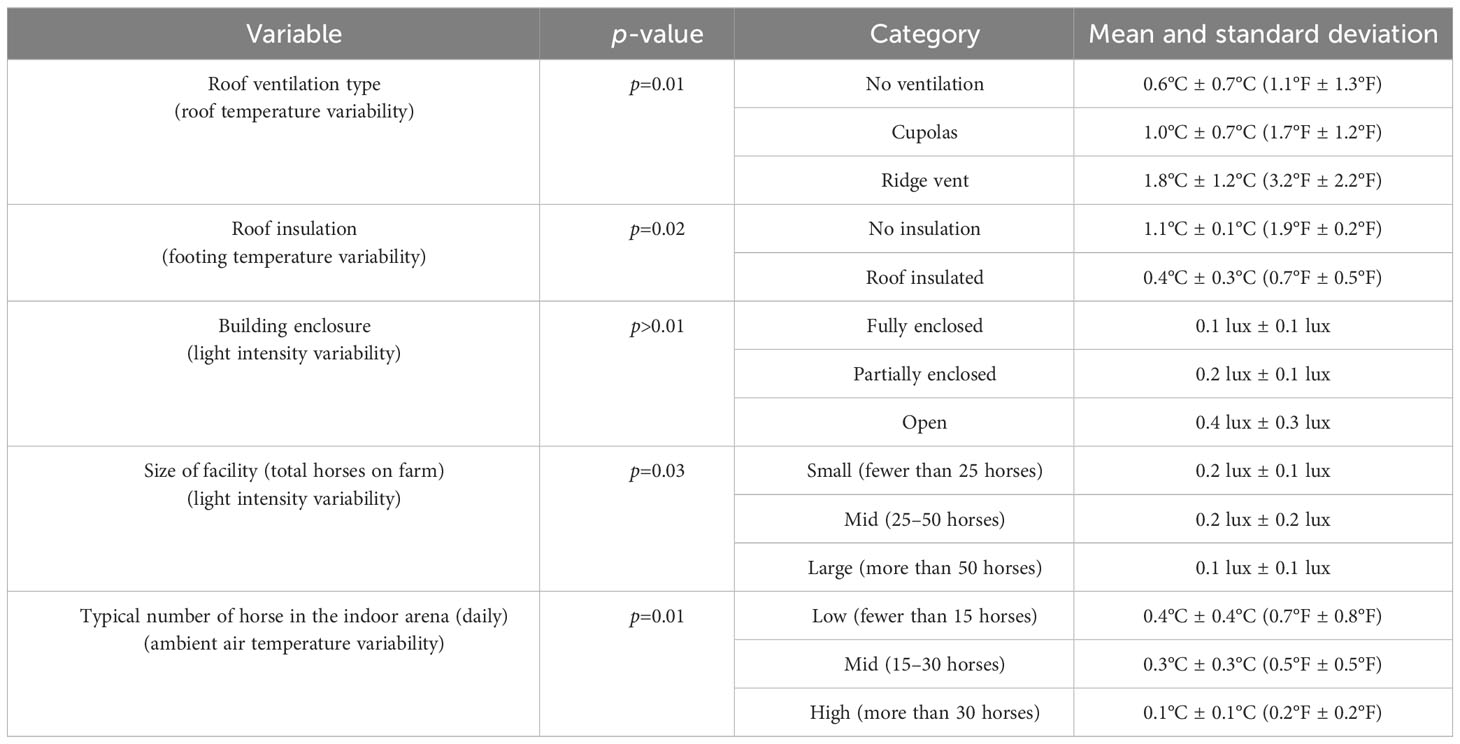
Table 5 Mean and standard deviation for statistically significant results.
Facility usage within the indoor arena
The facility usage analysis focused on the answers to the semi-structured interview questions and the variability of the ambient air temperature, the lighting, and the air movement. The total number of horses on site was statistically significant for the variance of the lighting in the indoor arena (p = 0.03). The average lighting variance was smallest for the facilities with the highest number of horses at 0.1 lux ± 0.1 lux, the midsize facilities average lighting variance was 0.2 lux ± 0.2 lux, and, finally, the facilities with small numbers of horses had an average lighting variance of 0.2 lux ± 0.1 lux.
The typical total daily number of horses in the indoor arena was statistically significant for the variability of the ambient air temperature of the indoor arenas (p = 0.01). The indoor arenas with the highest daily total of horses had the lowest average air temperature variance (0.1°C ± 0.1°C (0.2°F ± 0.2°F)), followed by the arenas with the mid daily total number of horses (0.3°C ± 0.3°C (0.5°F ± 0.5°F)), and, finally, the facilities with the lowest daily total number of horses had the highest air temperature variance (0.4°C ± 0.4°C (0.7°F ± 0.8°F)). The mean and standard deviations for the statistically significant facility usage variables are displayed in Table 5. All other examined variables were not statistically significant.
Air speeds within the indoor arenas
Air speed variability was only statistically significant for the interaction between the orientation of the indoor arena and the presence of roof ventilation (p = 0.05). None of the variables examined were statistically significant for air speed variability within the indoor arenas. This lack of statistical significance is further explored in the Discussion section.
Discussion
While other animal agriculture spaces have used spatial mapping to better understand the interior environment, this type of analysis has not been completed for equine spaces and, particularly, equine indoor arenas. This study is the first to use spatial mapping and kriging to conduct an analysis of indoor arenas for the roof, ambient air, and footing temperatures, the air movement, and the light intensity. Though there were statistical differences between the average variances for some of the environmental conditions, the nominal differences were fairly small; for example, the average variances in footing temperature only shifted from 1.1°C to 0.4°C when spaces with and without roof insulation were compared. Realistically, less than 1°C of variance difference in footing temperature may not create a biological difference for the horses or humans within the facilities, but these variances may impact how the facilities need to be managed, i.e., dragging or watering patterns for the footing may shift. As the equine industry is a vital part of both Kentucky’s economy and the economy of the United States and facilitates the interactions of humans and horses in a variety of ways, it is important to better understand what is happening within these facilities to provide the best and healthiest environments. While the main limitation of the research is the regional limitations of focusing on a 160-km radius around Lexington, Kentucky, this study illuminates how different aspects of the indoor arenas and the equine facilities where they are located can impact the environment within them. Future research on these facilities can lead to better information for the design and use of indoor arenas as they are an important aspect of the infrastructure of many equine facilities found in Kentucky, the United States, and, even, worldwide.
Spatial analysis discussion
Components of the indoor arena
Consistent with how the different ventilation systems work, the average roof temperature variability ranked from highest to lowest variability consisted of ridge vent, cupolas, and no ventilation. Ridge vents and cupolas are types of roof ventilation that rely on wind-driven ventilation or thermal buoyancy, which are natural ventilation techniques where stale, hotter air is removed through the ridge line of the building (Albright, 1990). The capped ridge vents tend to run most of the length of the indoor arenas and would allow for hotter air to move out of the indoor arenas more readily, while no roof ventilation would cause hot air to accumulate at the top of the indoor arena. The ridge vent would cause the warmest air and roof temperature to be at the ridge in the center of the roof and cooler air to be closer to the eaves, while no ventilation would allow heat to build up over the whole area above any opening where air could be exchanged (Albright, 1990). Cupolas allow for the removal of stale air similar to ridge vents but likely reduce the area for air to escape and potentially allow for the accumulation of stale, warmer air between cupolas, which facilitates more variability in roofing temperatures than no ventilation. Cupolas are common fixtures in equine facilities from a visual standpoint, but it is unknown how much ventilation they provide compared with capped ridge vents. Further research on cupolas as reliable and sufficient ventilation sources is needed.
The impact of roof insulation on the variability of footing temperature was surmised to be the result of solar radiation’s ability to transfer heat through the roofing in the absence of insulation. A roof with no insulation will have higher temperatures on the inside of the roof than one with insulation as the solar heat load will be evident on the inside of the structure, and a radiant heat load could impact the footing temperatures within the indoor arena (Bond et al., 1961; Buffington et al., 1983; Shearer et al., 1999). As heat transfers through metal roofing very effectively, heat generated from solar radiation on the roof will be transferred to the material on the underside of the roof. The presence of insulation helps prevent the solar radiation heat from radiating down to the footing (Buffington et al., 1983). This is partially due to the ratio of the roof to the footing being quite large compared with the ratio of the roof to the wall when examining the roof to footing as two parallel, infinitely long gray bodies (Incropera et al., 2007). While the orientation of the indoor arenas was not statistically significant for the examined conditions, it would impact the solar load distribution on the roof of an indoor arena as the south side of the facilities would receive more solar load than the north side. This concentration of the solar load on the south side of a facility without an insulated roof would likely contribute to the variability in the footing temperatures, with east/west-oriented facilities experiencing higher temperatures on a long side of the indoor arena; in contrast, a north/south-oriented facility might see higher footing temperatures located at one end and/or side depending on the time of day the assessment was completed. One potential reason the variance within the entire subset of indoor arenas is not statistically significant for orientation is due to the grid layout and data collection format. An east/west-oriented facility would have five data collection points on the south side of the building, where heat would be able to accumulate, and a north/south-oriented facility would have three to six data collection points on the south end of the building. This relatively equal number of points on the south side would translate to similar variability in all of the indoor arenas. This variability is discussed with example spatial maps later in Section 4.2.
Light intensity variability across the indoor arena was impacted by the amount of building enclosure. The larger variability in the fully open indoor arenas was likely due to sunlight coming into the facility from one direction rather than diffuse light that is even across the entire space, as would be expected in an enclosed space that relies on translucent panels or electric lights being in use. Uneven light infiltration impacting variability in lighting intensity has been seen in other livestock housing, which indicates this is not unique to equine spaces (Damasceno et al., 2019). The interaction between the lights being on in the indoor arena and the cloud cover on the day of facility assessment was expected as days with heavier cloud cover will require more electric lighting use within the facilities. During the interviews, multiple owners and managers stated that doors and windows were kept closed to reduce wind in the winter and sunspots and bird inhabitation during the summer. Birds are a commonly cited concern in facilities, and approximately 50% of the facilities examined noted they made decisions to close doors and windows to prevent birds from inhabiting the space, despite external conditions being acceptable for open doors or windows.
Facility usage within the indoor arena
The low variance in the lighting for the facilities with the largest number of horses was likely due to those being facilities where consistent lighting is expected by anyone coming to the facility. This category may include large boarding and training facilities and competition venues. These types of facilities may rely more on electric lighting within the spaces than natural light through translucent panels or open windows and doors to provide adequate lighting within the spaces. During the semi-structured interviews, trainers and arena owners stated that consistent lighting across the entire indoor arena space can help provide safety due to the lack of bright spots and shadows in the facility. The average lighting variances for the mid-sized and small facilities were quite similar.
Similar to considerations of the total number of horses at the facility, the indoor arenas that had the highest daily usage were likely to be large boarding, training, or competition facilities where human comfort may be a priority for the clients, competitors, or spectators. This would explain why those facilities had the lowest variability in ambient air temperature within the indoor arena. A more consistent air temperature across the entire space would be more comfortable for the spectators and other people spending time in the facility who are not actively riding. Some of the larger facilities also had climate-control mechanisms installed, which could be a reason the air temperature variance was lower. Even if the indoor arena had only heat as the climate-control method, the construction, including use of materials such as insulation and tightness of construction, could contribute to a more consistent air temperature throughout the facility in all seasons.
Air speeds within the indoor arenas
The interaction between the air speed variability and the presence of roof ventilation was surmised to be the result of wind-driven natural ventilation helping to move any stale air out of the facility. Thermal buoyancy is not an effective natural ventilation strategy in indoor arenas as they typically do not have high animal stocking densities and are frequently empty. The orientation of the building, which determines the location and direction of the roof ventilation, would be important for any wind-driven ventilation to be effective, especially with capped ridge vents. The most effective orientation of the building and ridge vents would be for the long side of the building or for the wind vents to face the predominant wind direction.
Air speed variability within the indoor arenas was not impacted by any of the individual fixed conditions. Upon further analysis, box and whisker plots of the air speed variances (Figure 2) and the average air speeds within the indoor arenas (Figure 3) provided information as to why there were no statistically significant results. The median air speed variance (Figure 2) was approximately 0.0004 m/s (0.07 ft/min), with most (75%) of the variances falling below 0.0006 m/s (0.12 ft/min), which indicates that the air speeds were relatively similar across the indoor arenas. The average air speeds within the indoor arenas were very low, and all but five arenas had an average air speed of less than 0.51 m/s (100 ft/min), which is considered still air in livestock and agricultural spaces (Albright, 1990; Norton et al., 2010). The five indoor arenas that had higher average air speeds were those that had little or no side walls or were in buildings with many open doorways, windows, and opportunities for air infiltration.
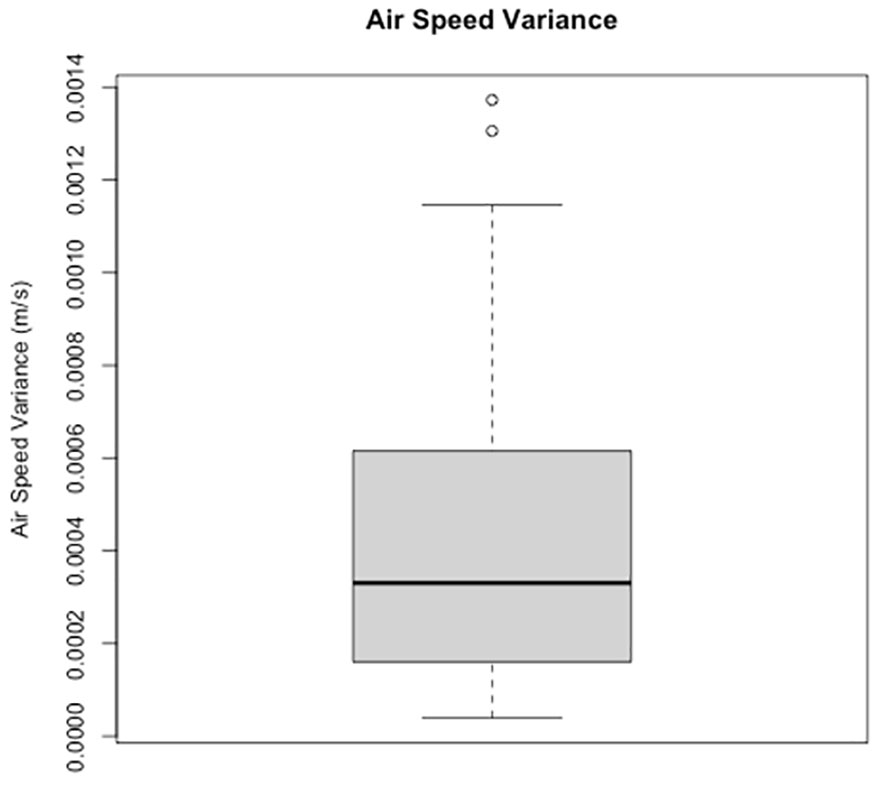
Figure 2 Box plot of variance for the air speed in the 37 indoor arenas. Most of the variances are below 0.0012 m/s.
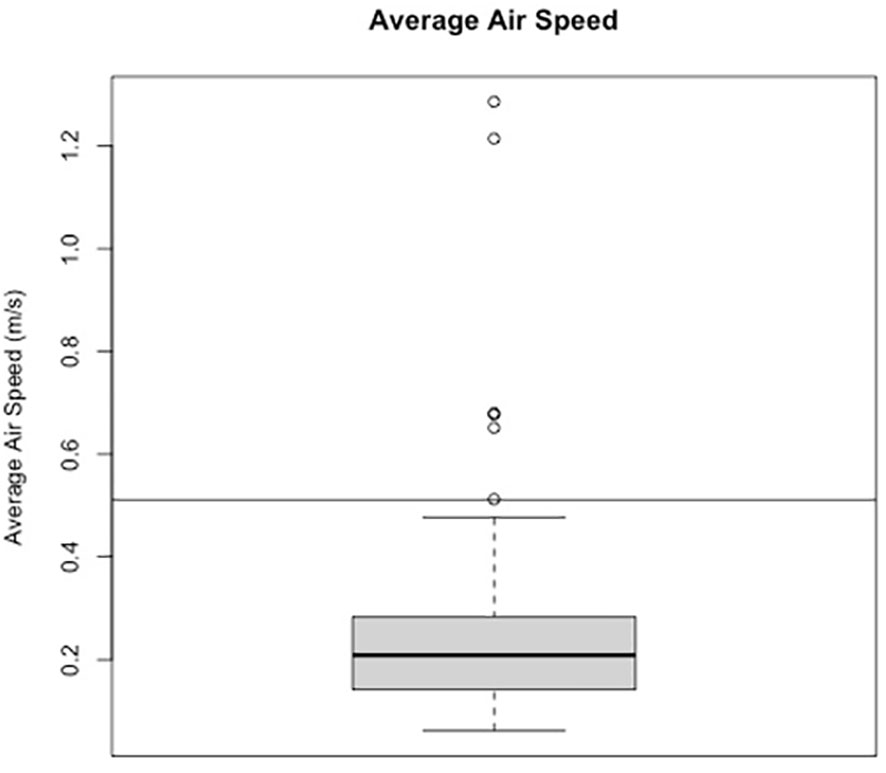
Figure 3 Box plot of the average air speed (m/s) for all 37 indoor arenas. Most of the indoor arenas have average air speeds less than 0.50 m/s. The line across the figure represents still air conditions for animal agricultural spaces which is 0.51 m/s (100 ft/min).
The low variances within the indoor equine arenas were likely caused by a general lack of air movement throughout the spaces. This lack of air movement in combination with no internal air distribution system did not allow for adequate air mixing throughout the entire space. There were spikes in air speeds around open windows and doors in some of the indoor arenas, but those locations of higher air speeds were not widespread nor high enough to cause the average air speeds within the facilities to reach the threshold surpassing still air.
As dust is a known environmental concern in indoor arenas, the lack of air speeds in the facilities indicated that dust clearance was occurring from the settling of the particulate matter due to its weight and particle size rather than relying on ventilation to remove the dust (McGill et al., 2021). While some research has been conducted demonstrating that respirable dust and respirable crystalline silica dust levels within indoor arenas can reach levels that are concerning, the approaches to manage this concern are still focused on reducing the production of dust from footing (Bulfin et al., 2019). The potential to manage the environment by reducing dust concentrations through greater ventilation or other building design aspects needs further investigation; however, this low air speed and lack of mixing does provide evidence of a need for more research and education for builders and farm owners.
Case studies of spatial mapping
The results and discussion, thus far, have focused on the variances within indoor arenas for the different environmental conditions examined. While it was appropriate statistically to use variances rather than raw data or averages, it is difficult to conceptualize the interaction of the variable and conditions. The raster maps created in ArcMap are geostatistical characterizations of the indoor arena and provide visual images of the environment within the facilities at the time of data collection. Comparing the roof temperature, ambient air temperature, and footing surface temperature maps for two indoor arenas demonstrates how different characteristics of the facilities impacted the environmental conditions, as described in Case study 1 and Case study 2. Case study 3 presents the spatial mapping of the air speeds and light intensity and demonstrates how a building enclosure being partially open (large bay door) impacted these two environmental conditions.
Case study 1
While overall orientation was not a significant factor for variance in the larger study, example Arena A (Figure 4) illustrates how the orientation of an indoor arena can impact the temperatures of the roof, ambient air, and footing. This indoor arena was oriented in the east/west direction along the long axis of the facility and was visited in the early afternoon during the fall season. Due to this orientation and time of the assessment, the south end of the arena (right-hand side of the maps) was warmed throughout the day. The outdoor high temperature the day of the assessment was 16.1°C (61°F), which was the low temperature observed in the roof temperature and the ambient air temperature. The high temperature for the roof was 73.2°F (22.9°C) and concentrated in the center of the south end of the roof where the sun would have been concentrated throughout the day. It is thought that the roof temperatures were higher than the high temperature on that day due to solar radiation. The highest ambient air temperature was concentrated in the southeast corner, though the air temperatures across the south end were about 2°F (1.1°C) warmer than the northern end wall. The low range of the footing temperatures was lower than the other temperatures at 58°F (14.4°C), but the area of the warmest footing temperatures was slightly higher than the high of the ambient air temperature and the reported high temperature for the day of the assessment at 67°F (19.4°C). The highest footing temperature was concentrated at the location of an open doorway on the southern side of the building and could be attributed to solar radiation. The lowest footing surface temperatures were on the short side opposite the direct sunlight and presented an example of the longer amount of time it takes for the ground temperatures to warm when not exposed to direct sunlight. Example Arena A demonstrated the impact direct sun exposure can have on building envelopes and internal temperatures. While the variability in this arena was not unusual compared with other arenas, these ranges in temperature do need to be considered and may demonstrate the need for better air mixing, better fresh air distribution, or more ventilation. In addition, a more specific water application on the footing to maintain even moisture content in the footing may be needed with these uneven footing temperatures.
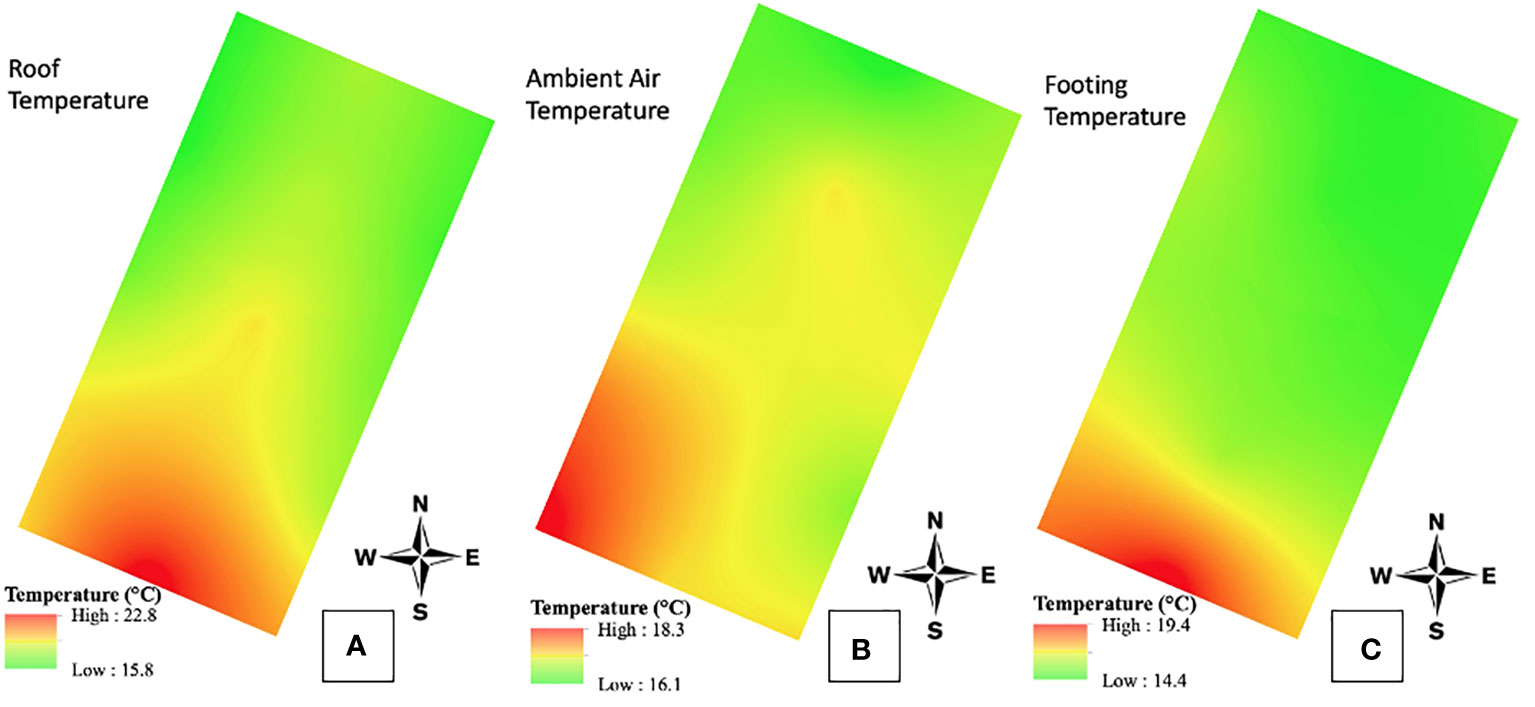
Figure 4 Example Arena A temperature (°C) maps are shown. The spatial maps displayed are roof (A), ambient air at 1.37 meters above the footing (B), and footing temperatures (C). The highest temperatures for all are concentrated on the south end of the indoor arena.
Case study 2
Example Arena B (Figure 5) was oriented in the west/east direction on the long axis. It was also built into the side of a hill with the west end below ground level and the east end at ground level, and it was connected to two barns with a ramp leading down into the indoor arena from the main barn, while the other was on the same level as the indoor arena. The entrance from the main barn connected in the northwest corner (top left) of the maps in Figure 5 and the secondary barn connected at the center of the south wall (bottom center). This indoor arena assessment was in the morning, and the temperature at the time was 26°F (–3.33°C). The range of the roof temperatures was very small, but the highest roof temperature was concentrated at the entrance from the main barn into the indoor arena, which could have been due to the heat from the animals in the barn. The ambient air temperatures were all above the outside air conditions for the time of the assessment, with the area of highest temperatures being 8°F (4.4°C) above the outside conditions. This was likely due to the large amount of earth surrounding much of the indoor arena delaying or even preventing the temperature drop from the nighttime low temperatures. This insulation of the temperature drop overnight was also evident in the footing temperatures, which were as much as 6°F (3.3°C) higher than the outside air temperature. Overall, this arena had less variability than Case study A, but this was a morning visit, and solar load would have a different impact at this much earlier hour. The impact of the doorway demonstrates that horses could have a significant impact on temperatures within an arena, a factor that was avoided in this study due to assessments being done in primarily unoccupied spaces.
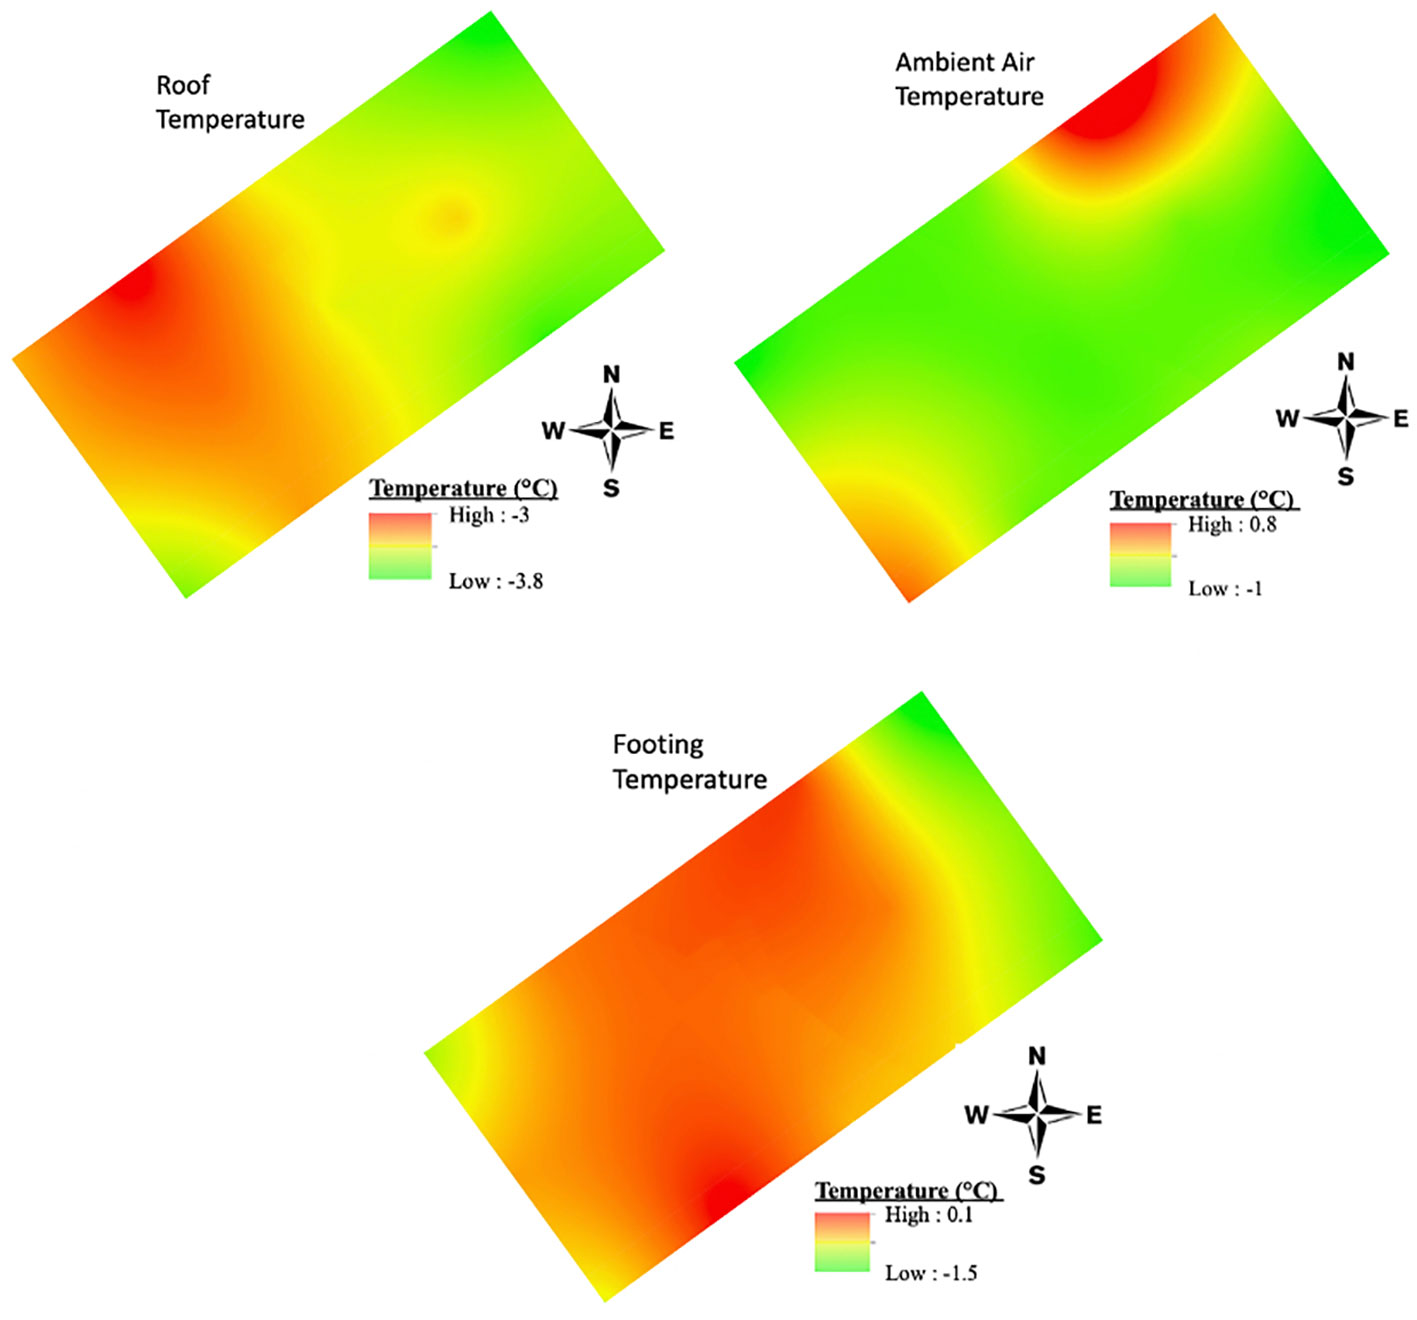
Figure 5 Example Arena B temperature (°C) maps are shown. The spatial maps displayed are roof (A), ambient air (B), and footing temperatures (C). The temperatures in this indoor arena are reflective of being built into the side of a hill and having temperature changes modulated by the mass of the earth on the south and west sides.
Case study 3
Example Arena C was an indoor arena separate from the barn or other buildings (Figure 6). At the time of the indoor arena assessment, the only door open was one bay door along the south wall. The open bay door was where the highest light intensity (933 lux) was located. The light intensity rapidly diminished the greater the distance from the open door, with the majority of the indoor arena having a light intensity of about 65 lux. Similar to the light intensity, the highest air speeds in Example Arena C were concentrated around the open bay door and toward the southwest corner of the indoor arena, with the highest air speed being 0.66 m/s (130 ft/min). At the time of the indoor arena assessment, the average wind speed was 3.08 m/s (607.2 ft/min) from the southeast direction, which would account for the increased air speeds to the west of the bay door. The rest of the indoor arena experienced low air speeds (0.06 m/s (12 ft/min)). Overall, the air speeds in Example Arena C were essentially still air conditions, though it provided an excellent example of how the design of the indoor arena can impact the environmental conditions. One of the challenges with observational studies is the inability to control the environment by opening or closing doors or windows. This limitation meant that data collection occurred in indoor arenas as they were on the day of assessment.
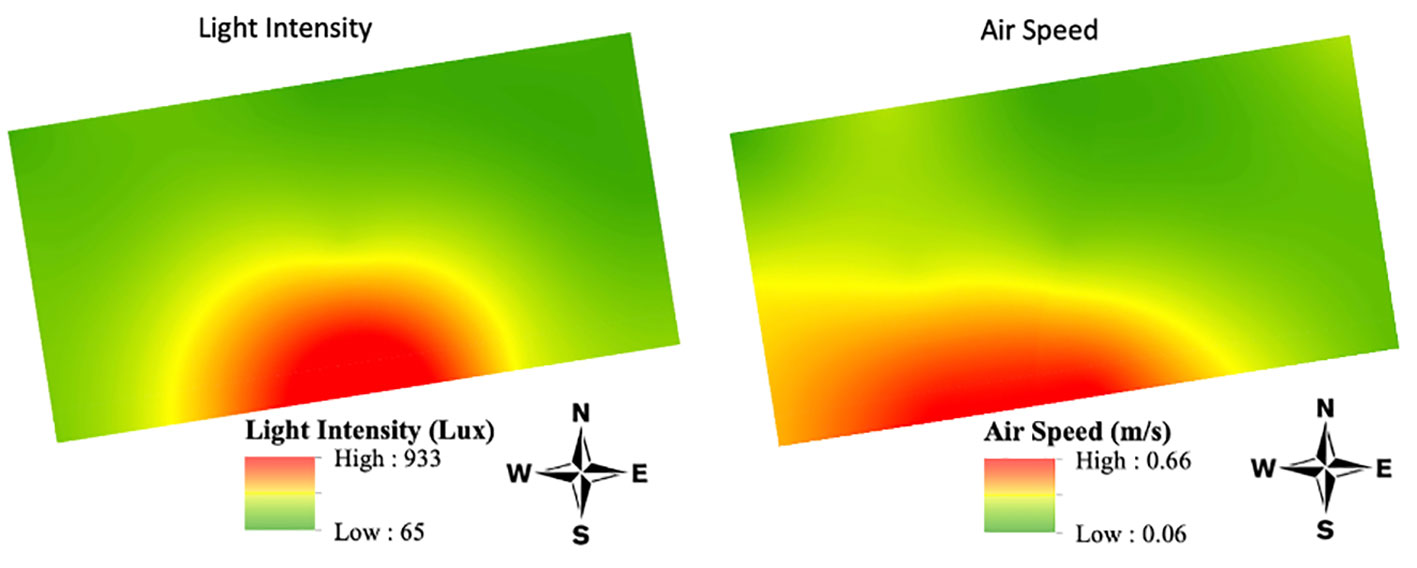
Figure 6 Example Arena C air speed and light intensity maps. This example indoor arena has one large bay door located along the center of the south wall. With this door open, a large range (65-933 lux) in the light intensity was observed. In addition, with the wind from the south at 3.08 m/s, the open bay door was theorized to cause the large difference in wind speed (0.06-0.66 m/s).
Conclusion
The one-time site assessments of the indoor arenas provided information regarding the environmental conditions within the equine indoor arenas. Arena design and facility characteristics can have an impact on that environment. One of the most notable findings from the indoor arena assessments was the low variance of the air speeds across the indoor arenas and the lack of air speeds in most of the facilities. This lack of air movement in the indoor arenas warrants future research, especially regarding respirable dust levels within the facilities. In addition to research on dust levels, more work examining environmental conditions for longer periods of time to continue gaining an understanding of indoor arena environments is required. In turn, more knowledge gained regarding these facilities can provide more information for better design of indoor arenas and to address the potential health concerns that have been identified through survey data and respirable dust research.
Data availability statement
The datasets for this research are not available at this time due to IRB regulations regarding the individuals who can access and work with the raw data for the equine facilities. Requests to access the datasets should be directed to aGF5ZXNtb3JnYW5AdWt5LmVkdQ==.
Ethics statement
The studies involving humans were approved by University of Kentucky Office of Research Integrity Institutional Review Board. The studies were conducted in accordance with the local legislation and institutional requirements. Written informed consent for participation in this study was provided by the participants’ legal guardians/next of kin.
Author contributions
Primary authorship and oversight of the research, data collection, and analysis by SM, RC, and MH. GIS and spatial analysis supported by JJ. Data collection, IRB protocol, and health considerations supported by KT. Temperature analysis and statistical analysis supported by VS. All authors contributed to the article and approved the submitted version.
Funding
Funding for this research was provided by the USDA-AFRI Predoctoral Fellowship grant 2020-67034-31729 from the USDA National Institute of Food and Agriculture.
Acknowledgments
A special thanks to the equine farms and facilities that allowed the research team to conduct the site assessments and semi-structured interviews.
Conflict of interest
The authors declare that the research was conducted in the absence of any commercial or financial relationships that could be construed as a potential conflict of interest.
Publisher's note
All claims expressed in this article are solely those of the authors and do not necessarily represent those of their affiliated organizations, or those of the publisher, the editors and the reviewers. Any product that may be evaluated in this article, or claim that may be made by its manufacturer, is not guaranteed or endorsed by the publisher.
Supplementary material
The Supplementary Material for this article can be found online at: https://www.frontiersin.org/articles/10.3389/fanim.2023.1083332/full#supplementary-material
References
Albright L. D. (1990). Environment control for animals and plants. (St. Joseph, Michigan: American Society of Agricultural Engineers).
Bond T. E., Kelly C. F., Garrett W. N., Hahn L. (1961). Evaluation of materials for livestock shades applicable to other open-type structures. California Agric. 15, 7–8.
Bregt A. K., Bulens J. D. (1998). "Integrating GIS and process models for land resource planning," in Land information systems: developments for planning the sustainable use of land resources. Eds. H. J. Heineke, W. Eckelmann, A. J. Thomasson, R. J. A. Jones, L. Montanarella, and B. Buckley, pp. 293–304.
Buffington D., Collier R., Canton G. (1983). Shade management systems to reduce heat stress for dairy cows in hot, humid climates. Trans. ASAE 26 (6), 1798–1802. doi: 10.13031/2013.33845
Bulfin K., Cowie H., Galea K. S., Connolly A., Coggins M. A. (2019). Occupational exposures in an equestrian centre to respirable dust and respirable crystalline silica. Int. J. Environ. Res. Public Health 16 (17). doi: 10.3390/ijerph16173226
Corkery G., Ward S., Kenny C., Hemmingway P. (2013). Monitoring environmental parameters in poultry production facilities. (St. Joseph, Michigan: American Society of Agricultural Engineers).
Damasceno F., Oliveira C., Ferraz G., Nascimento J., Barbari M., Ferraz P. (2019). Spatial distribution of thermal variables, acoustics and lighting in compost dairy barn with climate control system. Agron. Res. 17. doi: 10.15159/AR.19.115
Diggle P. J., Tawn J. A., Moyeed R. A. (1998). Model-based geostatistics. J. R. Stat. Society: Ser. C (Applied Statistics) 47 (3), 299–350. doi: 10.1111/1467-9876.00113
Elfman L., Riihimäki M., Pringle J., Wålinder R. (2009). Influence of horse stable environment on human airways. J. Occup. Med. Toxicol. (London England) 4, 10–10. doi: 10.1186/1745-6673-4-10
Ferraz P. F. P., Ferraz G. A. S., Schiassi L., Nogueira V. H. B., Barbari M., Damasceno F. A. (2019). Spatial variability of litter temperature, relative air humidity and skin temperature of chicks in a commercial broiler house. Agron. Res. 17 (2), 408–417. doi: 10.15159/ar.19.112
Incropera F. P., Dewitt D. P., Bergman T. L., Lavine A. S. (2007). Fundamentals of Heat and Mass Transfer. (Danvers, MA: John Wiley & Sons).
Kerry R., Oliver M. A. (2007). Comparing sampling needs for variograms of soil properties computed by the method of moments and residual maximum likelihood. Geoderma 140 (4), 383–396. doi: 10.1016/j.geoderma.2007.04.019
Kidd A., Winchell W., Burwash L. (1997). Horse Handling Facilities. (Edmonton, Alberta: Alberta Agriculture, Food and Rural Development).
Lena E., Robert W., Miia R., John P. (2011). “Air Quality in Horse Stables,” in Chemistry, Emission Control, Radioactive Pollution and Indoor Air Quality. Ed. Nicolas M. (Rijeka: IntechOpen). Ch. 25.
McGill S., Hayes M., Tumlin K., Coleman R. (2021). Characterization of indoor arenas through an anonymous survey. Trans. Anim. Sci. 5 (4). doi: 10.1093/tas/txab198
Norton T., Grant J., Fallon R., Sun D.-W. (2010). Assessing the ventilation performance of a naturally ventilated livestock building with different eave opening conditions. Comput. Electron. Agric. 71 (1), 7–21. doi: 10.1016/j.compag.2009.11.003
Raymond S., Clarke A. (2023). "Small airway disease and equine respiratory health," in Advance in equine nutrition. Ed. J. D. Pagan. (Versailles, Kentucky, USA: Kentucky Equine Research Inc.). doi: 10.1016/B978-0-323-76469-8.00027-7
Shearer J., Bray D., Bucklin R. (1999). The management of heat stress in dairy cattle: What we have learned in Florida. Proc. Feed Nutr. Manage. Cow College Virginia Tech 60-71.
Wheeler E. F., Koenig B., Harmon J., Murphy P., Freeman D. E. (2005). Horse Facilities Handbook. (Ames, Iowa: Midwest Plan Service).
Wheeler E. F., Zajaczkowski J. L., Diehl N. K. (2003). Temperature and Humidity in Indoor Riding Arenas During Cold Weather (St. Joseph, MI: ASAE).
Keywords: equine, indoor arena, environmental conditions, spatial mapping, facility analysis, air movement, temperature, light intensity
Citation: McGill S, Coleman R, Jackson J, Tumlin K, Stanton V and Hayes M (2023) Environmental spatial mapping within equine indoor arenas. Front. Anim. Sci. 4:1083332. doi: 10.3389/fanim.2023.1083332
Received: 28 October 2022; Accepted: 03 August 2023;
Published: 28 August 2023.
Edited by:
Yang Zhao, The University of Tennessee, Knoxville, United StatesReviewed by:
Chelsie Huseman, Texas A and M University, United StatesBrian Nielsen, Michigan State University, United States
Copyright © 2023 McGill, Coleman, Jackson, Tumlin, Stanton and Hayes. This is an open-access article distributed under the terms of the Creative Commons Attribution License (CC BY). The use, distribution or reproduction in other forums is permitted, provided the original author(s) and the copyright owner(s) are credited and that the original publication in this journal is cited, in accordance with accepted academic practice. No use, distribution or reproduction is permitted which does not comply with these terms.
*Correspondence: Morgan Hayes, aGF5ZXNtb3JnYW5AdWt5LmVkdQ==
†These authors have contributed equally to this work