 Hamed Ahmadi
 Markus Rodehutscord
 Wolfgang Siegert
- 1Department of Poultry Science, Tarbiat Modares University, Tehran, Iran
- 2Institute of Animal Science, University of Hohenheim, Stuttgart, Germany
This study investigated whether quantifying the trade-off between the maxima of two response traits increases the accuracy of diet formulation. To achieve this, average daily weight gain (ADG) and gain:feed ratio (G:F) responses of 7–21-day-old broiler chickens to the dietary supply of three nutrients (intake of digestible glycine equivalents, digestible threonine, and total choline) were modeled using a newly developed hybrid machine learning-based method of Gaussian process regression and genetic algorithm. The dataset comprised 90 data lines. Model-fit-criteria indicated a high model adjustment and no prediction bias of the models. The bi-objective optimization scenarios through Pareto front revealed the trade-off between maximized ADG and maximized G:F and provided information on the needed input of the three nutrients that interact with each other to achieve the trade-off scenarios. The trade-off scenarios followed a nonlinear pattern. This indicated that choosing target values intermediate to maximized ADG and G:F after single-objective optimization is less accurate than feed formulation after quantifying the trade-off. In conclusion, knowledge of the trade-off between maximized ADG and maximized G:F and the needed nutrient inputs will help feed formulators to optimize their feed with a more holistic approach.
1 Introduction
Optimizing the dietary nutrient supply is a major field in farm animal nutrition research because deviations from optimal nutrient supply often result in adverse consequences. Undersupply with nutrients imposes the risk of performance loss and health issues. Oversupply with nutrients is uneconomical and impairs an efficient use of feed, which represents a limited resource globally (Jansman and te Pas, 2015; Alagawany et al., 2021). Suboptimal supply further leads to increased excretion of environmentally relevant compounds by the animals, including nitrogen and phosphorus (Rodehutscord, 2008; Simon, 2008).
Several response traits are usually measured in animal experiments using variable dietary nutrient supply including average daily weight gain (ADG) and gain:feed ratio (G:F). Most commonly, effects of dietary nutrient supply have been evaluated separately for each response trait, leading to predictions of the optimal dietary nutrient concentration that are different depending on the chosen response trait. For instance, this included responses to tryptophan in piglets (2.09 and 1.64 g/kg of feed for ADG and G:F, respectively (Eder et al., 2001)), threonine in broiler chickens (7.5 and 8.5 g/kg of feed for ADG and G:F, respectively (Ayasan et al., 2009)), and arginine in rainbow trout (11.1 and 8.5 g/kg of dry feed for ADG and G:F, respectively (Rodehutscord et al., 1995)). Hence, optimal nutrient concentrations in feed are defined based on the impact of the nutrient supply on the objective of maximizing one response trait. The advantage of this approach is its simplicity; however, the application of the results implies a decision on whether one response trait is more important than another, which is not easy to make. Alternatively, nutrient concentrations in the feed intermediate to the nutrient concentration optima for different response traits can be chosen. This approach considers the importance of several objectives together, but the choice is made without exact knowledge of the trade-off. According to our knowledge, there is no method established to date that can consider the trade-off between two objectives and the resulting consequences on the calculated optimal nutrient concentrations in the feed. Effects of dietary concentrations of a nutrient on response traits depend on the dietary concentrations of other nutrients. For instance, such interactions between dietary nutrient concentrations were found between dietary glycine equivalents (Glyequi) and threonine (Thr) (Corzo et al., 2009), Glyequi, Thr, and choline (Cho) (Siegert et al., 2015), methionine and Cho (Simon, 1999), and Glyequi, cysteine, and Cho (Hofmann et al., 2020) in broiler chickens and pigs. Hence, combinations of dietary nutrient concentrations may differ between optimized objectives. In consequence, trade-offs between two objectives impact on the optimal combination of interacting nutrients in the feed.
In recent years, artificial intelligence based machine learning methods such as Gaussian process (GP) regression (GPR) models have achieved much attention in the field of computational data modeling science (Swain et al., 2016; Schulz et al., 2018). The GPR processing describes nonlinear relationships between input and response variables as well as uncertainties in the data using a flexible non-parametric model. GPR models have been used in different fields such as biology (Tonner et al., 2017), medicine (Sai et al., 2019), time-series analysis (Roberts et al., 2013), and animal nutrition (Baiz et al., 2020). In these fields, bi-objective optimization using genetic algorithm (GA) was shown to enable quantification of the trade-off between investigated objectives. However, it is not known whether using a GPR and GA hybrid (GPR-GA) is suitable for optimizing the nutrient supply in nutrition research and to quantify the trade-off between two objectives.
We hypothesized that diets can be formulated more accurately when trade-offs between response traits are quantified. Feed formulators would assume a trade-off on a linear line between the maxima of response traits when the trade-off is not quantified (Figure 1). An increased accuracy may be achieved when the quantified trade-off between the maxima of response traits deviates from linearity. We further hypothesized that GPR-GA is useful for such quantification of a trade-off between objectives.
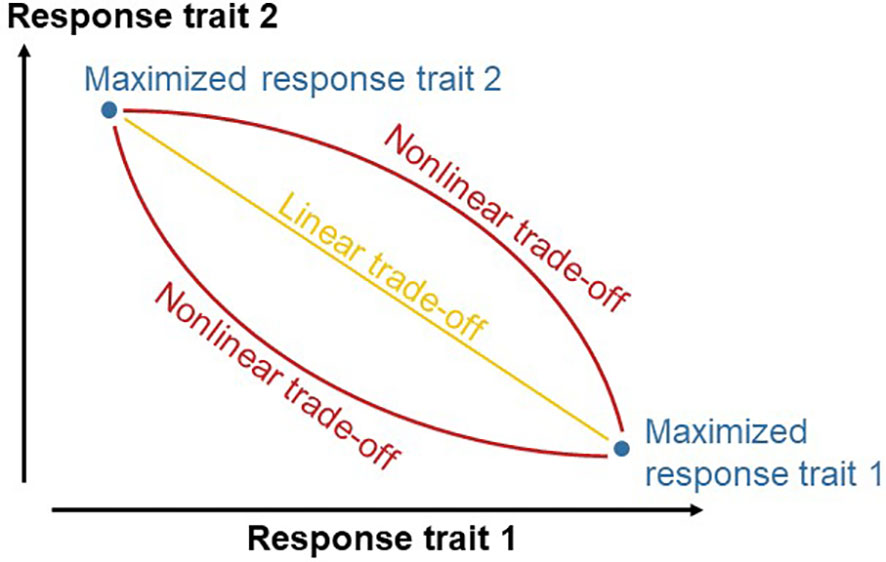
Figure 1 Scheme of the research hypothesis that quantifying the trade-off between two response traits increases the accuracy of diet formulation. Without quantifying the trade-off, diets would be formulated in a way that enables responses on a linear line between the maxima of the response traits. Quantifying the trade-off increases diet formulation if the quantified trade-off deviates from the linear line.
Therefore, the aims of this work were 1) to quantify the trade-off between two objectives and to determine at which nutrient inputs trade-offs between two objectives are achieved and 2) to investigate whether GPR-GA is suitable to model responses to the supply of three nutrients. This was performed using data of a previously published experiment (Siegert et al., 2015), where responses in ADG and G:F to intake of digestible Glyequi (dGlyequi), digestible Thr (dThr), and total Cho (tCho) were evaluated. The data of that experiment were suitable for the aims of the present study because responses to the supply of dGlyequi, dThr, and tCho were found to interact and different dGlyequi, dThr, and tCho combinations were needed to maximize ADG and G:F.
2 Materials and methods
The modelling processes of the investigated GPR-GA hybrid is outlined in Figure 2. In brief, the process included the three stages ‘data modelling’ using GPR, ‘model evaluation and selection’ using cross-validation and goodness of the fitted model, and ‘optimization on the developed models’ using single- or bi-objective GA.
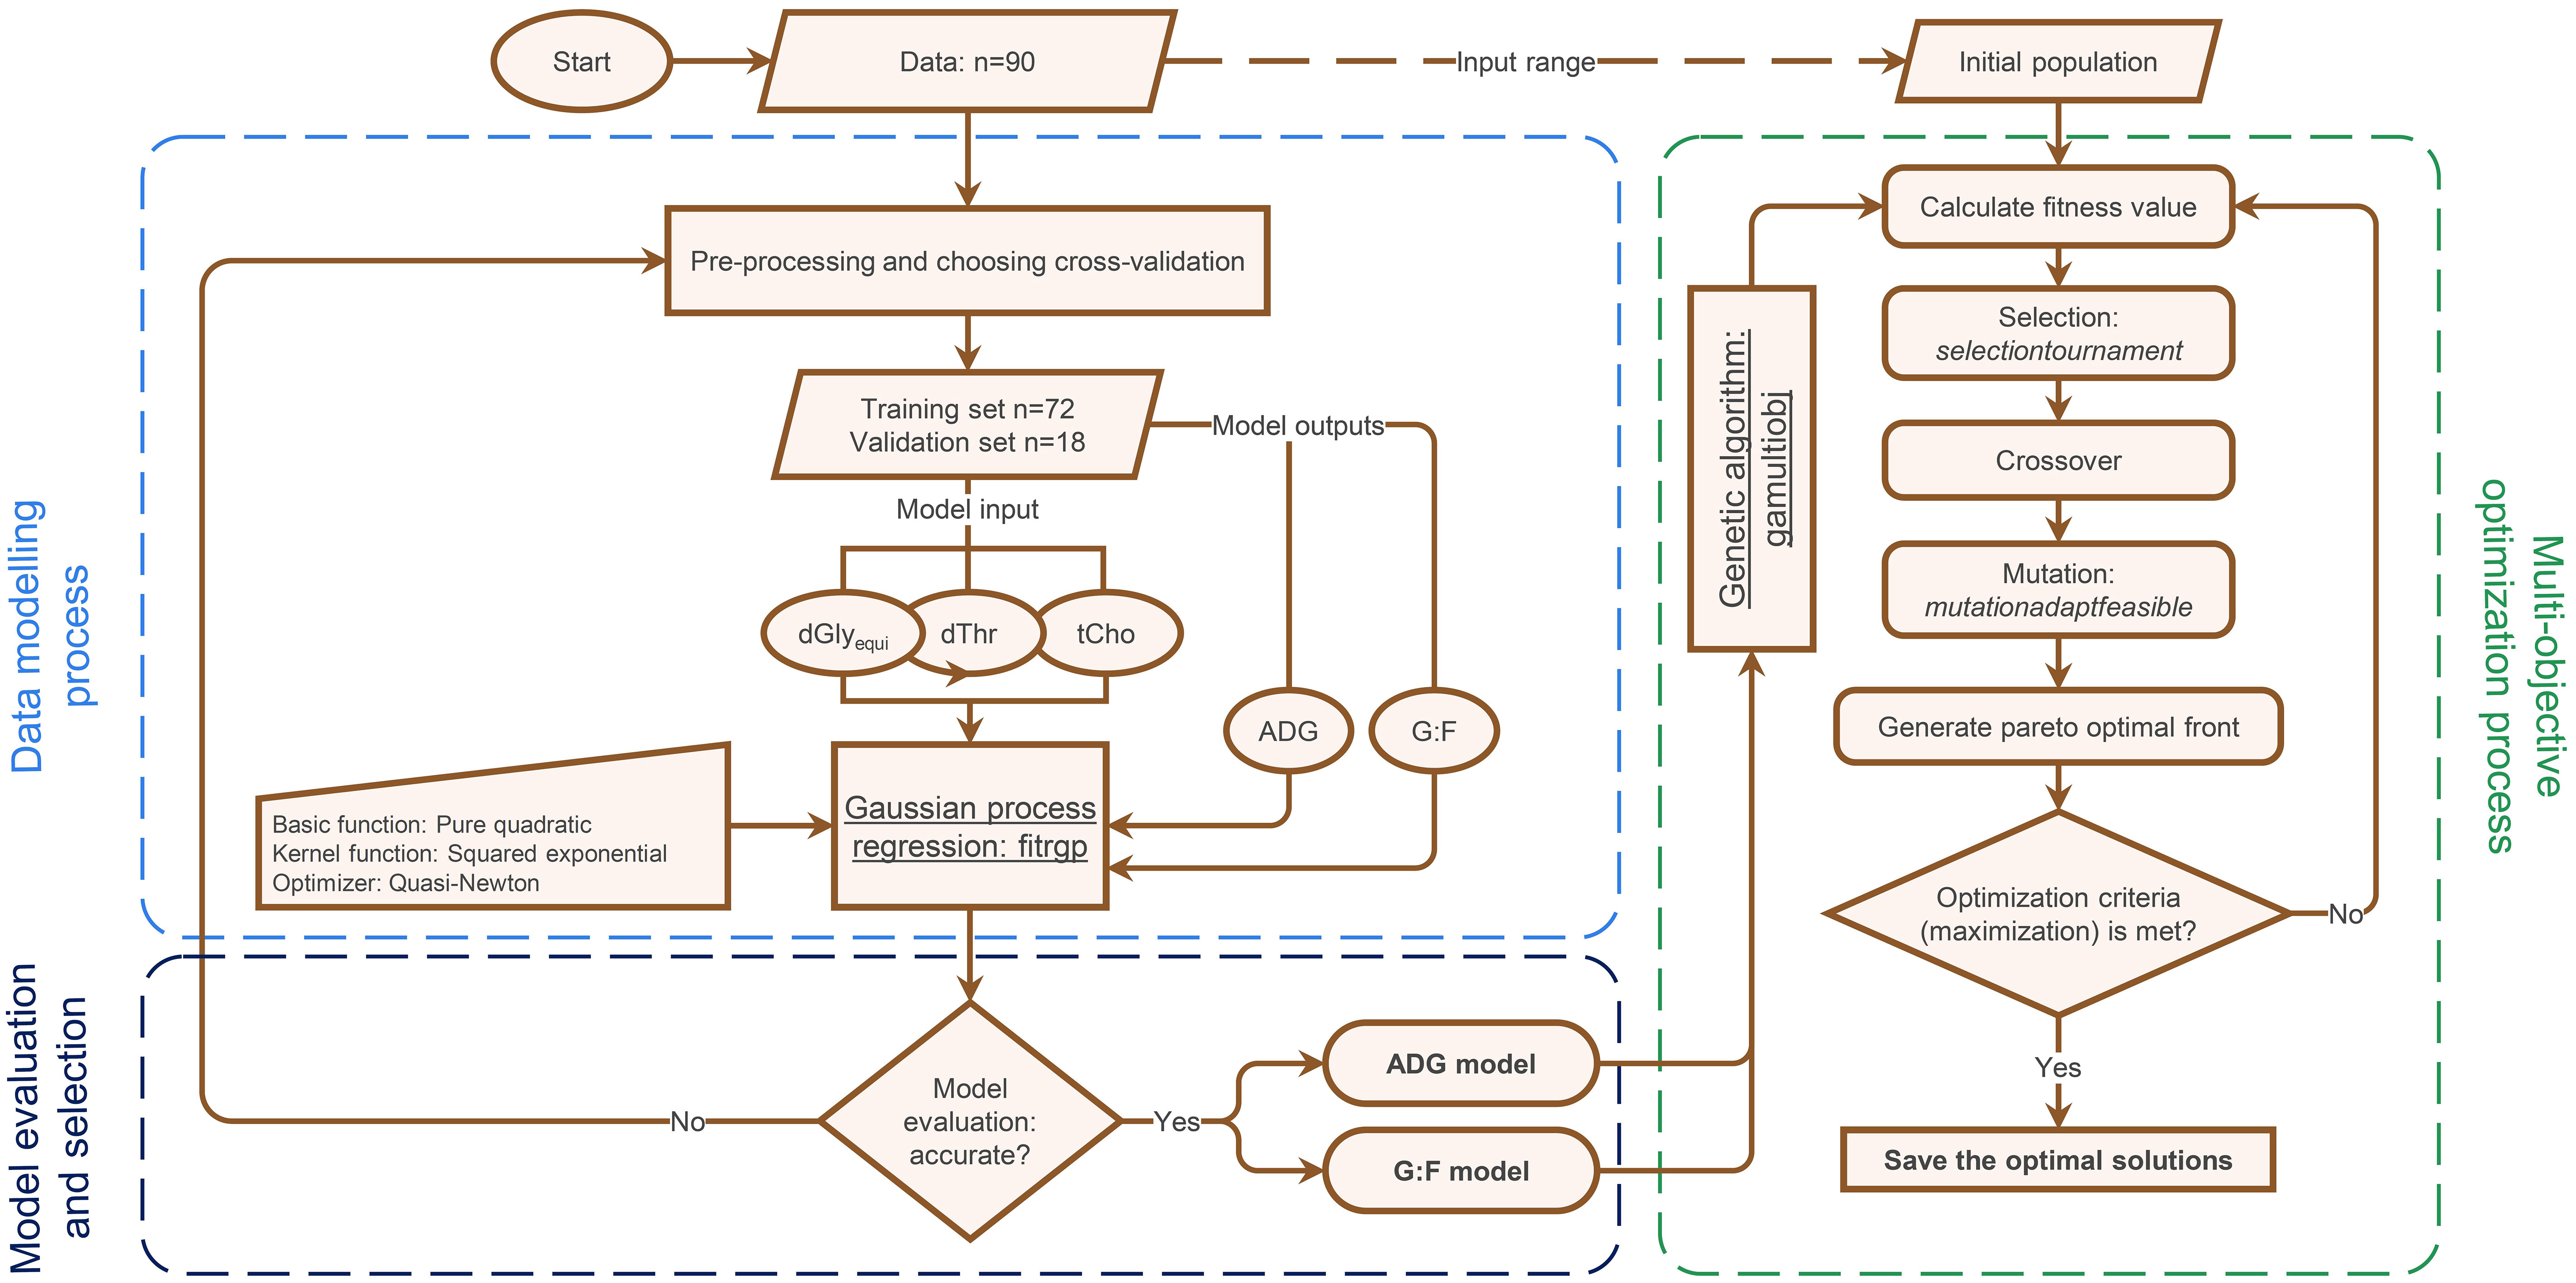
Figure 2 Flowchart outlining the modelling and optimization process using Gaussian process regression and genetic algorithm (GPR-GA) for optimizing the supply with digestible glycine equivalents (dGlyequi), digestible threonine (dThr), and total choline (tCho) and to quantify the trade-off between two objectives (average daily gain (ADG) and the gain:feed ratio (G:F)) in broiler chickens.
2.1 Experimental setup and procedures
This study used data of a previously published experiment (Siegert et al., 2015), where effects of the intake of dGlyequi, dThr, and tCho on ADG and G:F of 7–21 day-old Ross 308 broiler chickens were investigated. In brief, 5 dietary concentrations each of dGlyequi, dThr, and tCho were investigated in a fractional central composite design, yielding 15 dietary treatments. Each treatment was tested in 5 pens of 10 birds each, except for the treatment with the medium concentration of the three nutrients, which was tested in 20 pens of 10 birds each. The pen represented the experimental unit. Except for the varying nutrients, the diets were calculated to meet or to exceed the recommendations (Gesellschaft für Ernährungsphysiologie, 1999). Birds were selected to achieve an equal mean bird weight in each pen and similar variance within the pens. Feed and birds were weighed on day 7 and 21 to determine feed intake, ADG, and G:F. Experimental diets and water were provided for ad libitum consumption throughout the experiment. The range in nutrient intake was 431–1397 mg/d for dGlyequi, 129–542 mg/d for dThr, and 27–100 mg/d for tCho.
2.2 Gaussian process regression modelling
2.2.1 Data
The dataset had 90 rows (data lines) and 5 columns. The rows represented the nutrient intake-response pair and the columns were the measured nutrient intake and response values. Each row of the dataset may be denoted as
xi j (i=1, 2 , and 3; j=1, 2, 3…90) and
Yi j (i=1 and 2 ; j=1, 2, 3…90), where
x's were the intake levels of dGlyequi, dThr, and tCho, and
Y's were the ADG and G:F. It may be presented as following matrix:
Descriptive statistics, relationships between measured nutrient intake and response values, and the relationship between the response values are presented in Figure 3. The response values were positively correlated (r=0.925; P<0.001).
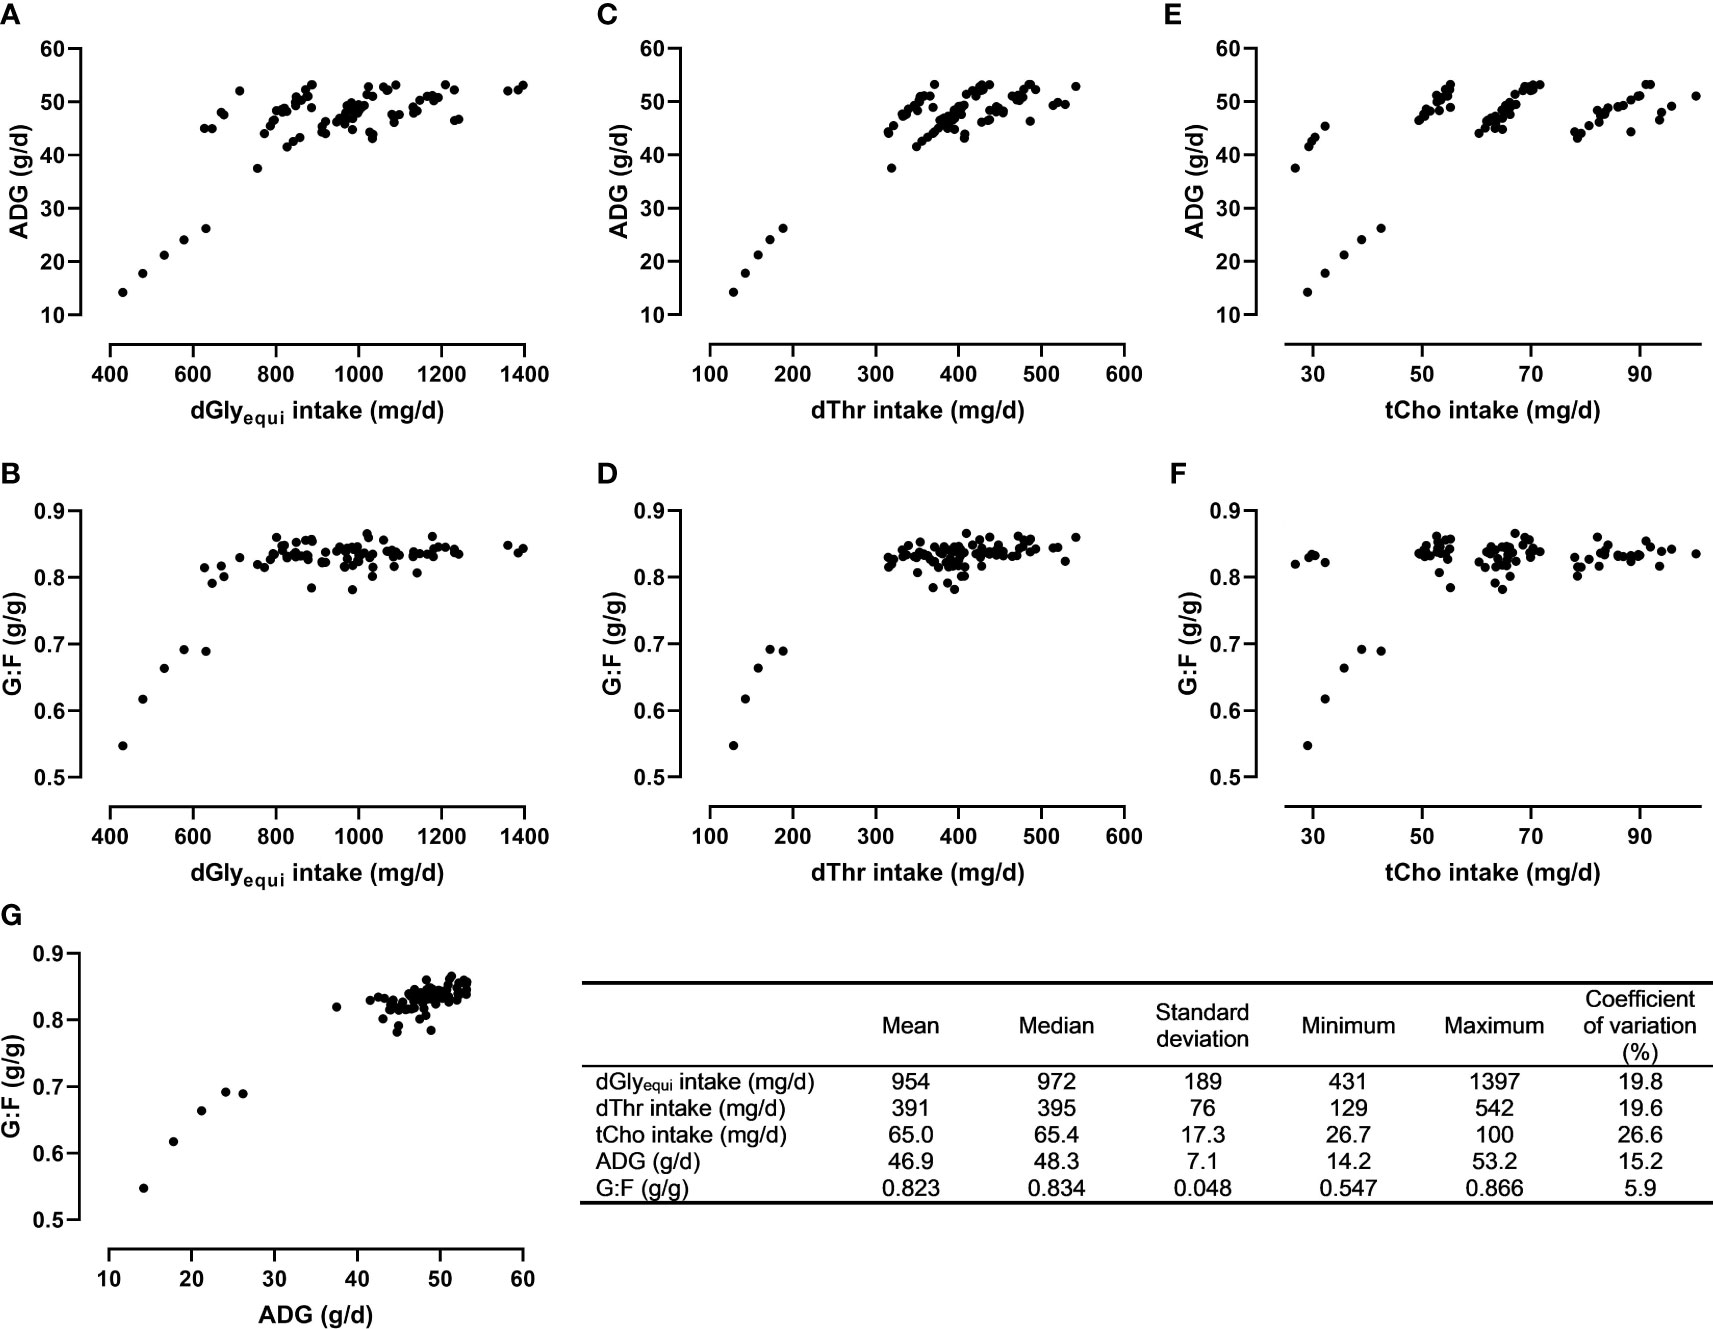
Figure 3 Descriptive statistics and relationships between the intake of digestible glycine equivalent (dGlyequi), digestible threonine (dThr), total choline (tCho), and the response values average daily weight gain (ADG; A, C, E) and the gain:feed ratio (G:F; B, D, F) as well as the relationship between ADG and G:F (G).
2.2.2 Implementation of Gaussian process regression
The GPR algorithm was used to find the pattern which fits x's and create a function f(x) that can predict Y's for new x's . The GPR model was developed using the “fitgpr” function of MATLAB version R2021b (Mathworks, 2021). Detailed explanations of GPR method and development as well as application examples can be found elsewhere (Rasmussen and Williams, 2006; Tonner et al., 2017; Schulz et al., 2018; Baiz et al., 2020; Mathworks, 2021). In brief, a GP is a non-parametric method given a stochastic process considering f(x)(x∈Rd) where f(x1 1), f(x2 1),…, f(xij);(i=1, 2 , and 3; j=1, 2, 3…90) is a multivariate Gaussian random variable for all combinations of input variables. The GPR model is defined by introducing a mean function of the form µ(z)=E(f(x)) and a covariance function of the form k(x,x')=cov(f(x), f(x′)). In our case, the inputs x were a vector of dGlyequi, dThr, and tCho intake levels, and Y were the response traits (ADG and G:F). The response traits were separately modeled as:
where, h(x) was a vector of basis functions, β was a vector of basis function coefficients, f(x) was a GP with zero mean and covariance function k(x, x') , and Ɛ was a Gaussian noise Kamath et al., 2018. A pure quadratic function was chosen as basic function (pureQuadratic as implemented under fitgpr function (Mathworks, 2021)). In equation 1, h(x)dβ denoted the mean compartment of the GP model which was parametric and deterministic. The f(x) represented the GP term and was non-parametric and probabilistic. It computed a nonlinear connection between input and response variables as well as uncertainties in the data. The squared exponential function was used as the covariance (kernel) function (k(x, x')) because we expect that for both objectives, the closeness of the points translates into a high correlation. The same strategy was realized previously in a similar situation where GPR was used to solve time series regression (Roberts et al., 2013). The following covariance function was used (Roberts et al., 2013):
where, σ2 was the variance and λ was the length scale for input variables and represented hyperparameters. The hyperparameters of the selected covariance function were optimized with respect to the experimental data (Rasmussen and Williams, 2006) using the “fitrgp” function of MATLAB, which estimated hyperparameters of by minimizing the negative log-likelihood.
A k-fold cross-validation (k=5) method (Mathworks, 2021) was used to monitor performance of the trained GPR model using “CVPartition” function. The model was iteratively tested during the training process with 18 randomly selected data lines in each fold used for validation while the remaining 72 data lines were used for training. Low RMSE of the validation set was the rationale for the generalization ability of the model and for model selection.
2.3 Model evaluation
Model fits were examined using the R2 and the root mean square error (RMSE). Model adequacy was additionally inspected using plots of residuals against predicted values of Y to test for linear prediction bias (St-Pierre, 2001). Sensitivity analysis was performed on developed GPR models to rank the input variables by their importance for the model outputs. For that, variable sensitivity ratio values for each input variable were calculated, which represent the ratio between the RMSE of a GPR model with the respective input variable not considered in the evaluation and the RMSE considering all input variables. Hence, higher variable sensitivity ratio values indicate a higher relevance of the input variable to the model output. A value of 1 indicates no relevance of an input variable for the model output (Ahmadi and Golian, 2011).
2.4 Optimization using genetic algorithm
2.4.1 Single-objective optimization
The constructed GPR models were used to find the combination of input variables to maximize ADG and G:F. This concept was previously applied in poultry studies to determine nutrient intake combination for maximized responses (Ahmadi and Golian, 2011; Hofmann et al., 2020). The solution of the single-objective optimization problem was obtained as described previously (Ahmadi and Golian, 2011) using “ga” function developed in MATLAB optimization toolbox (Mathworks, 2021). A roulette wheel selection method was used for selecting elite populations for crossover. Initial population of 50, generation number of 500, mutation rate of 0.1, and crossover rate of 0.85 has been set to obtain the best fitness. During GA implementation, the search for the optimal solutions was restricted between range of the input variables specified in the experimental design. This generational process was repeated until the number of generations was reached.
2.4.2 Bi-objective optimization
Solutions of the bi-objective optimization problem were obtained using the “gamultiobj” function (Mathworks, 2021) as described previously (Kamath et al., 2018). This function is an update and applicable version of the non-dominated sorting genetic algorithm II (NSGA-II) which was previously developed (Deb et al., 2002). The process involved the generation of a Pareto front, which showed best trade-off scenarios that can be obtained between the two objectives with different optima, as done previously (Sai et al., 2019). In the current study, a two-objective optimization on the developed models was done as:
where, x∈Rd are the input variables and f1(x) and f2(x) are the response traits modeled by the GPR method. There is no unique solution of the optimization because F(x) includes a vector of two competing objectives. Therefore, the noninferiority (Pareto) optimality was used to describe the objectives (Kamath et al., 2018; Sai et al., 2019). The algorithm searched in the defined range of input variables specified in the experimental design (x∈Rd ), to find optimal solutions (feasible space Ω=x∈Rd ). The performance vector F(x) mapped feasible input space into objective function space. It was represented as a two-dimensional Pareto graph.
The parameter settings for “gamultiobj” were the following: population size = 50; selection function = tournament selection; mutation function = adaptive mutation; pareto fraction = 0.25; crossover fraction = 0.90; maximum generation = 1000, and function tolerance ≤ 0.0001. This generational process was repeated until the maximum number of generations was reached or the average relative change in the best fitness functions was less than the function tolerance value.
2.5 Sigmoidal regressions, areas under the curve, and preparation of figures
A four-parameter sigmoidal function was used to fit the Pareto front results obtained from bi-objective optimization process to describe scenarios as a function:
where, y was G:F, x was ADG, a was the minimum plateau of G:F, b was the maximum plateau of G:F, c was the inflection point, and d was the slope of the regression. GraphPad Prism 8 (GraphPad Software Inc., San Diego, CA, USA) was used to create figures and to calculate the sigmoidal function and areas under the curve.
3 Results
3.1 GPR model results
Model-fit-criteria indicated a high model adjustment to the actual data with R² of the model training and validation ≥0.950 and ≥0.882, respectively (Table 1). The RMSE accounted for 1.0% in model training and 3.1% in model validation relative to the median of actual ADG. Relative to the median of actual G:F, the RMSE was 1.3% in model training and 2.0% in model validation. With few exceptions, the actual ADG and G:F was within the standard deviations of the predicted values (Figure 4). The intercepts and slopes of linear regressions when residuals were plotted against predicted values in model training and validation (Figure 5) were not significantly different from zero (P≥0.34), hence giving no evidence of a prediction bias of the models.
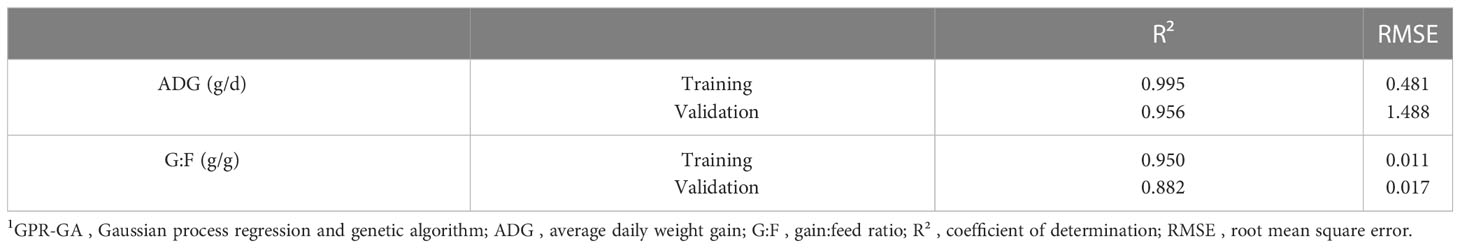
Table 1 Model fit of the GPR-GA models for ADG and G:F.1.
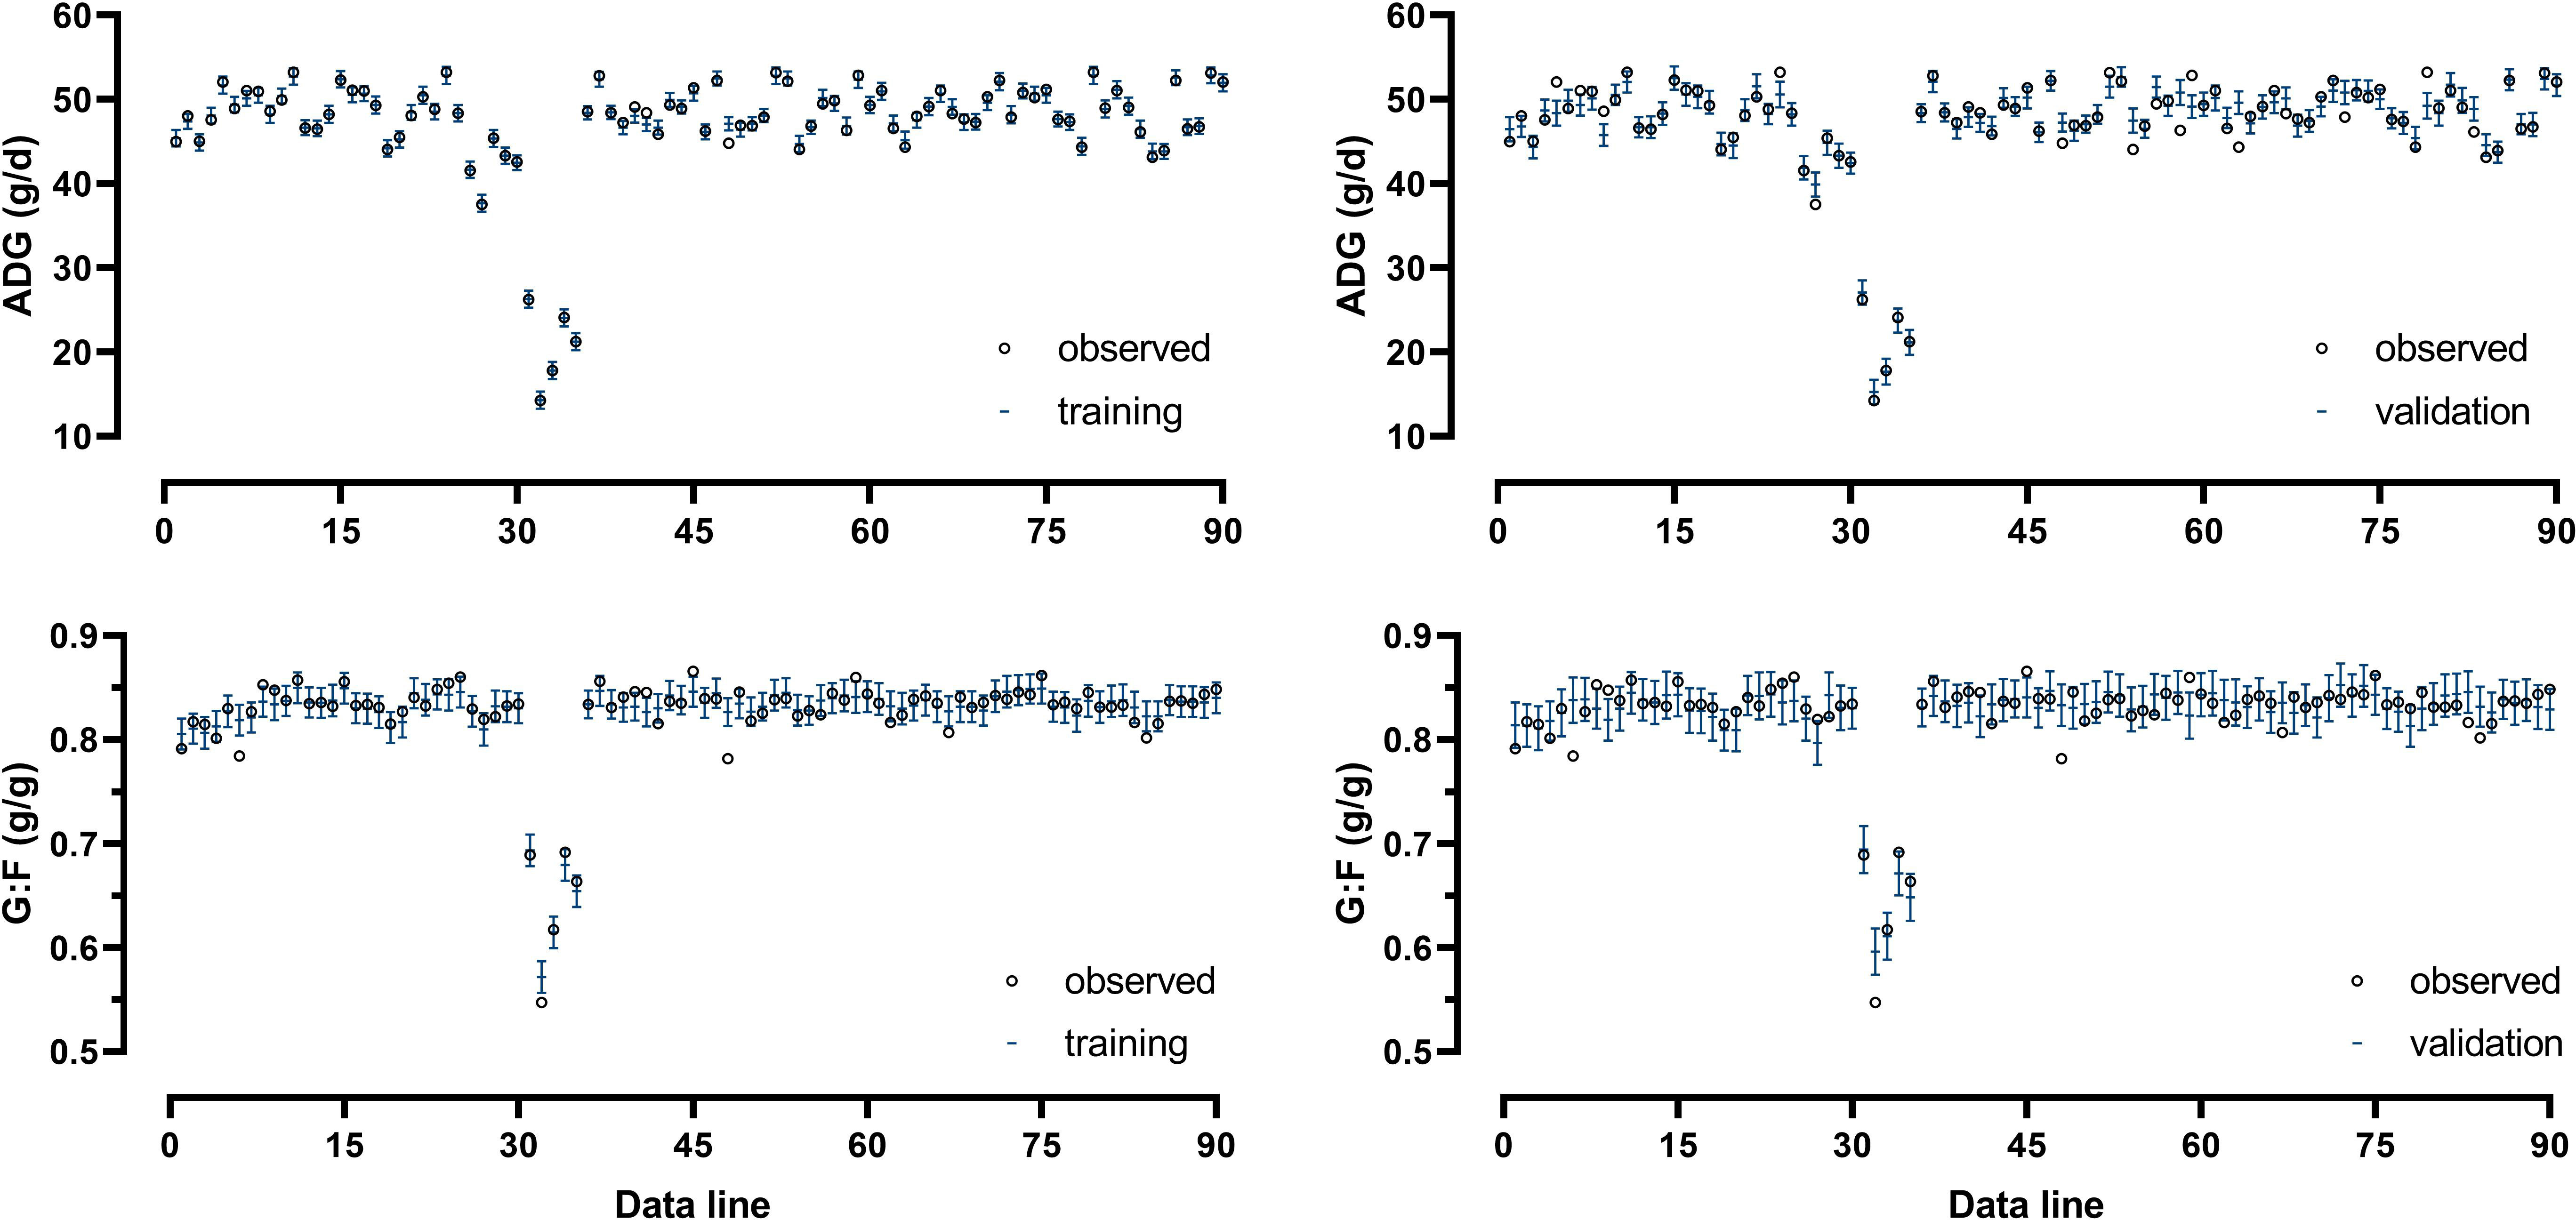
Figure 4 Comparison of actual and predicted values of average daily weight gain (ADG) and the gain:feed ratio (G:F) from training and validation of the Gaussian process regression and genetic algorithm (GPR-GA) hybrid model. Error bars indicate the standard deviation of the predictions.
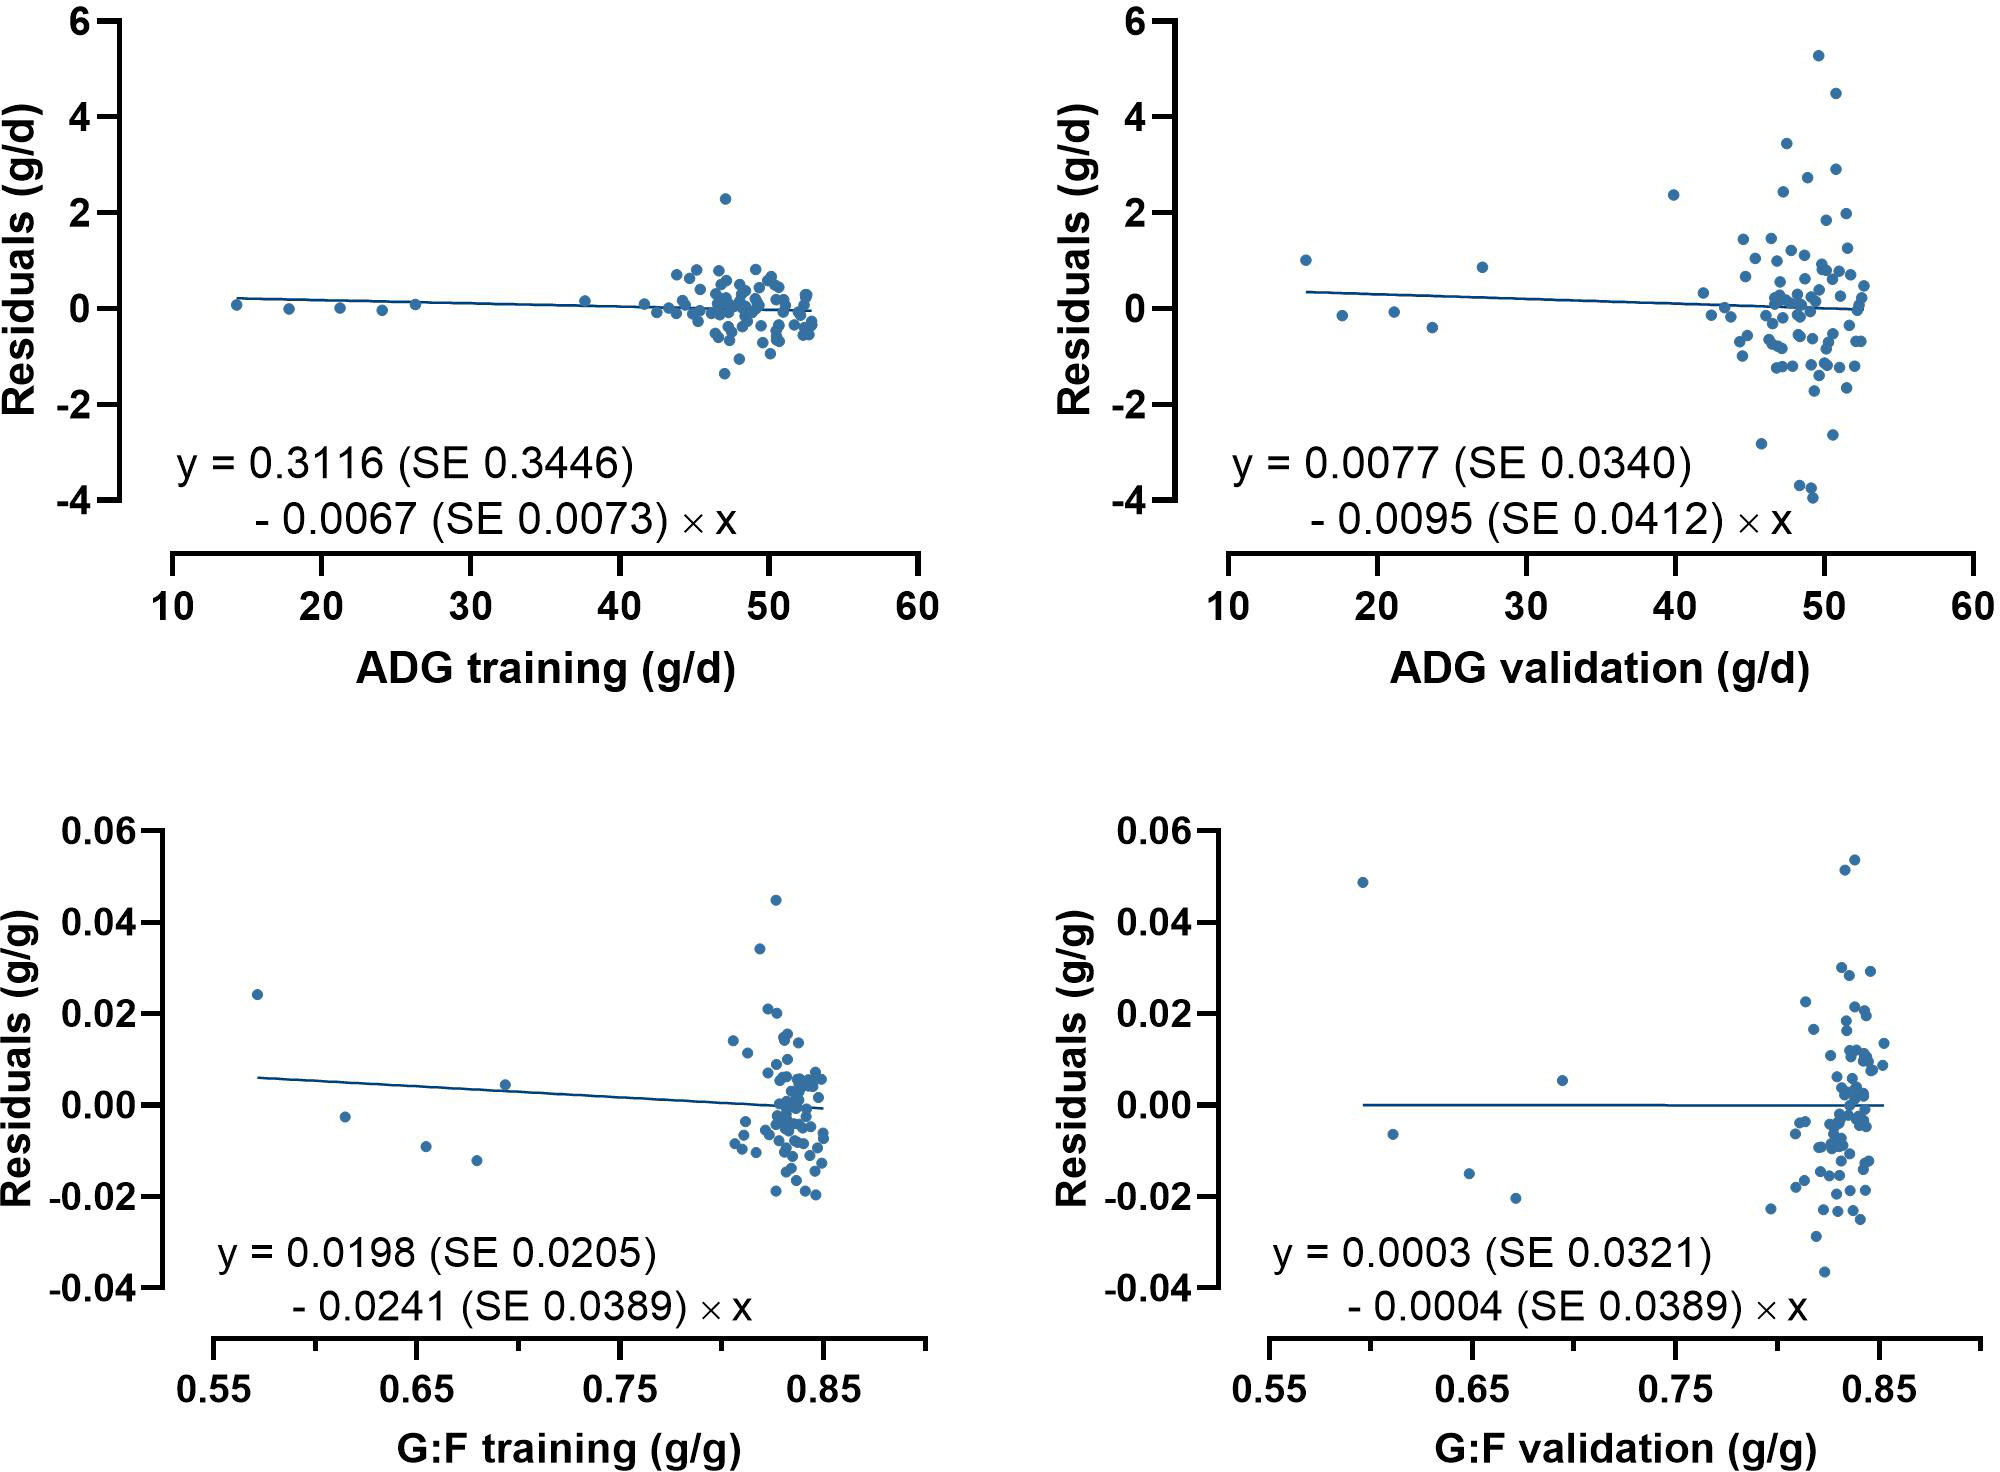
Figure 5 Plots of residuals against of predicted average daily weight gain (ADG) and the gain:feed ratio (G:F) in model training and validation. None of the intercepts and slopes of the linear regressions were significantly different from 0 (P≥0.34).
The relative importance of the input variables on the prediction of the model outputs was determined using global sensitivity values. The sensitivity analysis indicated an importance of dThr > dGlyequi > tCho for both the ADG and the G:F model (Figure 6).
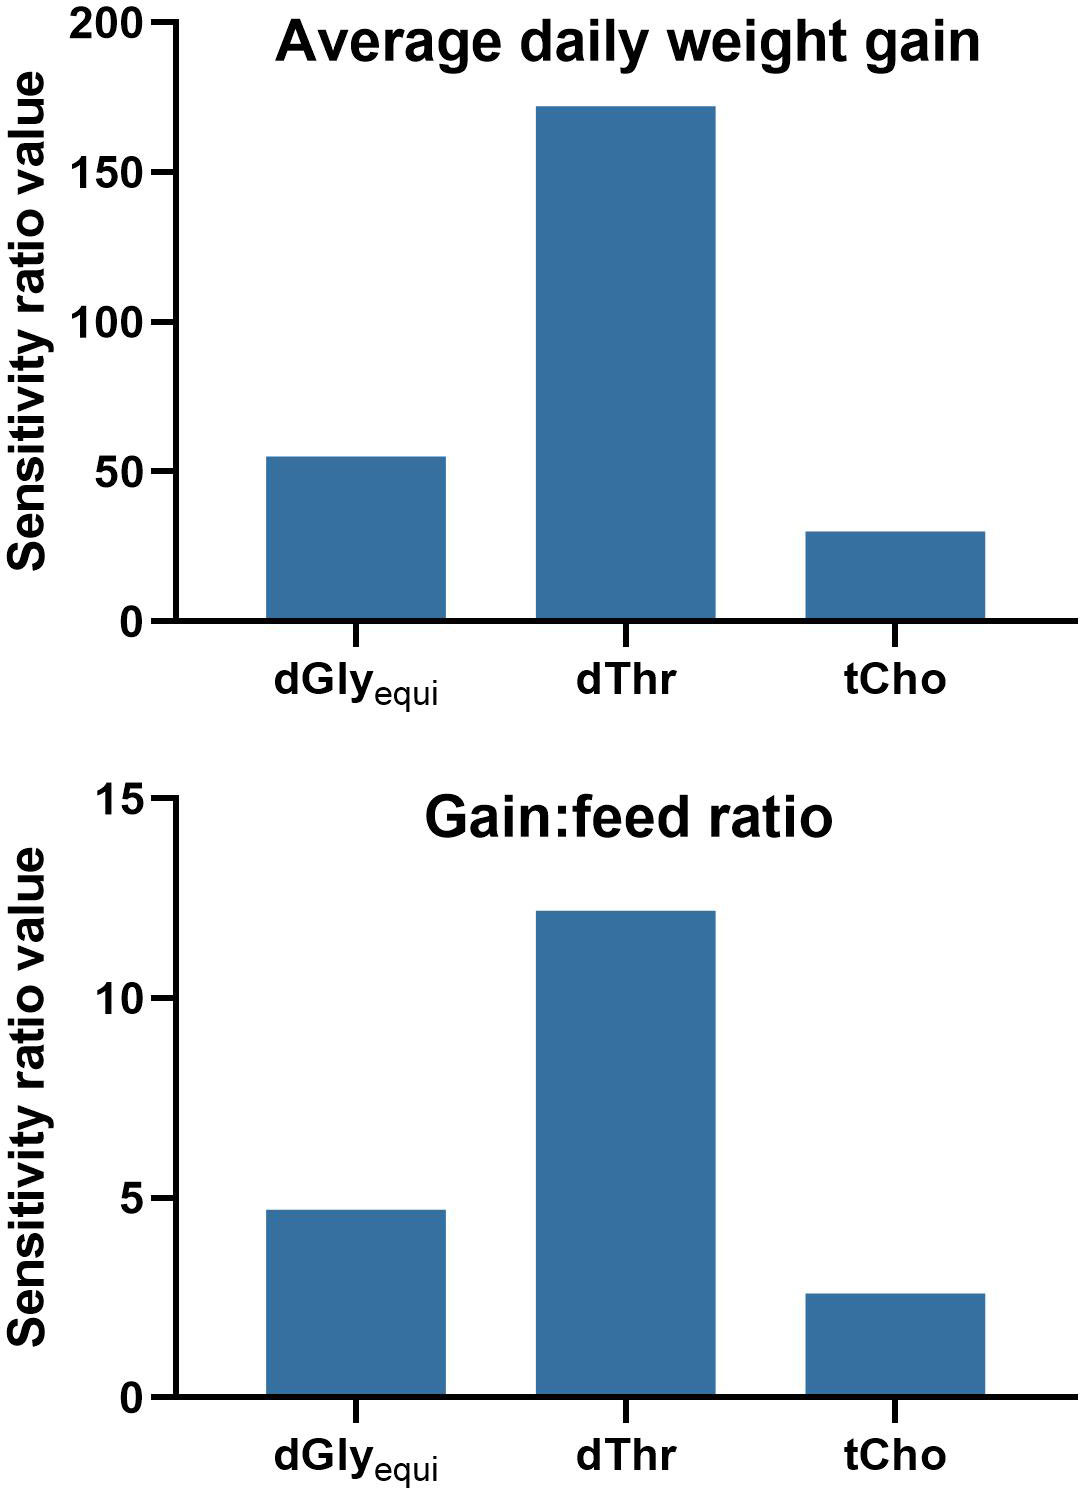
Figure 6 Sensitivity analysis of the Gaussian process regression and genetic algorithm hybrid models for the intake of digestible glycine equivalents (dGlyequi), digestible threonine (dThr), and total choline (tCho). High variable sensitivity ratio values indicate a high relevance of the input variable to the model output. A value of 1 indicates no relevance of the input variable for the model output.
3.2 Single-objective optimization
Single-objective optimization showed that maximum ADG of 53.5 g/d was achieved with intakes of 1397 mg dGlyequi/d, 482 mg dThr/d, and 83 mg tCho/d, while maximum G:F of 0.850 g/g was achieved with 1053 mg dGlyequi/d, 443 mg dThr/d, and 60 mg tCho/d (Table 2). Converting the values to dietary concentrations, as often preferred in feed formulation, revealed that the maximum ADG needed 23.4 g dGlyequi/kg, 8.08 g dThr/kg, and 1.39 g tCho/kg in the feed while concentrations needed for maximum G:F were at 17.6 g dGlyequi/kg, 7.42 g dThr/kg, and 1.01 g tCho/kg (all nutrient concentrations derived from the dataset evaluated herein are on an 88% dry matter basis).
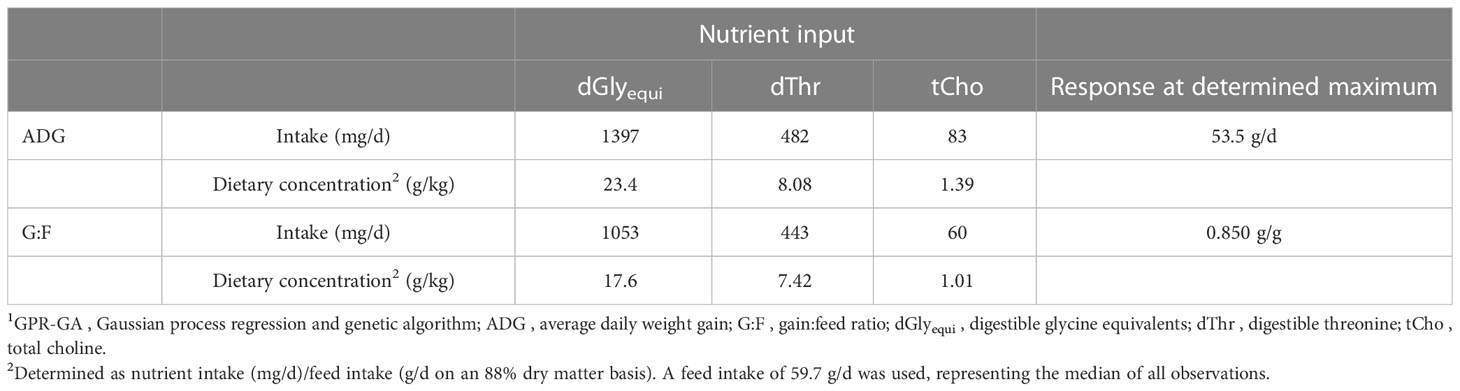
Table 2 Single-objective optimization results of the GPR-GA models for the combination of three nutrient input variables to reach maximum predicted response for ADG and G:F of broiler chickens.1.
3.3 Bi-objective optimization
The modelling process of bi-objective optimization resulted in a preset number of determined scenarios in a Pareto front. The determined scenarios quantified the conflict-of-aims between maximizing ADG and G:F (Table 3; Figure 7). The scenarios followed a four-parameter sigmoidal regression with a maximum ADG at 53.1 g/d in combination with a G:F of 0.844 g/g and maximum G:F of 0.850 g/g in combination with an ADG of 51.4 g/d. The inflection point of the regression was at an ADG of 52.6 g/d and a G:F of 0.847 g/g. The range in intake of the nutrients for optimal scenarios was 1048–1106 mg dGlyequi/d, 437–445 mg dThr/d, and 63–71 mg tCho/d. The intake ranges converted to dietary concentrations accounted for 17.6–18.5 g dGlyequi/kg, 7.31–7.46 g dThr/kg, and 1.06–1.19 g tCho/kg.
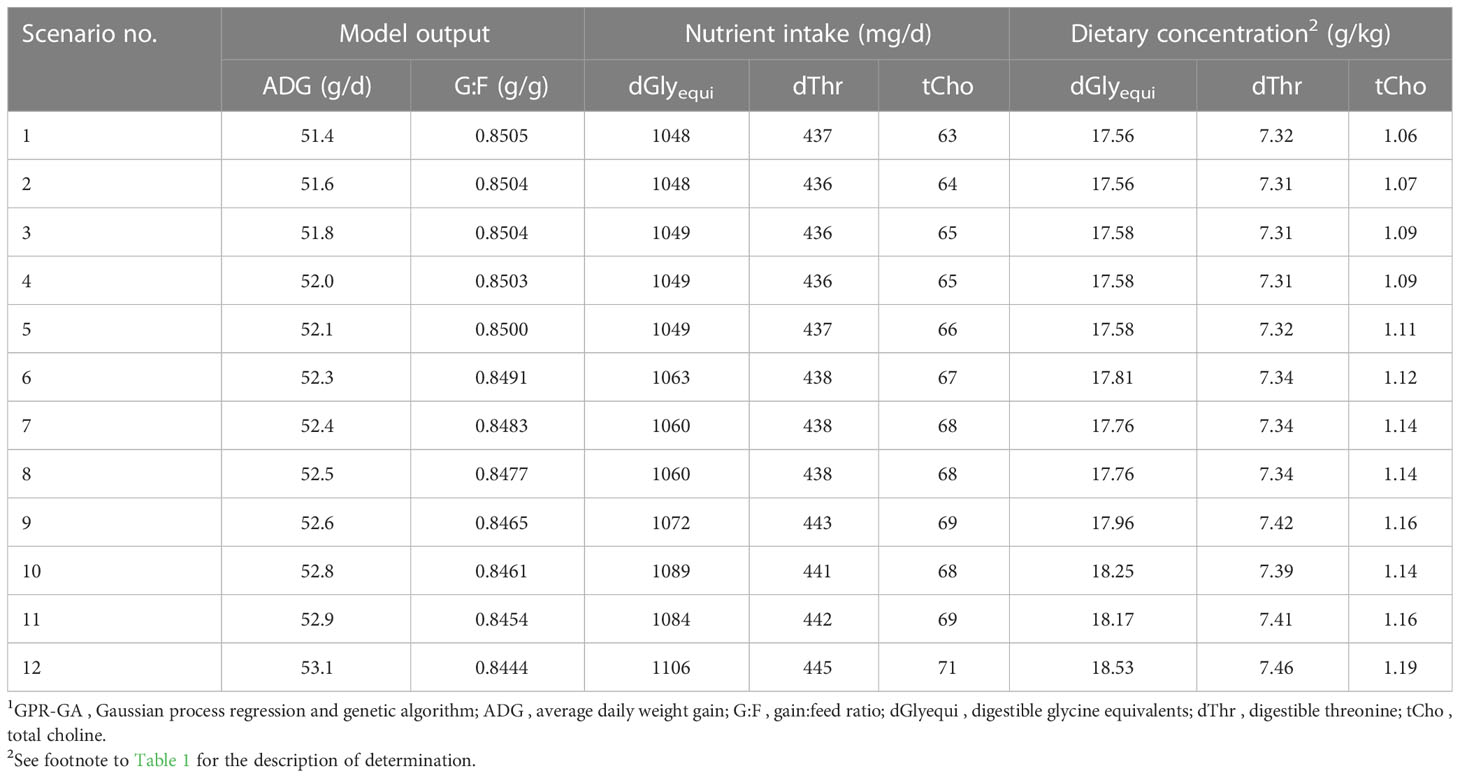
Table 3 Results of bi-objective optimization using GPR-GA for the combination of three nutrient input variables with ADG and G:F as objectives to be maximized.1.
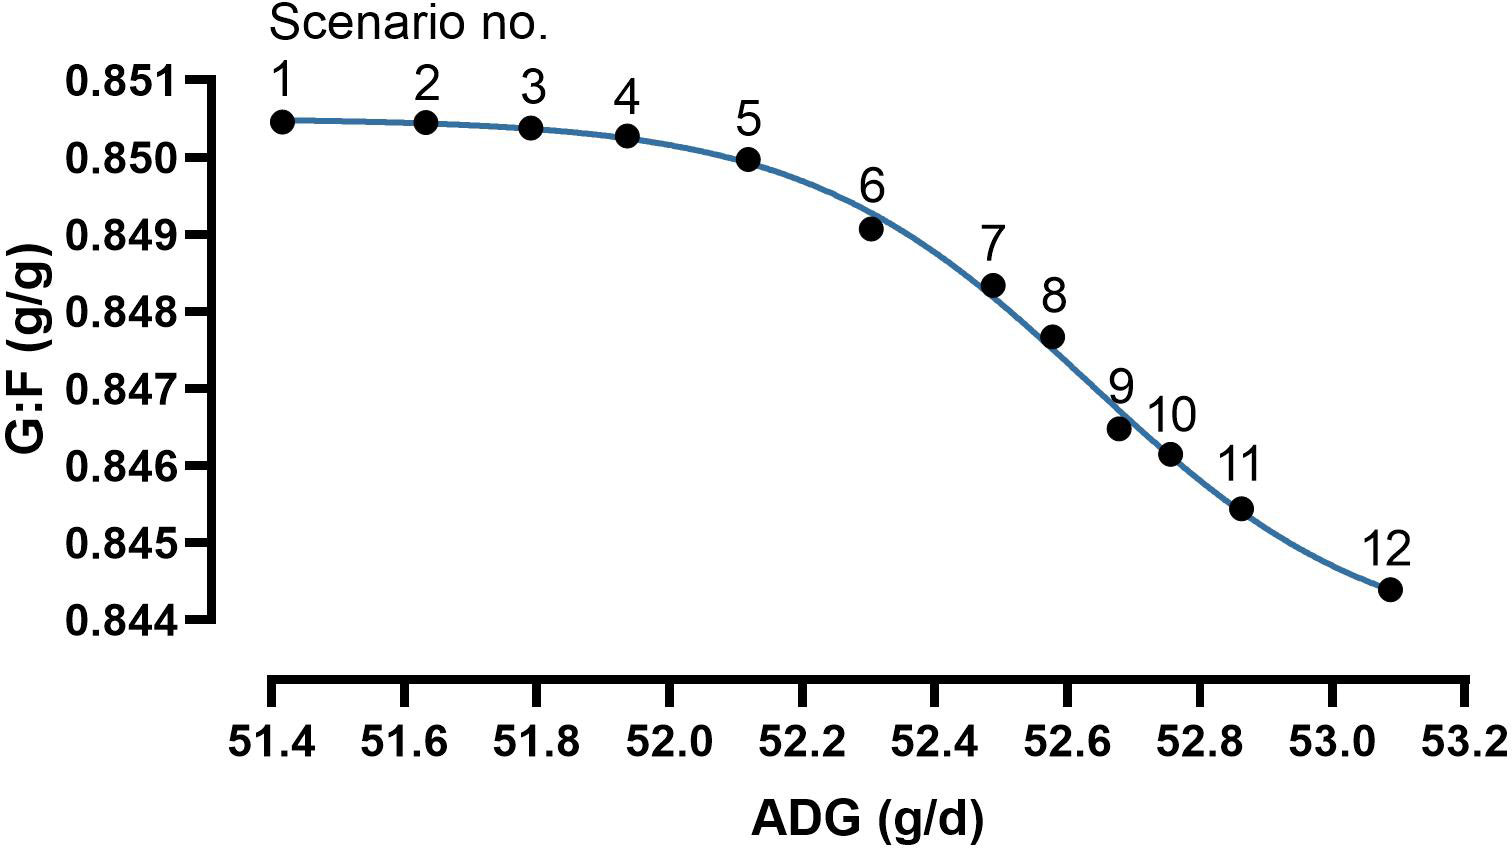
Figure 7 Results of bi-objective optimization using a Gaussian process regression and genetic algorithm hybrid (GPR-GA) for the combination three nutrient input variables with average daily weight gain (ADG) and the gain:feed ratio (G:F) as objectives to be maximized. The results obtained by the Pareto front are considered as the set of solutions that are not dominated by any other solution. Combinations of input variables and response traits are presented in Table 3. Parameter estimates and goodness-of-fit criteria of the four-parameter sigmoidal function (Eq. 4) were: minimum plateau 0.8436 g/g, maximum plateau 0.8505 g/g, inflection point 52.6 g/d, slope -2.02, R² 0.997.
The increase in accuracy by quantifying the trade-off between the response traits compared with choosing a trade-off on a linear line between the maxima of response traits was measured by calculating areas under the curve. This evaluation included a right-angled triangle with the line between scenarios no. 1 and no. 12 as the hypotenuse and the four-parameter sigmoidal regression. A value of 0.8444 was chosen as the baseline of the areas because this value represented the lowest G:F among the determined scenarios (Table 3; Figure 7). The area under the sigmoidal regression accounted for 137% of the area of the triangle.
Higher intake of dGlyequi, dThr, and tCho was needed in scenarios optimized towards higher ADG while lower intake of those nutrients was needed in scenarios optimized towards higher G:F (Figure 8). Commencing from maximized G:F, small increases in dGlyequi and dThr intake shifted the optimization from maximized G:F slightly towards higher ADG. Larger increases in dGlyequi and dThr intake were needed to shift the optimization further towards maximized ADG. For tCho, the increase in needed intake was proximately linear when the optimization shifted from maximized ADG to maximized G:F.
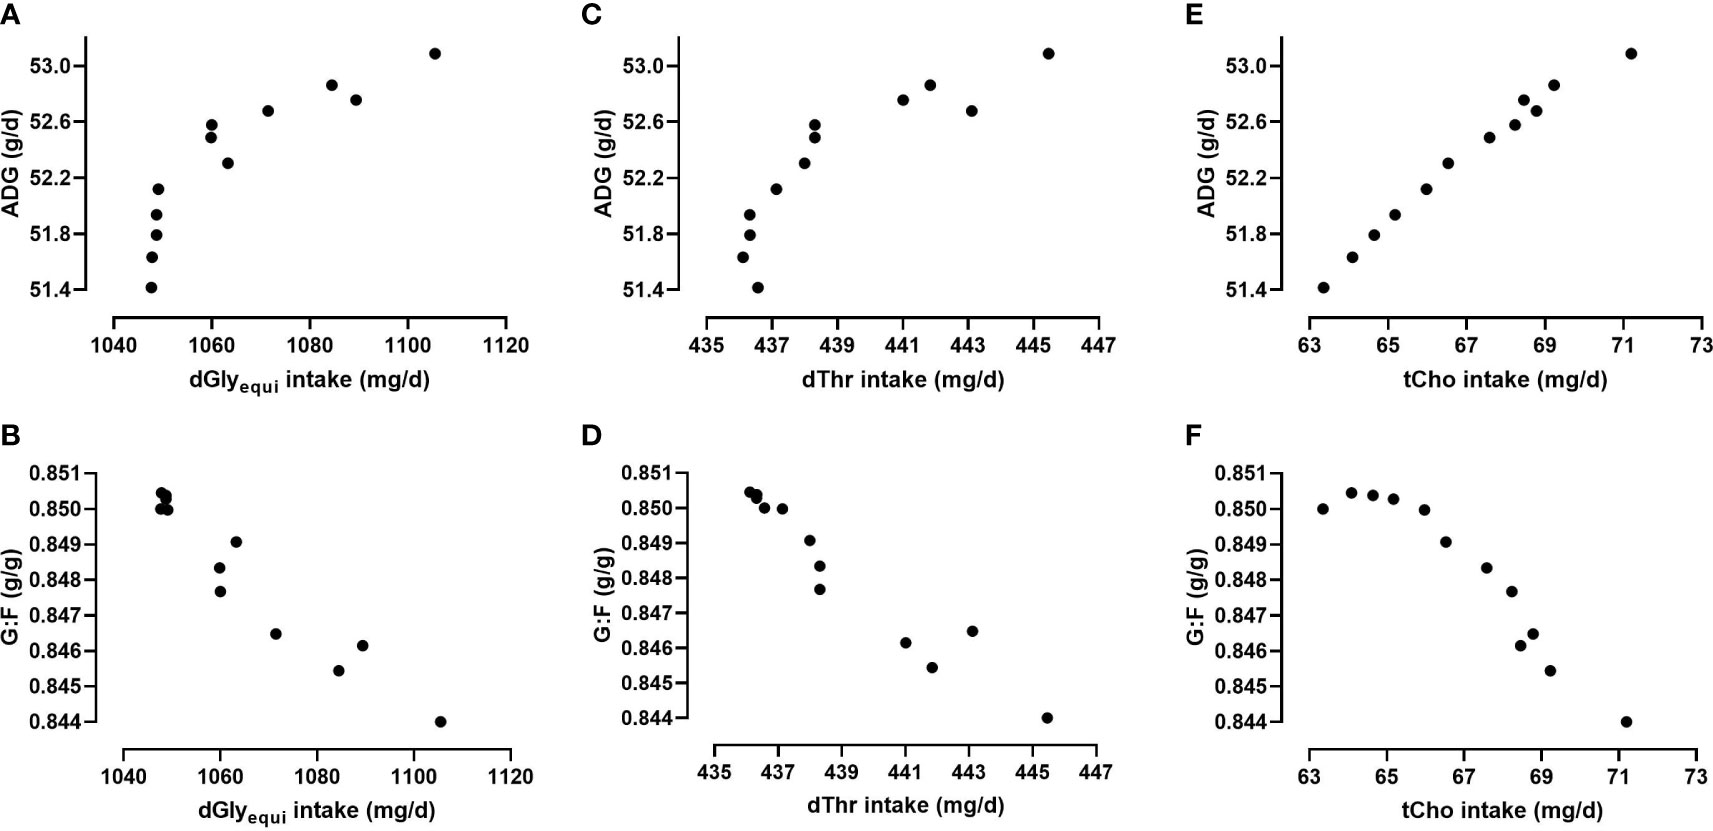
Figure 8 Relationship between the intake of digestible glycine equivalents (dGlyequi), digestible threonine (dThr), and total choline (tCho) and the average daily weight gain (ADG; A, C, E) and the gain:feed ratio (G:F; B, D, F) in determined scenarios of bi-objective optimization using the Gaussian process regression and genetic algorithm (GPR-GA) hybrid model.
4 Discussion
4.1 Evaluation of the GPR model
One aim of this work was to investigate whether GPR is a suitable tool to model responses to the supply of three nutrients. All evaluated model accuracy indicators, including goodness-of-fit and prediction bias, suggested that the GPR models appropriately predicted ADG and G:F based on dGlyequi, dThr, and tCho intake.
GPR represents a modelling method that is more suitable in different situations than neural networks (Kamath et al., 2018), which were used to evaluate the data of the same experiment in the previous communication (Siegert et al., 2015). GPR does not require a pre-defined specification of fitting functions and, hence, has a general ability to predict nearly all types of nonlinearity in data (Roberts et al., 2013; Tonner et al., 2017). The GPR model structure is formed according to the number of data lines so that the number of data lines equals the number of equations in a GPR model. Hence, complexity in GPR modelling increases with the number of data lines. This is in contrast to neural networks, which need a pre-defined architecture (number of layers, layer neurons, and activation functions) before model training. In terms of model structure, GPR can make predictions as weighted linear combinations of existing mean values in the data set using kernel function. This characteristic makes GPR capable of estimating interpretable uncertainty (Kamath et al., 2018), which is beneficial in our application in which standard deviation of the predictions are needed to make inference (Figure 4). The neural network architecture has an impact on the outcome and needs to be chosen by the operator if the model structure is not optimized using GA (Benardos and Vosniakos, 2007; Hofmann et al., 2020) and GA is helpful to avoid that local optima are determined as the best solution (Benardos and Vosniakos, 2007). With a combination of both parametric and nonparametric compartments (as described in equation 1), GPR models are capable of modeling datasets in a both deterministic and probabilistic framework. The probabilistic framework adds the consideration of the randomness in data sets into the model. Therefore, an improved prediction of the dependent variable can be obtained (Sai et al., 2019). The soft computing methods of data handling, including GPR and neural networks, usually require a high amount of data to build an effective model. However, GPR models may be less sensitive to the amount of data if the data set is statistically well-distributed in the input domain and follows Gaussian distributions (Tonner et al., 2017; Schulz et al., 2018; Sai et al., 2019). Otherwise and particularly in small data sets, generalization of GPR models can be limited when the model does not learn with adequate informative data. Animal nutrition datasets are often relatively small owing to the high effort of data generation in animal trials.
The expenditure of running the developed GPR model cannot be generalized because of specific frameworks such as size of the data set and computer capacity. The number of data lines determines the time needed to find optimum (hyper)parameters and to calculate the covariance matrix. The runtime complexity may be presented as a relative value of n³, where n is the number of data lines. In our case, the dataset was small (n<100) and it was analyzed using a typical workstation computer with Intel® Core™ i6 CPU, 32GB RAM. The time needed to perform the process of modeling were less than 2 minutes for both the ADG and G:F models.
The general outcome of the data evaluation using GPR was similar compared to the evaluation of the same data with neural networks (Siegert et al., 2015) with some differences, which is common when different evaluation methods are used. Both evaluation methods led to very high goodness-of-fit of R² ≥0.95 of model training. Model validation using k-fold cross validation was performed for GPR while model testing using holdback data was done for neural networks (Siegert et al., 2015). Hence, comparisons of corresponding model-fit values are inexpedient. The GPR evaluation led to slightly higher and close-to-equal R² values compared to the evaluations of ADG and G:F using neural networks, respectively. However, the observed differences are of little relevance considering the magnitude of R². The ranking of variable sensitivity ratio values of the sensitivity analysis was identical, confirming the considerable importance of dThr and dGlyequi intake on ADG and G:F and the low impact of tCho intake in this experiment.
4.2 Bi-objective optimization
The second aim of this work was to quantify the trade-off between the objectives of maximizing ADG and G:F. GPR-GA was shown to be suitable for this purpose, thereby conforming one hypothesis of this study. Single-objective optimization confirmed that ADG and G:F cannot be maximized simultaneously because the nutrient intake at the maxima was different. The bi-objective optimization revealed that the trade-off between maximized ADG and G:F was not linear (Figure 6). This supported the main hypothesis of this study. Originating from maximized G:F, increasing the ADG initially hardly compromised G:F. The more ADG was prioritized in the optimization, the more pronounced was the trade-off between maximized ADG and G:F up to the inflection point of the four-parameter sigmoidal regression. The trade-off became less pronounced when ADG was further prioritized. Without quantifying the trade-off between maximized ADG and G:F, feed formulators would choose target values intermediate to maximized ADG and G:F after single-objective optimization, thereby assuming that the trade-off was linear. However, the trade-off between maximized ADG and G:F was nonlinear in this study. The increase in accuracy by quantifying the trade-off between the response traits was considerable in our dataset, as indicated by the relative difference of areas under the curve of a linear line between the maxima of response traits and the sigmoidal regression. Hence, quantifying the trade-off between maximized ADG and G:F using GPR-GA can enable feed formulators to more accurately define their specific targets of feed formulation.
Higher intake levels of dGlyequi, dThr, and tCho were needed in scenarios optimized towards higher ADG instead higher G:F (Figure 8). This relationship was subject to a scattering which may be explained by interacting effects of dietary Glyequi and Thr on ADG and G:F (Corzo et al., 2009; Siegert et al., 2015; Star et al., 2021). Hence, scenarios with similar response values in Figures 8A–D may have been determined with different combinations of dGlyequi and dThr intake. Responses in ADG and G:F to dGlyequi and dThr intake were additionally affected by tCho intake, but the extent of this effect was rather low (Siegert et al., 2015). The absence of a pronounced interaction of tCho intake on responses to dGlyequi and dThr intake may have caused the minor scattering of the determined tCho intake in the optima scenarios (Figure 8E, F).
5 Conclusions
This research showed that quantifying the trade-off between the objectives of maximizing ADG and maximizing G:F by bi-objective optimization using the developed GPR-GA algorithm enables to formulate diets more precisely because the trade-off was not linear. GPR was determined as a suitable tool to model growth performance of broiler chickens based on the intake of three nutrients simultaneously via a Pareto front that is to be considered as a set of solutions that are not dominated by any other solution. Knowledge of the trade-off between maximized ADG and maximized G:F as well as the needed nutrient concentrations will help feed formulators to better optimize their feed.
Further information
Presented in part in: Ahmadi H, Siegert W, Rodehutscord M. Estimating optimal amino acids intake of broiler chickens using Gaussian process regression and genetic algorithm. Proc. Soc. Nutr. Physiol. (2022) 31:106 (abstract).
Data availability statement
The dataset was published as online supplementary material to a previously published experiment (Siegert et al., 2015). The GPR-GA program and source code is available at https://github.com/hahmadima/GPR_GA_Multi_obj.git.
Ethics statement
Ethical review and approval was not required for the animal study because this study used previously published data.
Author contributions
HA, WS, MR: Conceptualization. HA, WS: Data analysis. HA, WS, MR. Data interpretation. HA, WS: Manuscript draft. MR: Supervision. HA, WS, MR: Revision of the paper and approval of the final draft. All authors contributed to the article and approved the submitted version.
Funding
A Georg Forster Research Fellowship of the Alexander von Humboldt Foundation for Hamed Ahmadi is gratefully acknowledged.
Conflict of interest
The authors declare that the research was conducted in the absence of any commercial or financial relationships that could be construed as a potential conflict of interest.
Publisher’s note
All claims expressed in this article are solely those of the authors and do not necessarily represent those of their affiliated organizations, or those of the publisher, the editors and the reviewers. Any product that may be evaluated in this article, or claim that may be made by its manufacturer, is not guaranteed or endorsed by the publisher.
References
Ahmadi H., Golian A. (2011). Response surface and neural network models for performance of broiler chicks fed diets varying in digestible protein and critical amino acids from 11 to 17 days of age. Poult Sci. 90, 2085–2096. doi: 10.3382/ps.2011-01367
Alagawany M., Elnesr S. S., Farag M. R., Tiwari R., Yatoo M. I., Karthik K., et al. (2021). Nutritional significance of amino acids, vitamins and minerals as nutraceuticals in poultry production and health - a comprehensive review. Vet. Q 41, 1–29. doi: 10.1080/01652176.2020.1857887
Ayasan T., Ferda, Okan, Hizli H. (2009). Threonine requirement of broiler from 22-42 days. Int. J. Poult Sci. 8, 862–865. doi: 10.3923/ijps.2009.862.865
Baiz A. A., Ahmadi H., Shariatmadari F., Karimi Torshizi M. A. (2020). A Gaussian process regression model to predict energy contents of corn for poultry. Poult Sci. 99, 5838–5843. doi: 10.1016/j.psj.2020.07.044
Benardos P. G., Vosniakos G.-C. (2007). Optimizing feedforward artificial neural network architecture. Eng. Appl. Artif. Intell. 20, 365–382. doi: 10.1016/j.engappai.2006.06.005
Corzo A., Kidd M. T., Dozier W. A., Kerr B. J. (2009). Dietary glycine and threonine interactive effects in broilers. J. Appl. Poult Res. 18, 79–84. doi: 10.1093/ps/83.8.1382
Deb K., Pratap A., Agarwal S., Meyarivan T. (2002). A fast and elitist multiobjective genetic algorithm: NSGA-II. IEEE Trans. Evol. Comput. 6, 182–197.
Eder K., Peganova S., Kluge H. (2001). Studies on the tryptophan requirement of piglets. Arch. Tierern 55, 281–297. doi: 10.1080/17450390109386198
Gesellschaft für Ernährungsphysiologie (1999). Empfehlungen zur Energie- und Nährstoffversorgung der Legehennen und masthühner (Broiler); Energie- und nährstoffbedarf landwirtschaftlicher Nutztiere (Frankfurt am Main: DLG-Verlag).
Hofmann P., Siegert W., Ahmadi H., Krieg J., Novotny M., Naranjo V. D., et al. (2020). Interactive effects of glycine equivalent, cysteine, and choline on growth performance, nitrogen excretion characteristics, and plasma metabolites of broiler chickens using neural networks optimized with genetic algorithms. Animals 10, 1392. doi: 10.3390/ani10081392
Jansman A., te Pas M. (2015). Techniques for evaluating nutrient status in farm animals. wageningen UR (University & research centre) livestock research. Livestock Res. Rep. 846.
Kamath A., Vargas-Hernández R. A., Krems R. V., Carrington T., Manzhos S. (2018). Neural networks vs Gaussian process regression for representing potential energy surfaces: A comparative study of fit quality and vibrational spectrum accuracy. J. Chem. Phys. 148, 241702. doi: 10.1063/1.5003074
Mathworks (2021). Statistics and machine learning toolbox™ user’s guide R2021b (Natick, MA: The MathWorks Inc). Available at: https://de.mathworks.com/help/pdf_doc/stats/index.html.
Rasmussen C. E., Williams C. K. I. (2006). Gaussian Processes for machine learning (Cambridge, MA, USA: The MIT Press). Available at: https://www.google.de/books/edition/Gaussian_Processes_for_Machine_Learning/Tr34DwAAQBAJ?hl=en&gbpv=1&dq=inauthor:%22Carl+Edward+Rasmussen%22&printsec=frontcover.
Roberts S., Osborne M., Ebden M., Reece S., Gibson N., Aigrain S. (2013). Gaussian Processes for time-series modelling. Philos. Trans. R Soc. A 371, 20110550. doi: 10.1098/rsta.2011.0550
Rodehutscord M. (2008). Ansatzpunkte zur Schonung der begrenzten Phosphorressourcen. Arch. Tierz 51, S39–S48.
Rodehutscord M., Jacobs S., Pack M., Pfeffer E. (1995). Response of rainbow trout (Oncorhynchus mykiss) growing from 50 to 170 g to supplements of either l-arginine or l-threonine in a semipurified diet. J. Nutr. 125, 970–975. doi: 10.1093/jn/125.4.970
Sai A., Vivas-Valencia C., Imperiale T. F., Kong N. (2019). Multiobjective calibration of disease simulation models using Gaussian processes. Med. Decis Making 39, 540–552. doi: 10.1177/0272989X19862560
Schulz E., Speekenbrink M., Krause A. (2018). A tutorial on Gaussian process regression: Modelling, exploring, and exploiting functions. J. Math Psychol. 85, 1–16. doi: 10.1016/j.jmp.2018.03.001
Siegert W., Ahmadi H., Helmbrecht A., Rodehutscord M. (2015). A quantitative study of the interactive effects of glycine and serine with threonine and choline on growth performance in broilers. Poult Sci. 94, 1557–1568. doi: 10.3382/ps/pev109
Simon J. (1999). Choline, betaine and methionine interactions in chickens, pigs and fish (including crustaceans). Worlds Poult Sci. J. 55, 353–374. doi: 10.1079/WPS19990025
Simon O. (2008). “Ernährungsphysiologie - Verwertung des Eiweißes und Eiweißbewertung,” in Ernährung landwirtschaftlicher Nutztiere. 2nd ed. Eds. Jeroch H., Drochner W., Simon O. (Stuttgart: Eugen Ulmer KG), 154–161.
Star L., Tesseraud S., van Tol M., Minussi I., Corrent E., Lambert W. (2021). Production performance and plasma metabolite concentrations of broiler chickens fed low crude protein diets differing in thr and gly. Anim. Nutr. 7, 472–480. doi: 10.1016/j.aninu.2020.09.003
St-Pierre N. R. (2001). Invited review: Integrating quantitative findings from multiple studies using mixed model methodology. J. Dairy Sci. 84, 741–755. doi: 10.3168/jds.S0022-0302(01)74530-4
Swain P. S., Stevenson K., Leary A., Montano-Gutierrez L. F., Clark I. B. N., Vogel J., et al. (2016). Inferring time derivatives including cell growth rates using Gaussian processes. Nat. Commun. 7, 13766. doi: 10.1038/ncomms13766
Keywords: multi-objective optimization, Gaussian process regression, genetic algorithm, machine learning, broiler chickens, feed optimization
Citation: Ahmadi H, Rodehutscord M and Siegert W (2023) Bi-objective optimization of nutrient intake and performance of broiler chickens using Gaussian process regression and genetic algorithm. Front. Anim. Sci. 4:1042725. doi: 10.3389/fanim.2023.1042725
Received: 13 September 2022; Accepted: 17 February 2023;
Published: 08 March 2023.
Edited by:
Suresh Neethirajan, Farmworx Research Institute, NetherlandsReviewed by:
Jose Manuel Velasco, Complutense University of Madrid, SpainMbajiorgu C.A., University of South Africa, South Africa
Copyright © 2023 Ahmadi, Rodehutscord and Siegert. This is an open-access article distributed under the terms of the Creative Commons Attribution License (CC BY). The use, distribution or reproduction in other forums is permitted, provided the original author(s) and the copyright owner(s) are credited and that the original publication in this journal is cited, in accordance with accepted academic practice. No use, distribution or reproduction is permitted which does not comply with these terms.
*Correspondence: Wolfgang Siegert, aW5zdDQ1MEB1bmktaG9oZW5oZWltLmRl