
94% of researchers rate our articles as excellent or good
Learn more about the work of our research integrity team to safeguard the quality of each article we publish.
Find out more
ORIGINAL RESEARCH article
Front. Anim. Sci., 24 August 2022
Sec. Animal Physiology and Management
Volume 3 - 2022 | https://doi.org/10.3389/fanim.2022.951840
 Jing Sun1,2,3†
 MengYing Li1†Hua Zhou4,5Jie Chong1
 JinWei Zhang1,2,3
 Bing Yu4
 DaiWen Chen4*LiangPeng Ge1,2,3*
Several studies on the role of HCA species in regulating glucose homeostasis have indicated their therapeutic value in human obesity and diabetes. There is a clear difference in the percentage of hyocholic acid (HCA) and its derivatives (also known as HCA species) in the total bile acid (BA) pool in the plasma between humans, rats and pigs. However, the role of gut microbiota in BA profiles of pigs remains unclear. We generated five germ-free pig models and six gnotobiotic pig models by fecal microbiota transplantation (FMT). A total of 46 BAs were detected in the jejunum, cecum, colon, and rectum chyme, 37 and 33 BAs were detected in bile, 33 BAs were detected in ileal chyme and liver, and 31 BAs were detected in serum. FMT increased the percentages of HCA species in total bile acids in the serum (79%), liver (78%), and bile (71%), but decreased the proportions of HCA species in the total BAs of the ileum (61%), cecum (47%), colon (51%), and rectum (57%) of pigs, as compared to GF piglets. FMT significantly induced the production of conjugated bile acids in the small intestine and increased the concentrations of free BAs in the large intestine of pigs (P < 0.01). FMT piglets had over 68-fold and 104-fold increases in conjugated BAs in the ileum compared to the germ-free piglets. FMT piglets had an expression pattern distinct from that of germ-free piglets for genes involved in bile acid receptors, synthesis, signaling, and transport. The gene expression levels of the rate-limiting enzyme CYP7A1 and the enzymes CH25H and BAAT involved in BA synthesis were significantly decreased in the liver of FMT piglets, and there was a significant reduction in the gene expression of FXR and TGR5 through the FGFR4/β-Klotho pathway that promotes the BA pool in the liver of piglets after FMT.
Bile acids (BAs) constitute approximately 50% of the organic components of bile. BAs are water-soluble end products of cholesterol metabolism that are synthesized in the liver hepatocytes and secreted into the duodenum through the bile flow (Begley et al., 2005). BAs have distinct physiological regulation of their synthesis, conjugation, transport, and detoxification. Studies in the past several decades have revealed that BAs play important roles in fat emulsification and absorption, antibacterial defense, and shaping the host immune responses (Inagaki et al., 2006; Deeks, 2016; Shapiro et al., 2018).
A recent study has reported that there is a distinct difference in the BA composition and concentration between pigs, humans, and rats. Cholic acid (CA) and chenodeoxycholic acid (CDCA) are the primary BAs in humans, while muricholic acid (MCA), CA, and CDCA are the major BAs in rats. However, pigs have a high proportion of hyocholic acid (HCA) and its derivatives (also known as HCA species) in the plasma (>75%), but these comprised only ~1% of total BAs in the plasma of humans and rats (Spinelli et al., 2016). HCA species, including HCA, hyodeoxycholic acid (HDCA), and their glycine- and taurine-conjugated derivatives (glycohyocholic acid [GHCA], taurohyocholic acid [THCA], glycohyodeoxycholic acid [GHDCA], and taurohyodeoxycholic acid [THDCA]), are correlated with glucose levels in diabetes and play a key role in regulating glucose homeostasis through a nuclear farnesoid X receptor (FXR) and cell membrane G-protein-coupled BA receptor (TGR5) signaling (Claudel et al., 2005; Zheng et al., 2021a).
During passage through the intestine after a meal, BAs are transformed by the indigenous microbiome (Midtvedt, 1974; Xie et al., 2021). In healthy pigs, a total of 19 bacterial phyla have been detected, and Firmicutes and Bacteroidetes are the most abundant microbial phyla in the pig gut microbiome (accounting for 70% of the total sequences), with fewer members in Proteobacteria and Actinobacteria (Wang et al., 2019). There are three main transformations of host-derived primary BAs by gut microbes: deconjugation, 7α-dehydroxylation, and 7α-dehydrogenation for the production of secondary BAs (Begley et al., 2005).
Germ-free (GF) mice colonized with human/mouse microbiota have been used to study the effects of environmental and genetic factors on the correlation between gut microbiota and host physiology. However, the BA profile and levels in hepatic and extra-hepatic tissues of pigs, as well as the key roles of gut microbiota in the composition and concentration of BAs, remain unclear. In our previous study we had demonstrated that fecal microbiota transplantation (FMT) increased the total BA level and proportion of secondary BAs in jejunal content and feces of the piglets (Li et al., 2020). Here, we aimed to determine whether and how healthy pig microbiota can affect the BA profile. Such knowledge will be important for understanding the microbiota-induced regulation of BA synthesis and transport in pigs.
The institutional ethics committee of the Chongqing Academy of Animal Science (Chongqing, China) reviewed the relevant ethical issues and approved this study (permit number xky-20150113). All of the experiments were conducted at the Experimental Swine Engineering Center of the Chongqing Academy of Animal Sciences (CMA No. 162221340234; Chongqing, China).
Screening of the FMT donors and the preparation of the fecal suspensions were performed according to a previously reported method (Sun et al., 2021). In brief, donors were animals that reported no eight bacterial enteric pathogens, seven viruses, two parasites, and one mycoplasma, which were line with the recommended national standards of control and monitoring of Specific pathogen-free (SPF) swine pathogens issued by the Standardization Administration of China (https://std.samr.gov.cn; GB/T 22914-2008). Here, the fecal suspensions from six multiparous Bama sows (Zhou et al., 2021a) were processed and preserved for FMT. In this study, based on the method used by Pang et al. (2007), the preparation method of fecal suspension was follow: Freshly stool was collected and put into a sterile, disposable homogenized bag, and the fecal suspension was prepared within 2 hours. In the ultra-clean table, freshly passed stool was diluted 5-fold and homogenized in sterile pre-reduced 0.1M phosphate buffer saline (pH 7.2), filtered through four layers of sterilized medical gauze, and the fecal suspension was collected in a sterile beaker. Finally, the fecal suspension was mixed with 10% sterilized glycerin (vol/vol), and then dispensed to cryotubes and immediately transferred to an environment with temperature of -80 °C.
Twelve neonatal GF Bama miniature piglets (Sus scrofa) were obtained by hysterectomy and were kept in six rearing isolators (Class Biologically Clean Ltd., Madison, Wisconsin, USA). Prior to FMT, each GF piglet in an isolator was checked for aerobic and anaerobic bacterial contamination, and six GF piglets in three isolators were used for FMT at postnatal day 7 (FMT group), and it continued for 3 days. In brief, FMT preparation included an overnight fast prior to FMT, and the FMT protocol comprised an oral administration of 1 mL of homogenized donor fecal suspension (unfrozen at room temperature prior to FMT) blended in 5 mL of sterilized fluid milk (the Co60-γ-irradiated sterile milk powder prepared in our laboratory (Zhou et al., 2020). The remaining six GF piglets in three isolators were treated as the GF group, and the first meal each morning was supplemented with 5 mL of sterilized fluid milk when they were fed at 7-9 days of age. Their rectal swabs and oral mucosa were checked for aerobic and anaerobic bacterial contamination at least once per week until sample collection, and the results of microbial monitoring were recorded as negative or positive (Zhou et al., 2020). Each post-FMT or GF piglet was reared in the isolator and was hand fed. The Co60-γ-irradiated sterile corn-soybean feed prepared in our laboratory (Zhou et al., 2020).
At 42 days of age, blood samples (3 mL in EDTA tubes, 3 mL in heparin tubes, and 20 mL in plain tubes) of each piglet were obtained from the anterior vena cava before the piglets were euthanized under isoflurane anesthesia. The serum samples were separated from blood samples and stored at −80°C for further analysis. On a vertical airflow clean bench, approximately 500 mg digesta from the jejunum, ileum, cecum, colon, and rectum (or fresh feces) were collected on ice and then immediately frozen at −80°C for the BA and metagenomic analyses. Then, the tissues of the jejunum, ileum, cecum, colon, and rectum were washed with cold saline solution, immediately collected in liquid nitrogen, and then stored at −80°C for further analysis. In addition, the left lateral lobe of the liver (~1 g) and bile in the gallbladder of each piglet were also collected and frozen in liquid nitrogen and then stored at −80°C.
Total DNA was extracted from 200 mg of jejunal chyme or stool samples of the FMT group using the QIAamp DNA stool mini kit (QIAGEN Inc., Avenue Stanford, Valencia, USA). Genomic DNA was visualized on 1% agarose gels and determined using an Agilent 2100 Bioanalyzer (Agilent Technologies, Santa Clara, CA, USA). Libraries were generated and sequenced on the Illumina HiSeq2500 platform (2 × 150 bp) (Shanghai Majorbio Bio-pharm Technology Co., Ltd, Shanghai, China).
The data were deposited in the Majorbio I-Sanger Cloud Platform (http://www.i-sanger.com) for further analysis. In detail, sequencing read datasets were quality filtered and then assembled using Multiple Megahit. MetaGene (http://metagene.cb.k.u-tokyo.ac.jp/) was used for gene (ORF) prediction. A non-redundant gene set was constructed by pairwise comparisons of all of the genes using CD-HIT (http://www.bioinformatics.org/cd-hit/) under the criteria of identity > 95% and overlap > 90%. Gene alignment was performed by SOAPaligner (http://soap.genomics.org.cn/) under the criterion of identity > 95%. Gene taxonomic assignments were made on the basis of a BLASTP (BLAST ver. 2.2.28+, http://blast.ncbi.nlm.nih.gov/Blast.cgi) search (e < 1e-5) of the NCBI-NR database and 126 known gut bacteria genomes.
Total RNA was isolated from the frozen jejunum, ileum, cecum, colon, rectum, and liver using Trizol reagent (TakaRa) in accordance with the manufacturer’s instructions. The purity and concentration of the RNA were detected using a NanoDrop ND-2000 spectrophotometer (NanoDrop, Germany). The integrity of RNA was measured by agarose gel electrophoresis, and the 28S:18S ribosomal RNA band ratio was approximately equal to 2. RNA was reverse transcribed into cDNA by the GoScript™ Reverse Transcription System following the manufacturer’s guidelines. Primers for the associated genes (Table 1) were synthesized by Genewiz Ltd. (Suzhou, China). The qPCR was analyzed on an ABI Prism 7000 detection system in a two-step protocol with SYBR Green (Applied Biosystems, Foster City, CA, USA). Each reaction contained 5 μL SYBR®Premix Ex TaqTM II (Tli RNaseH plus), 3.5 μL cDNA, 0.4 μL of each forward and reverse primer, 0.2 μL ROXReference Dye (50×), and 0.5 μL Rnase free dH2O. The PCR conditions were an initial denaturation at 95°C for 30 s, followed by 40 cycles of denaturation at 95°C for 5 s, then annealing at 60°C for 30 s and a 72°C extension step for 5 min. A melting curve was formed following each quantitative real-time PCR determination to verify the specificity of the reactions. GAPDH (as a housekeeping gene) was selected as the reference gene to normalize the mRNA expression of target genes. Gene abundance values of the replicate samples were computed by the 2–ΔΔCT method. Each sample was determined in triplicate.
Table 1 Primers for genes related to BA biosynthesis, receptors, signaling and transport.
PRM assay evaluation was used for the measurement of the expression levels of BA synthesis- and metabolism-related proteins in the liver and ileum samples. The first step was the extraction of protein from the samples, and the second step was to quantify the protein concentration by the Bradford method or the BCA method. Third, SDS-PAGE of protein samples was used to analyze and determine whether the quality of samples met the requirements of subsequent experiments. For sample preparation, reduction alkylation treatment was carried out on the proteins with the standard quality, and then, an equal amount of each protein sample was taken for Trypsin-removal treatment.
For PRM assays, peptide separation was optimized on an EASY-nLC C18 column (75 μm × 25 cm, Thermo Fisher Scientific, USA) using a multistep gradient of B starting at 5% for 1 min, 5%–23% for 63 min, 23%–48% for 88 min, and 48%–100% for 89 min. B was then held at 100% for 95 min and then decreased to 0 to equilibrate the system. A flow rate of 300 nL/min was used, and the total run time was 120 min. ESI source settings were maintained as described above. The PRM assays consisted of one full MS scan, followed by up to 27 targeted MS2 scans. The full MS scan covered the mass range m/z 300–1500 with 60000 resolving power, an AGC target value of 3e6, and maximum IT 100MS. For MS2, the scan settings were 15000 resolving power, AGC target 5e5, and maximum IT 80 ms, and the precursor isolation window was set to 2.0 m/z. The PRM parameters were optimized for up to seven points (0, 0.125, 0.5, 0.75, 1.0, 1.5, 2 mg/mL) across the standard curve.
BAs were quantified by liquid chromatography coupled with mass spectrometry (LC-MS) (Water Acquity UPLC-Xevo TQ-S, Novogene Co., China). A total of 58 kinds of BA standards were accurately weighed, and an aliquot of 0.5 mM standard stock solution was prepared by mixing BA standards. A series of standard calibration solutions were diluted with desalted serum (depleted of BAs using activated charcoal) for the calibration curve. The concentrations of the mixed standard solutions were 1500, 150, and 5 nM as high, medium, and low concentration quality control samples (QC samples). Approximately 10 mg of the sample was mixed with 180 μL acetonitrile-methanol (8:2 v/v) containing 10 internal standards (ISs) (GCA-d4, TCA-d4, TCDCA-d9, UDCA-d4, CA-d4, GCDCA-d4, GDCA-d4, DCA-d4, LCA-d4, and β-CA-d5, 150 nM for each). All of the mixtures were allowed to stand at −20°C for 10 min and then were centrifuged at 13500 rpm at 4°C for 20 min. The supernatant was transferred to another tube and then vacuum-dried. A total of 200 μL acetonitrile-methanol (8:2 v/v) was added. The sample was centrifuged at 13500 rpm at 4°C for 20 min. The supernatant from the extraction was used for LC-MS analysis. Finally, each bile sample was divided into two parts and diluted 1000 and 10000 times with acetonitrile-methanol (8:2 v/v).
All chromatographic separations were performed with an ACQUITY UPLC Cortecs C18 analytical column (1.6 μM, 100 mm × 2.1 mm internal dimensions) (Waters Corp., Milford, MA). The mobile phase consisted of water with 0.01% formic acid (mobile phase A) and acetonitrile/methanol (8/2, v/v) (mobile phase B). The column was maintained at 30°C, and the injection volume for all samples was 5 μL. The flow rate was 0.4 mL/min, and gradient elution was applied. The mass spectrometer was operated in negative ion mode, and the source and desolvation gas temperatures were 150°C and 550°C, respectively. The data were collected with a multiple reaction monitor (MRM), and the cone and collision energy for each BA used the optimized settings from Quan Optimize application manager (Waters Corp., Milford, MA). The processing and quantification of the BA profile raw data were performed using TargetLynx software (Waters Corp., Milford, MA) based on the method described by Zheng et al., (2021a).
We analyzed the levels of 28 biochemical parameters in the serum of FMT and GF piglets using an AU680 automatic biochemical analyzer (Beckman Coulter, Inc., USA). The concentrations of adiponectin, low-density lipoprotein-cholesterol (LDL-c), total cholesterol (TC), glucagon-like peptide 1 (GLP-1), and insulin (INS) of GF piglets were detected and reported by our group (Zhou et al., 2021b). The liver function parameters total protein (TP), globulin (GLO), albumin/globulin (ALB/GLO) ratio, glutamic-pyruvic transaminase (ALT), gamma-glutamyltransferase (GGT), alkaline phosphatase (AKP), cholinesterase (CHE), lactic dehydrogenase (LDH), and creatine kinase (XQCK); the renal function parameters urea nitrogen (BUN) and creatinine (CREA); the glucose parameters glucose (GLU), glucagon (GC), and leptin (LEP); the electrolyte parameters serum sodium ion (NA), serum chloride ion (CL), and serum kalium (K); and the lipid parameters triglyceride (TG) and high-density lipoprotein (HDL) were analyzed in this study.
For statistical comparisons, data were analyzed with SPSS (V24.0, IBM, USA) using the Welch Two-Sample t-test. Analyte levels in tables and figures are presented as mean ± SE or mean ± SD. Spearman’s rank correlation coefficients were calculated to examine the association of BAs and blood parameters or the relative abundance of the bacterial taxa identified in the gut microbiota. Two-tailed p values smaller than 0.05 were considered significant. OriginPro (2019, OriginLab Corp., USA) and Microsoft Office Excel 2016 (Microsoft, USA) were used for graphics generation.
To understand the potential effects of gut microbiota on the BA profile, we compared the BA composition and concentration in the liver, sera, bile (from the gall bladder) as well as intestinal chyme in the jejunum, ileum, cecum, colon, and rectum of GF and FMT piglets. Not enough jejunal or rectal chyme of a GF piglet (named GF-2) was taken; therefore, only five GF piglets and six FMT piglets were used for the analysis of BA profiles in this study. The results (Figure 1A) showed that 46 BAs were detected in the jejunum, cecum, colon, and rectum chyme of both GF and FMT piglets; 37 BAs were detected in bile samples; 33 BAs were detected in ileal chyme and liver samples; and 31 BAs were detected in sera from both GF and FMT piglets. There was no difference in the types of BAs between groups, except for ileal chyme. Specifically, there were 21 BAs in all intestinal chyme samples, and 21 BAs in the liver, sera, and bile were shared between the GF and FMT groups.
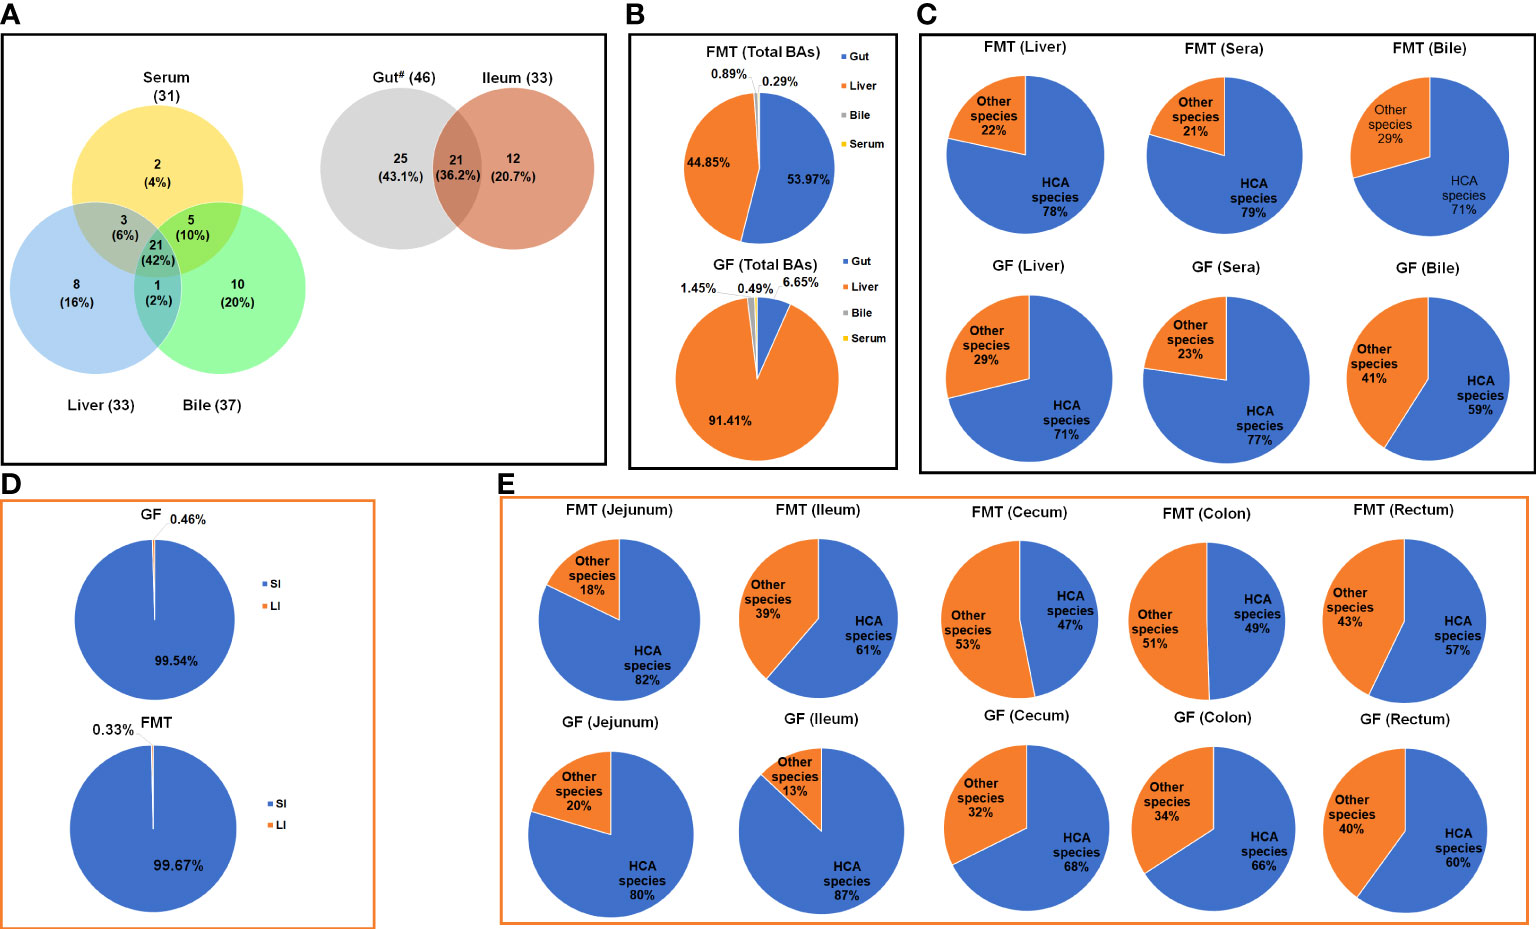
Figure 1 Concentrations of the total bile acids (BAs) in FMT and GF piglets. Changes in composition (A) and percentage (B) of total BAs in the liver, bile, serum, and gut of GF piglets after colonization. Microbiota-induced changes in the composition of HCA species in the liver, bile, and serum (C). (D) Effects of colonization of pig microbiota on BA concentration in the small intestine (SI) and large intestine (LI); (E) Microbiota-induced changes in the percentage of HCA species concentrations in the total BAs in the jejunum, ileum, cecum, colon, and rectum. Gut# represents the jejunum, cecum, colon, and rectum, except ileum.
In this study, the percentages of BAs detected in sera were 0.29% (25.63 ± 4.5 μmol/mL) of the total BAs in the FMT group and 0.49% (29.31 ± 6.8 μmol/mL) of the total BAs in the GF group (Figure 1B). The total BAs of GF piglets (average concentration, 5939.62 ± 949.5 μmol/mL) primarily consisted of the detected BAs in the liver and intestinal chyme, accounting for 91.41% (average concentration, 5939.63 ± 1004.4 μmol/mL) and 6.65% (average concentration, 395.50 ± 194.2 μmol/mL), respectively. Colonization of gut microbiota significantly increased the total BA pool in FMT piglets (average concentration, 8931.49 ± 1966.6 μmol/mL), being largely composed of the detected BA levels in intestinal chyme (53.97%; 4820.68 ± 1743.2 μmol/mL) and liver (44.85%; 4005.57 ± 496.4 μmol/mL). More than 99% of BAs in the gut were primarily formed in the small intestines (including jejunum and ileum) (Figure 1D).
HCAs are primary species of BAs in the plasma of pigs that are inversely correlated with glucose levels in humans with T2DM (Zheng et al., 2021a). Figures 1C–E show the relative proportions of HCA species in the total BAs in eight analyzed tissues. Of note, FMT increased the proportion of HCA species, and the highest concentration was detected in the liver (average concentration, 3138.21 ± 329.9 μmol/mL), accounting for 78% of the total BAs; the proportion of HCA species in the bile and serum accounted for 86% and 79% of the total BAs, respectively (average concentration, 68.33 ± 6.4 μmol/mL and 15.17 ± 2.9 μmol/mL, respectively). After the colonization of gut microbiota, FMT piglets produced the highest concentrations of HCA species in the small intestine (SI) (238.50 ± 50.2 μmol/mL in the jejunum and 3322.45 ± 1182.2 μmol/mL in the ileum), accounting for 82% and 61% of the total BAs, respectively. About 99.89% of HCA species were absorbed after passage through the ileum, and the detected concentration in the cecal chyme of FMT piglets was 4.05 ± 0.6 μmol/mL (accounting for 47% of the total BAs in the cecum on average). In the large intestine (LI), about 42.22% of HCA species produced in the cecum were re-absorbed, while 2.34 ± 0.3 μmol/mL and 1.49 ± 0.1 μmol/mL of HCA species were detected in the colonic and rectal chyme of FMT piglets, respectively. Compared to the FMT group, the concentration of HCA species in the liver (3865.77 ± 697.0 μmol/mL; P = 0.343) and serum (20.02 ± 4.7 μmol/mL; P = 0.390) increased in GF piglets, comprising 71% of the total BAs in the liver and 77% of the total BAs in the sera of the GF group. The detected concentration of HCA species in the intestinal chyme of GF piglets was significantly decreased. GF piglets had 37% and 94% reductions of HCA species concentrations in the jejunum (141.96 ± 47.0 μmol/mL; P = 0.201) and ileum (186.87 ± 151.3 μmol/mL; P = 0.056) compared to the FMT group, respectively. After passage through the cecum, over 99.65% of HCA species were absorbed, and only 0.37 ± 0.2 μmol/mL of HCA species was detected in the colon chyme. FMT piglets had significant 86% (P = 0.001), 82% (P = 0.001) and 77% (P = 0.000) increases in HCA species in the cecum, colon, and rectum, respectively compared to the GF group (Figure 2). In addition, FMT piglets also had significant (> 99%) increases of HDCA concentration in the cecum (P = 0.016), colon (P = 0.031), and rectum (P = 0.028) compared to the GF group.
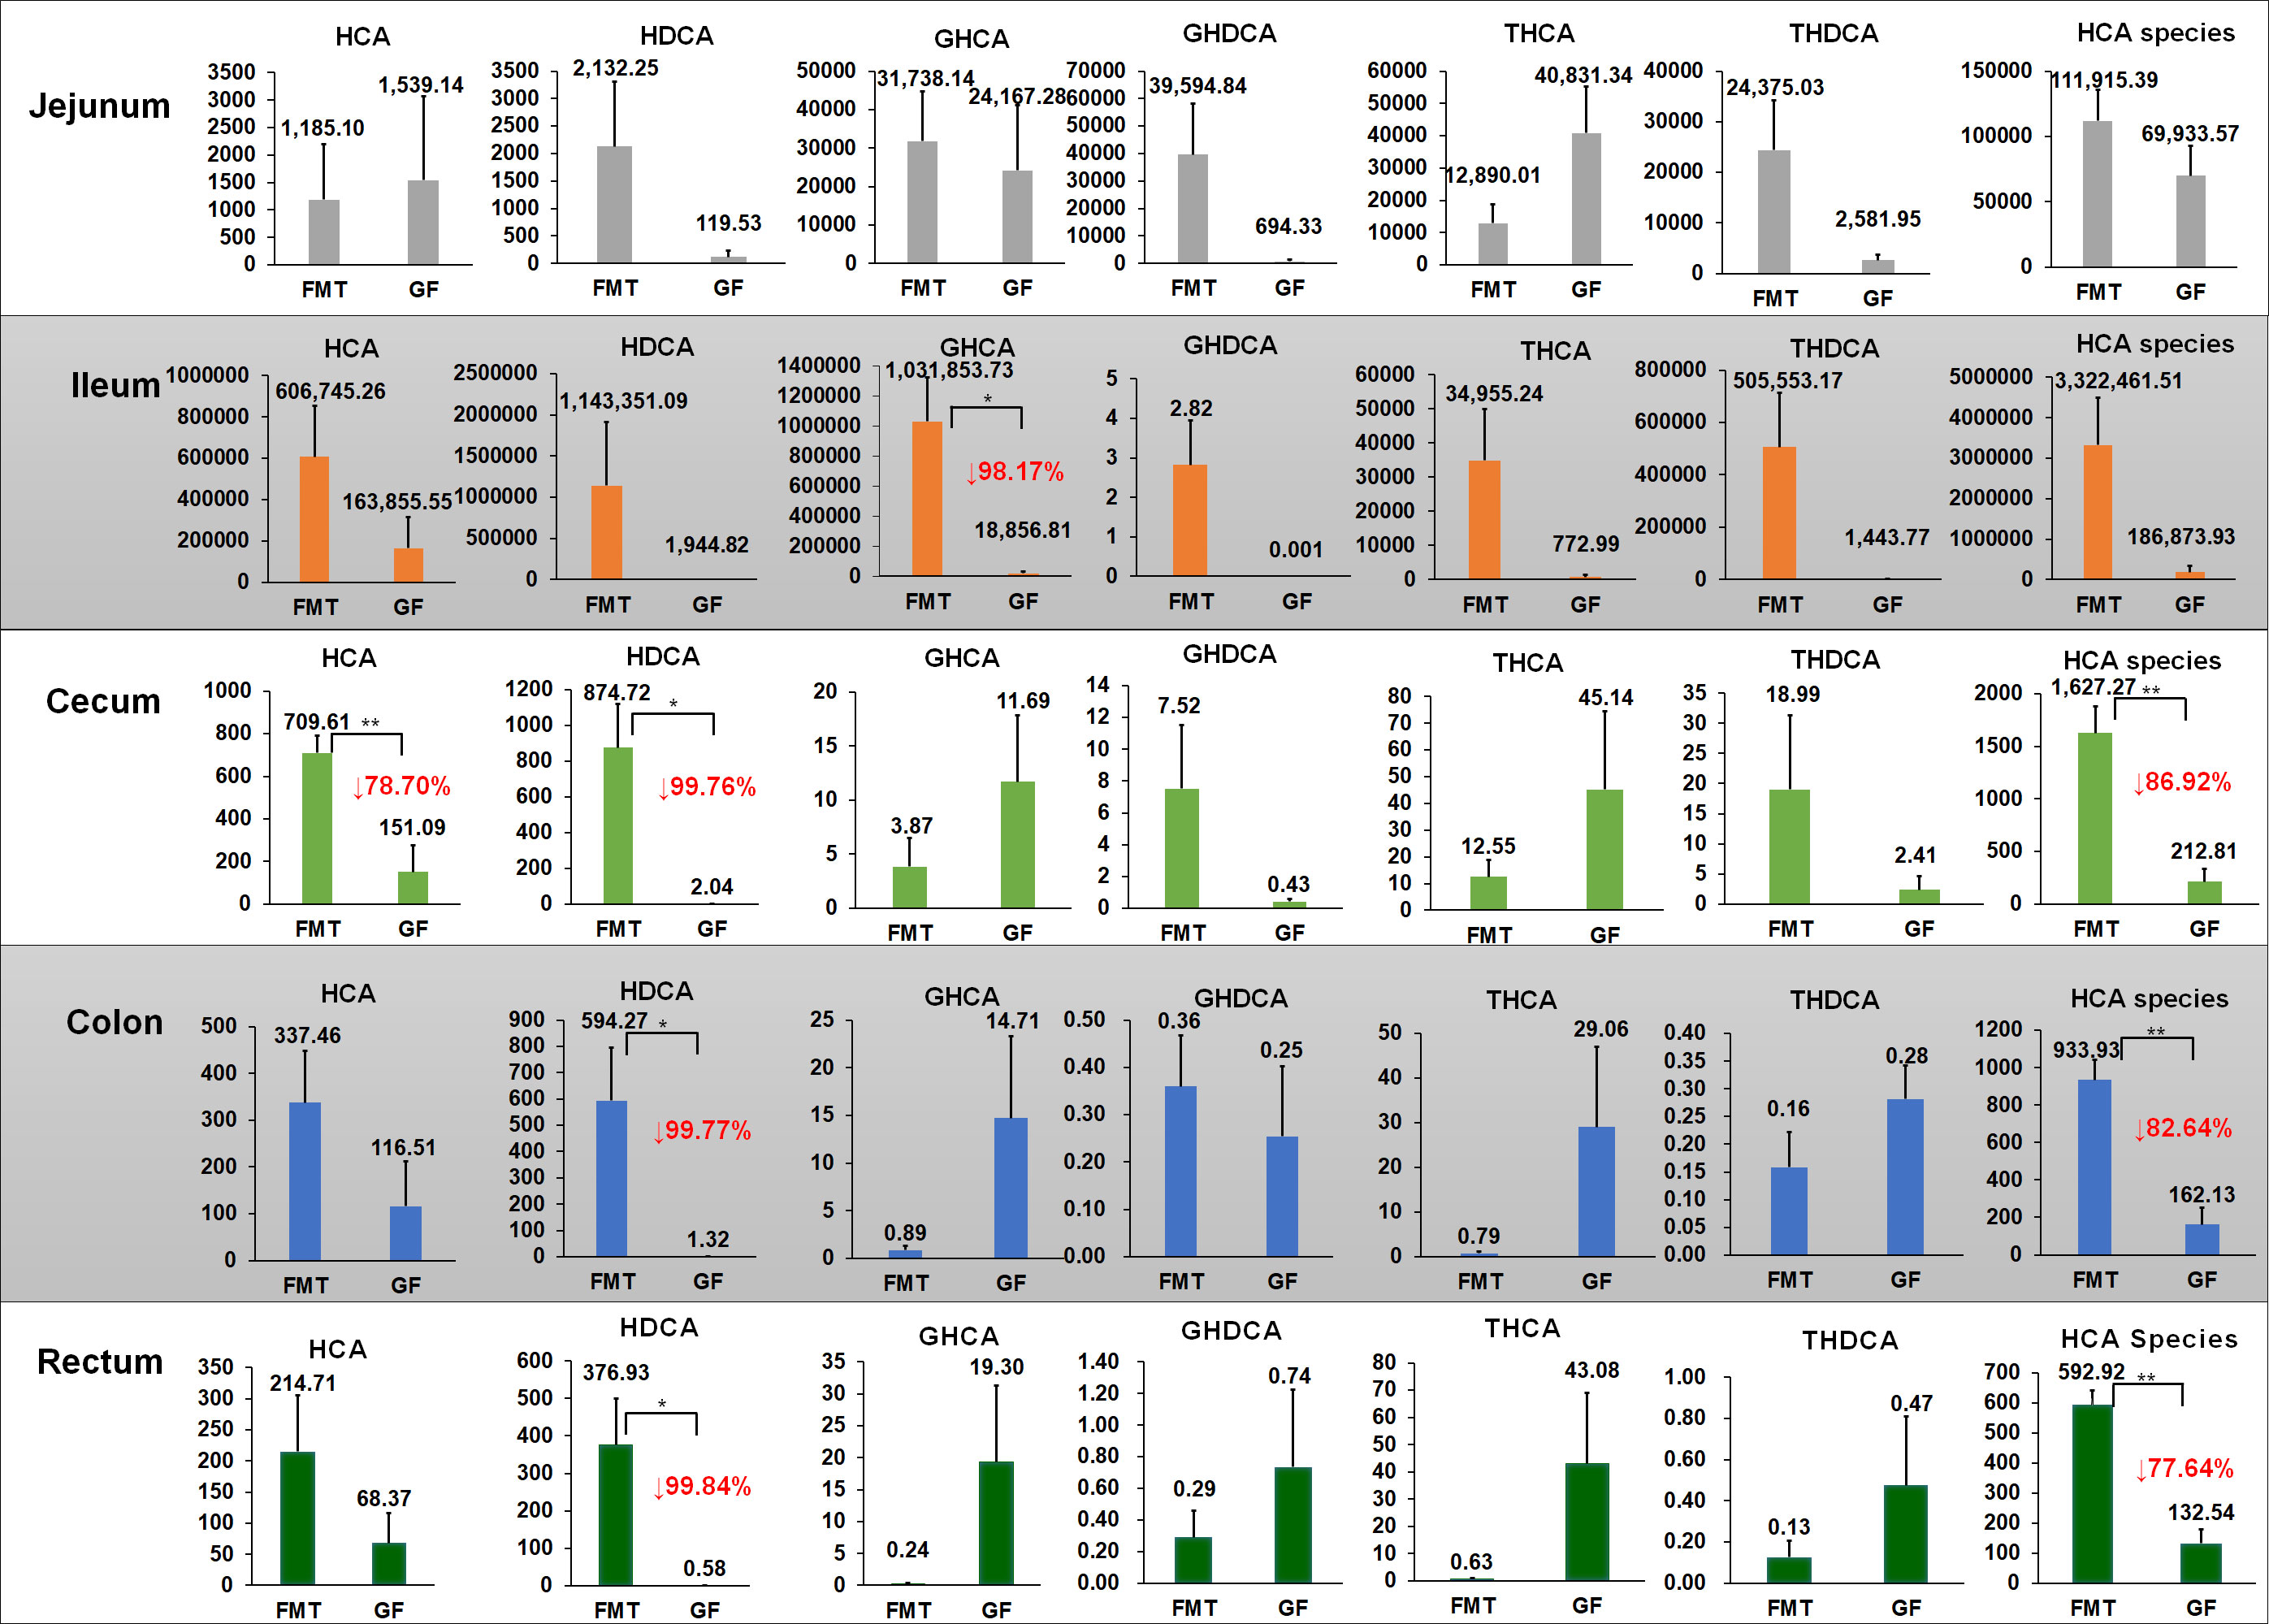
Figure 2 Changes in HCA species concentrations in different gut sites after colonization. Concentrations of HCA species in the jejunum, ileum, cecum, colon, and rectum. Mean values ± SE are plotted; n = 5 samples in the GF group, n = 6 samples in the FMT group. Red values with a down arrow represent the percentage reduction (%) of BA in the GF group compared to the FMT group. *P < 0.05, **P < 0.01 indicate differences versus GF by the Welch Two-Sample t-test. HCA = hyocholic acid; GHDCA = glycohyodeoxycholic acid; GHCA = glycohyocholic acid; THCA = taurohyocholic acid; THDCA = taurohyodeoxycholic acid; HDCA = hyodeoxycholic acid.
Chenodeoxycholic acid (CDCA) and its derivates (also known as CDCA species) were the second most abundant BA species in the pig intestine (Figure 3). The SI had a higher concentration of CDCA species than the LI of piglets in this study, and the highest concentration was detected in the ileum chyme (1065.19 ± 458.7 μmol/mL in the FMT group and 15.31 ± 5.1 μmol/mL in the GF group). Only 0.69 ± 0.17 μmol/mL and 0.03 ± 0.007 μmol/mL of CDCA species were detected from the cecal contents of FMT and GF piglets, with re-absorption ratios of 99.93% and 99.75%, respectively.
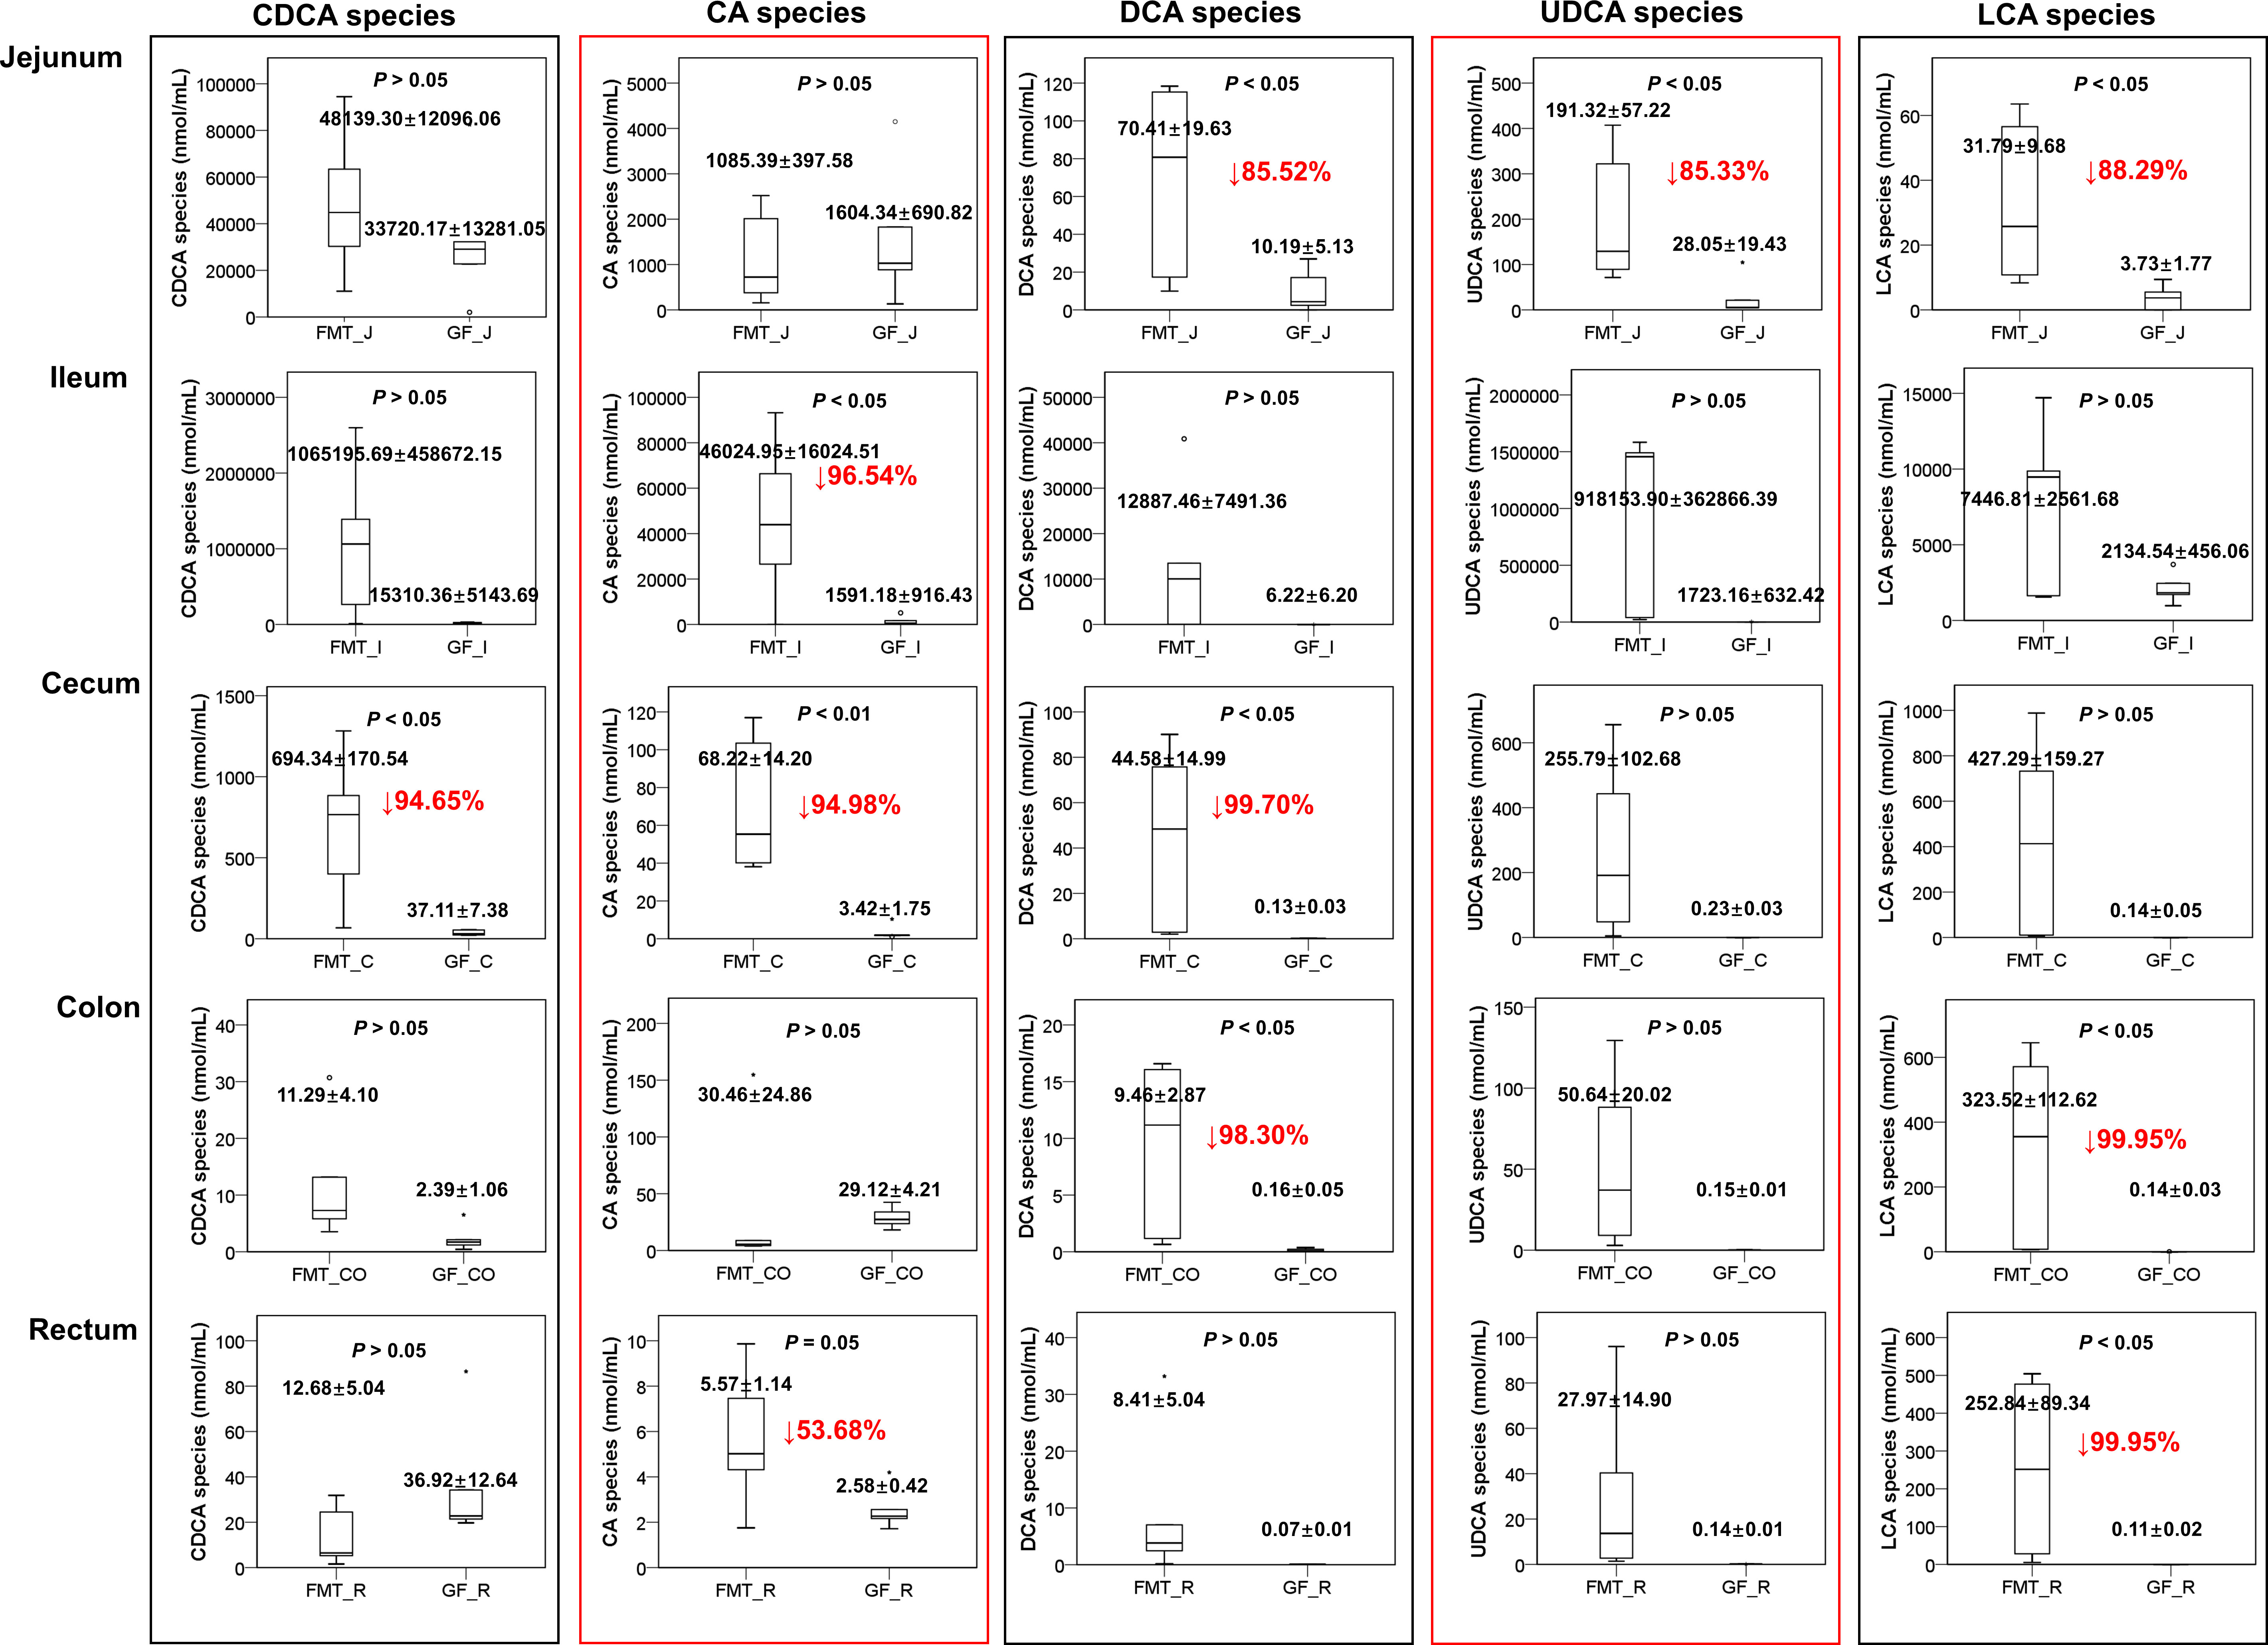
Figure 3 Performance of other BA species in the FMT and GF groups, except HCA species. CDCA species: GCDCA, TCDCA, and CDCA; CA species: CA, GCA, TCA, UCA, and ACA; DCA species: DCA, TDCA, GDCA; UDCA species: UDCA, GUDCA, and TUDCA; LCA species: LCA, GLCA, and TLCA. Mean values ± SE are plotted; n = 5 samples in the GF group, n = 6 samples in the FMT group. Red values with a down arrow represent the percentage reduction (%) of BA in the GF group compared to the FMT group. The circle˚ or the symbol * represents the outliers in the data batch using a boxplot graph.
In addition, the colonization of pig microbiota had a strong influence on the production and re-absorption of other BA species in the pigs. For example, CA species and deoxycholic acid (DCA) species were mainly produced in the ileum (the average concentrations were 46024.95 ± 16024.5 nmol/mL and 12887.46 ± 7491.4 nmol/mL, respectively) and re-absorbed in the cecum so that the average concentrations in the cecum were reduced to 68.22 ± 14.2 nmol/mL and 44.58 ± 15.0 nmol/mL, respectively. In contrast, the concentrations of CA species and DCA species in the ileum of GF piglets were 1591.18 ± 916.4 nmol/mL and 6.22 ± 6.2 nmol/mL, respectively. These species were almost completely absorbed in the cecum, where only 3.42 ± 1.7 nmol/mL (P = 0.006) and 0.13 ± 0.03 nmol/mL (P = 0.031) were detected in the cecum of GF piglets, respectively (Figure 3).
The levels of 12 biochemical parameters were significantly different between the FMT and GF groups (P < 0.05) (Figures 4A, B). In detail, colonization of the pig microbiota in this study resulted in significant decreases of two liver function indices (ALB/GLO ratio and ALT), a blood electrolyte (NA), a serum lipid (ADP), two blood sugar indices (GLP-1 and INS), and one renal functional index (BUN) in the serum of FMT piglets. Compared to GF piglets, FMT induced significant increases in the levels of TP and GLO (liver functional parameters), CL (blood electrolyte parameter), and TC and LDL (lipid functional parameters). The colonization of gut microbiota significantly decreased the ALB/GLO ratio in the FMT group compared to the GF group.
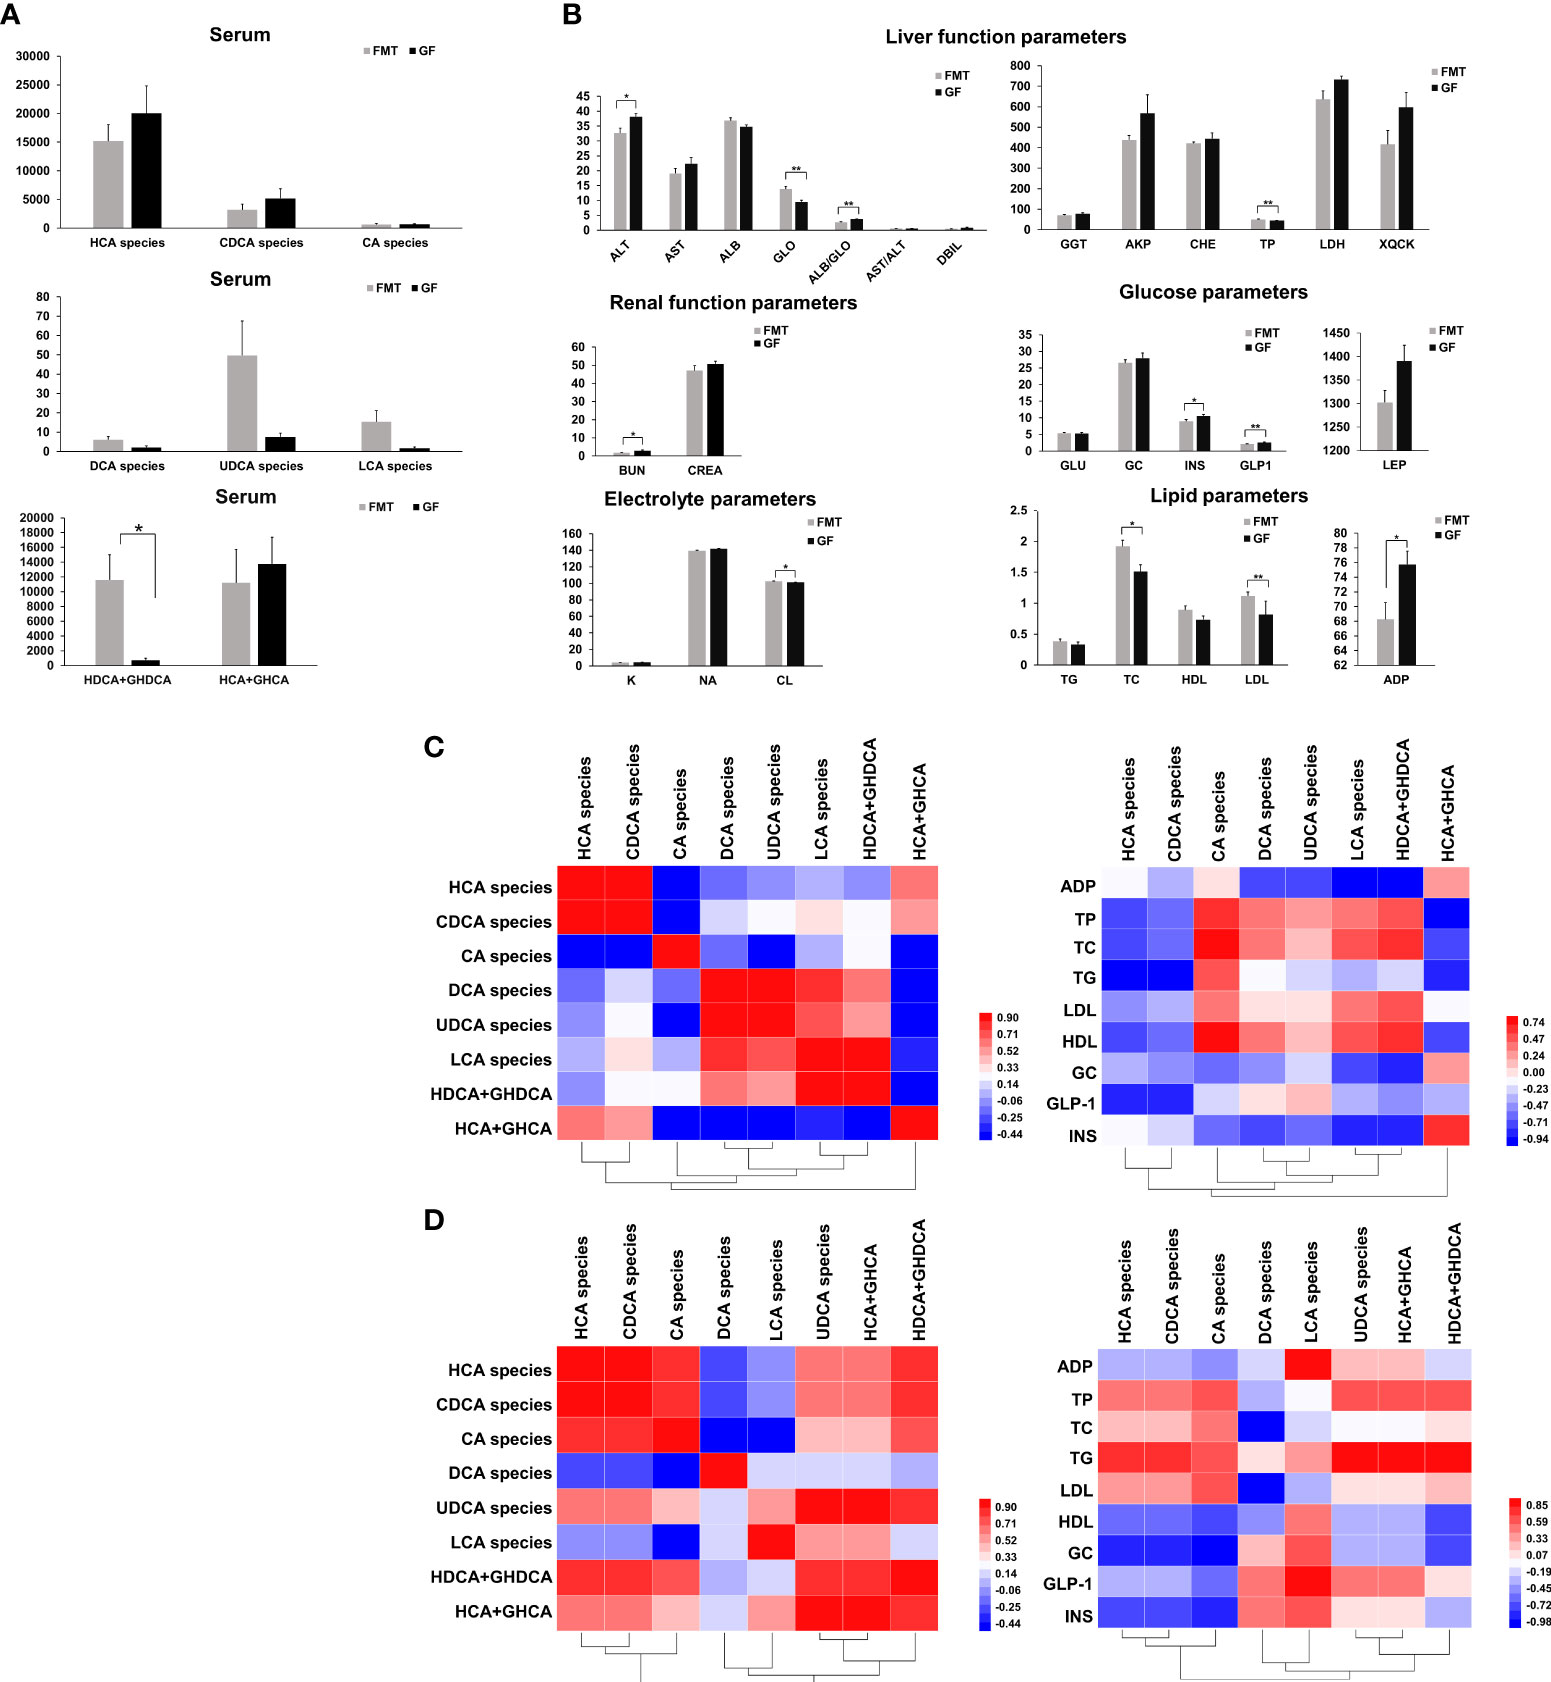
Figure 4 Bile acid species and blood biochemical parameters in the serum of FMT and GF piglets. (A) Changes in the concentrations of various bile acid species. (B) Changes in the levels of blood biochemical parameters after colonization of pig microbiota. Mean values ± SE are plotted; n = 5 samples in the GF group, n = 6 samples in the FMT group. *P < 0.05, **P < 0.01 indicate differences versus GF by the Welch Two-Sample t-test. Spearman correlation coefficients for concentrations of HCA species and the blood biochemical parameters in the serum of FMT piglets (C) or GF piglets (D). The value in the unit square represents the correlation coefficient. An asterisk * represents a significant correlation at the 0.05 level (two-tailed); ** represents a significant correlation at the 0.01 level (two-tailed).
After the colonization of the pig microbiota, FMT piglets had slight reductions of the concentrations of HCA species (24%) (P = 0.390) and CDCA species (37%) in the serum of FMT piglets (643.80 ± 176.3 nmol/mL; P = 0.311) compared to the GF piglets that may have resulted in a significant increase of TC (P = 0.020), TP (P = 0.001), and low-density lipoprotein (LDL; P = 0.005) in the serum of the FMT group. The concentration of CA species in the serum of FMT piglets was positively correlated with HDL (r = 0.829, P = 0.042) and TC (r = 0.829, P = 0.042), respectively. The concentration of CA species in the serum of GF piglets was negatively correlated with GC (r = -9.00, P = 0.037), and the concentration of deoxycholic acid (DCA) species in the GF group was negatively correlated with TC (r = -0.975, P = 0.005). There is a significantly negative correlation between the concentration of ursodeoxycholic acid (UDCA) species and TG (r = 0.975, P = 0.005). The concentration of lithocholic acid (LCA) species in the GF group was positively correlated with GLP-1 (r = 0.900, P = 0.037) (Figures 4C, D). In addition, there were increases in DCA species (2-fold), UDCA species (7-fold), and LCA species (14-fold) in the serum of FMT piglets after the colonization of pig microbiota.
Principal coordinate analysis of Bray-Curtis distances showed a clear separation between the microbial communities in the jejunum and rectum of FMT piglets at the first principal coordinate (x-axis) that explained more than 68% of the variance (Figure 5A). The second principal coordinate (y-axis) accounted for 17% of the variance and separated the microbial communities by gut site. The microbial composition differed between the jejunum and rectum of FMT piglets; in addition to the 41 bacterial phyla found in the jejunum, the rectum of FMT piglets had 104 unique phyla (Figure 5B). Among these, Proteobacteria, Bacteroidetes, and Firmicutes were the most abundant bacterial phyla in the jejunal chyme, with average abundances of 51.84% ± 16.9%, 32.37% ± 14.4%, and 12.33% ± 8.4%, respectively. In contrast, the rectal microbiota had a significantly higher abundance of Firmicutes (57.15% ± 3.0%, P < 0.01; Figure 5C).
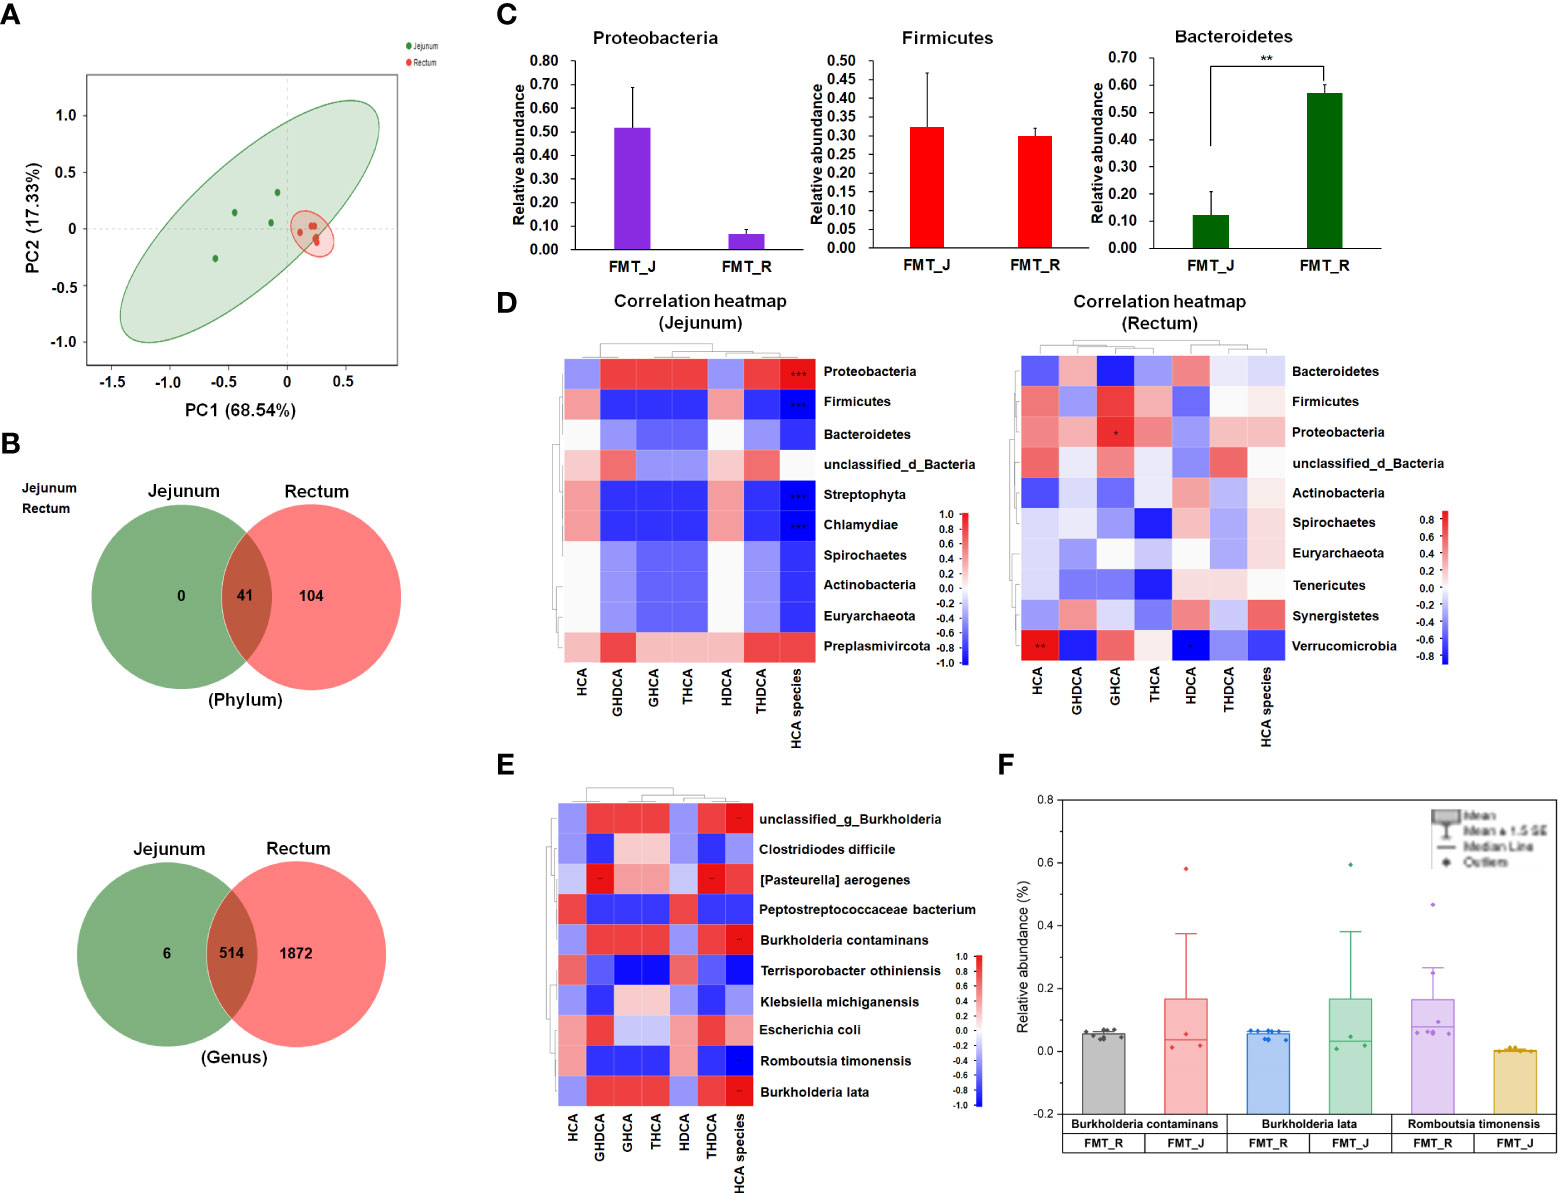
Figure 5 Comparison of jejunal and rectal microbiota in FMT piglets. (A) Principal coordinate analysis (PCoA). (B) Venn diagram analysis of bacterial phyla and genera between jejunal and rectal microbiota of FMT piglets. (C) Relative abundance of three main bacterial phyla between jejunal and rectal microbiota of FMT piglets. FMT_J represents the jejunal samples of FMT piglets; FMT_R represents the rectal samples of FMT piglets. An independent t test was used to identify differences between groups. *P < 0.05, ** P < 0.01. (D) Spearman’s rank correlation heatmap between the concentrations of HCA species and the bacterial phyla in intestinal contents (jejunum or rectum) is shown. (E) Correlation heatmap between the concentrations of HCA species and the bacterial species in intestinal contents (jejunum or rectum). Correlation coefficient R values are shown in different colors. (F) Box chart (mean with SE) of the relative abundances of B. contaminans, B. lata, and R. timonensis in the jejunal and rectal samples of FMT piglets. Correlation coefficient R values are shown in different colors. Asterisk (*) in the table cells represent significant correlations at the 0.05 level (two-tailed). ** in the table cells represent significant correlations at the 0.01 level (two-tailed); *** represent significant correlations at the 0.001 level (two-tailed).
Next, Spearman correlation analysis was carried out between the top 10 bacterial phyla and the detected amounts of HCA species in the jejunum/rectum (Figure 5D). The results showed that the content of HCA species was positively correlated (P < 0.001) with Proteobacteria, and the level of HCA species was negatively correlated (P < 0.001) with the relative abundances of Firmicutes, Streptophyta, and Chlamydiae. In the rectum, the level of HCA species was slightly correlated with the relative abundance of the top 10 bacterial phyla (|r| < 0.8), and only the GHCA level was significantly positively correlated with the Proteobacteria (r = 0.83, P < 0.05). The HDCA level was negatively correlated with the abundance of Verrucomicorbia (r = −0.88, P < 0.05).
The results showed that the SI was the main site of conjugated and free BA production, and the highest level of conjugated and free BAs was detected in the ileum. The average levels of free and conjugated BAs in the SI of GF piglets were 22.46 ± 0.2 μmol/g and 206.81 ± 71.9 μmol/g, respectively. The colonization of gut microbiota stimulated BA production; the average levels of free and conjugated BAs in the SI of FMT piglets were 1407.03 ± 709.9 μmol/g and 3685.44 ± 828.9 μmol/g, respectively. Specifically, the colonization of pig microbiota significantly increased the levels of conjugated BAs in the ileum of FMT piglets (3407.49 ± 1084.3 μmol/g in average; P = 0.036) as well as the level of free BAs in the LI (15.86 ± 2.2 μmol/g; P = 0.001) (Figure 6D). The levels of free BAs in the cecum, colon, and rectum of FMT piglets were significantly higher compared with the mean levels of the GF control group. The average concentrations of free BAs in the FMT group were 8.53 ± 1.4 μmol/g (in the cecum; P = 0.001), 4.72 ± 0.6 μmol/g (in the colon; P = 0.000), and 2.60 ± 0.3 μmol/g (in the rectum; P = 0.001). The average concentrations of free BAs in the cecum, colon, and rectum samples of GF piglets were 0.59 ± 0. μmol/g, 0.47 ± 0.3 μmol/g, and 0.34 ± 0.2 μmol/g, respectively.
We analyzed the ratio of the glycine- to taurine-conjugated BAs (G/T ratio) in the liver, bile, serum, and intestine (Figures 6A, B). The colonization of pig microbiota resulted in significant increases in the G/T ratio in the liver and bile of FMT piglets compared with the GF group (P = 0.002). Significant increases of glycine-conjugated (P = 0.026) and taurine-conjugated BAs (P = 0.011) were observed in the ileum of FMT piglets, with an over 68-fold and 104-fold induction compared to the GF piglets, respectively (Figure 6C).
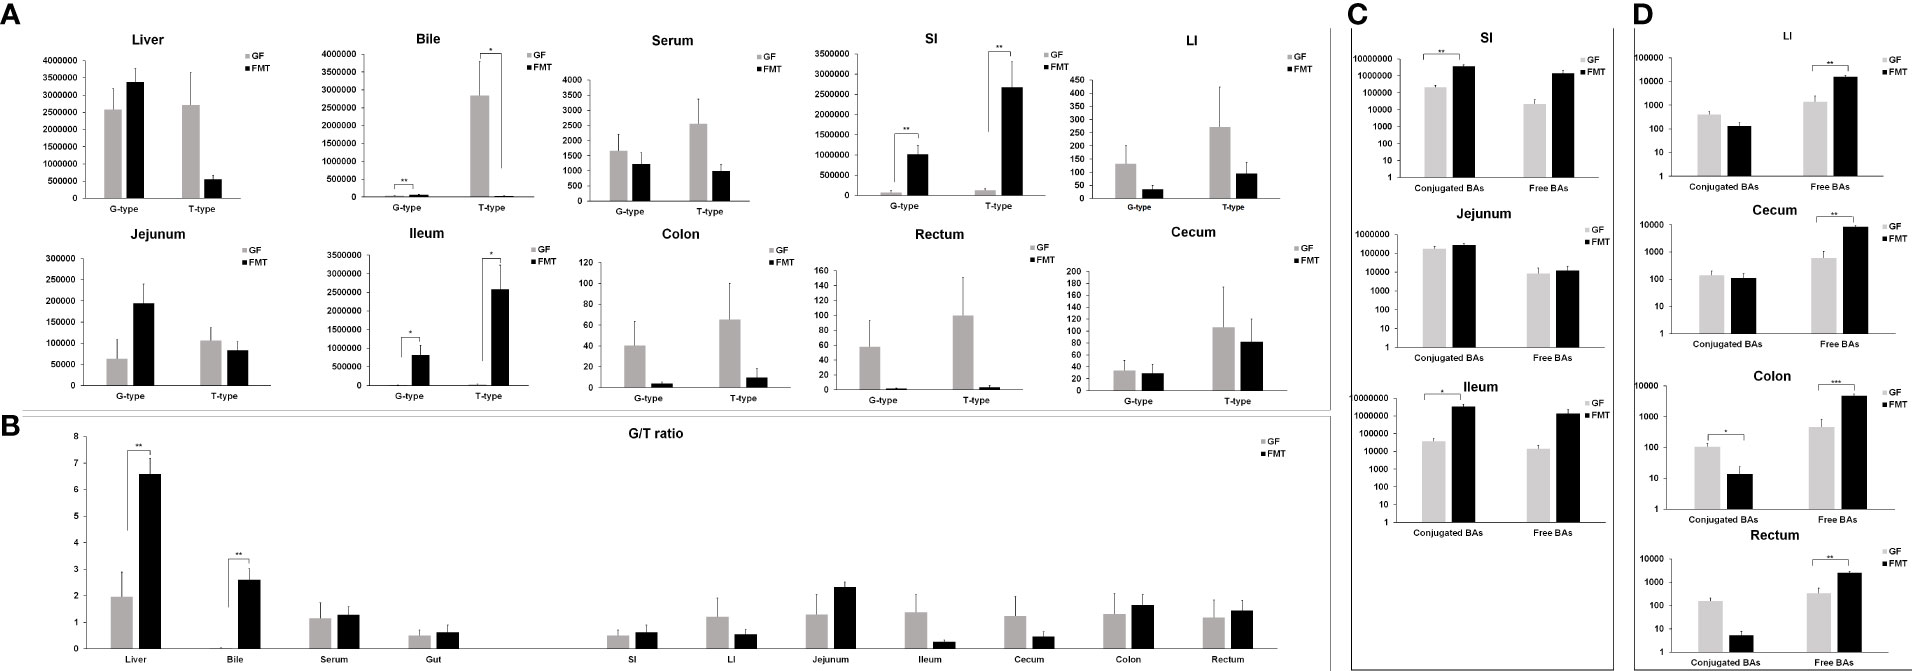
Figure 6 Glycine- and taurine-conjugated bile acids in FMT and GF piglets. (A) Glycine-conjugated (G-type) and taurine-conjugated (T-type) BAs in the liver, serum, bile, and intestine of FMT piglets compared to the GF group. (B) The glycine/taurine (G/T) ratio in the liver, serum, bile, and intestine of FMT and GF piglets. (C) Group differences of conjugated and free BAs in the small intestine. (D) Group differences of conjugated and free BAs in the large intestine. SI = small intestine including jejunum and ileum; LI = large intestine including cecum, colon, and rectum; Gut represents SI and LI; n = 5–6 samples/group. * P < 0.05, ** P < 0.01 indicate differences versus GF by the Welch Two-Sample t-test.
We analyzed the expression of genes and proteins involved in BA synthesis and found that colonization with pig microbiota significantly decreased the gene expression of the rate-limiting enzymes cholesterol 7alpha-monooxygenase (CYP7A1; P = 0.030) and cholestanetriol 26-monooxygenase (CYP27A1; P = 0.106) and also promoted decreased gene expression of other enzymes involved in BA synthesis, such as cholesterol 25-hydroxylase (CH25H), 24-hydroxycholesterol 7alpha-hydroxylase (CYP39A1), and steroid delta isomerase 7 (HSD3B7) (Figure 7). The gene expression of the enzyme CYP7B1 was decreased after the colonization of pig microbiota (P > 0.05). In this study, the expression levels of FXR and G-protein-coupled bile acid receptor, Gpbar1 (TGR5) genes were significantly decreased in the liver after the colonization of pig microbiota (Figure 7), resulting in decreases of their target gene small heterodimer partner (SHP). The colonization of pig microbiota resulted in significant decreases in the gene expression of fibroblast growth factor receptor 4 (FGFR4) (P = 0.008) in liver compared to the GF group (Figure 7). Only the gene expression of the co-receptor β-klotho of fibroblast growth factor 19 (FGF19) in the ileum of FMT piglets showed over 3-fold induction compared to the GF group after the colonization (P > 0.05).
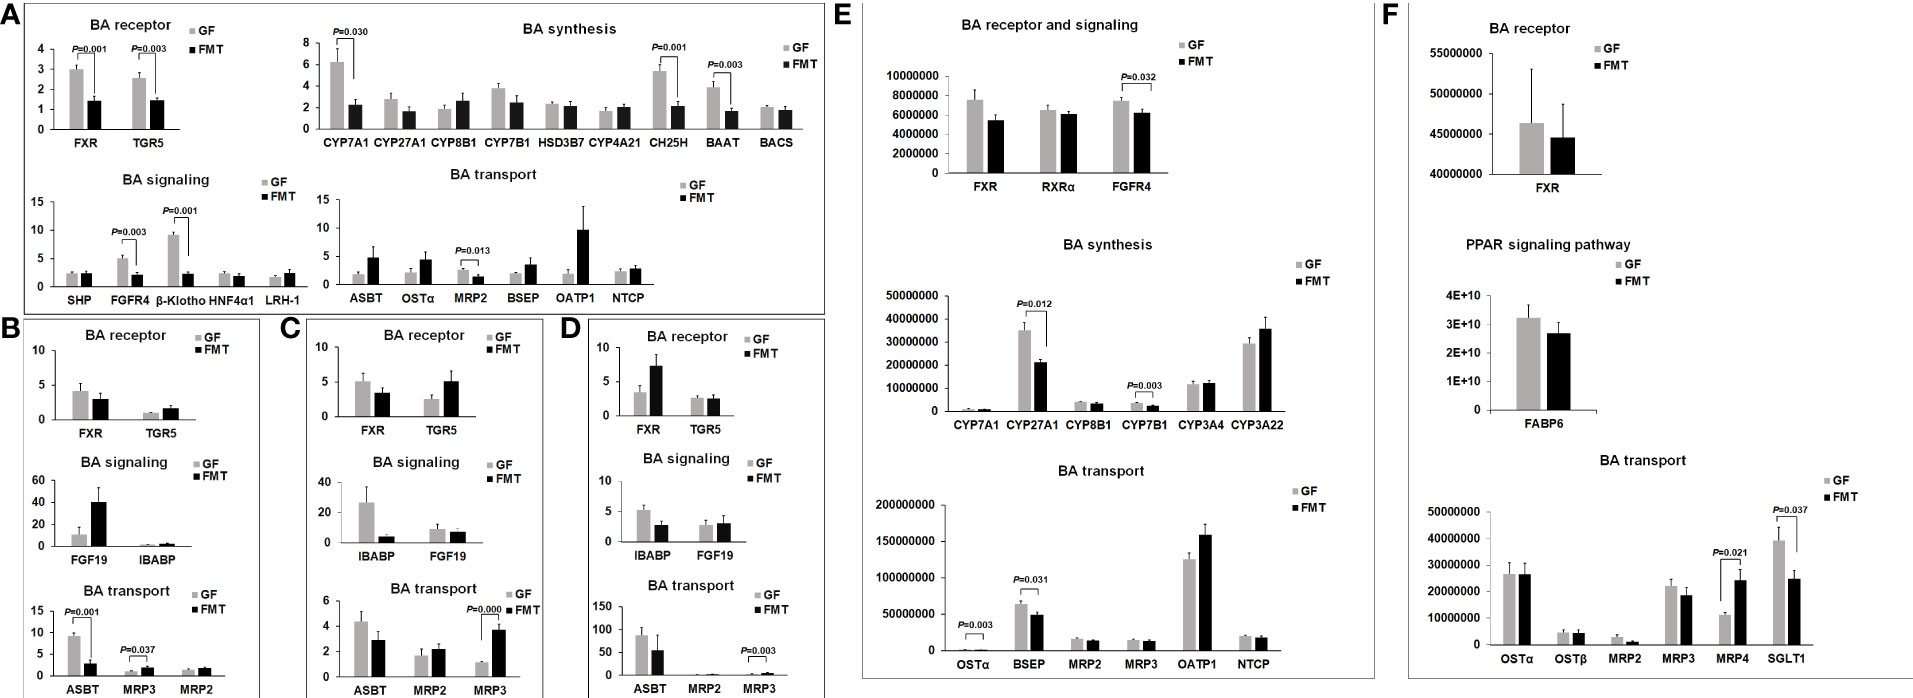
Figure 7 Microbiota-induced changes in gene expression of BA receptors and signaling and BA synthesis and transport. (A) Gene expression of BA receptors FXR and TGR5 and FXR target genes in the liver. Expression of genes involved in BA synthesis and BA transport in the liver. (B) Gene expression of BA receptors and their target genes in BA signaling, and expression of genes involved in BA transport in the ileum. (C) Gene expression of BA receptors and their target genes in BA signaling, and expression of genes involved in BA transport in the cecum. (D) Gene expression of BA receptors and their target genes in BA signaling and expression of genes involved in BA transport in the colon. (E) Expression of BA receptors FXR/RXRα, and expression of proteins involved in BA synthesis and transport in the liver. (F) Protein expression of BA receptor FXR, BA transport, and PPAR signaling pathway in the ileum. Protein expression is presented as the relative expression level compared with the mean expression level of the GF control group. Gene (or Protein) expression is presented as the relative expression level compared with the mean expression level of the GF control group. Mean values ± SE are plotted; n = 5–6 samples/group. P value indicates differences versus GF by the Welch Two-Sample t-test.
The apical sodium-dependent bile acid transporter (ASBT; SLC10A2) is the ileal counterpart to the hepatic BA transporter Na+ taurocholate co-transporting polypeptide (NTCP, SLC10A1), an up-regulation of the NTCP gene in the liver of FMT piglets (Figure 7A) may have contributed to the increased hepatocellular accumulation of total BAs in the liver samples. The expression of ASBT in the ileal samples was significantly decreased after 5 weeks of microbiota colonization (P < 0.05) (Figure 7B). Similarly, the colonization of pig microbiota resulted in decreased gene expression of ASBT in the LI (cecum and colon) (P > 0.05). Gene expression of the multidrug resistance protein 3 (MRP3/gene symbol: ABCC3) was significantly up-regulated in pig intestines after 5 weeks of microbiota colonization (P < 0.05) (Figures 7B-F). The interplay between these transporters and metabolites increased the capabilities for transporting conjugated and unconjugated BAs from the liver cells back into the bloodstream.
Our results and those of previous studies indicate that pigs have a predominant percentage of HCA species in the total BA pool, as HCA species account for over 70% of total BAs in the serum of pigs, but humans and mice only have 2%–4% of HCA species in their BA pool (Zheng et al., 2021a; Zheng et al., 2021b). It has been reported that the levels of HCA species were negatively correlated with glucose parameters (GLP-1 and blood glucose levels) (Zheng et al., 2021a), and metabolism of HCA species is closely associated with gut microbiota in mice and humans (Eyssen et al., 1999; Rajani and Jia, 2018). In this study, we found that the colonization of pig microbiota promoted the percentage of HCA species in the serum BA pool and significantly decreased the levels of GLP-1 secretion and serum INS and LEP (Figure 4). It is well known that the administration of a CA-supplemented diet induces a significant decrease of serum ADP level in rats, and this regulates the cecal microbiota and affects host health (Islam et al., 2011). We observed that the serum level of ADP decreased significantly in FMT piglets, given the colonization of pig microbiota compared to the GF piglets (Figure 4). From these results, therefore, the colonization of pig microbiota appeared to affect the concentrations of HCA species and further regulated serum ADP level in pigs.
Our data showed that the total BA concentrations in the liver and intestinal chyme were increased after the colonization of pig microbiota. We also observed that FMT increased the percentage of HCA species in the pig BA pool. Our data showed that the endogenous BA species in pigs are tissue specific (Figure 1A). Administration of CA significantly increased the percentage of Firmicutes in the gut microbiota of rats and the concentration of DCA in feces by a bacterial 7α-dehydroxylation reaction (Islam et al., 2011). In this study, after the colonization of fecal microbiota from SPF sows, over 84% of the microbial community in the jejunum of FMT piglets was dominated by two phyla, Proteobacteria and Bacteroidetes, while Bacteroidetes and Firmicutes had the highest percentages in the rectal microbiota of FMT piglets (Figure 5C). The gut microbiome alters host physiology by producing microbial-derived secondary BAs via biotransformation of primary BAs. Previous studies have confirmed the importance of the genes that express bile salt hydrolases (BSHs) in the deconjugation of BAs by bacterial members of Firmicutes, Bacteroidetes, and Actinobacteria (Jones et al., 2008; O’Flaherty et al., 2018). Here, our data showed that several bacterial species were involved in the concentrations of HCA species. According to the results of Spearman correlation analysis (Figure 5D), we observed that in the jejunum, the relative abundances of several bacterial species of Proteobacteria (B. lata and B. contaminans) were positively correlated with the concentration of HCA species, while the abundance of R. timonesis in Firmicutes was negatively correlated with the concentration of HCA species (Figures 5E, F). It has been reported that Burkholderia cepacian SE-1 can transform environmental cholesterol into 7β-hydroxycholesterol, 7-oxocholesterol, and a correlative hydroxylase that belong to the catalases/peroxidase family (Zhu et al., 2016). Bacterial strains isolated from GIT are believed to be more resistant to the influence of bile salts than those from other sources (Bustos et al., 2018). Therefore, it seems be a good choice to isolate desirable or probiotic bacterial strains that are related to the production of HCA and derivatives from the intestinal chyme of pigs. In the future, it is necessary to increase the individuals for FMT and the sample size for metagenomic analysis to confirm whether these two strains are really closely linked to the abundance of HCA species in the jejunum of piglets. After that, we should consider the isolation of the strains and use GF or SPF pigs to verify whether the potential effects of the strain(s) in promoting the abundance of HCA species, the growth or development, or health of piglets.
It has been reported that mammalian BAs are synthesized from cholesterol (typically from LDL particles) by a multi-enzymatic process with CYP7A1 as the rate-limiting enzyme, a process that is regulated by microbiota (Wahlstrom et al., 2016) in mice and humans. In this study, we found that the colonization of pig microbiota significantly decreased the expression of the CYP7A1 gene and the expression of the CYP7A1 enzyme in the liver. The inhibition of the expression of the FGF19 gene in the liver of FMT piglets was consistent with the feedback inhibition of FGF19 repressing BA synthesis via the BA-FXR signaling pathway by inhibiting the activity of CYP7A1 (Lee et al., 2006). Similar to CYP7A1 as the rate-limiting enzyme of the classic pathway of BA synthesis, CYP27A1 is the rate-determining enzyme of the alternative pathway of BA synthesis and also determines the amounts of BAs produced (Chiang, 1998). Recently, Rizzolo et al. found that DKO mice deficient in Cyp7a1 and Cyp27a1 had a similar mRNA expression pattern as wild-type (WT) mice for key genes involved in BA signaling, synthesis, transport, and regulation (Rizzolo et al., 2021). Here, we observed a significant decrease in CYP27A1 protein after the colonization of fecal microbiota by FMT compared to the GF group. The continuous enterohepatic recycling of the BA pool is finely regulated to prevent BA overload and liver injury via hepatic FXR and intestinal FXR activation (Zhang et al., 2012). The gene expression of CYP8B1, which is required for CA synthesis, was increased after colonization, in agreement with a reported study in mice (Wahlstrom et al., 2017). The expression of the enzyme CYP7B1 that is responsible for mediating 7α-hydroxylation of 27-hydroxycholesterol, 25-hydroxycholesterol, dehydroepiandrosterone, and pregnenolone (Ren et al., 2003) was significantly decreased after the colonization of pig microbiota. Farnesoid X receptor/retinoid X receptor-alpha (FXR/RXRα) is the master transcriptional regulator of BA synthesis and transport in the liver and intestine (Hoeke et al., 2014; Ridlon et al., 2016). FXR is activated by BAs and is regulated by the microbiota (Ikpa et al., 2020). Our data showed that the colonization of pig microbiota activated the expression of TGR5 and FXR in the liver, as recent evidence suggests (Portincasa et al., 2020), indicating that the hepatocyte cell cycle progression in pigs may by modulated physiologically by FXR- and TGR5-dependent mechanisms contributing to BA homeostasis. Further studies should unravel the fundamental pathophysiological effects and mechanism of TGR5 in order to understand how TGR5-dependent regulation differs from FXR-dependent regulation to prevent the consequences of BA overload. The BA transporter NTCP (the Na+ taurocholate co-transporting polypeptide; SLC10A1) represents the predominant taurocholate uptake system in hepatocytes (Trauner and Boyer, 2003; Geyer et al., 2006) and is regulated by a complex interplay of hepatic transcription factors (small heterodimer partner SHP-1, hepatocyte nuclear factors HNF1α, HNF4α, and HNF3β) and ligand-activated receptors (retinoic acid receptor RARα).
The subfamily C ATP-binding cassette (ABCC) transporters, also referred to as MRPs, plays the important role of mediating the transport of various substrates, including BAs, through the cell membranes. MRP3 (ABCC3) is a member of the ABCC subfamily and is expressed in the liver and intestine of pigs (Figure 7), and the colonization of pig microbiota significantly stimulated MRP3 gene expression in the ileum, cecum, and colon. The expression of another transporter of this subfamily, MRP4 (ABCC4) (Perez-Pineda et al., 2021), was also significantly increased in the ileum after the colonization of pig microbiota, suggesting that the gut microbiota could stimulate BA accumulation in the bowel lumen through transferring BAs in and out of the ileal cells via the ATP-binding cassette (ABC) transporters. The sodium-glucose co-transporter (SGLT1) is one of the nutrient transporters responsible for a portion of the intestinal absorption capacity of water (Thomson et al., 2001) and glucose (Du et al., 2016). After the colonization of pig microbiota, the protein expression of SGLT1 in the ileum of FMT piglets was significantly decreased compared with the GF piglets.
CA and CDCA are the primary BAs synthesized in humans and rodents, and these primary BAs are further metabolized via N-acyl amidation to glycine or taurine, producing conjugated BAs (Winston and Theriot, 2020). Conjugation is important for the solubility of BAs, and the ratio of glycine to taurine (the G/T ratio) conjugated BAs varies among mammal species (Begley et al., 2005; Hofmann et al., 2010). Unlike mice, the G/T ratio in human liver is regulated by diet (Hardison, 1978), and conjugated BAs activate pancreatic lipase and form mixed micelles to promote the absorption of fatty acids and fat-soluble vitamins by enterocytes (Ridlon et al., 2016). Secondary taurine-conjugated or glycine-conjugated BAs, deoxycholic acid (DCA), and lithocholic acid (LCA) are the most potent endogenous ligands for the activation of the expression of TGR5 (Kawamata et al., 2003). It has been reported that patients with ileal disorders showed a marked increase in the G/T ratio (McLeod and Wiggins, 1968; Sanyal et al., 2021). Based on the results of this study, this increase is therefore likely to be a physiological response that is directly related to the colonization of intestinal microbiota, and more careful validation tests are needed to investigate the changes of TGR5 expression in the liver, intestine, and other tissues of patients and the association between the G/T ratio and the disease.
In this study, we characterized GF and FMT piglet models raised under the same rearing environment and conditions. The colonization of pig microbiota plays an important role in the composition and concentration of the BA pool in pigs. These two models have shown that FMT induced an increase of HCA species concentrations in the serum, bile, liver, and intestinal chyme of pigs. The ileum is the predominant site for the production of conjugated BAs, and FMT induced an over 68-fold increase of glycine-conjugated BAs and 104-fold increase of taurine-conjugated BAs in the ileum of pigs. The FMT piglets had significant decreases of the gene expression levels of BA receptors FXR and TGR5 and a significantly decreased mRNA expression pattern compared to GF piglets for key genes involved in BA synthesis, signaling, and transport.
The data presented in the study are deposited in the National Genomics Data Center repository, accession number CRA006510, https://ngdc.cncb.ac.cn/gsa/browse/CRA006510. Further enquiries should be directed to the corresponding authors.
The animal study was reviewed and approved by the institutional ethics committee of the Chongqing Academy of Animal Science (Chongqing, China).
JS and LPG contributed to study concept and design. MYL and HZ completed the animal experiments. YCD and BY directed the design of animal feed formulations. JS, MYL, JC, and JWZ collected the samples; JS contributed to analysis and interpretation of data and drafting of the manuscript, and revised the manuscript. JS, LPG, and JWZ obtained funding. JS, LPG, and YCD contributed to study supervision. All authors contributed to the article and approved the submitted version.
This study was supported by National Natural Science Foundation of China (grant number 32072687), Chongqing Scientific Research Institute Performance Incentive and Guidance Special Project (grant number cstc2019jxjl80019, China), and the Performance Incentive and Guidance Project for Scientific Research Institutions in Chongqing (grant number 20524).
The author would like to thank LetPub (www.letpub.com) for its linguistic assistance during the preparation of this manuscript.
The authors declare that the research was conducted in the absence of any commercial or financial relationships that could be construed as a potential conflict of interest.
All claims expressed in this article are solely those of the authors and do not necessarily represent those of their affiliated organizations, or those of the publisher, the editors and the reviewers. Any product that may be evaluated in this article, or claim that may be made by its manufacturer, is not guaranteed or endorsed by the publisher.
HCA, hyocholic acid; BA, bile acid; GF, germ-free; FMT, fecal microbiota transplantation; CDCA, chenodeoxycholic acid; CA, cholic acid; DCA, deoxycholic acid; LCA, lithocholic acid; UDCA, ursodeoxycholic acid; GCDCA, glycohenodeoxycholic acid; TCDCA, taurodeoxycholic acid; GCA, glycoholic acid; TCA, taurocholic acid; UCA, ursocholic acid; ACA, allocholic acid; TDCA, taurodeoxycholic acid; GDCA, glycodeoxycholic acid; GUDCA, glycoursodeoxycholic acid; TUDCA, tauroursodeoxycholic acid; GLCA, glycolithocholic acid; TLCA, taurolithocholic acid; TP, total protein; GLO, globulin; ALB/GLO, albumin/globulin ratio; ALT, alanine aminotransferase; NA, sodium; CL, chlorinum; TC, total cholesterol; LDL, low-density lipoprotein; ADP, adiponectin; GLP1, glucagon-like peptide 1; INS, insulin; BUN, urea nitrogen; FXR, farnesoid X receptor; TGR5, Takeda G-protein-coupled receptor 5; FGFR4, fibroblast growth factor receptor 4; CYP7A1, cholesterol 7alpha-monooxygenase; CYP27A1, cholestanetriol 26-monooxygenase; CYP39A1, 24-hydroxycholesterol 7alpha-hydroxylase; CYP8B1, sterol 12-alpha-hydroxylase; CYP7B1, 25/26-hydroxycholesterol 7apha-hydroxylase; CH25H, cholesterol 25-hydroxylase; HSD3B7, steroid delta isomerase 7; RXRα, retinoid X receptor-alpha; SHP, small heterodimer partner; FGF19, fibroblast growth factor 19; NTCP, Na+ taurocholate cotransporting polypeptide; ASBT, apical sodium-dependent bile acid transporter; MRP3, multidrug resistance protein 3; MRP4, multidrug resistance protein 4; SGLT1, sodium-glucose contransporter, member 1.
Begley M., Gahan C. G., Hill C. (2005). The interaction between bacteria and bile. FEMS Microbiol. Rev. 29 (4), 625–651. doi: 10.1016/j.femsre.2004.09.003
Bustos A. Y., Font de Valdez G., Fadda S., Taranto M. P. (2018). New insights into bacterial bile resistance mechanisms: the role of bile salt hydrolase and its impact on human health. Food Res. Int. 112, 250–262. doi: 10.1016/j.foodres.2018.06.035
Chiang J. Y. (1998). Regulation of bile acid synthesis. Front. Biosci. 3, d176–d193. doi: 10.2741/a273
Claudel T., Staels B., Kuipers F. (2005). The farnesoid X receptor: a molecular link between bile acid and lipid and glucose metabolism. Arterioscler. Thromb. Vasc. Biol. 25 (10), 2020–2030. doi: 10.1161/01.ATV.0000178994.21828.a7
Deeks E. D. (2016). Deoxycholic acid: A review in submental fat contouring. Am. J. Clin. Dermatol. 17 (6), 701–707. doi: 10.1007/s40257-016-0231-3
Du Y., Chen H., Xuan Z., Song W., Hong L., Guo D., et al. (2016). Bile deficiency induces changes in intestinal glucose absorption in mice. Surgery 160 (6), 1496–1507. doi: 10.1016/j.surg.2016.05.040
Eyssen H. J., De Pauw G., Van Eldere J. (1999). Formation of hyodeoxycholic acid from muricholic acid and hyocholic acid by an unidentified gram-positive rod termed HDCA-1 isolated from rat intestinal microflora. Appl. Environ. Microbiol. 65 (7), 3158–3163. doi: 10.1128/AEM.65.7.3158-3163.1999
Geyer J., Wilke T., Petzinger E. (2006). he solute carrier family SLC10: more than a family of bile acid transporters regarding function and phylogenetic relationships. Naunyn Schmiedebergs Arch. Pharmacol. 372 (6), 413–431. doi: 10.1007/s00210-006-0043-8
Hardison W. G. (1978). Hepatic taurine concentration and dietary taurine as regulators of bile acid conjugation with taurine. Gastroenterology 75 (1), 71–75.
Hoeke M. O., Heegsma J., Hoekstra M., Moshage H., Faber K. N. (2014). Human FXR regulates SHP expression through direct binding to an LRH-1 binding site, independent of an IR-1 and LRH-1. PLoS One 9 (2), e88011. doi: 10.1371/journal.pone.0088011
Hofmann A. F., Hagey L. R., Krasowski M. D. (2010). Bile salts of vertebrates: structural variation and possible evolutionary significance. J. Lipid Res. 51 (2), 226–246. doi: 10.1194/jlr.R000042
Ikpa P. T., Doktorova M., Meijsen K. F., Nieuwenhuijze N. D. A., Verkade H. J., Jonker J. W., et al. (2020). Impaired intestinal farnesoid X receptor signaling in cystic fibrosis mice. Cell Mol. Gastroenterol. Hepatol. 9 (1), 47–60. doi: 10.1016/j.jcmgh.2019.08.006
Inagaki T., Moschetta A., Lee Y. K., Peng L., Zhao G., Downes M., et al. (2006). Regulation of antibacterial defense in the small intestine by the nuclear bile acid receptor. Proc. Natl. Acad. Sci. U.S.A. 103 (10), 3920–3925. doi: 10.1073/pnas.0509592103
Islam K. B., Fukiya S., Hagio M., Fujii N., Ishizuka S., Ooka T., et al. (2011). Bile acid is a host factor that regulates the composition of the cecal microbiota in rats. Gastroenterology 141 (5), 1773–1781. doi: 10.1053/j.gastro.2011.07.046
Jones B. V., Begley M., Hill C., Gahan C. G., Marchesi J. R. (2008). Functional and comparative metagenomic analysis of bile salt hydrolase activity in the human gut microbiome. Proc. Natl. Acad. Sci. U.S.A. 105 (36), 13580–13585. doi: 10.1073/pnas.0804437105
Kawamata Y., Fujii R., Hosoya M., Harada M., Yoshida H., Miwa M., et al. (2003). A G protein-coupled receptor responsive to bile acids. J. Biol. Chem. 278 (11), 9435–9440. doi: 10.1074/jbc.M209706200
Lee F. Y., Lee H., Hubbert M. L., Edwards P. A., Zhang Y. (2006). FXR, a multipurpose nuclear receptor. Trends Biochem. Sci. 31 (10), 572–580. doi: 10.1016/j.tibs.2006.08.002
Li M. Y., Zhou H., Ding Y. C., Liu Z. H., Sun J., Li Z. Q. (2020). Effects of gut microbiota on bile acid profile and bile acid metabolism in piglets. Biotechnol. Bull. 36 (10), 58–70. doi: 10.13560/j.cnki.biotech.bull.1985.2020-0269
McLeod G. M., Wiggins H. S. (1968). Bile-salts in small intestinal contents after ileal resection and in other malabsorption syndromes. Lancet 1 (7548), 873–876. doi: 10.1016/s0140-6736(68)90235-3
Midtvedt T. (1974). Microbial bile acid transformation. Am. J. Clin. Nutr. 27 (11), 1341–1347. doi: 10.1093/ajcn/27.11.1341
O’Flaherty S., Briner Crawley A., Theriot C. M., Barrangou R. (2018). The lactobacillus bile salt hydrolase repertoire reveals niche-specific adaptation. mSphere 3 (3), e0014–18. doi: 10.1128/mSphere.00140-18
Pang X., Hua X., Yang Q., Ding D., Che C., Cui L., et al. (2007). Inter-species transplantation of gut microbiota from human to pigs. ISME J. 1 (2), 156–162. doi: 10.1038/ismej.2007.23
Perez-Pineda S. I., Baylon-Pacheco L., Espiritu-Gordillo P., Tsutsumi V., Rosales-Encina J. L. (2021). Effect of bile acids on the expression of MRP3 and MRP4: An In vitro study in HepG2 cell line. Ann. Hepatol. 24, 100325. doi: 10.1016/j.aohep.2021.100325
Portincasa P., Di Ciaula A., Garruti G., Vacca M., De Angelis M., Wang D. Q. (2020). Bile acids and GPBAR-1: Dynamic interaction involving genes, environment and gut microbiome. Nutrients 12 (12), 3709. doi: 10.3390/nu12123709
Rajani C., Jia W. (2018). Disruptions in gut microbial-host co-metabolism and the development of metabolic disorders. Clin. Sci. (Lond) 132 (7), 791–811. doi: 10.1042/CS20171328
Ren S., Marques D., Redford K., Hylemon P. B., Gil G., Vlahcevic Z. R., et al. (2003). Regulation of oxysterol 7alpha-hydroxylase (CYP7B1) in the rat. Metabolism 52 (5), 636–642. doi: 10.1053/meta.2003.50106
Ridlon J. M., Harris S. C., Bhowmik S., Kang D. J., Hylemon P. B. (2016). Consequences of bile salt biotransformations by intestinal bacteria. Gut Microbes 7 (1), 22–39. doi: 10.1080/19490976.2015.1127483
Rizzolo D., Kong B., Taylor R. E., Brinker A., Goedken M., Buckley B., et al. (2021). Bile acid homeostasis in female mice deficient in Cyp7a1 and Cyp27a1. Acta Pharm. Sin. B 11 (12), 3847–3856. doi: 10.1016/j.apsb.2021.05.023
Sanyal A. J., Ling L., Beuers U., DePaoli A. M., Lieu H. D., Harrison S. A., et al. (2021). Potent suppression of hydrophobic bile acids by aldafermin, an FGF19 analogue, across metabolic and cholestatic liver diseases. JHEP Rep. 3 (3), 100255. doi: 10.1016/j.jhepr.2021.100255
Shapiro H., Kolodziejczyk A. A., Halstuch D., Elinav E. (2018). Bile acids in glucose metabolism in health and disease. J. Exp. Med. 215 (2), 383–396. doi: 10.1084/jem.20171965
Spinelli V., Lalloyer F., Baud G., Osto E., Kouach M., Daoudi M., et al. (2016). Influence of roux-en-Y gastric bypass on plasma bile acid profiles: a comparative study between rats, pigs and humans. Int. J. Obes. (Lond) 40 (8), 1260–1267. doi: 10.1038/ijo.2016.46
Sun J., Chen Y. L., Ding Y. C., Zhong H., Wu M., Liu Z. H., et al. (2021). Deposition of resistant bacteria and resistome through FMT in germ-free piglets. Lett. Appl. Microbiol 73 (2), 187–96. doi: 10.1111/lam.13490
Thomson A. B., Keelan M., Thiesen A., Clandinin M. T., Ropeleski M., Wild G. E. (2001). Small bowel review: normal physiology part 1. Dig Dis. Sci. 46 (12), 2567–2587. doi: 10.1023/a:1012794505897
Trauner M., Boyer J. L. (2003). Bile salt transporters: molecular characterization, function, and regulation. Physiol. Rev 83 (2), 633–671. doi: 10.1152/physrev.00027.2002
Wahlstrom A., Kovatcheva-Datchary P., Stahlman M., Khan M. T., Backhed F., Marschall H. U. (2017). Induction of farnesoid X receptor signaling in germ-free mice colonized with a human microbiota. J. Lipid Res. 58 (2), 412–419. doi: 10.1194/jlr.M072819
Wahlstrom A., Sayin S. I., Marschall H. U., Backhed F. (2016). Intestinal crosstalk between bile acids and microbiota and its impact on host metabolism. Cell Metab. 24 (1), 41–50. doi: 10.1016/j.cmet.2016.05.005
Wang X., Tsai T., Deng F., Wei X., Chai J., Knapp J., et al. (2019). Longitudinal investigation of the swine gut microbiome from birth to market reveals stage and growth performance associated bacteria. Microbiome 7 (1), 109. doi: 10.1186/s40168-019-0721-7
Winston J. A., Theriot C. M. (2020). Diversification of host bile acids by members of the gut microbiota. Gut Microbes 11 (2), 158–171. doi: 10.1080/19490976.2019.1674124
Xie C., Huang W., Young R. L., Jones K. L., Horowitz M., Rayner C. K., et al. (2021). Role of bile acids in the regulation of food intake, and their dysregulation in metabolic disease. Nutrients 13 (4), 1104. doi: 10.3390/nu13041104
Zhang L., Wang Y. D., Chen W. D., Wang X., Lou G., Liu N., et al. (2012). Promotion of liver regeneration/repair by farnesoid X receptor in both liver and intestine in mice. Hepatology 56 (6), 2336–2343. doi: 10.1002/hep.25905
Zheng X., Chen T., Jiang R., Zhao A., Wu Q., Kuang J., et al. (2021a). Hyocholic acid species improve glucose homeostasis through a distinct TGR5 and FXR signaling mechanism. Cell Metab. 33 (4), 791–803.e797. doi: 10.1016/j.cmet.2020.11.017
Zheng X., Chen T., Zhao A., Ning Z., Kuang J., Wang S., et al. (2021b). Hyocholic acid species as novel biomarkers for metabolic disorders. Nat. Commun. 12 (1), 1487. doi: 10.1038/s41467-021-21744-w
Zhou H., Sun J., Ge L., Liu Z., Chen H., Yu B., et al. (2020). Exogenous infusion of short-chain fatty acids can improve intestinal functions independently of the gut microbiota. J. Anim. Sci. 98 (12), skaa371. doi: 10.1093/jas/skaa371
Zhou H., Sun J., Yu B., Liu Z., Chen H., He J., et al. (2021a). Gut microbiota absence and transplantation affect growth and intestinal functions: an investigation in a germ-free pig model. Anim. Nutr 7 (2), 295–304. doi: 10.1016/j.aninu.2020.11.012
Zhou H., Yu B., Sun J., Liu Z., Chen H., Ge L., et al. (2021b). Short-chain fatty acids can improve lipid and glucose metabolism independently of the pig gut microbiota. J. Anim. Sci. Biotechnol. 12 (1), 61. doi: 10.1186/s40104-021-00581-3
Keywords: piglets, bile acid profile, fecal microbiota transplantation, farnesoid X receptor, bile acid synthesis
Citation: Sun J, Li MY, Zhou H, Chong J, Zhang JW, Yu B, Chen DW and Ge LP (2022) Importance of gut microbiota for bile acid composition and concentration in pigs. Front. Anim. Sci. 3:951840. doi: 10.3389/fanim.2022.951840
Received: 21 June 2022; Accepted: 08 August 2022;
Published: 24 August 2022.
Edited by:
Graham Cliff Lamb, Texas A&M University College Station, United StatesReviewed by:
Jeffrey Wiegert, Texas A&M University, United StatesCopyright © 2022 Sun, Li, Zhou, Chong, Zhang, Yu, Chen and Ge. This is an open-access article distributed under the terms of the Creative Commons Attribution License (CC BY). The use, distribution or reproduction in other forums is permitted, provided the original author(s) and the copyright owner(s) are credited and that the original publication in this journal is cited, in accordance with accepted academic practice. No use, distribution or reproduction is permitted which does not comply with these terms.
*Correspondence: Daiwen Chen, ZHdjaGVuQHNpY2F1LmVkdS5jbg==; Liangpeng Ge, Z2VsaWFuZ3BlbmcxOTgyQDE2My5jb20=
†These authors have contributed equally to this work
Disclaimer: All claims expressed in this article are solely those of the authors and do not necessarily represent those of their affiliated organizations, or those of the publisher, the editors and the reviewers. Any product that may be evaluated in this article or claim that may be made by its manufacturer is not guaranteed or endorsed by the publisher.
Research integrity at Frontiers
Learn more about the work of our research integrity team to safeguard the quality of each article we publish.