 Jessica M. Neary
 Nathaniel D. Porter
 Abbie V. Viscardi
 Leonie Jacobs
94% of researchers rate our articles as excellent or good
Learn more about the work of our research integrity team to safeguard the quality of each article we publish.
Find out more
ORIGINAL RESEARCH article
Front. Anim. Sci. , 22 July 2022
Sec. Animal Welfare and Policy
Volume 3 - 2022 | https://doi.org/10.3389/fanim.2022.937020
We need validated, practical methods for pain assessment in piglets. Pain assessment can help researchers, veterinarians and industry professionals identify the need for analgesia or other pain management approaches when applying painful procedures, such as surgical castration. A pain assessment tool, the Piglet Grimace Scale (PGS), was previously validated in this context, but it is not widely applied. It is important that the PGS can be applied by a range of people, not just pain assessment experts. Our objective was to study the validity and reliability of PGS ratings applied by swine industry professionals and the general public, to assess its potential utility in non-research applications. To do so, we conducted an online Qualtrics survey in which, after completing a brief online training module and a practice test, 119 respondents were asked to rate 9 piglet images showing facial expressions immediately after surgical castration or sham-handling. Respondents were provided information on the castration treatment for each image and had continuous access to the scale throughout the survey. The survey also contained demographic questions. Industry respondents were recruited through networking, and participants from the general public were recruited through Amazon Mechanical Turk. Four trained experts scored each image, and these scores were averaged to produce gold standard scores. Intraclass correlations indicated strong internal consistency among experts, industry and public. ANOVA demonstrated scoring to be moderately comparable between groups. Campbell and Fiske’s Multi-Trait Multi-Method framework provided qualified support for the internal validity and reliability of the PGS scale, even applied by non-experts (industry and public). Both response groups were able to recognize pain in castrated piglets. However, public respondents attributed higher levels of pain to sham-handled piglets than industry respondents (2.83 vs. 2.35; p=0.047), and both response groups systematically overestimated pain experience compared to the experts, suggesting more training may be necessary before using the scale in a diagnostic capacity. Nevertheless, overall findings support wide applicability of PGS, even with minimal training, to improve awareness, recognition and monitoring of swine pain among veterinarians, industry professionals and even members of the public.
In the United States (U.S.) swine industry, all piglets undergo invasive husbandry procedures within the first few days of life including vaccines, iron injections, and tail docking. Another invasive procedure is the surgical castration of male piglets intended for slaughter without analgesics or anesthetics (Rault et al., 2011). The American Veterinary Medical Association (AVMA) recommends that after day 14 of age, boars should be castrated using analgesia, anesthesia, or both (AVMA, 2020). Typically, piglets are castrated within the first week of life. Therefore, no analgesia or anesthesia is used even though the procedure is painful. Surgical castration can cause acute and chronic pain lasting for 4 days (Hay et al., 2003; Kluivers-Poodt et al., 2013; Ison et al., 2016). Surgical castration involves the manual restraint of the boar, two small incisions or one single horizontal incision on the scrotum, manual removal of the testicles, and a cut or tear of the spermatic cord (AVMA, 2013). The procedure is typically done by a trained farm technician and takes less than 30 seconds. Piglets are castrated to prevent aggressive behaviors later in life (Rydhmer et al., 2006). Castration also prevents boar taint in the meat, which is caused by the post-pubertal deposition of androsterone and skatole in body fat and causes a foul odor when the meat it prepared (Keenan, 2016). Depending on age, breed, and environment, over 50% of intact boars produce pork containing boar taint (Prusa et al., 2011). Seventy-five percent of consumers are sensitive to detect boar taint (Bañón et al., 2004). According to the United States Food Safety and Inspection Service, carcasses that give off a pronounced sexual odor should be condemned (9 CFR 311.20 - Sexual odor of swine. 2012). If the sexual odor is less pronounced, the carcass may be used for comminuted cooked meat products or for rendering. To avoid condemnation, producers will surgically castrate boars to ensure boar taint does not develop.
As the transition from surgical castration to alternative approaches has been slow to non-existent depending on the region, a short-term solution to avoid castration-induced pain would be to provide an analgesic at and after castration. In the U.S., no pharmaceuticals are approved by the U.S. Food and Drug Administration for use in pigs. However, veterinarians can prescribe the extra-label use of anesthetics and analgesics (AVMA, 2013), such as non-steroidal anti-inflammatory drugs (i.e. meloxicam) (Viscardi and Turner, 2018). In addition, producers can provide analgesics post-castration if pain-related behavior is observed, such as trembling, spasms, scratching, tail wagging and stiffness (Viscardi and Turner, 2018). Training producers and industry professionals to assess pain could sensitize them to the potentially frequent expression of pain-related behaviors in piglets and in turn increase willingness to apply analgesics or use alternatives to surgical castration.
A lack of non-invasive, easy-to-use pain assessment tools for the swine industry may hinder pain management. Piglets’ pain experience can be determined by quantifying their facial expressions. Species-specific grimace scales are pain assessment tools that could be used as a decision tool for analgesia application and as an indicator of animal welfare (Miller and Leach, 2015). A Piglet Grimace Scale was developed based on 10 facial action units (FAUs), which are facial muscle movements that can change in response to pain through regulation of complex limbic systems (Mota-Rojas et al., 2020). When applied, only one FAU related to orbital tightening significantly changed due to tail docking (Di Giminiani et al., 2016). In 2017, another Piglet Grimace Scale (PGS) was developed and validated as a scoring system to recognize pain in piglets after surgical castration (Viscardi et al., 2017; Viscardi and Turner, 2018). The PGS is an ordinal scale focusing on expression of ears, cheeks, and eyes, with higher scores representing more severe pain expression. Castrated piglets showed more pain behaviors and had higher PGS scores (more facial grimacing) compared to uncastrated piglets (Viscardi and Turner, 2018).
The PGS is not widely applied in the swine industry. This could partly be because of limited knowledge on validity of the tool in a commercial setting. It is important that the PGS can be applied by a range of people with a range of experiences, yet it is unclear whether the PGS has applicability outside of a research context. It is unknown whether the PGS has utility in non-research applications and whether people with (industry professionals) or without animal experience (general public) would be able to provide valid and reliable PGS ratings after minimal training as studies (Viscardi et al., 2017; Viscardi and Turner, 2018) suggest the need for training for personnel to properly identify subtle species-specific facial changes. Thus, we aimed to determine whether non-experts would be able to apply the PGS under less than ideal conditions with limited training. Through an online survey, the objectives of this study were to 1) evaluate the impact of swine industry experience on survey participants’ ability to apply the PGS, and 2) evaluate the ability of all respondents to apply the appropriate PGS scores compared to gold standard ratings by pain experts, using Campbell and Fiske’s Multi-Trait Multi-Method framework to assess internal validity and reliability. We hypothesized that industry professionals would rate scenarios differently than the general public, and would show greater consistency with expert raters compared to the general public. In addition, we hypothesized that the internal validity and reliability of the PGS, as based on the comparison of non-experts with experts, would be appropriate for use of the tool in the swine industry.
All procedures and informed consent protocols were approved by Virginia Tech Human Research Protection Program Institutional Review Board, protocol #20-404. The use of boars in this study was approved by Virginia Tech Institutional Animal Care and Use Committee, protocol #19-288.
The online Qualtrics survey (SAP, Provo, UT, USA) was distributed (August-September 2020) with the aim to receive responses from experienced swine industry respondents (“industry”) and respondents from the general public without swine industry work experience (“public”) at a 1:1 ratio. Industry respondents were recruited through Facebook and by direct email to industry stakeholders and university faculty within the authors’ network. Facebook posts were not sponsored and were not distributed in any Facebook groups. Facebook users, swine industry contacts and university faculty were invited to disseminate the survey to others with a relevant background, including farm owners, operators, technicians and veterinarians. Simultaneously, public respondents were recruited through Amazon Mechanical Turk (Amazon Web Services, Seattle WA, USA) and received a monetary compensation for their time through the website. Industry respondents did not receive compensation. Inclusion criteria required respondents to be over the age of 18 and living in the U.S. Responses were entered anonymously.
We received 129 complete survey responses. Five were omitted because respondents did not live in the U.S., and five were omitted because respondents failed the attention check question. Survey respondents were categorized as either ‘public respondents’ which was defined as having no professional swine industry experience, or as ‘industry respondents’ which was defined as having any professional, paid swine industry experience. We included 119 completed surveys in the data analysis, 66 from the public respondents (55%) and 53 from industry respondents (45%).
The survey consisted of three sections, each described in more detail below: (1) guided training on how to apply the piglet grimace scale (PGS) (Viscardi et al., 2017; Viscardi and Turner, 2018), accompanied by 4 practice questions, (2) 9 images of piglets (Appendix 1), 6 castrated and 3 sham-handled, to be rated using the PGS, and (3) 9 demographic questions. The survey instrument is included in the supplemental materials.
The initial section of the survey was aimed at training respondents to apply the scoring system. Training was categorized into topics based on three scoring components; ear positioning (0-3), cheek tightening (0-2), and orbital tightening (0-1) (Viscardi and Turner, 2018). After each component was introduced, respondents completed a practice question, after which the correct answer was provided with an explanation. The images used in this practice section were different than those in section 2.
The main (second) section of the survey contained nine close-up images of piglets’ facial expressions. Images used in this survey were stills taken from videos of nine 7-day old boars from five litters. Within litters, one boar was allocated to the sham castration treatment (SHAM) during which the boar was just handled, and another was allocated to surgical castration treatment (CAS). Individual CAS piglets were held between the handler’s legs and surgically castrated by making two vertical incisions on the scrotum and cutting the spermatic cord. Piglets were surgically castrated without anesthesia or analgesia, as is common in the U.S. swine industry (Rault et al., 2011). Piglets were video recorded from the start of restraint, during castration, and for 30s while the piglet was held upright by the body for 30s. A similar recording approach was taken for the SHAM treatment group, but without castration. The boar was restrained between the handler’s legs for 30s, followed by holding the piglet upright for another 30s. Nine stills were used in this survey section; six stills from videos of CAS piglets (two during the castration process; four post-castration), and three stills from SHAM handling videos. The number of photos included in the survey were limited because of the negative relationship between completion rate and survey length and question difficulty (Liu and Wronski, 2017). Our priority was to determine rater scores for castrated males, therefore those images were overrepresented compared to sham-handled males.
Alongside each image was a short description mentioning either “this piglet was castrated” or “this piglet has not been castrated”. Survey respondents were asked to score each PGS component for each of the 9 images without a time limit. After each image, respondents were asked to score their level of confidence on a 5-point Likert scale ranging from not confident at all to extremely confident. Respondents had access to a PDF containing the PGS explanation, which they were encouraged to use as a reference throughout the survey. Non-published data from three piglet scenarios (n=119 respondents) showed that falsifying information related to castration status (SHAM for CAS and CAS for SHAM scenarios) did not bias raters’ PGS scores (i.e., raters provided similar scores to the same duplicated piglet scenarios with either SHAM or CAS information).
The third section of the survey included eleven demographic questions. Respondents were asked about their gender (male, female, non-binary, prefer to self-describe, prefer not to say), age group (18-25, 26-35, 36-45, 46-55, 56-65, 66+ years old), home state or territory, community type (city/urban, suburban, rural, other), meat consumption, pet ownership, and highest level of education. Based on home state or territory entries, respondents were grouped into one of five regions in the U.S. (Northeast, Southeast, Midwest, West, Southwest). Respondents were also asked about any type of professional experience with swine. Survey respondent demographics are compared with U.S. census data in Table S1.
Data processing and primary analysis was conducted in R (v4.1.2; R Core Team 2021), with additional Multi-Trait Multi-Method analysis in Microsoft Excel. Code and anonymized data can be found in (Neary et al., 2022).
We calculated a gold standard PGS score as standard of comparison for each of the 9 images. Four trained researchers were blinded to treatment and provided scores for the same nine piglet scenarios. Averaged two-way random-effects Intraclass Correlation Coefficients (ICC) were calculated with the ICC function in the psych package (v2.1.9, Revelle 2021) for eye, ear and cheek scores, and based on guidelines from (Koo and Li, 2016), showed a good (0.79, 95% C.I. = 0.53-0.93) ICC for ears, excellent (0.94, 95% C.I. = 0.87-0.98) ICC for cheek, and perfect (1.0, C.I. not applicable) ICC for eye scores. These four ratings were averaged to calculate a standard of comparison (gold standard) for each component of each image.
Inter-group reliability measures the consistency of ratings across different groups. One-way ANOVA between the three respondent groups was conducted on total PGS scores, with post-hoc analysis of group differences conducted using Tukey’s HSD when the F-tests was significant at the p<0.05 level. Analysis was conducted separately for CAS and SHAM images, as well as in aggregate, using the aov and TukeyHSD functions in the stats package (v4.1.2; R Core Team 2021) in R. Significant ANOVA F-tests indicate cross-group variation in mean total scores for the same scenario. Significant Tukey’s HSD tests indicate a specific group’s mean ratings were significantly higher than another after adjusting standard errors to a family-wise p<0.05.
Intra-group reliability measures the consistency of ratings across independent raters from the same background (expert, industry or public) and was calculated using ICC2 and ICC2k Intraclass Correlation tests (Howell, 2018) with the ICC function in the psych package (v2.1.9, Revelle 2021). Both measures have a 0-1 range. High ICC2 values indicate two random individuals from the group are likely to score the given components (ear, cheek, eye, and total PGS score) similarly. ICC2k is a parallel measure but assesses the likely consistency of the mean ratings in each group with different samples.
Validity was assessed using Campbell and Fiske’s Multi-Trait Multi-Method (MTMM) model (Campbell and Fiske, 1959). Most common measures of reliability and validity, such as Cronbach’s Alpha (Cronbach, 1951), are what Campbell and Fiske term “convergent” tests of observed correlation of a set of items. While they attempt to assess the degree to which items measure a single underlying construct (like piglet grimacing), convergent measures are unable to discriminate between shared true variance (construct validity) and shared error variance, such as correlation due to the method of data collection (Alwin, 2005). Campbell and Fiske argued that “tests can [also] be invalidated by too high correlations with other tests from which they were intended to differ” (Campbell and Fiske, 1959). That is, ideally, measures of the same underlying trait should not only closely resemble each other (convergent validity) but also differ meaningfully from measures of other traits (discriminant validity). For example, if the PGS is performing well, we should expect different raters to rate the same images more similarly than the same raters rating different images, because different images represent different actual piglet experiences. If all criteria are met, MTMM provides more robust evidence of reliability and validity. If some are not met, MTMM can help identify whether validity is impaired primarily by individual raters, images or features or whether there more complex interactions to address.
MTMM was proposed to simultaneously test both convergent and discriminant validity using data collected on multiple distinct traits, but with each trait measured using the same variety of multiple methods (Alwin, 2007). Methods may vary in many ways, such as question wording, number of response categories, or time of data collection (e.g., longitudinal). In MTMM, a correlation matrix of each trait as measured within and between each method is used to evaluate four specific criteria, one for convergent validity and three for discriminant validity. The matrix is divided into blocks, with each block containing the correlations of each trait as measured by two methods, as in the 3-trait, 3-method example in Table 1. Based on the assumption that items measuring the same trait or using the same methods should be more closely correlated than others, Campbell and Fiske (1959) propose the following four validity criteria (CF1-CF4):
1. Correlations between different methods measuring the same trait (bolded in Table 1, also called the validity diagonal) should be large enough to motivate investigating validity further.
2. Correlations in the validity diagonal should be higher than others in the same row or column of the same block.
3. The correlation between two methods of measuring the same trait should be higher than between two traits measured with the same methods.
4. Patterns of heterotrait correlations (non-1, non-bolded in Table 1) should be similar between all monomethod blocks (method 1-1 and method 3-3 in Table 1) and between all heteromethod blocks (method 1-2 and method 2-3 in Table 1).
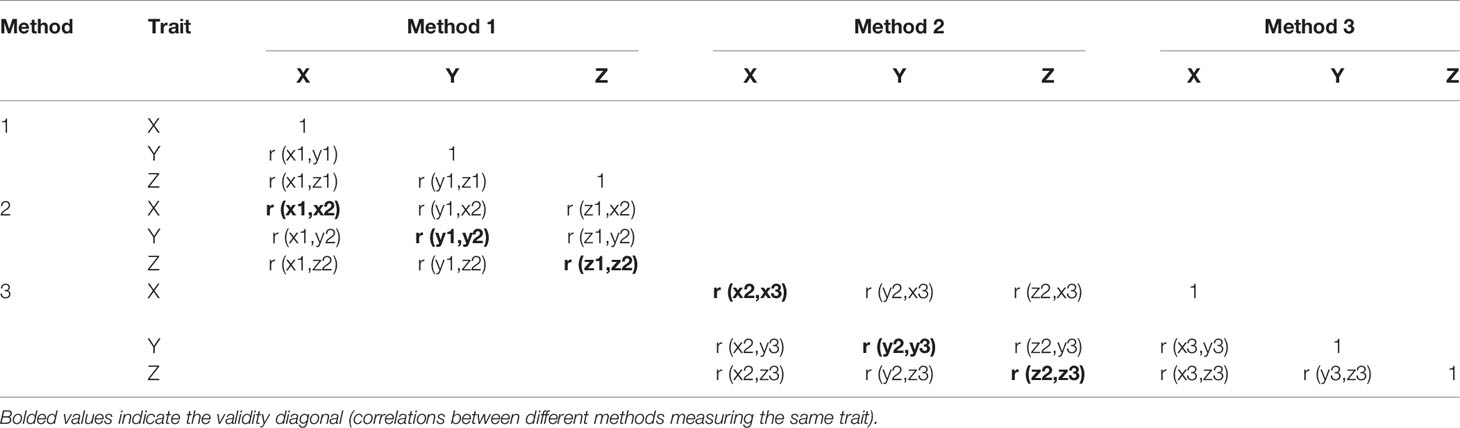
Table 1 Example Multitrait-Multimethod Correlation Matrix.
The substantive meaning of each criterion is discussed below, along with evaluation methods. Polychoric correlations calculated with the polychoric function and significance calculated with the corci function [psych package, (Revelle, 2022)] are used to estimate relationships between items with ordinal measurement (PGS components) on a continuous latent scale. Each image is treated as a trait on the assumption that the piglets have unique pain experiences and patterns of grimace response expression. PGS components (eye, cheek, ear) are treated as different methods of measuring the same underlying concept of piglet pain (Viscardi and Turner, 2018).
CF1 measures convergent validity and establishes that multiple measures of the same trait capture a similar underlying concept. The remaining criteria all test divergent validity. To test CF1 for each correlation, we will use the following categories: non-significant, low (<0.3), moderate (0.3 to less than 0.6), and high (>0.6). Both significance and strength are relevant to establishing baseline convergent validity.
The remaining criteria measure different aspects of divergent validity. CF2 establishes whether the results of two ways to measure the same trait resemble each other more closely than the same methods used to measure two different traits, e.g. whether the traits are meaningfully different. This is analyzed in summary using a T-test of the difference in mean correlation between monotrait-heteromethod (MTHM) and heterotrait-heteromethod (HTHM) cells, as well as by descriptive analysis of the observed proportion of HTHM correlations in the same row and column that are less than the MTHM.
CF3 tests if relationships between items are driven primarily by substantive (trait) or technical (method) differences. This is evaluated with a T-test of difference of means between MTHM and heterotrait-monomethod (HTMM) cells.
CF4 tests whether traits demonstrate similar patterns of relationship when measured in different ways (including both individual measures and composites from multiple methods). This is tested using pairwise between-block correlations of all heterotrait (HT) cells.
In summary, we use MTMM to address the limitations of common summary statistics for reliability (i.e. Alpha, ICC), which only measure internal convergent validity – whether multiple items or raters covary closely – and thus are unable to distinguish between substantive relationships and common method or error variance. The first validity criterion (CF1) accomplishes the same goal as traditional reliability measures, but the remaining three criteria provide more granularity by assessing discriminant validity; e.g. the extent to which measures that ought to (theoretically) be different do in fact differ. This in turn can help discern the differences between rater bias and poor performance on particular features or images.
Figure 1 summarizes mean PGS scores for each group of raters by PGS component (ear, cheek, eye) and treatment (castration or sham-handled) in a table, alongside a Forestplot (v2.0.1, Gordon & Lumley 2021) of public and industry PGS means with 95% confidence intervals, centered on the gold standard ratings established by experts. The mean total PGS score across all raters and images was 3.09, compared to the mean gold standard of 2.50, with 3 being the most common PGS score and 18% falling into the “no- to low pain” category (PGS=0-1) compared to 14% in the gold standard group, following Viscardi et al. (2017) categorization. Overall, respondents indicated a confidence level between 3 and 4, indicating feeling ‘somewhat confident’ in their scenario scores.
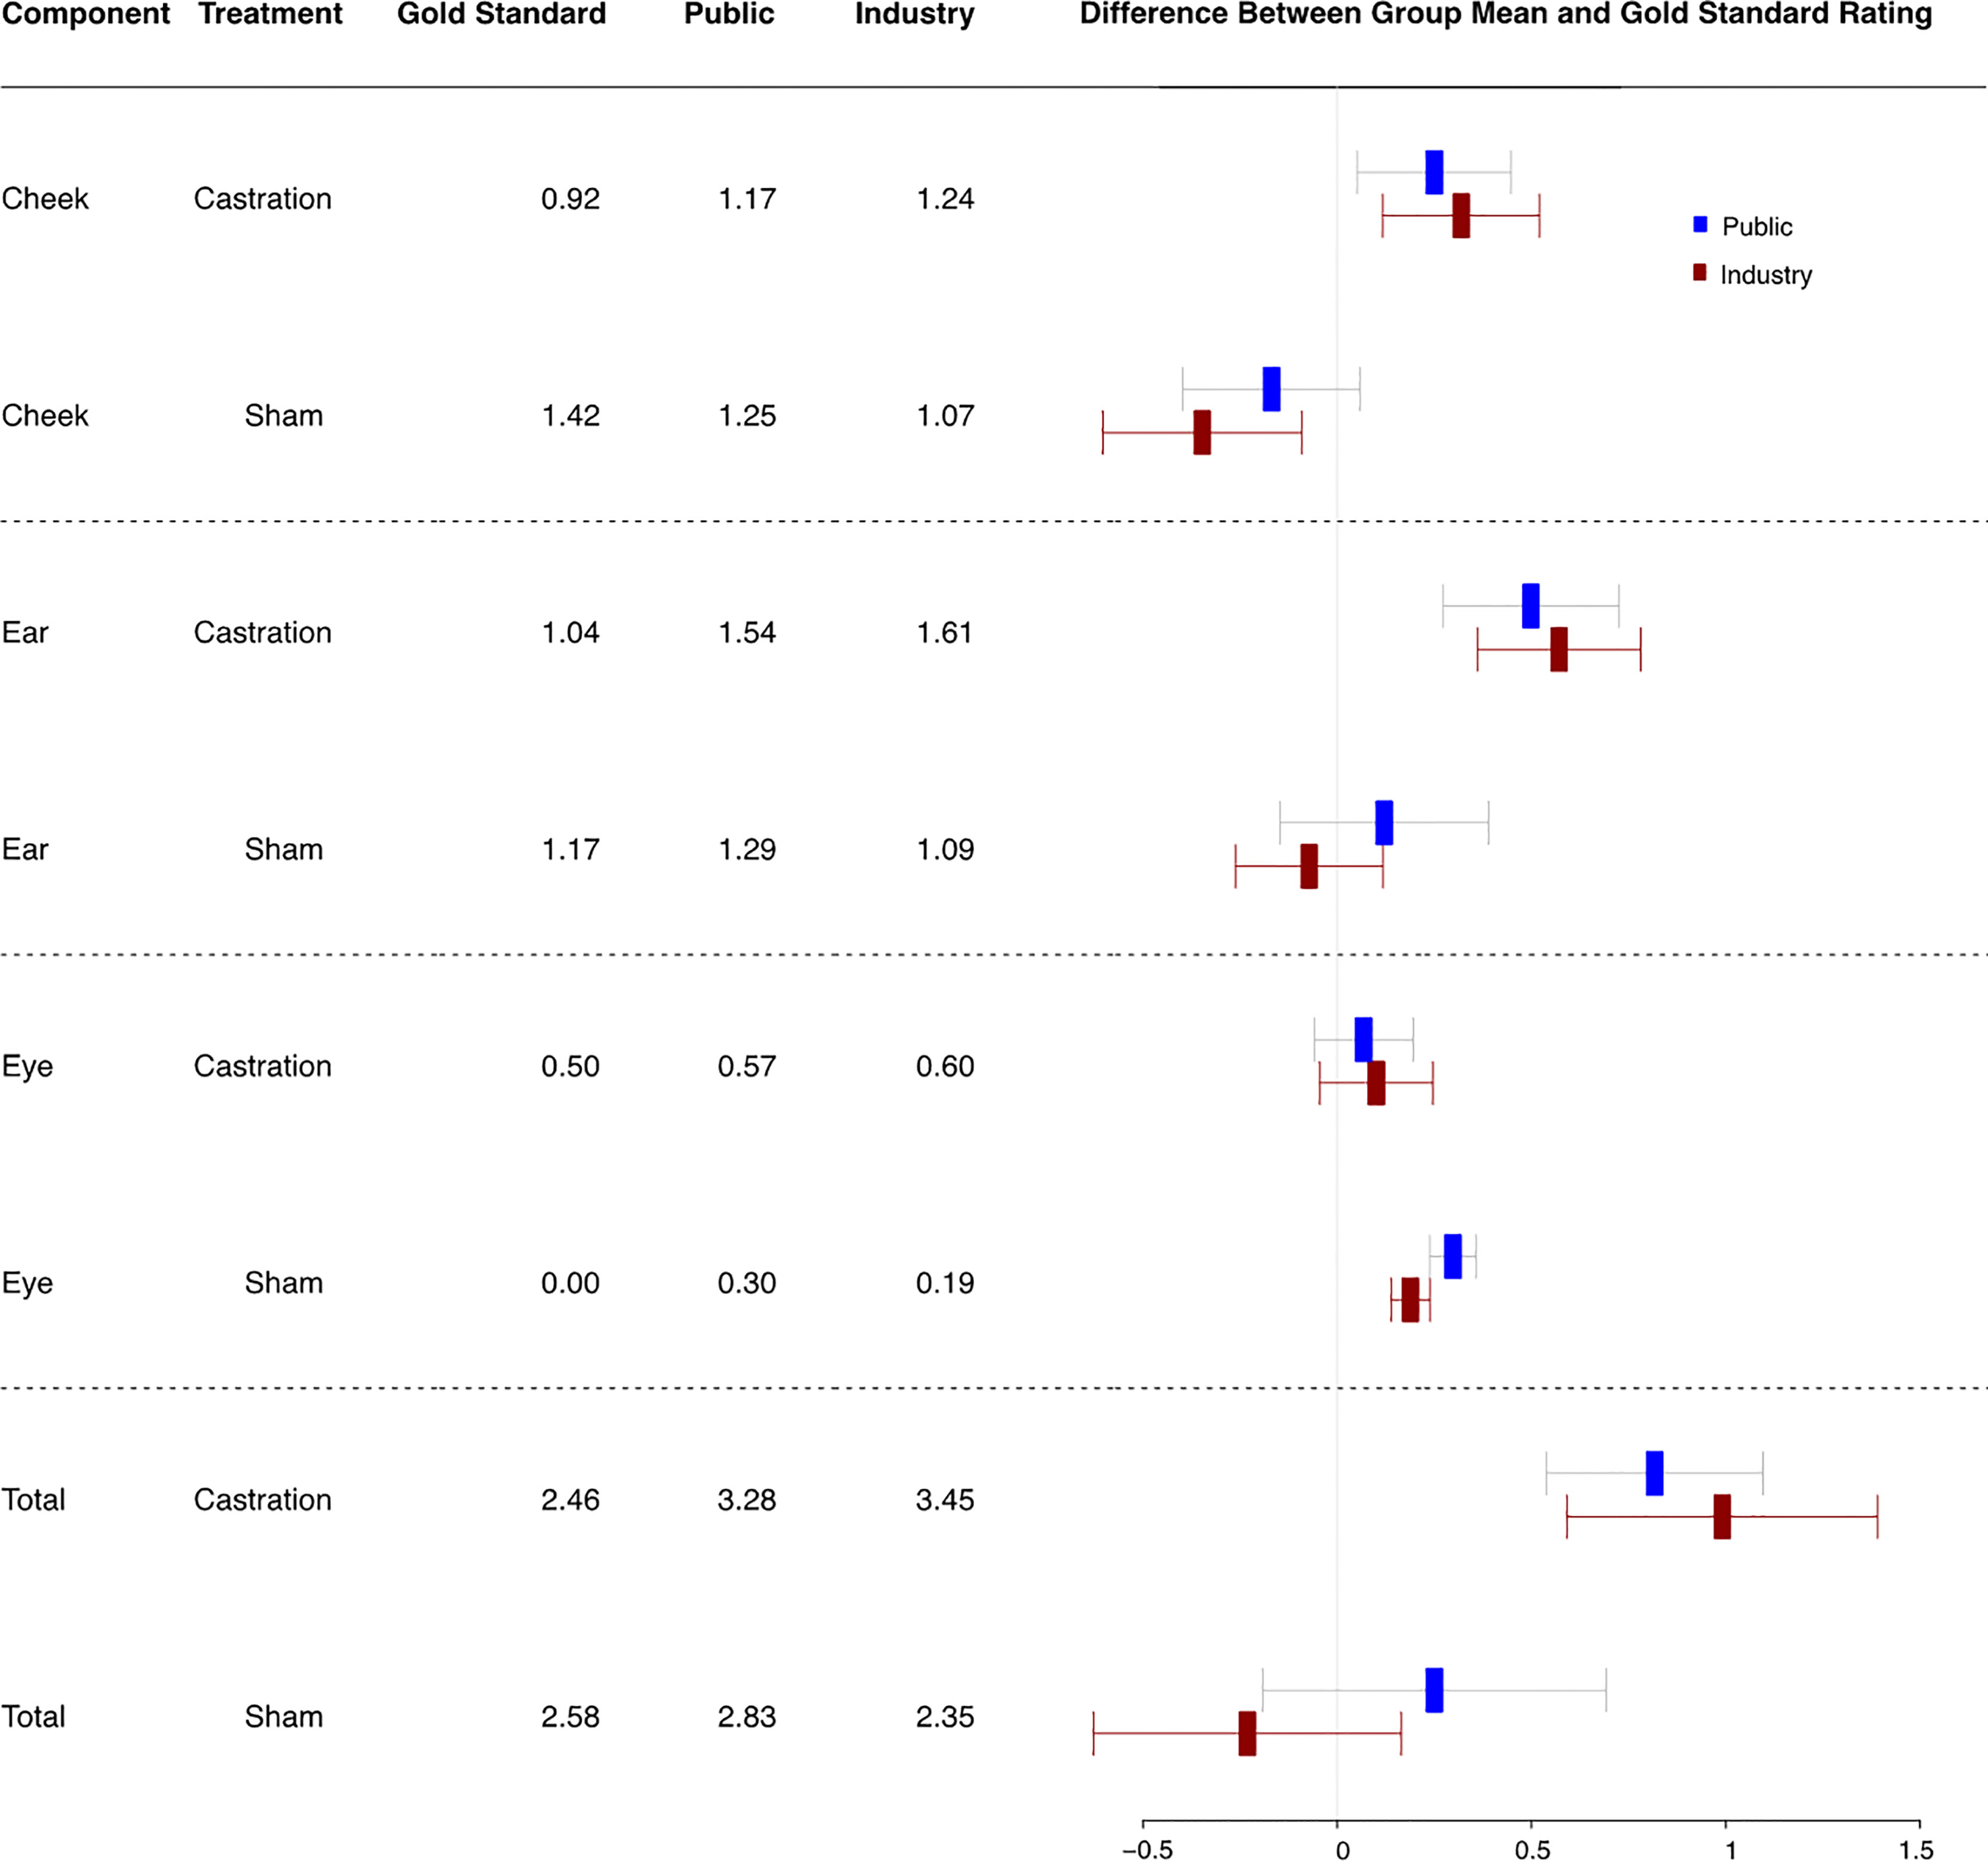
Figure 1 Respondents’ scores [general public (n = 66) and industry respondents (n = 53)] by feature (eye, ear, cheek) and treatment (castration or sham-handled) relative to gold standard scores (n = 4).
One-way ANOVA (Table 2) indicated no significant differences in total PGS score between the three rater groups across all images (p=0.266). However, differences were significant within the subset of CAS images (p=0.034) and tended to be significant (p=0.060) for SHAM images. Using post-hoc comparison with Tukey’s HSD (Table 2), a mean score difference was found for CAS images of 0.991 between industry and experts (p=0.034) and a marginal score difference of 0.817 between public and experts (p=0.095). For SHAM scenarios, a mean score difference of 0.481 was found between public and industry (p=0.047).
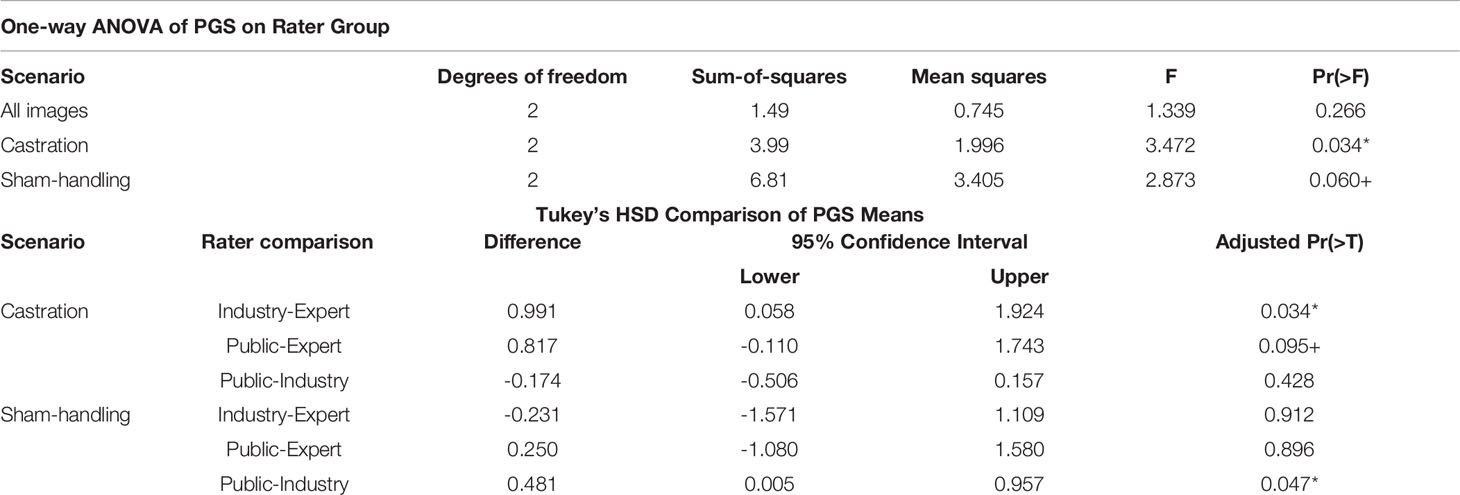
Table 2 One-Way ANOVA of Piglet Grimace Scale (PGS) mean scores as a function of Rater Group by treatment with Tukey’s HSD post-hoc comparisons of *significant (p < 0.05) and +marginally significant (p < 0.10) results.
The Intraclass Correlation results can be found in Table 3. Within-group consistency of estimates of the mean (ICC2k) was high across all groups and features, with ICC2k for the total score ranging from 0.76 (experts) to 0.96 (industry). The ICC2 reliabilities of individual ratings (as compared to means) were lower and more variable, with public ICC2 ranging from 0.14 to 0.25, industry from 0.30 to 0.39, and experts from 0.44 to 1. The ordering of expert-industry-public from most to least reliable was consistent across all components for ICC2.
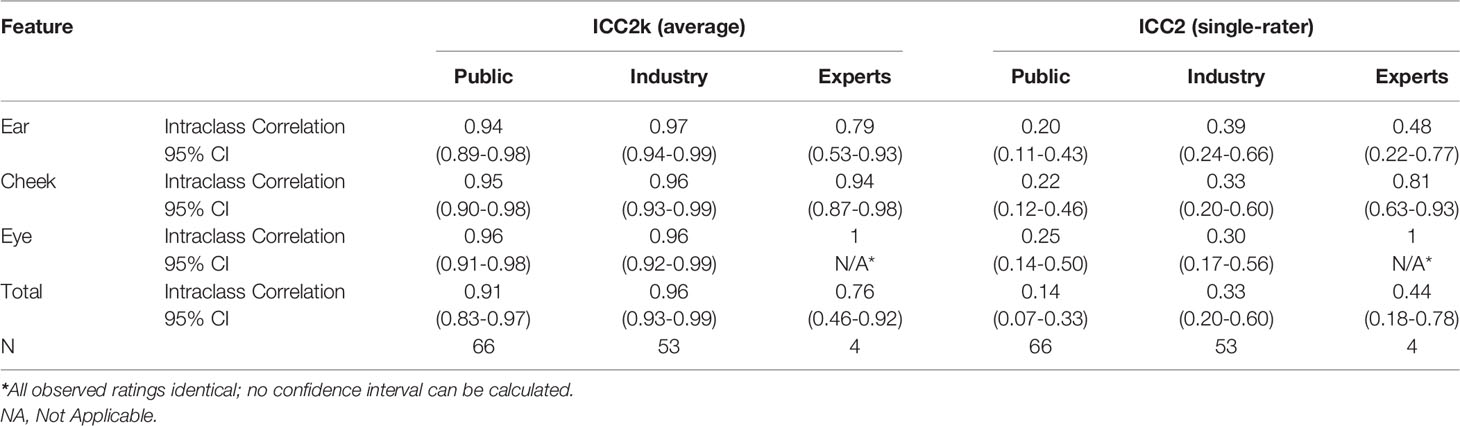
Table 3 Average and Single-Rater Intraclass Correlation (ICC) with 95% Confidence Intervals (CI) by Piglet Grimace Scale (PGS) feature and total scores.
The full MTMM matrix of correlations between image and component ratings across all raters is shown in Table S2. Findings for validity criteria are addressed separately below.
There are three heteromethod combinations (ear-cheek, ear-eye, cheek-eye), each measured on 9 scenarios, with polychoric correlations in Table 4. Two-thirds (18/27) of correlations are statistically significant, with 44.4% (12/27) of correlations showing a moderate magnitude of at least 0.3. No correlations had a high magnitude. Overall, ear and eye ratings were less correlated than the other combinations, with only two of nine correlations showing a magnitude of at least 0.3 (Table 4).
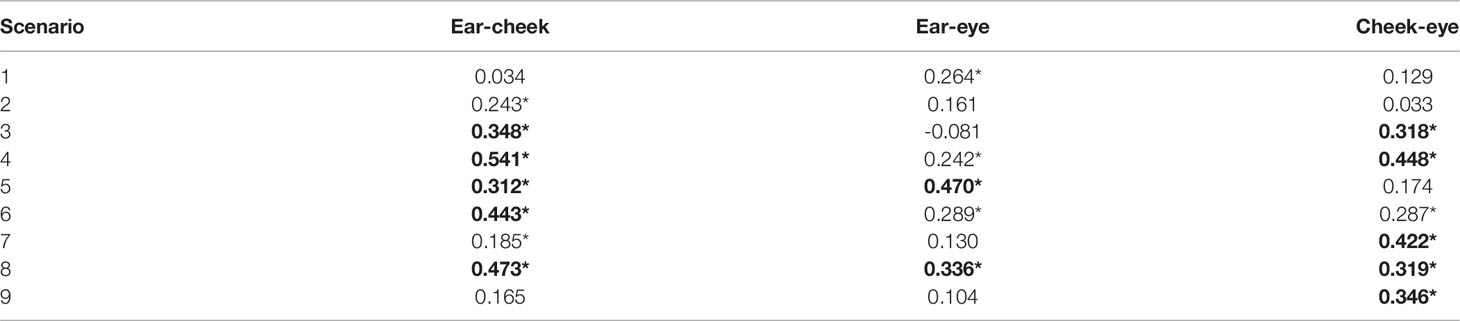
Table 4 MTMM Monotrait Heteromethod Correlations for all PGS raters (n=123) per scenario (* = polychoric correlation significantly different from 0, p<0.05; bolded = magnitude > 0.3).
This test compares the MTHM correlations in Table 4 to correlations using the same pair of methods (i.e., ear and cheek) but with two different images (HTHM). The overall mean MTHM correlation of 0.266 is significantly higher than the mean HTHM correlation of 0.078 (difference=0.187, T=5.279, n=133, p<0.001). More than 3/4 of individual cells met criterion CF2 in every heteromethod block (ear-cheek: 0.833, ear-eye: 0.833, cheek-eye: 0.764). None of the 9 images failed the criteria in more than ten of the 24 comparisons. This indicates that different facial measures of pain in the same piglet are more closely related than those measures across different piglets.
Although the observed mean of MTHM correlations (0.266) is marginally higher than that of HTMM cells (0.244), the difference of 0.022 is not statistically significant (T=0.4268, n=133, p=0.6702). Criterion CF3 is not met and we find no evidence that differences between methods (facial feature ratings) by trait (scenario) were smaller than differences between separate scenarios when measuring with the same rating component.
CF4 is tested using the correlation of the vectors of all heterotrait cells between each pair of heteromethod blocks and between each pair of monomethod blocks. Correlations were significant and positive (p<0.05) for 3 of the 6 combinations (Table 5). All non-significant correlations either included eye-eye or eye in both blocks, implying eye grimace ratings were not as closely correlated to other measures as ear and cheek were to each other.

Table 5 MTMM Heterotrait Inter-block Correlations (bold = p<0.05).
Pain associated with surgical castration is a welfare concern for piglets, and most, if not all male piglets intended for meat are surgically castrated without analgesia in the U.S. (Rault et al., 2011). Pain assessment using the PGS could be a quickly applicable tool to make decisions about pain alleviation during or after the procedure. This is the first survey to investigate aspects of the applicability of the PGS in the U.S. swine industry. Using an online survey with industry and public respondents, we found that respondents showed a consistent ability to score pain expression in castrated piglets. Yet, public respondents attributed higher levels of pain to sham-handled piglets than industry respondents, and both overestimated pain compared to experts. Campbell and Fiske’s Multi-Trait Multi-Method framework provided qualified support for the internal validity and reliability of the PGS scale, even applied by non-experts after minimal training.
Comparing the 119 survey respondents to the 2019 American Community Survey estimates for the U.S. population (United States Census Bureau, 2019), the gender distribution of respondents did not differ significantly from the population, but respondents were younger, more often located in suburban or rural communities, and more highly educated (Table S1). In terms of region, survey respondents were mostly from the West and Midwest (30% and 40% respectively), which were overrepresented compared to the Southeast (8%) and Southwest (6%) (United States Census Bureau, 2019). The skew towards the West and the Midwest is likely due to the concentration of swine production in those regions (U.S. Hog NASS 2014). The skewed sample in this study may limit the possibility to extrapolate results but does provide a first insight in the ability of respondents to apply the PGS.
PGS scores were predominantly in the “unclear” or “moderate to high” pain ranges for both castrated and sham-handled piglets. Echoing previous findings, expert scores did not differ between castrated and sham-handled piglets (Di Giminiani et al., 2016; Viscardi & Turner, 2018). Thus, while PGS has been found to covary with other indicators of pain (Viscardi et al., 2017; Viscardi & Turner, 2018; Vitali et al., 2020; Vullo et al., 2020) and several studies have shown that surgical castration causes acute pain in piglets (Hay et al., 2003; Kluivers-Poodt et al., 2013; Ison et al., 2016), the scale’s poor discrimination at moderate pain levels may limit its diagnostic value for researchers and veterinarians without additional measurements. This is consistent with prior findings on facial grimace scales (Vullo et al., 2020; Hernandez-Avalos et al., 2021). For application of a dog grimace scale, evaluator age, experience, training, and image quality impacted the way evaluators interpreted facial changes (Barletta et al., 2016). Additionally, the accuracy of these scales can be affected by the type of pain the animal is experiencing, as well as the way that animal is coping with the pain (Mich and Hellyer, 2008). Nevertheless, the PGS’ low-cost and non-invasive nature position it well for use in training and sensitization of industry professionals, as well as for initial identification of animals who may require closer attention or observation in relation to painful procedures. Additional measurements, such as physiological responses (i.e. heart rate, respiratory rate) and behavioral responses (i.e. isolation and trembling) can further assist in pain assessment (Viscardi and Turner, 2018; Hernandez-Avalos et al., 2021).
Experts applied the scale more consistently than individuals in industry or the public (ICC2) but estimated means were reliable within every group (ICC2k). While both industry and public raters scored CAS images higher than gold standards, they diverged on SHAM images, with industry rating them lower than the public. Without blinding or deception to CAS/SHAM treatment, we cannot distinguish the extent to which such differences relate to priming of respondents with the treatment type (as opposed to general differences in sensitivity). Increasing the number of images may have improved the reliability (ICC2) by reducing the influence of individual outliers, but we sought to test how well the PGS performed under less-than-ideal conditions (non-expert raters with minimal training and a limited number of images). Like experts, survey respondents provided mean PGS scores in the difficult-to-interpret intermediate range of pain expression (Viscardi et al., 2017).
SHAM PGS scores were unexpectedly high, as piglets were only handled so should not experience pain. We theorize that facial expression associated with vocalizations in response to handling may have impacted these outcomes. The developers of the PGS also theorized that exposure to livestock (animal experience) contributed to differences in scores (Viscardi and Turner, 2018), and this is supported by the difference in scores between public and industry respondents in the current study. While this suggests PGS may not be fully comparable between raters with different experience levels, the strong internal consistency means it can still be reliably used for training veterinary or industry professionals and sensitizing professionals and the public to pain in swine, helping to dispel persistent misconceptions (Steagall et al., 2021) and providing a rapid, simple and unobtrusive evaluation tool that can be more easily applied than behavioral or biomarker scales (Leach et al., 2012; Vitali et al., 2020; Schmid and Steinhoff-Wagner, 2022).
The MTMM findings provide additional validation and insight into the validity and reliability of different aspects of the PGS. Results for CF1 showed ear, cheek and eye grimace measures to be meaningfully correlated, but not very highly. Differences between images (CF2) and facial components (CF3) were both frequently significant and virtually identical in overall magnitude. However, this failure to establish divergent validity for criteria CF3 may be related to our design, where neither traits nor methods are characteristics of the rater as compared to a traditional survey MTMM, where traits of respondents are measured. Rather, in our study “traits” were the 9 scenarios, not the respondents, and “methods” were the facial features that were scored. Results for CF4 were mixed. The prominence of “eye” in nonsignificant relationships in CF4 and elsewhere (e.g. the ear-eye column in CF1) despite its strong internal consistency (high ICC for all groups) suggests that measurement differences such as the range (e.g. using a 2-point instead of 3- or 4-point subscale) may be producing weaker relationships with other scale components.
Overall, by using a more comprehensive range of measures of internal validity and reliability, our findings complement and support studies that emphasized compatibility of PGS with other indicators of pain. Additionally, by providing only brief training and including raters with a wide range of experience, this study expands the range of potential applications of PGS in less than ideal circumstances, such as training and sensitizing new veterinary and industry professionals. Differences between non-expert and expert scores may still be related to level of PGS training. The initial PGS explanation and training were designed to be short (approximately 5 minutes) to ensure respondents would complete the survey. Continuous access to the explanatory PDF was theorized to reduce the training requirement. Extensive training can improve inter- and intra-rater consistency as shown for a rat grimace scale (Zhang et al., 2019), and 30-min in-person training improved inter-rater agreement for assessors using a horse grimace scale (Dai et al., 2020). Even though training was limited in the current study, agreement between respondent groups were high, with no overall ANOVA differences. A supplemental question on respondents’ self-reported confidence levels indicated they felt ‘somewhat confident’, suggesting that respondents felt adequately trained, with industry respondents slightly more confident than public respondents. Formal training methods have not been tested for the PGS (Viscardi et al., 2017; Viscardi & Turner, 2018), and further research should elucidate the required level of training for reliable application.
Providing short videos or multiple images of the same piglet at different angles, or using methods like MTMM to pre-validate training images that perform well may be helpful in order to more accurately score grimaces. Future studies should also attempt to improve understanding of pain and consistency of ratings at moderate levels and investigate sources of inter-group differences in ratings. In improving research on swine pain treatment, applying more holistic measurement models like MTMM in studies featuring additional indicators (behavioral, biomarker, etc.) can improve understanding of inconsistent findings related to pain caused by invasive procedures, as well as treatment effectiveness.
While mixed findings may require discussions about the value of PGS as an assessment tool for pain reduction strategies, at least used in isolation, this study suggests a wider range of potential applications. These include use in veterinary training and practice to dispel misunderstandings about animal pain tolerance (Steagall et al., 2021), practice of visual recognition of pain cues, use in industry to sensitize professionals to the need for pain control, help them recognize signs of distress, and even a potential use in public education about animal welfare. Artificial intelligence and machine learning models can also help, both to improve the quality of images used in training and potentially to enable automated early identification of potential distress in large-scale farms (Steagall et al., 2021).
In conclusion, through an online survey we evaluated the impact of swine industry experience on survey participants’ ability to apply the Piglet Grimace Scale to pictures of surgically castrated and sham-handled piglets. In addition we tested multiple aspects of internal validity and reliability of the PGS, as applied by non-experts compared to experts. Survey respondents showed consistent pain expression scores, yet agreement with gold standard scores was limited. Longer, more in-depth training may be useful, especially for those who lack animal experience. Overall, we conclude that the Piglet Grimace Scale can be reliably applied in a castration context by both industry professionals and members of the public that receive limited training. However, calibration with expert scores may be needed to avoid systematic overestimation of the pain experience in recently-castrated piglets.
The raw data supporting the conclusions of this article are in the supplementary material and available at https://doi.org/10.7294/20054426. Further queries should be directed towards the corresponding author.
The studies involving human participants were reviewed and approved by The Human Research Protection Program Institutional Review Board. The patients/participants provided their written informed consent to participate in this study. The animal study was reviewed and approved by The Institutional Animal Care and Use Committee, Virginia Tech.
JN and LJ contributed to conception and design of the study. JN conducted the animal-related work. JN, LJ, and NP contributed to the design of the survey. JN and LJ organized distribution of the survey. JN, LJ, and NP collected expert score data. AV contributed to expert score data. NP performed data analysis. JN wrote the first draft of the manuscript. LJ and NP wrote sections of the manuscript. AV, LJ, and NP contributed to manuscript revision, and all authors read, and approved the submitted version.
This work was supported by the USDA National Institute of Food and Agriculture, Hatch Multistate project 1024623. The work was supported by Virginia Tech Open Access Subvention Fund for the publication fees.
The authors declare that the research was conducted in the absence of any commercial or financial relationships that could be construed as a potential conflict of interest.
All claims expressed in this article are solely those of the authors and do not necessarily represent those of their affiliated organizations, or those of the publisher, the editors and the reviewers. Any product that may be evaluated in this article, or claim that may be made by its manufacturer, is not guaranteed or endorsed by the publisher.
We would like to thank Sadie Grant and Phil Hollingshead (Virginia Tech) for assistance with animal work and Kara Crudup and Cody Howard (Virginia Tech) for assisting with data collection.
The Supplementary Material for this article can be found online at: https://www.frontiersin.org/articles/10.3389/fanim.2022.937020/full#supplementary-material
9 CFR 311.20 - Sexual Odor of Swine (2012). Available at: https://www.govinfo.gov/app/details/CFR-2012-title9-vol2/CFR-2012-title9-vol2-sec311-20 (Accessed March 17, 2022).
Alwin D. F. (2005). “Reliability,” in Encyclopedia of Social Measurement (Amsterdam, the Netherlands:Elsevier Science), 351–359. doi: 10.1016/B0-12-369398-5/00383-2
Alwin D. F. (2007). Margins of Error: A Study of Reliability in Survey Measurement (Wiley, New Jersey, United States:Wiley-Interscience).
AVMA (2013). Literature Review on the Welfare Implications of Swine Castration (Avma), 1–5. Available at: https://www.avma.org/KB/Resources/LiteratureReviews/Documents/swine_castration_bgnd.pdf.
AVMA (2020) Swine Castration (Illinois, USA:American Veterinary Medical Association). Available at: https://www.avma.org/resources-tools/avma-policies/swine-castration (Accessed January 16, 2022). AVMA Policies.
Bañón S., Andreu C., Laencina J., Garrido M. D. (2004). Fresh and Eating Pork Quality From Entire Versus Castrate Heavy Males. Food Quality and Preference Food Quality and Preference, 15, 293–300. doi: 10.1016/S0950-3293(03)00069-7
Barletta M., Young C. N., Quandt J. E., Hofmeister E. H. (2016). Agreement Between Veterinary Students and Anesthesiologists Regarding Postoperative Pain Assessment in Dogs. Vet. Anaesth. Analg. 43, 91–98. doi: 10.1111/vaa.12269
Campbell D. T., Fiske D. W. (1959). Convergent and Discriminant Validation by the Multitrait-Multimethod Matrix. psychol. Bull. 56, 81–105. doi: 10.1037/H0046016
Cronbach L. J. (1951). Coefficient Alpha and the Internal Structure of Tests. Psychometrika 16, 297–334. doi: 10.1007/BF02310555
Dai F., Leach M., Macrae A. M., Minero M., Costa E. D. (2020). Does Thirty-Minute Standardised Training Improve the Inter-Observer Reliability of the Horse Grimace Scale (HGS)? A Case Study. Animals 10, 781. doi: 10.3390/ani10050781
Di Giminiani P., Brierley V. L. M. H., Scollo A., Gottardo F., Malcolm E. M., Edwards S. A., et al. (2016). The Assessment of Facial Expressions in Piglets Undergoing Tail Docking and Castration: Toward the Development of the Piglet Grimace Scale. Front. Vet. Sci. 3. doi: 10.3389/fvets.2016.00100
European Union (2016) European Declaration on Alternatives to Surgical Castration of Pigs. Available at: https://ec.europa.eu/food/system/files/2016-10/aw_prac_farm_pigs_cast-alt_declaration_en.pdf (Accessed October 1, 2021).
Gordon M., Lumley T. (2021). Forestplot: Advanced Forest Plot Using 'grid' Graphics. version 2.0.1 https://CRAN.R-project.org/package=forestplot.
Hay M., Vulin A., Génin S., Sales P., Prunier A. (2003). Assessment of Pain Induced by Castration in Piglets: Behavioral and Physiological Responses Over the Subsequent 5 Days. Appl. Anim. Behav. Sci. 82, 201–218. doi: 10.1016/S0168-1591(03)00059-5
Hernández-Avalos I., Mota-Rojas D., Mendoza-Flores J. E., Casas-Alvarado A., Flores-Padilla K., Miranda-Cortes A. E., et al. (2021). Nociceptive Pain and Anxiety in Equines: Physiological and Behavioral Alterations. Vet. World 14 (11), 2984–2995. doi: 10.14202/Vetworld.2021.2984-2995
Howell D. (2018). “Intraclass Correlation,” in Multiple Approaches. Available at: https://www.uvm.edu/~statdhtx/StatPages/icc/icc-overall.html.
Ison S. H., Eddie Clutton R., Di Giminiani P., Rutherford K. M. D. (2016). A Review of Pain Assessment in Pigs. Front. Vet. Sci. 3. doi: 10.3389/fvets.2016.00108
Keenan D. F. (2016). Pork Meat Quality, Production and Processing on. Keenan, D. F. (2016). Pork Meat Quality, Production and Processing on Encyclopedia of Food and Health . (Oxford, UK:Academic Press). 419–431
Kluivers-Poodt M., Zonderland J. J., Verbraak J., Lambooij E., Hellebrekers L. J. (2013). Pain Behaviour After Castration of Piglets; Effect of Pain Relief With Lidocaine and/or Meloxicam. Animal 7 (7), 1158–1162. doi: 10.1017/S1751731113000086
Koo T. K., Li M. Y. (2016). A Guideline of Selecting and Reporting Intraclass Correlation Coefficients for Reliability Research. J. Chiropr Med. 15, 155–163. doi: 10.1016/J.JCM.2016.02.012
Leach M. C., Klaus K., Miller A. L., Scotto Di Perrotolo M., Sotocinal S. G., Flecknell P. A. (2012). The Assessment of Post-Vasectomy Pain in Mice Using Behaviour and the Mouse Grimace Scale. PloS One 7, 4. doi: 10.1371/journal.pone.0035656
Liu M., Wronski L. (2017). Examining Completion Rates in Web Surveys via Over 25,000 Real-World Surveys. Soc. Sci. Comput. Rev. 36, 116–124. doi: 10.1177/0894439317695581
Mich P. M., Hellyer P. W. (2008). ““Objective, Categoric Methods for Assessing Pain and Analgesia”,” in Handbook of Veterinary Pain Management, 2nd ed. Eds. Gaynor J. S., Muir W. W. (St. Louis, MO: Mosby), 78–109.
Miller A. L., Leach M. C. (2015). The Mouse Grimace Scale: A Clinically Useful Tool? PLo 10 (9). doi: 10.1371/journal.pone.0136000
Mota-Rojas D., Orihuela A., Martínez-Burnes J., Gómez J., Mora-Medina P., Alavez B., et al. (2020). Neurological Modulation of Facial Expressions in Pigs and Implications for Production. J. Anim. Behav. Biometeorol. 8 (4), 232–243. doi: 10.31893/jabb.20031
NASS (2016) U.S. Hog Industry 1994-2014. In: NASS Highlights. Available at: https://www.nass.usda.gov/Publications/Highlights/2016/HogIndustryHighlights_No2016-1.pdf (Accessed November 10, 2021).
Neary J., Jacobs L., Porter N. (2022). Replication Data for Neary et al 2022 - Recognizing post-castration pain in piglets. (University Libraries:Virginia Tech. Dataset). doi: 10.7294/20054426
Prusa K., Nederveld H., Runnels P. L., Li R., King V. L., Crane J. P. (2011). Prevalence and Relationships of Sensory Taint, 5α-Androstenone and Skatole in Fat and Lean Tissue From the Loin (Longissimus Dorsi) of Barrows, Gilts, Sows, and Boars From Selected Abattoirs in the United States. Meat Sci. 88 (1), 96–101. doi: 10.1016/J.MEATSCI.2010.12.008
Rault J. L., Lay D. C., Marchant-Forde J. M. (2011). Castration Induced Pain in Pigs and Other Livestock. Appl. Anim. Behav. Sci. 135 (3), 214–225. doi: 10.1016/j.applanim.2011.10.017
R Core Team (2021) R: A language and environment for statistical computing. ( Vienna, Austria:R Foundation for Statistical Computing). Version 4.1.2. Available at: https://www.R-project.org/.
Revelle W. (2021). psych: Procedures for Psychological, Psychometric, and Personality Research. (Evanston, Illinois:Northwestern University). version 2.1.9 https://CRAN.R-project.org/package=psych.
Revelle W. (2022)Psych: Procedures for Psychological, Psychometric, and Personality Research. In: R Package Version 2.2.3. Available at: https://CRAN.R-project.org/package=psych (Accessed April 13, 2022).
Rydhmer L., Zamaratskaia G., Andersson H. K., Algers B., Guillemet R., Lundström K. (2006). Aggressive and Sexual Behaviour of Growing and Finishing Pigs Reared in Groups, Without Castration. Acta Agricult. Scand. A 56 (2), 109–119. doi: 10.1080/09064700601079527
Schmid S. M., Steinhoff-Wagner J. (2022). Impact of Routine Management Procedures on the Welfare of Suckling Piglets. Veterinary Sciences. Veterinary Sciences. 9, 32 doi: 10.3390/vetsci9010032
Steagall P. V., Bustamante H., Johnson C. B., Turner P. V. (2021). Pain Management in Farm Animals: Focus on Cattle, Sheep and Pigs. Animals 11, 1–17. doi: 10.3390/ani11061483
United States Census Bureau (2019) Census - Table Results. Available at: https://data.census.gov/cedsci/table?q=United%20States&tid=ACSST1Y2019.S0101 (Accessed January 16, 2022).
Viscardi A. V., Hunniford M., Lawlis P., Leach M., Turner P. V. (2017). Development of a Piglet Grimace Scale to Evaluate Piglet Pain Using Facial Expressions Following Castration and Tail Docking: A Pilot Study. Front. Vet. Sci. 4. doi: 10.3389/fvets.2017.00051
Viscardi A. V., Turner P. V. (2018). Use of Meloxicam or Ketoprofen for Piglet Pain Control Following Surgical Castration Front. Vet. Sci. 5. doi: 10.3389/fvets.2018.00299
Vitali M., Santacroce E., Correa F., Salvarani C., Maramotti F. P., Padalino B., et al. (2020). On-Farm Welfare Assessment Protocol for Suckling Piglets: A Pilot Study. Animals 10, 1016. doi: 10.3390/ani10061016
Vullo C., Barbieri S., Catone G., Graïc J.-M., Magaletti M., di Rosa A., et al. (2020). Is the Piglet Grimace Scale (PGS) a Useful Welfare Indicator to Assess Pain After Cryptorchidectomy in Growing Pigs? Animals 10, 412. doi: 10.3390/ani10030412
Keywords: animal welfare, castration, piglet, pain assessment, questionnaire
Citation: Neary JM, Porter ND, Viscardi AV and Jacobs L (2022) Recognizing Post-Castration Pain in Piglets: A Survey of Swine Industry Stakeholders and the General Public. Front. Anim. Sci. 3:937020. doi: 10.3389/fanim.2022.937020
Received: 05 May 2022; Accepted: 01 June 2022;
Published: 22 July 2022.
Edited by:
Maria José Hötzel, Federal University of Santa Catarina, BrazilReviewed by:
Daniel Mota-Rojas, Metropolitan Autonomous University, MexicoCopyright © 2022 Neary, Porter, Viscardi and Jacobs. This is an open-access article distributed under the terms of the Creative Commons Attribution License (CC BY). The use, distribution or reproduction in other forums is permitted, provided the original author(s) and the copyright owner(s) are credited and that the original publication in this journal is cited, in accordance with accepted academic practice. No use, distribution or reproduction is permitted which does not comply with these terms.
*Correspondence: Leonie Jacobs, amFjb2JzbEB2dC5lZHU=
Disclaimer: All claims expressed in this article are solely those of the authors and do not necessarily represent those of their affiliated organizations, or those of the publisher, the editors and the reviewers. Any product that may be evaluated in this article or claim that may be made by its manufacturer is not guaranteed or endorsed by the publisher.
Research integrity at Frontiers
Learn more about the work of our research integrity team to safeguard the quality of each article we publish.