 Maciej Oczak
 Florian Bayer2
 Sebastian G. Vetter
 Johannes Baumgartner
- 1Precision Livestock Farming Hub, The University of Veterinary Medicine Vienna (Vetmeduni Vienna), Vienna, Austria
- 2Institute of Animal Welfare Science, The University of Veterinary Medicine Vienna (Vetmeduni Vienna), Vienna, Austria
- 3Veterinary Public Health and Epidemiology, The University of Veterinary Medicine Vienna (Vetmeduni Vienna), Vienna, Austria
- 4Austrian Competence Centre for Feed and Food Quality, Safety and Innovation, FFoQSI GmbH, Tulln, Austria
Access to nest-building material in the preparturient period is beneficial for sows’ welfare. However, on slatted floors, long-stem forage can drop into the slurry and block the drainage system. As a compromise considering the needs of sows for access to adequate nest-building material, farrowing pens with slatted floors are equipped with dispensers (racks) accessible by sows. In this study, we developed a computer vision method to monitor the use of the racks with nest-building material. In total, 12 sows were included in the experiment from 5 days before farrowing to the end of farrowing. Hay rack use behaviors were labeled for all the sows, i.e., pulling hay, nose close to the rack, exploratory behavior, and bar biting. The object detection algorithm RetinaNet was used to extract centroids of parts of the sow’s body and the hay rack. Several feature variables were estimated from the centroids of detected parts of the sow’s body, and random forest was used for the classification of hay rack use behaviors. The model for the detection of pulling hay behavior had the best performance: 83.5% sensitivity, 98.7% specificity, and 98.6% accuracy. The distance between the sows’ nose and the hay rack was the most important feature variable, which indicated the importance of nose location for the recognition of behaviors in which pigs interact with other objects. The developed models could be applied for automated monitoring of the use of nest-building material in preparturient sows. Such monitoring might be especially important in sows housed on slatted floors.
1 Introduction
Access to roughage in confined pigs is widely considered to be beneficial for the welfare of animals (Müller, 1979; Vanputten, 1980). Straw is the most studied rooting material for pigs, and the effect of other studied materials is very often compared with the effect of straw (Studnitz et al., 2007). For sows housed on a concrete floor, straw serves as bedding that improves the thermal and physical comfort of the floor (Fraser, 1975). Preparturient sows prefer a bedded area for farrowing (Arey et al., 1991). Provision of straw for preparturient sows resulted in more nest-building behaviors (Burne et al., 2000) and additionally increased the response to piglet screams 1 to 3 days postpartum (Herskin et al., 1998).
Just like straw, (lucerne) hay has been shown to increase nest building and reduce stereotypical behavior prior to farrowing (Edwards et al., 2019). Compared to straw, good-quality hay might provide additional nutritional benefits for lactating sows, including higher metabolizable energy and crude protein levels (Kamphues, 2004) as well as a high content of secondary plant substances (Ziolkowska et al., 2020), contributing to pigs’ health. Hay might also be preferred as enrichment material over straw by young piglets as it is softer and therefore easier to chew.
One disadvantage farmers might face when applying roughage as enrichment material is that on slatted floors long-stem forage can drop into the slurry and block the drainage system. To provide access for the animals to adequate nest-building material, farrowing pens with slatted floors can be equipped with straw dispensers (racks) accessible by sows (Oczak et al., 2015). This allows sows to gather small amounts of roughage from dispensers to perform nest-building behavior (Arey et al., 1991) with a lower risk of blocking the slurry drainage system compared to pens with straw bedding. The risk of application of such dispensers in practical farm conditions is that they are resupplied with a standard amount of roughage by farm staff on a daily basis according to the appropriate regulations, e.g., defined by the Austrian Tierhaltungsverordnung (BMG, 2012), but without consideration for the individual needs of the sow, which might vary between animals (Widowski and Curtis, 1990; Maschat et al., 2020).
Precision livestock farming (PLF) technology can be used for the surveillance and monitoring at the level of the individual animal, pen, farm, region, or country. Thus, PLF is currently regarded as the heart of the engineering endeavor toward sustainability in livestock-related food production. Its application allows making optimal use of knowledge and information in the monitoring and control of processes with livestock (Berckmans and Guarino, 2008). Application of PLF technology for automated monitoring of individual use of roughage in a farrowing pen might offer a possibility to improve individual care in preparturient sows by supporting the decision of farm staff on when to resupply the dispensers with nest-building material. Additionally, our hypothesis is that automated monitoring of rack use by sows might improve the performance of models for farrowing prediction, which are based only on the general activity level of animals. This might be especially relevant for improving sow welfare in farrowing systems designed for temporary sow confinement in crates (Oczak et al., 2019).
Object detection is an important computer vision task that deals with detecting instances of visual objects of a certain class (such as humans, animals, or cars) in digital images. In recent years, we can observe an unprecedented progress in object detection with wide adoption of these methods in real-world applications such as autonomous driving, robot vision, and video surveillance (Zou et al., 2019). The object detection model RetinaNet was applied as a PLF technique for the recognition of different body parts of preparturient sows and for the estimation of sows’ activity level, which resulted in high agreement with gold-standard and accelerometer-based estimation (Oczak et al., 2022). In this study, we aimed to develop a computer vision algorithm based on an object detection model for monitoring the use of the dispenser with nest-building material in preparturient sows. The second objective was to analyze if the output of this algorithm could potentially improve the performance of farrowing prediction compared to current state-of-the-art techniques for farrowing prediction based solely on activity levels (Manteuffel et al., 2015; Pastell et al., 2016; Traulsen et al., 2018; Oczak et al., 2019).
2 Materials and methods
2.1 Ethical statement
Project PIGwatch was authorized by the Ethical Committee of the Austrian Federal Ministry of Science, Research and Economy and by the Ethical Committee of Vetmeduni Vienna (GZ: BMWFV-68.205/0082-WF/II/3b/2014) according to the Austrian Tierversuchsgesetz 2012, BGBl. I Nr. 114/2012.
2.2 Experimental setup
2.2.1 Animals and housing
The experiment was conducted between June 2014 and March 2016 at the pig research and teaching farm (VetFarm) of the University of Veterinary Medicine Vienna, Vienna, Austria. In total, 12 sows from two genetic lines were included in the experiment: Austrian Large White sows and Landrace × Large White crossbreds. Animals were included in the experiment from 5 days before farrowing to the end of farrowing. These sows were housed in two types of farrowing pens, which offered the option of either keeping the sows free or confined in a farrowing crate. Sows were housed in two types of farrowing pens to increase the variability of housing conditions. This should have increased the robustness of any algorithms developed on collected datasets. Out of the 12 sows, six were kept in sow welfare and piglet protection (SWAP) pens (Jyden Bur A/S, Vemb, Denmark) and six in trapezoid pens (Schauer Agrotronic GmbH, Prambachkirchen, Austria). None of the animals included in the experiment were confined in a farrowing crate from the introduction to the farrowing pen until 24 h after the end of farrowing. Some of the animals were confined in crates after the experimental period when farrowing was already finished.
The SWAP pen had an area of 6.0 m2 with a solid concrete floor in the front (lying area) and a slatted cast iron floor in the back (defecation area). The pen had two troughs: one accessible by the sow when the crate was opened and a second one accessible by the sow when the crate was closed (Figure 1A). The trapezoid pens had an area of 5.5 m2. The pens had plastic flooring in the creep area and solid concrete flooring in the sow lying area in front of the trough (Figure 1B). In both pen types, a rack with nest-building material hay was mounted in the front area of the pen, in close proximity to the trough.
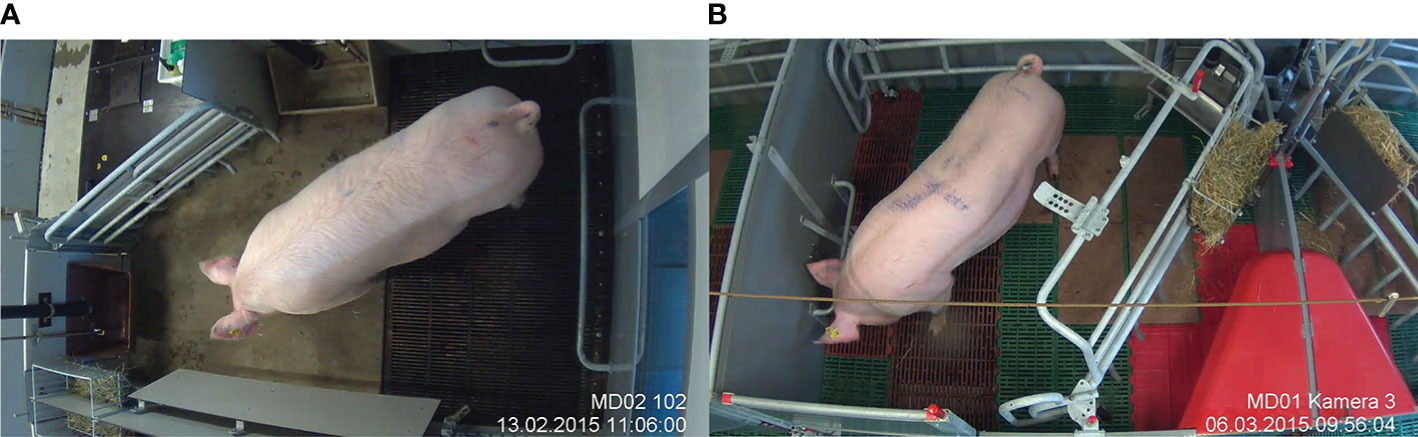
Figure 1 Farrowing pens with the possibility of temporary crating. (A) SWAP pen. (B) trapezoid pen.
The sows were introduced to the farrowing pens approximately 5 days before the expected date of farrowing. The date was derived from the average gestation length of sows at VetFarm, which was 114 days. The experimental period was from the introduction of the sow to the farrowing room until the end of farrowing. The experimental pens were located in a testing unit of the VetFarm, an isolated building with an automatic ventilation system. The average temperature in the room was 22°C. The sows were fed from 1.25 to 3.3 kg of wet feed daily. They were fed twice a day during the experimental period. Water was provided permanently in the troughs via a nipple drinker or an automatic water-level system. To fulfill the need for adequate material to explore and for nest building, sows were offered hay in the aforementioned rack throughout their stay in the pens. Farm staff checked the racks twice a day and half-filled the racks in the morning or whenever the racks were empty.
2.2.2 Video recording
The behavior of the sows was video-recorded continuously from introduction to the farrowing pens until 24 h postpartum with 2D cameras in order to create a dataset that could be labeled. Each pen was equipped with one IP camera (GV-BX 1300-KV, Geovision, Taipei, Taiwan) locked in protective housing (HEB32K1, Videotec, Schio, Italy) hanging 3 m above the pen, giving an overhead view. Additionally, infrared spotlights (IR-LED294S-90, Microlight, Bad Nauheim, Germany) were installed in order to allow night recording. The videos were recorded with 1,280 × 720 pixel resolution, in MPEG-4 format, at 30 fps.
The cameras were connected to a PC on which a Multicam Surveillance System (8.5.6.0, Geovision, Taipei, Taiwan) was installed. The system allowed simultaneous recording of videos from nine cameras. Thus, not all 12 sows included in the experiment were recorded simultaneously. The PC had an Intel i5-3330 processor, 3 GHz (Intel, Santa Clara, USA) with 4 GB of physical memory. The operating system was Microsoft Windows 7 Professional (Redmond, USA). Recordings were stored on exchangeable, external 2 and 3 TB hard drives.
2.3 Dataset
The dataset composed of video material was divided into two subsets: the first for training and the second for validation of the computer vision algorithm for the classification of hay rack use. The subset for training consisted of the same number of animals (n = 6) as the subset for validation (n = 6) of the algorithm. The animals in both subsets were equally distributed between SWAP and trapezoid pens. Comparison of statistical measures of the effectiveness of the algorithm on the training and validation sets enables one to draw conclusions on how well the algorithm could work on other independent datasets. We decided to include both types of pens in the training and validation sets to increase the robustness of developed models to new unseen environments.
2.4 Data labeling
Videos of sow behavior were manually labeled in order to create a reference dataset. In the first step of the labeling process, the time of the onset of farrowing of each individual sow (n = 12) was labeled. The onset of farrowing was defined as the point in time when the body of the first piglet born dropped on the floor. The time of birth of the last piglet indicated the end of farrowing. The labeling software Interact (versions 9 and 14, Mangold International GmbH, Arnstorf, Germany) was used to label the beginning and end of farrowing on recorded videos.
The reference for the automated estimation of hay rack use by sows was based on the manual labeling of four behaviors by one trained labeler. These behaviors were pulling hay, nose close to the rack, exploratory behavior, and bar biting (for definitions, see Table 1). Hay rack use behaviors were labeled for all sows (n = 12) included in the experiment. Behaviors were labeled continuously from the introduction of the sow to the farrowing pen until 24 h after farrowing. The start and end of each behavior were labeled in this period for each sow. The labeling software Boris (version 7.9.15, Torino, Italy) was used to label gold standard for the estimation of hay rack use by sows.
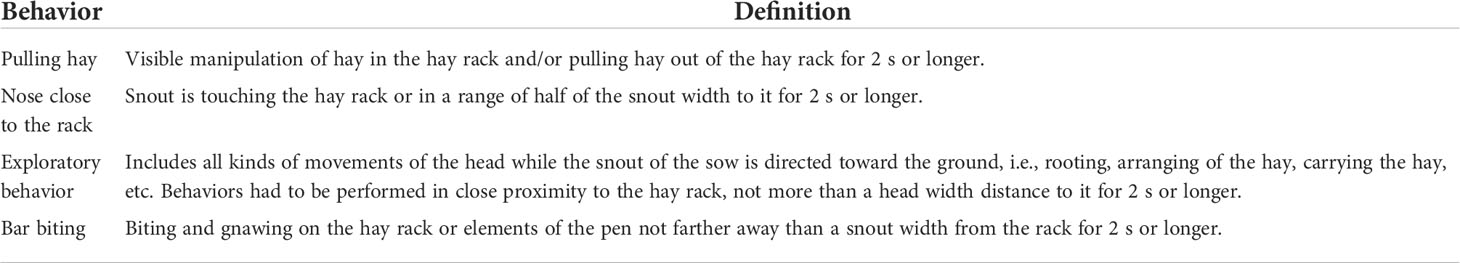
Table 1 Definitions of hay rack use behaviors.
The labeled dataset was divided to train two algorithms for computer vision-based detection of hay rack use. The first algorithm was trained on a reference dataset in which the occurrence of any of four labeled hay rack use behaviors indicated that the sow was using the rack. The second algorithm was trained on a reference dataset in which only pulling hay behavior was interpreted as hay rack use behavior, while all the other labeled behaviors were interpreted as non-hay rack use. We compared the performance of both algorithms to verify our hypothesis that pulling hay behavior is easier to distinguish visually for the labeler and automatically by computer vision techniques than the other hay rack use behaviors. Thus, we expected that the performance of the computer vision algorithm trained on labeled pulling hay behavior will be better than that of the algorithm trained on all four labeled behaviors.
2.5 RetinaNet object detection model
Pytorch implementation of the RetinaNet object detection algorithm (source code available at https://github.com/yhenon/pytorch-retinanet) was used for the task of detecting parts of the body of sows such as the left ear, right ear, head, and whole body and also the hay rack in the farrowing pen (Lin et al., 2017). The process of training and validation of this algorithm for the detection of sow body parts and the hay racks in the farrowing pens was described in Oczak et al. (2022). Originally recorded video data were downsampled from 30 to 5 fps to increase the speed of training and inference with the RetinaNet model. For the use of the algorithm in this analysis, we trained the algorithm presented in Oczak et al. (2022) with the same 9,971 labeled images. The dataset with images used in Oczak et al. (2022) was updated with labeling of the noses of sows. The Computer Vision Annotation Tool (CVAT) was used to label the frames.
The performance of RetinaNet for the detection of the left ear, right ear, head, and whole body of sows and the hay rack that was already presented in Oczak et al. (2022) was updated with the performance of the detection of noses of sows: 0.21 mAP at 0.5:0.95, 0.27 mAP at 0.5, and 0.2 mAP at 0.75.
RetinaNet models were trained on a workstation with two CPUs: Intel Xeon Gold 6226 (total 24 cores) 256 GB memory and NVIDIA Titan RTX GPU 24 GB GDDR6. It was possible to train the models with 3.5 fps on the Titan RTX GPU installed on the workstation. Thus, training of the RetinaNet model on 9,971 frames for 90 epochs took approximately 3 days.
Additionally, the activity level of every sow was estimated based on the Euclidean distance between centroids of sow bodies on consecutive frames as described in Oczak et al. (2022).
2.6 Algorithm for the classification of hay rack use
2.6.1 Feature variables
The output of the RetinaNet algorithm—rectangles corresponding to the parts of the body of a sow and a hay rack—was further processed by extracting their centroids (Figure 2).
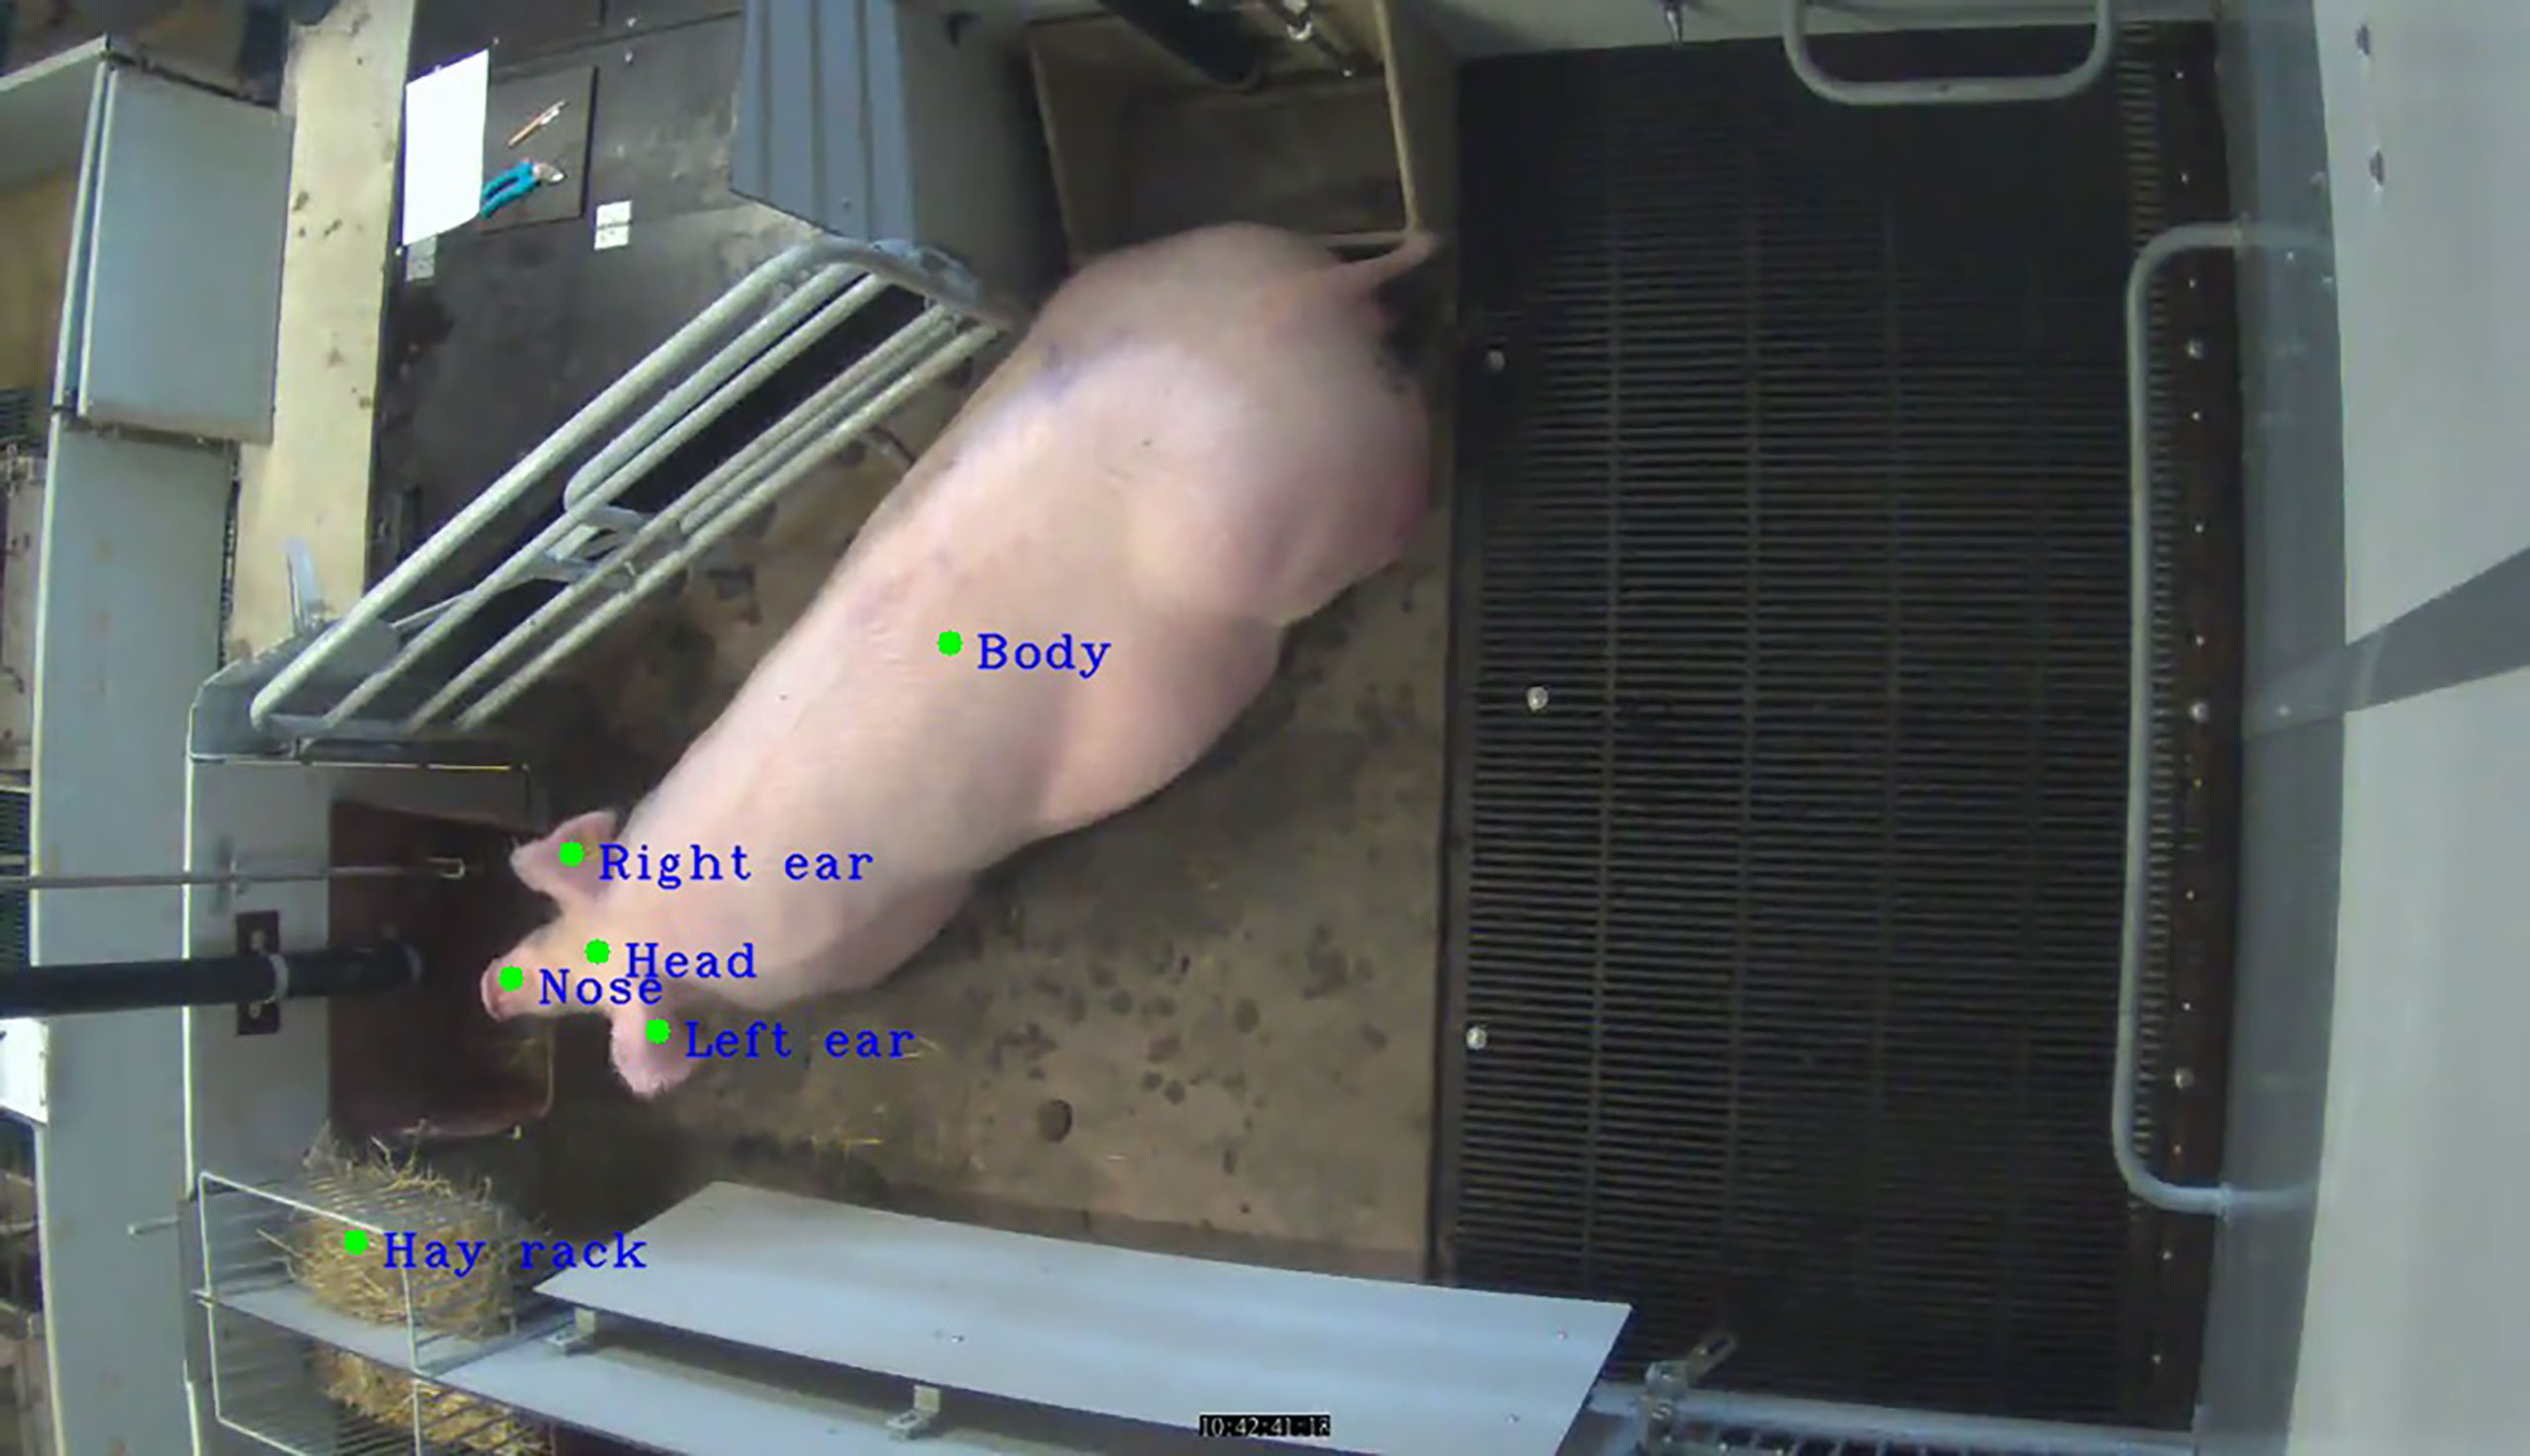
Figure 2 Output of the RetinaNet algorithm; centroids extracted from parts of the body of a sow and a hay rack.
In the following steps, centroids of rectangles were used as the basis for the calculation of 40 feature variables, which were further used for the training of a random forest (RF) model for the classification of hay rack use. The first feature variable was calculated as the Euclidean distance between the sow’s head and the hay rack (Figure 3),
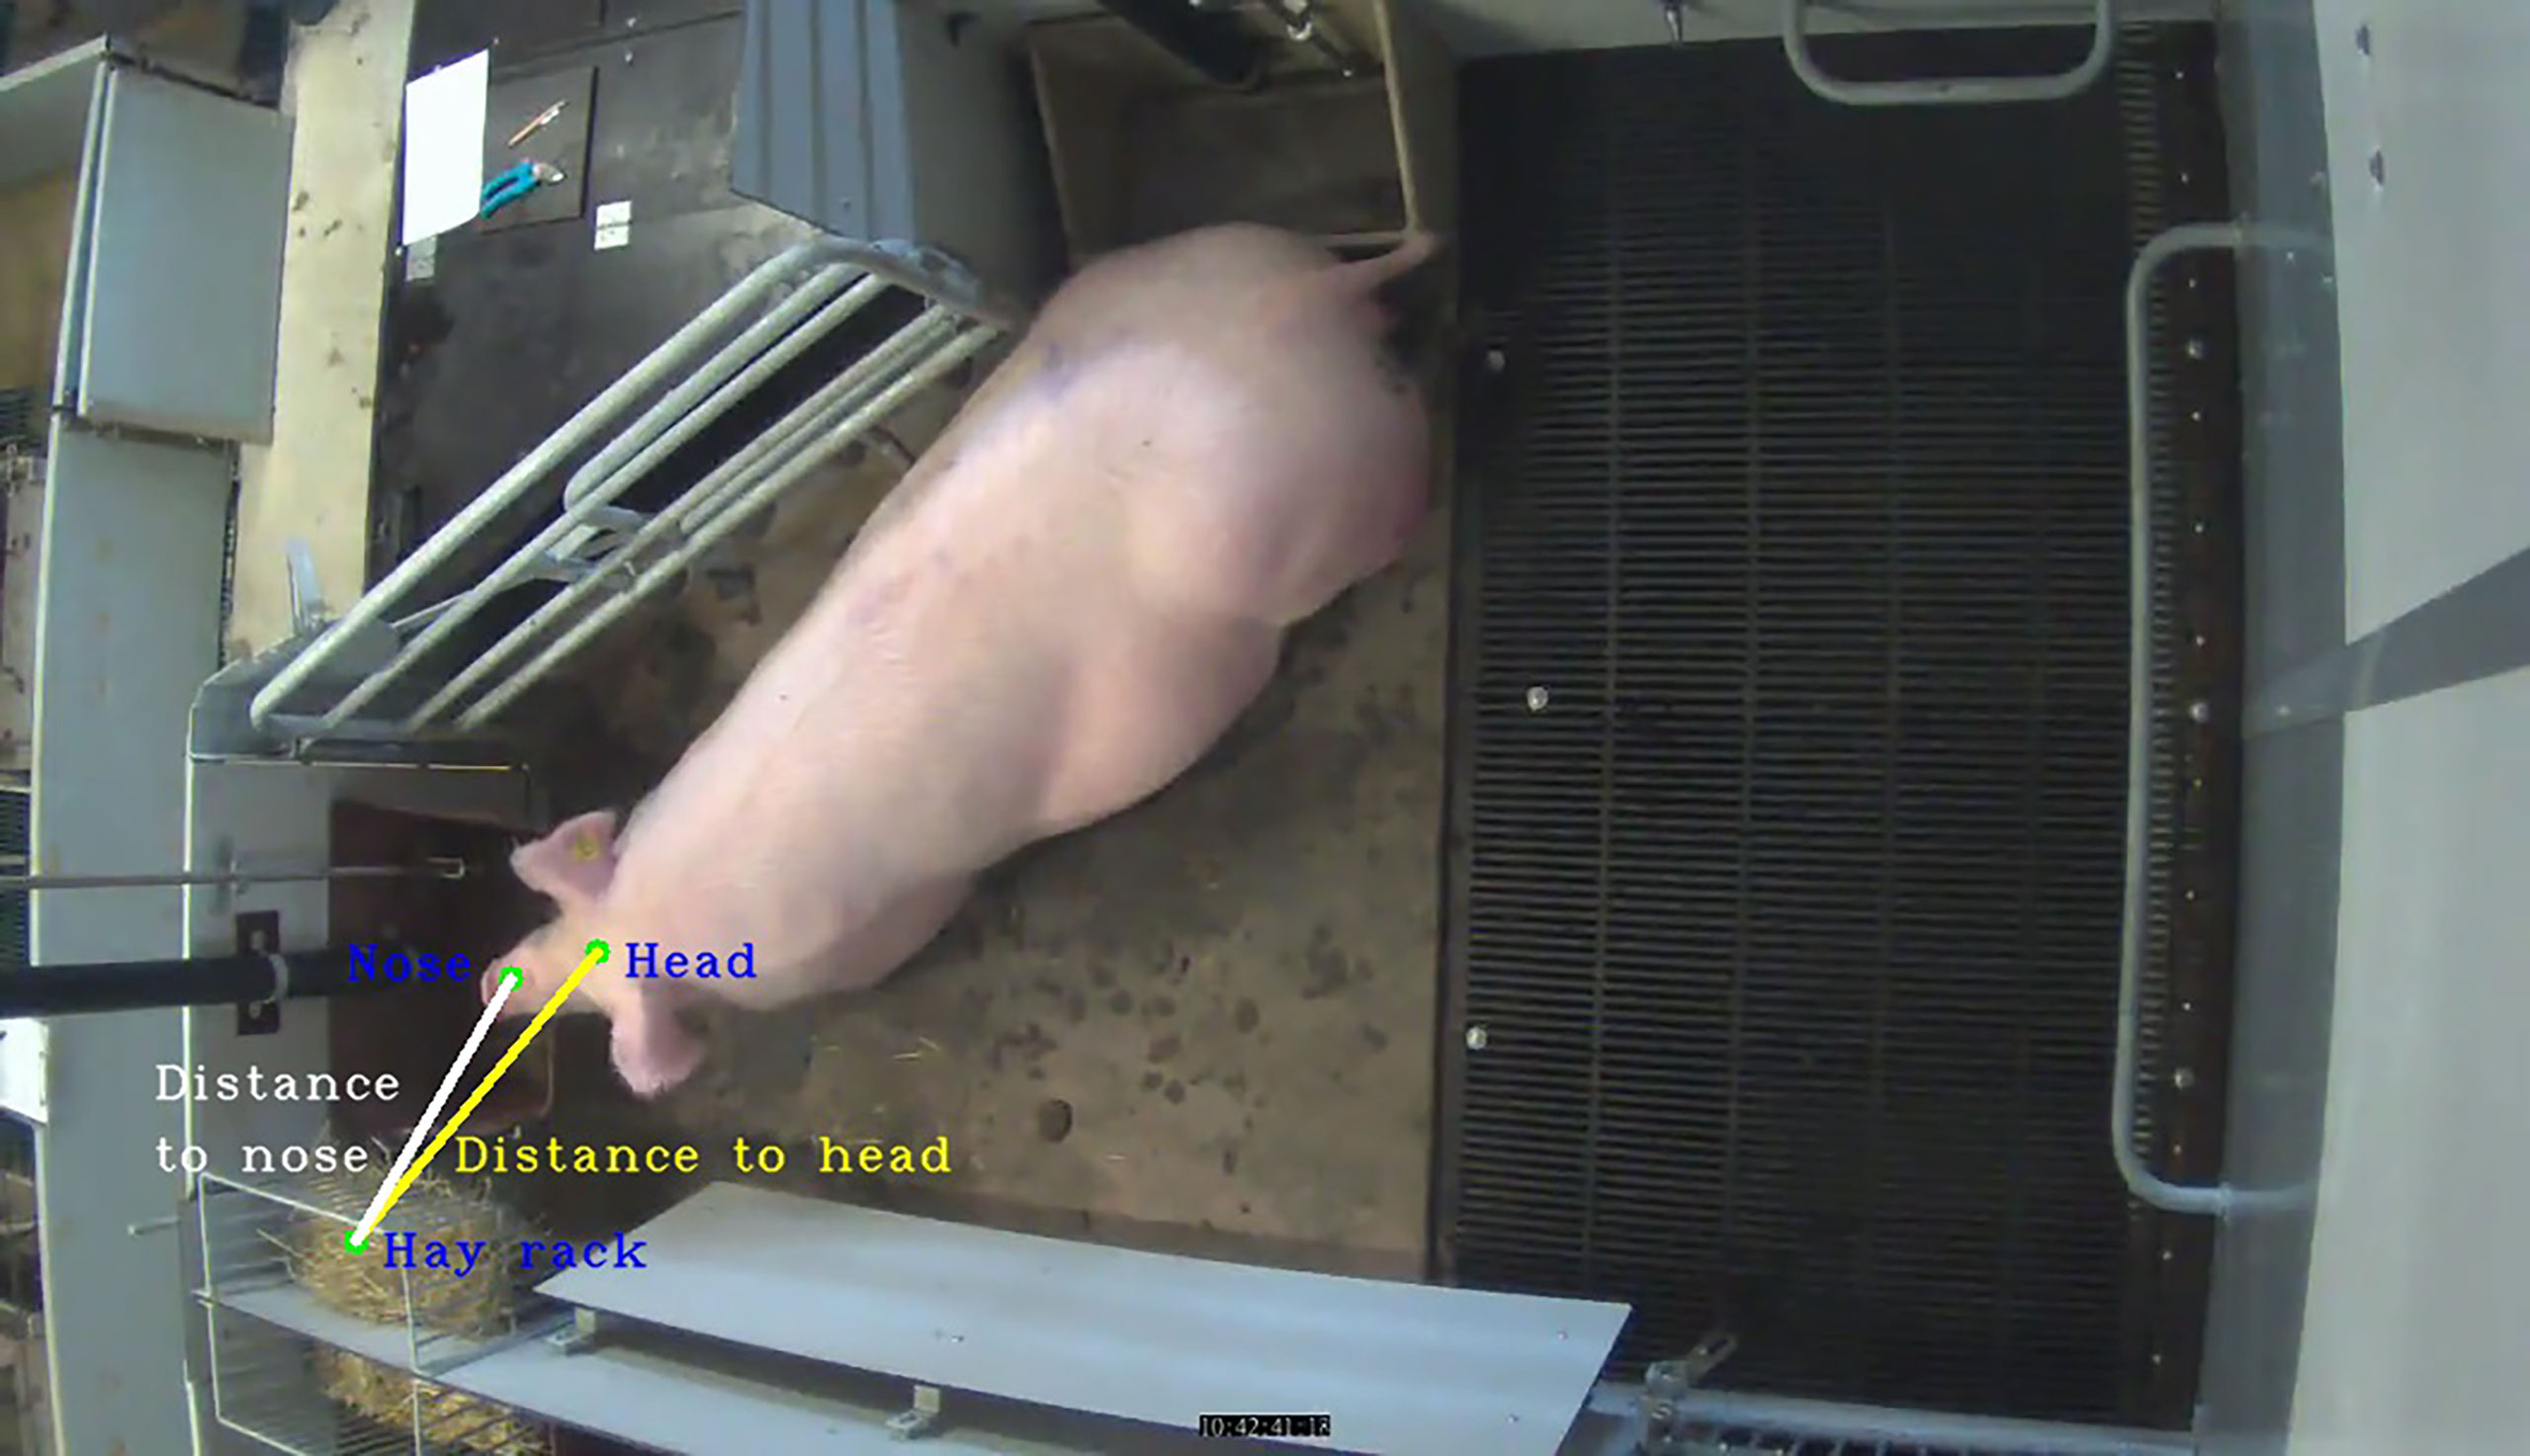
Figure 3 Distance from nose to rack and from head to rack.
where d(r, h) is the distance between points r and h. Point r has Cartesian coordinates (rx, ry) and point h has Cartesian coordinates (hx, hy). Point h is the centroid of the sow’s head, while point r is the centroid of the hay rack (Figure 3). The second feature variable was calculated as the Euclidean distance between the centroid of the sow’s nose and the centroid of the hay rack according to Eq. 1 (Figure 3).
The next calculated feature variable was the orientation of the sow toward the hay rack based on a line perpendicular to the line joining the centroids of both ears. This feature variable was calculated in three steps. In the first step, the Cartesian coordinates (ax, ay) and (bx, by) designating a perpendicular line between centroids of both ears were calculated according to Eqs. 2–5,
where (lx, ly) are Cartesian coordinates of the centroid of the left ear and (tx, ty) are Cartesian coordinates of the centroid of the right ear. Variable q is a length of the perpendicular line, which had a length of a diameter of an image, 1,252 pixels.
In the second step, we calculated the Cartesian coordinates (cx, cy) of a point on a line perpendicular to the line between the ears of the sow according to Eqs. 6 and 7,
where (rx, ry) are Cartesian coordinates of the centroid of the hay rack. Point c indicates a point on a line perpendicular to the line between the ears of the sow, which is the closest to the centroid of the hay rack (Figure 4).
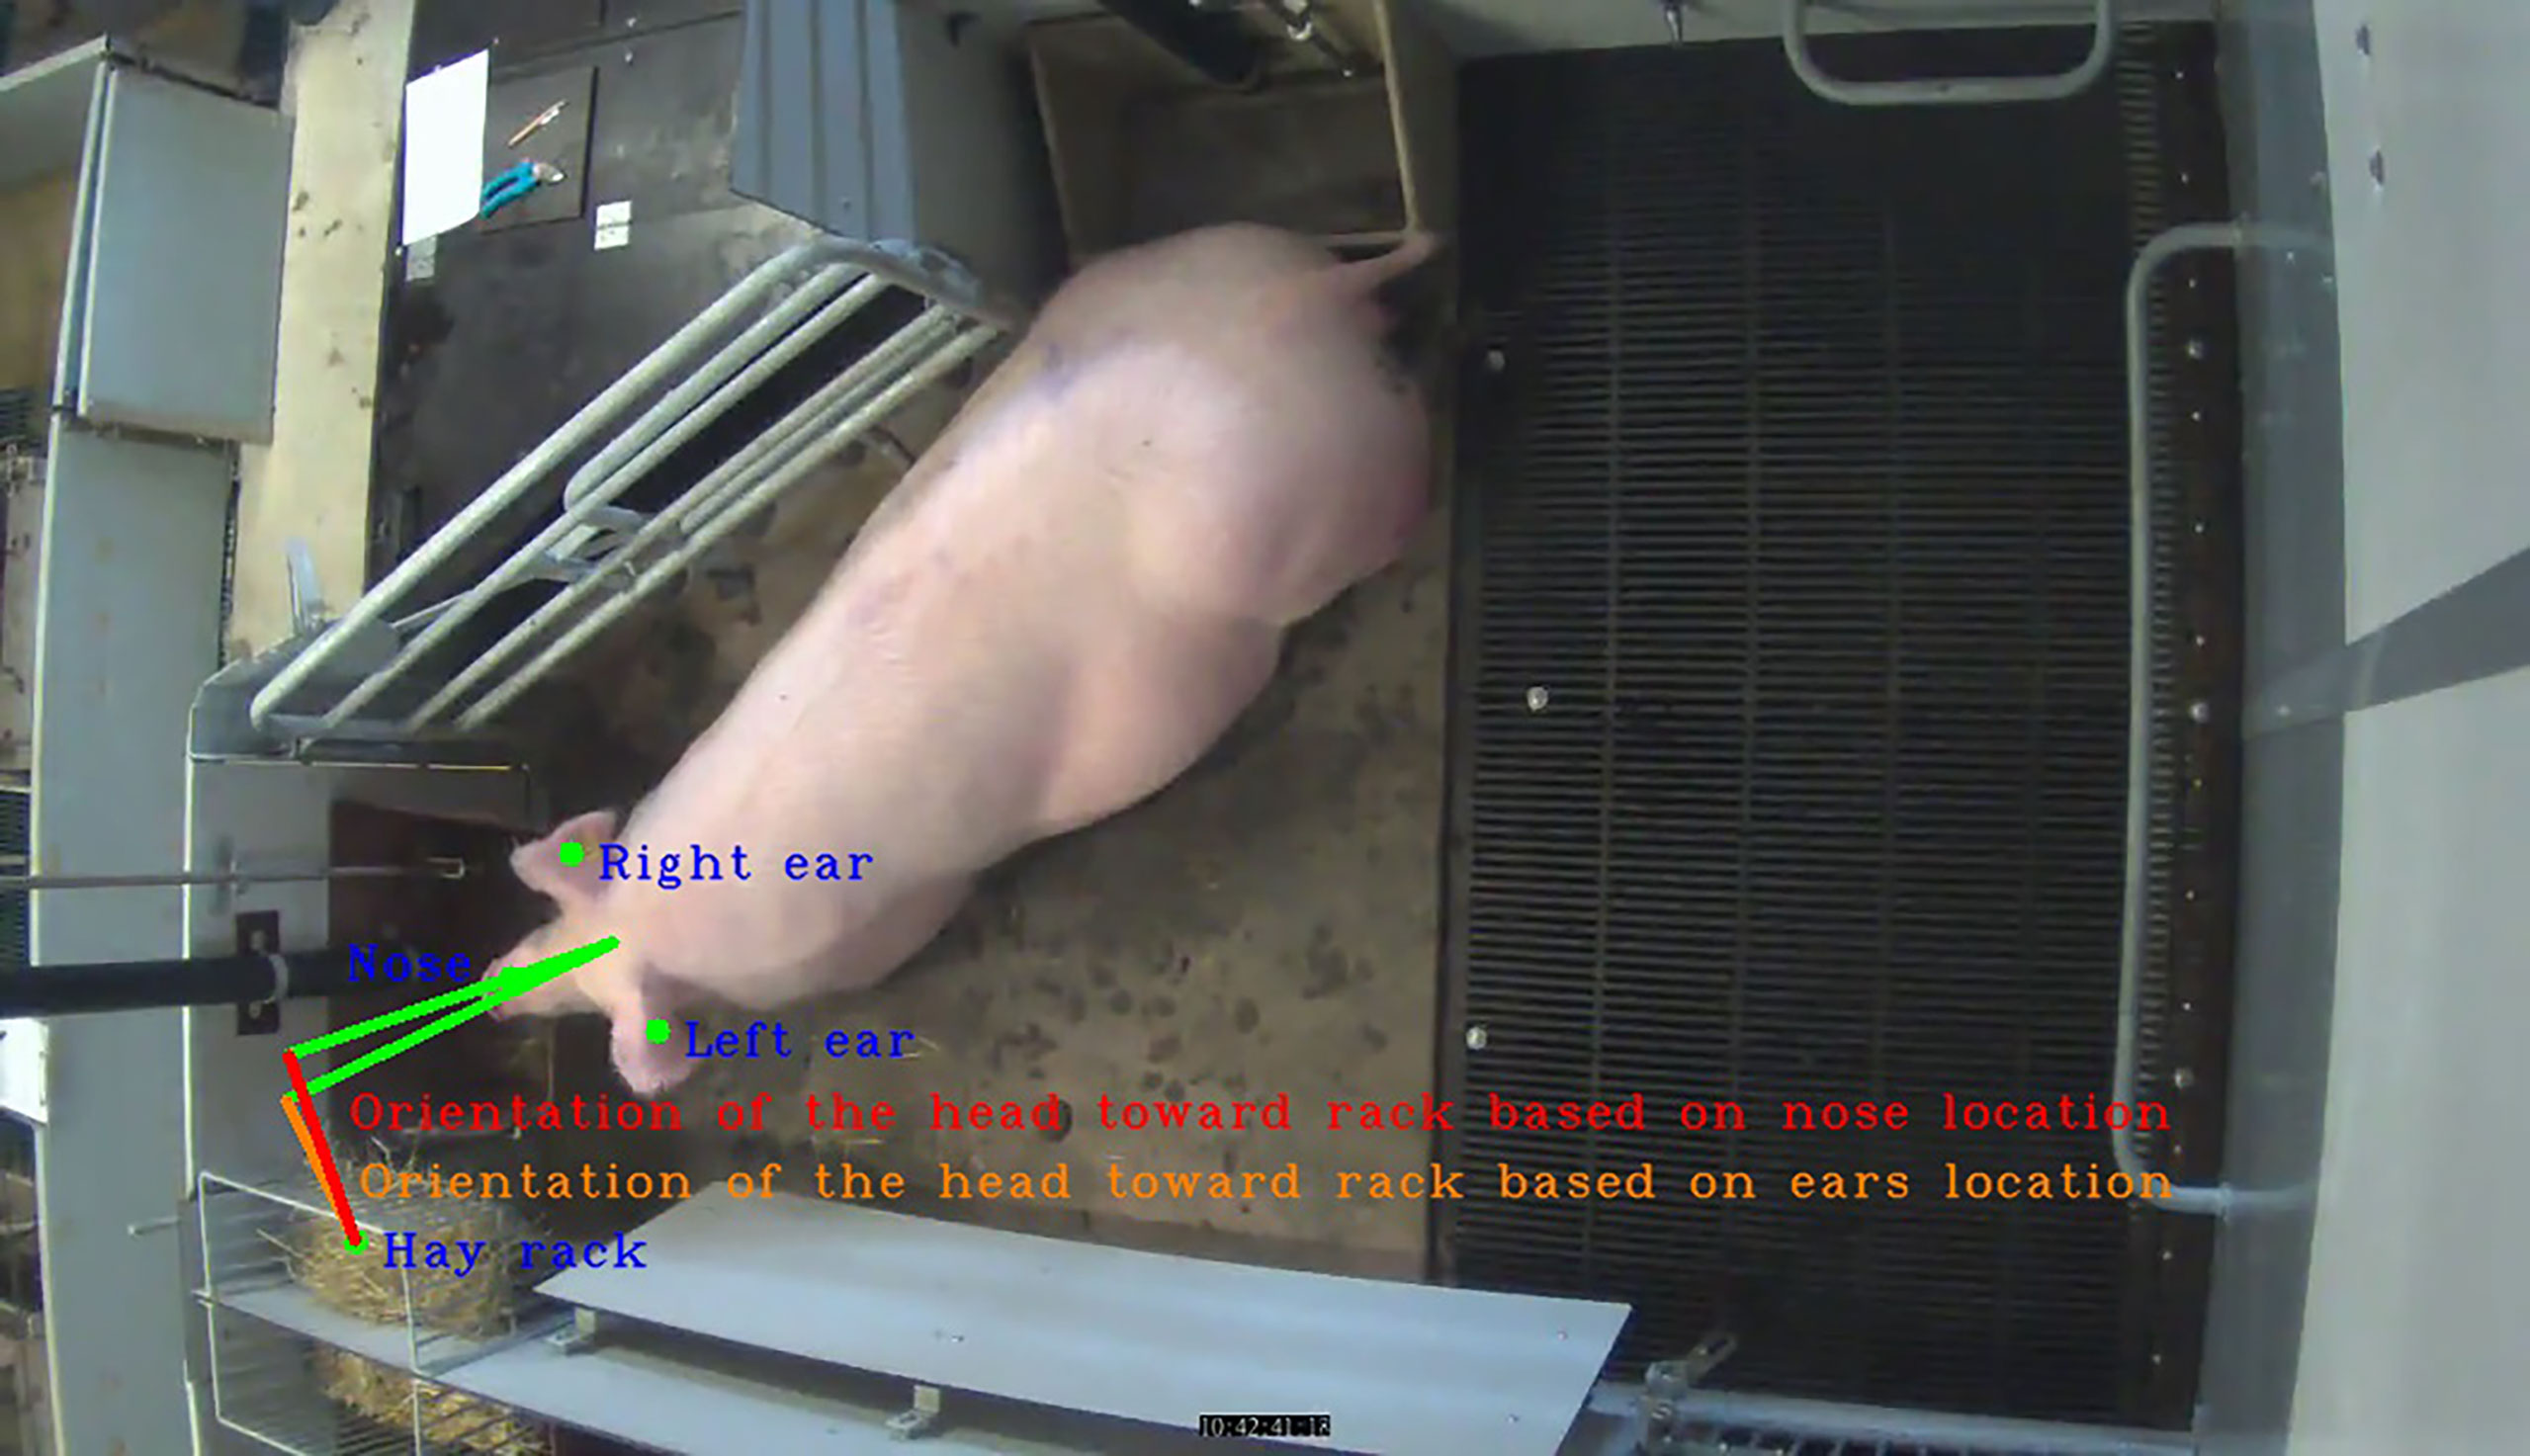
Figure 4 Orientation of the head toward the rack based on the location of the nose and ears.
Finally, we calculated the Euclidean distance between points c and r according to Eq. 8,
The fourth calculated feature variable was the orientation of the sow toward a rack based on the location of the centroid of the nose of the sow. The main difference in the calculation of this feature variable and the previous one was that the line indicating the direction of the head of the sow was not perpendicular to the line between the left and right ears of the sow, but rather it was simply a line joining the point in the middle between both ears of the sow and the centroid of the nose. The Cartesian coordinates of this line (dx, dy) and (ex, ey) were calculated according to Eqs. 9–12,
where (nx, ny) are the Cartesian coordinates of the centroid of the sow’s nose. The location of a point with the shortest distance to the rack on the line from points d to e was calculated as in Eqs. 6 and 7. Similarly, the distance of this point to the centroid of the rack was calculated as in Eq. 8 (Figure 4). Variable q is the length of the perpendicular line, which had a length of a diameter of an image, 1,252 pixels.
To calculate the next 36 feature variables, the Euclidean distance was estimated between the centroids of the head, body, or nose. For each of these three body parts, the Euclidean distance was calculated between consecutive frames of individual body parts according to Eq. 1. Finally, the statistical metrics—the sum and the mean of the Euclidean distance—were calculated on window durations of 2, 5, 10, 20, 30, and 45 s (3 body parts × 6 window durations × 2 statistical metrics = 36 feature variables). The main purpose of extraction of these 36 feature variables was to provide information to the model for the classification of hay rack use on the movement of the different parts of the sow’s body in various time windows (from 2 to 45 s). We hypothesize that these could help to, for example, recognize events in the video as non-hay rack use when a sow was sleeping with her head and nose far from the hay rack, but the Euclidean distance measured between the head of the sow and the hay rack was small due to measurement of the distance in 2D space (Figure 5).
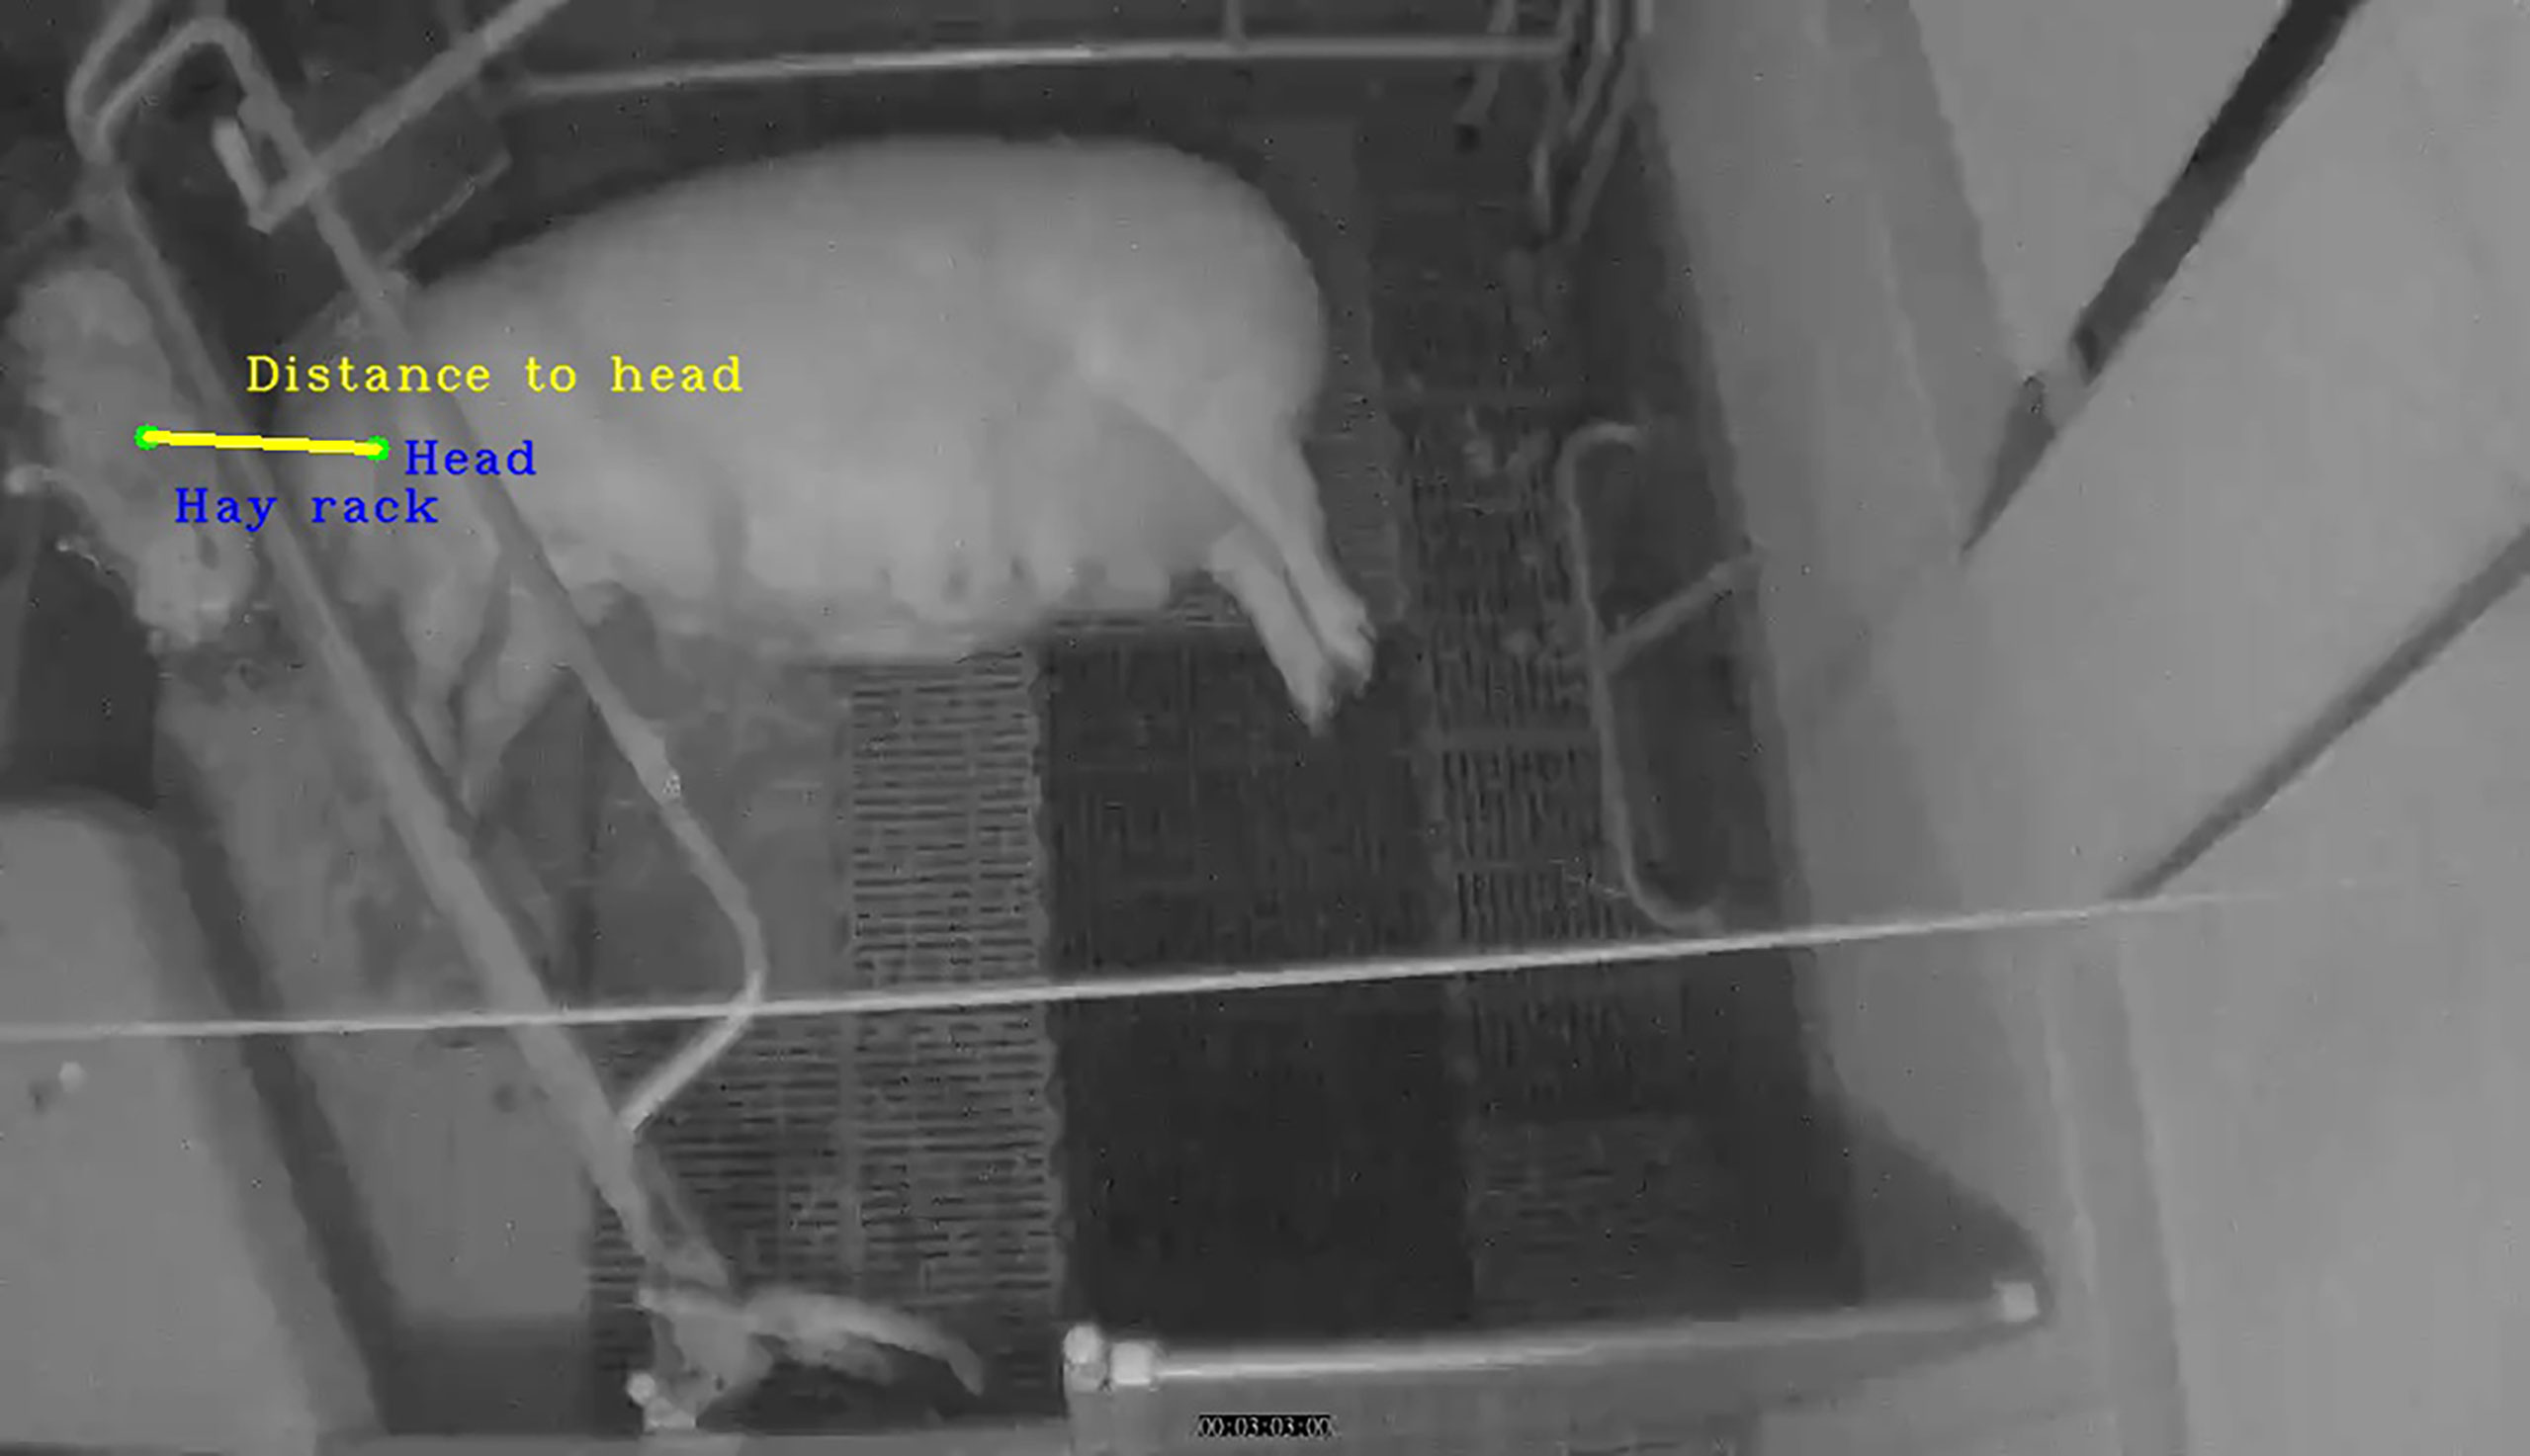
Figure 5 The sow’s head was close to the hay rack, but the sow was not using the rack and she was just sleeping. The sow’s nose was not detected.
The lack of movement of the head and nose in these frame sequences might indicate that there were no hay rack use behaviors. What was unknown was the time window that was the most appropriate to estimate the movement for the purpose of detection of these events. The application of the RF classifier and the estimation of the mean decrease of impurity (MDI) in the next step of the analysis helped to answer this question.
2.6.2 Random forest classifier
The RF classifier was used for the classification of hay rack use events in preparturient sows. RFs are machine learning methods for constructing prediction models from data. The RF classifier is an ensemble classifier that produces multiple decision trees, using a randomly selected subset of training samples and variables (Breiman, 2001). Furthermore, this classifier can be successfully used to select and rank those variables with the greatest ability to discriminate between the target classes (Belgiu and Drăguţ, 2016). The Python package scikit-learn was used to train and validate the model (Pedregosa et al., 2011).
The RF model was trained with depth of the tree increasing from 2 to 40, and the performance of the model was evaluated using the area under the receiver operating characteristic (ROC) curve (AUC), a metric of algorithm performance especially applicable for unbalanced datasets. The usage of AUC is preferred to the overall accuracy for the “single number” evaluation of machine learning algorithms (Bradley, 1997). Two algorithms with the highest AUC score on the validation set were selected: one for the classification of hay pulling and one for the classification of all hay rack use behaviors. In addition to AUC, accuracy, sensitivity, and specificity were used to evaluate the algorithm performance (Berckmans, 2013).
The importance of the 40 feature variables was evaluated with MDI. In RF, classification is performed based on a tree structure, where each node of a tree is divided (split) into subnodes. For the impurity (loss) importance, a division of a tree node into multiple subnodes with a large decrease in impurity is considered important, and as a consequence, variables used for splitting at important divisions of a tree are also considered important. Based on this idea, the impurity importance for a variable Xi is computed by the sum of all impurity decrease measures of all nodes in the forest at which a split on Xi has been conducted (Nembrini et al., 2018).
3 Results
3.1 Labeling
The labeling of four categories of behaviors in the period from the introduction of sows to the farrowing pen until 24 h after the end of farrowing revealed that both in the training and validation datasets, nose close to the rack was the behavior with the longest duration. The animals in the training dataset spend on average less time with their noses close to the hay racks than sows in the validation dataset. The behavior with the second longest duration in both datasets was pulling hay. Only 6 out of 12 animals expressed bar biting behavior. Events of bar biting were very short and only observed in trapezoid pens (Table 2). Bar biting events did not occur in the SWAP pens because they were not equipped with bars around the rack as opposed to the trapezoid pens.
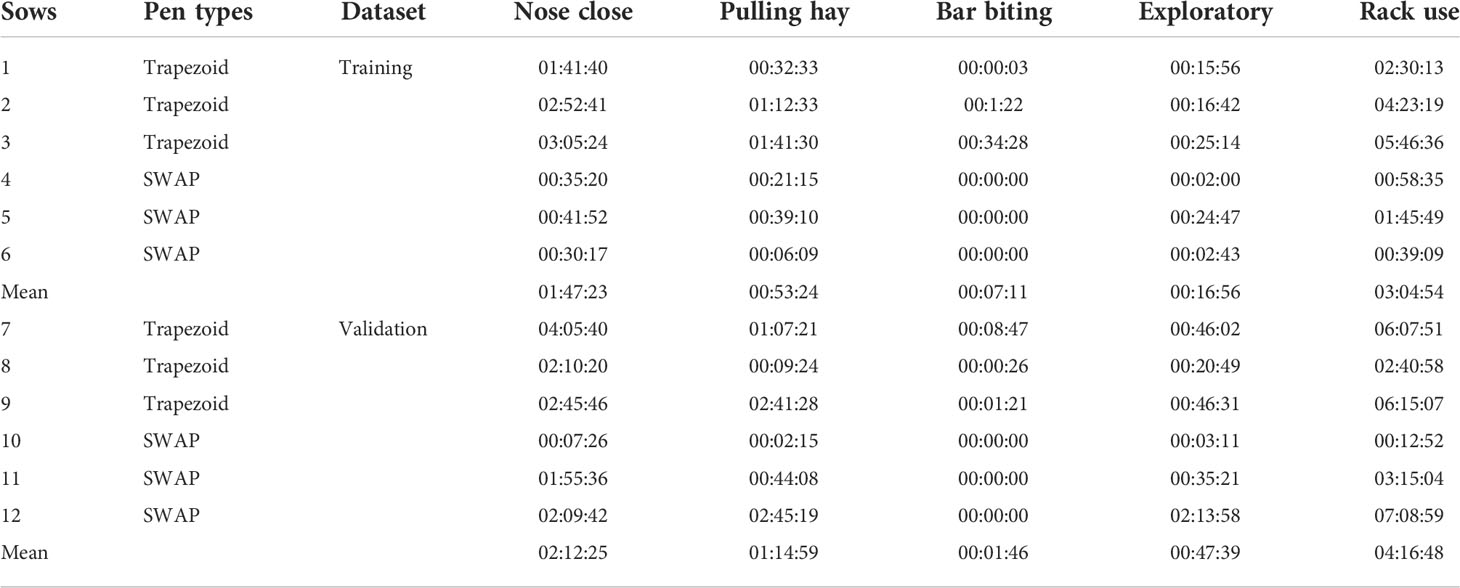
Table 2 Results of labeling of hay rack use behaviors.
Rack use category is the sum of nose close, pulling hay, bar biting, and exploratory behavior.
The sow with the shortest duration of hay rack use behaviors was sow 6, while sow 12 expressed hay rack use behaviors for the longest time (Table 2). Sows did not express nest-building behaviors after the farrowing was finished.
3.2 Classification
For both pulling hay behavior and all hay rack use behaviors, increasing the tree depth of the RF model from 2 to 7 resulted in an increase in model AUC and sensitivity in both training and validation datasets (Figure 6). A further increase in tree depth resulted in the stabilization of the model AUC in the validation dataset, a drop in sensitivity, and an increase in specificity. The highest AUC value of the RF classifier in the validation dataset was achieved with the tree depth of 10 (99.2%) for pulling hay behavior, while all hay rack use behaviors for the tree depth of seven showed the best result (96%) (Tables 3, 4). Increasing the model complexity beyond the tree depth of seven for all hay rack use behaviors or 10 for pulling hay behavior led to a model overfit with a further increase in AUC in the training dataset and a drop in the validation dataset (Figure 6). Thus, models with tree depths of seven and 10 were chosen as the optimal models for the classification of all hay rack use behaviors and pulling hay behavior, respectively.
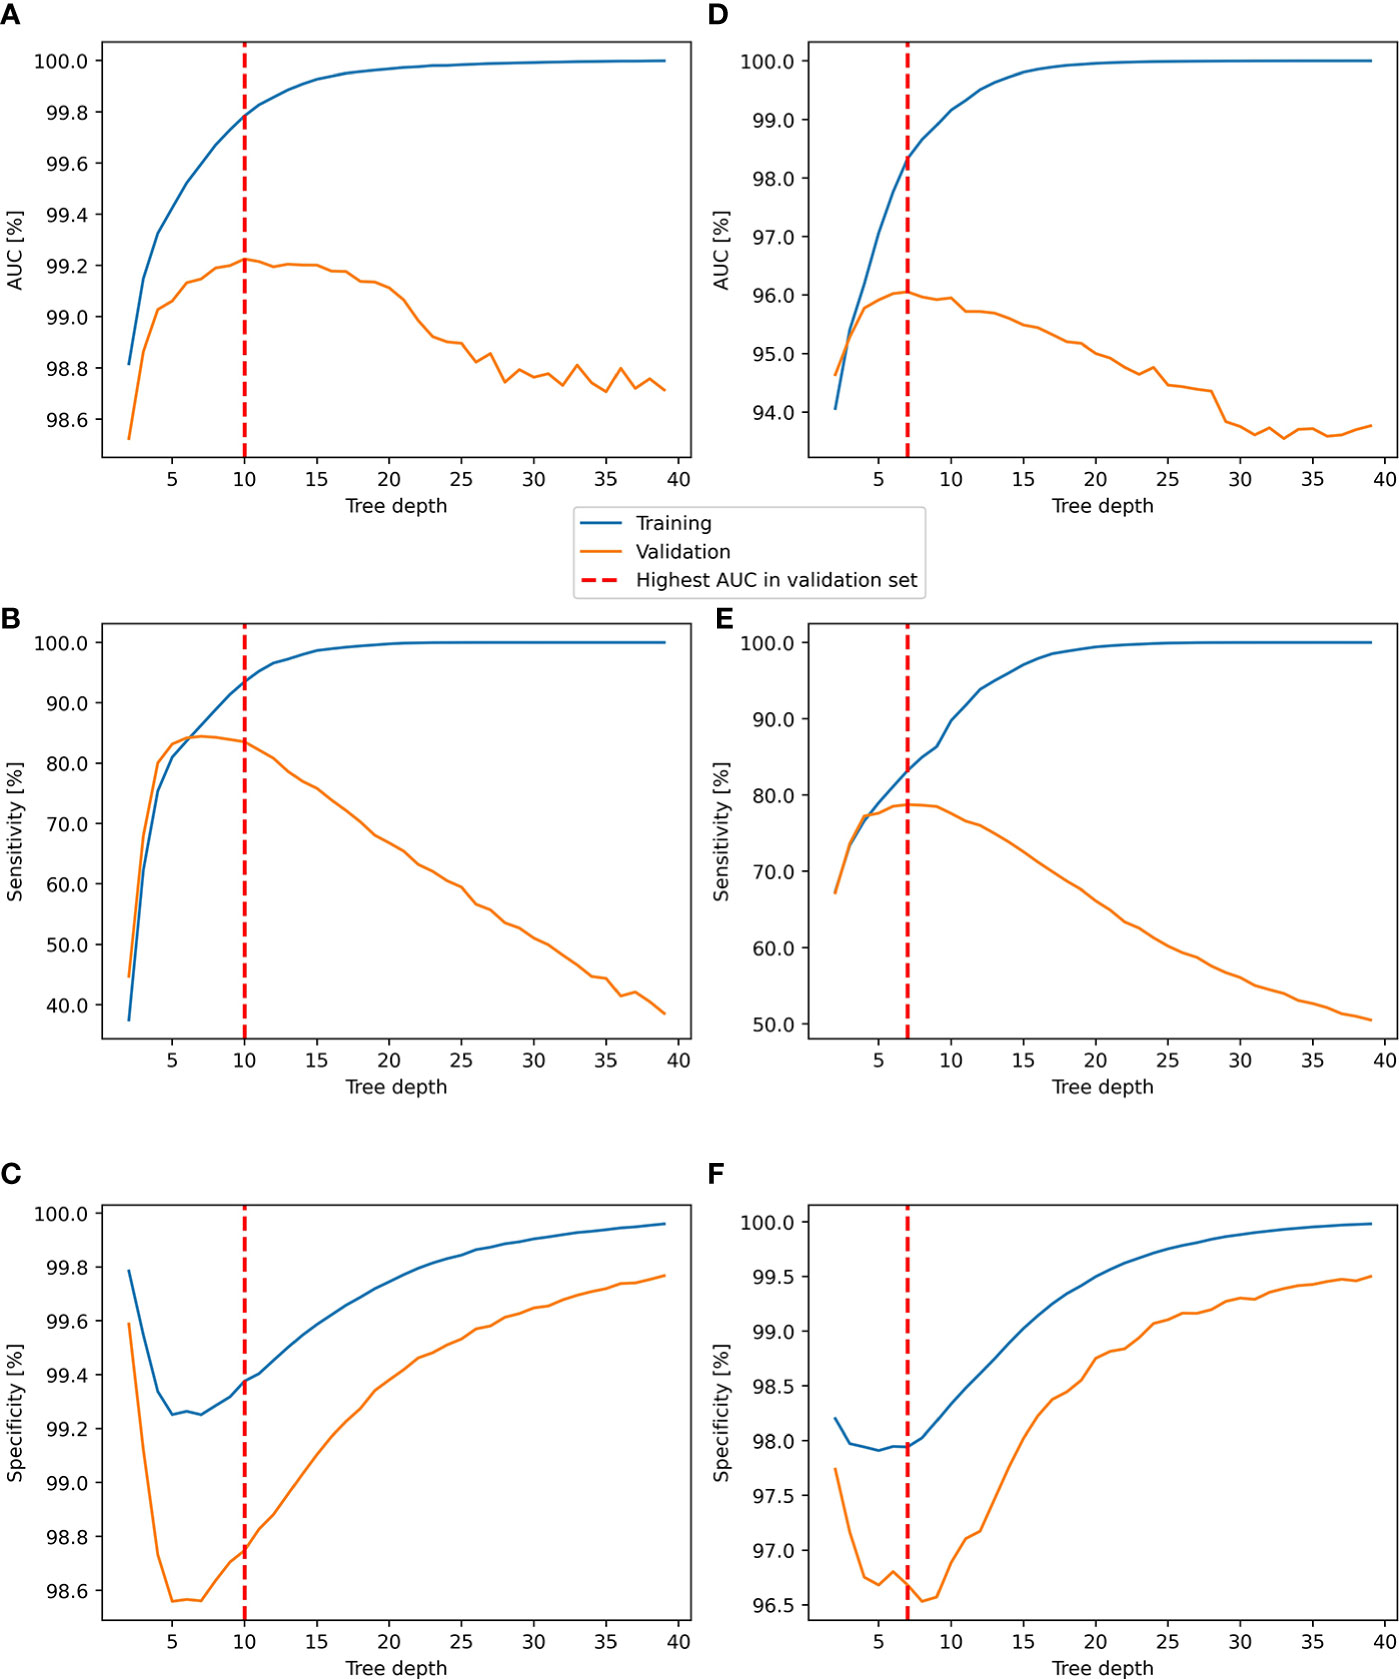
Figure 6 Performance of the RF classifier in the training and validation datasets for the classification of pulling hay (A–C) and all hay rack behaviors (D–F). (A) AUC for pulling hay, (B) sensitivity of pulling hay, (C) specificity of pulling hay, (D) AUC for rack use, (E) sensitivity of rack use, and (F) specificity of rack use.
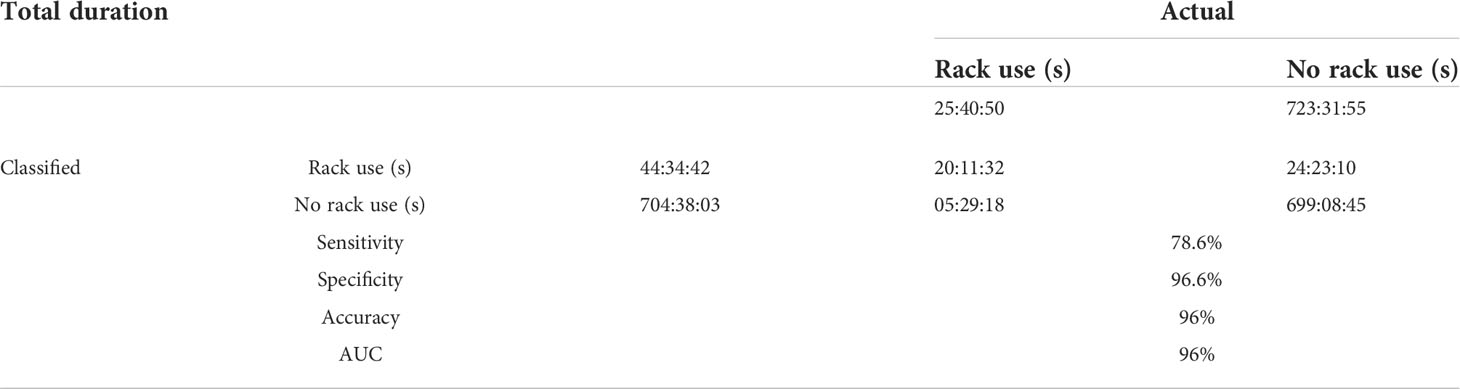
Table 3 Confusion matrix of RF classification of hay rack use in the validation set.
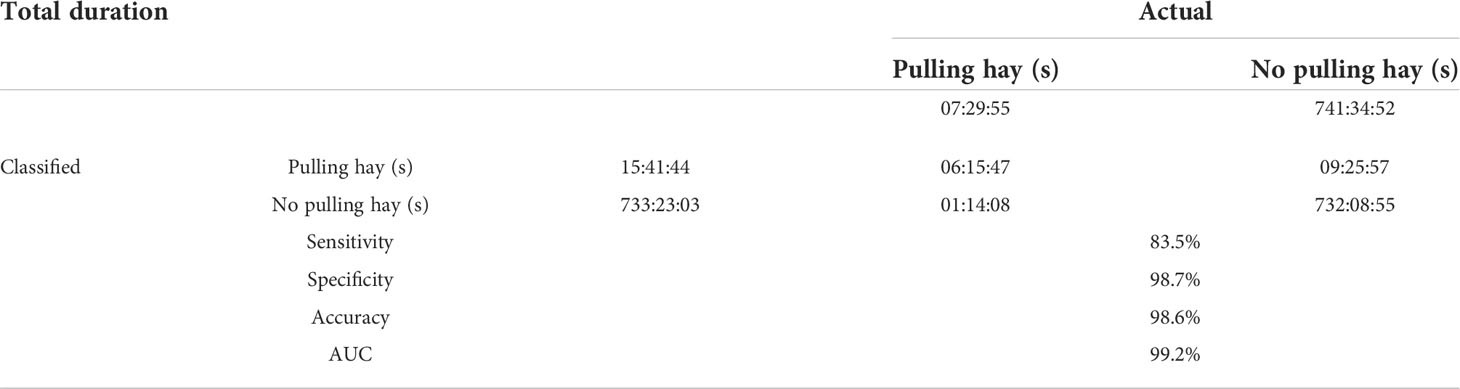
Table 4 Confusion matrix of RF classification of pulling hay behavior in the validation set.
The AUC for pulling hay behavior was higher (99.2%) than for all hay rack use behaviors grouped together (96%) (Tables 3, Table 4). What became apparent from the examination of confusion matrices of both models was that although AUC, accuracy, sensitivity, and specificity were high, the overestimate by two trained models of pulling hay behavior and all hay rack use behaviors was also relatively high. In the validation set, the labeled duration of all hay rack use behaviors was 25:40:50, while the automatically classified duration was 44:34:42. Similarly, in the validation set, the labeled duration of pulling hay behavior was 07:29:54, while the automatically classified duration was 15:41:44 (Tables 3, 4).
The most important feature variables in the RF model for pulling hay behavior (MDI > 0.05) was the distance from the nose to the rack (MDI = 0.29), the orientation of the head toward the rack based on nose location (MDI = 0.09), the distance from the head to the rack (MDI = 0.08), and the orientation of the head toward the rack based on the location of the ears (MDI = 0.07). Variable importance in the model for the classification of all hay rack use behaviors was more evenly split between all feature variables, where two variables had MDI above 0.1, i.e., the distance from the nose to the rack (MDI = 0.13) and the orientation of the head toward the rack based on nose location (MDI = 0.13). In this model, variables for estimating the movement of the sow’s head, body, and nose calculated on a window duration of 45 s seemed to be more important than those estimated on windows of other durations (Figure 7).
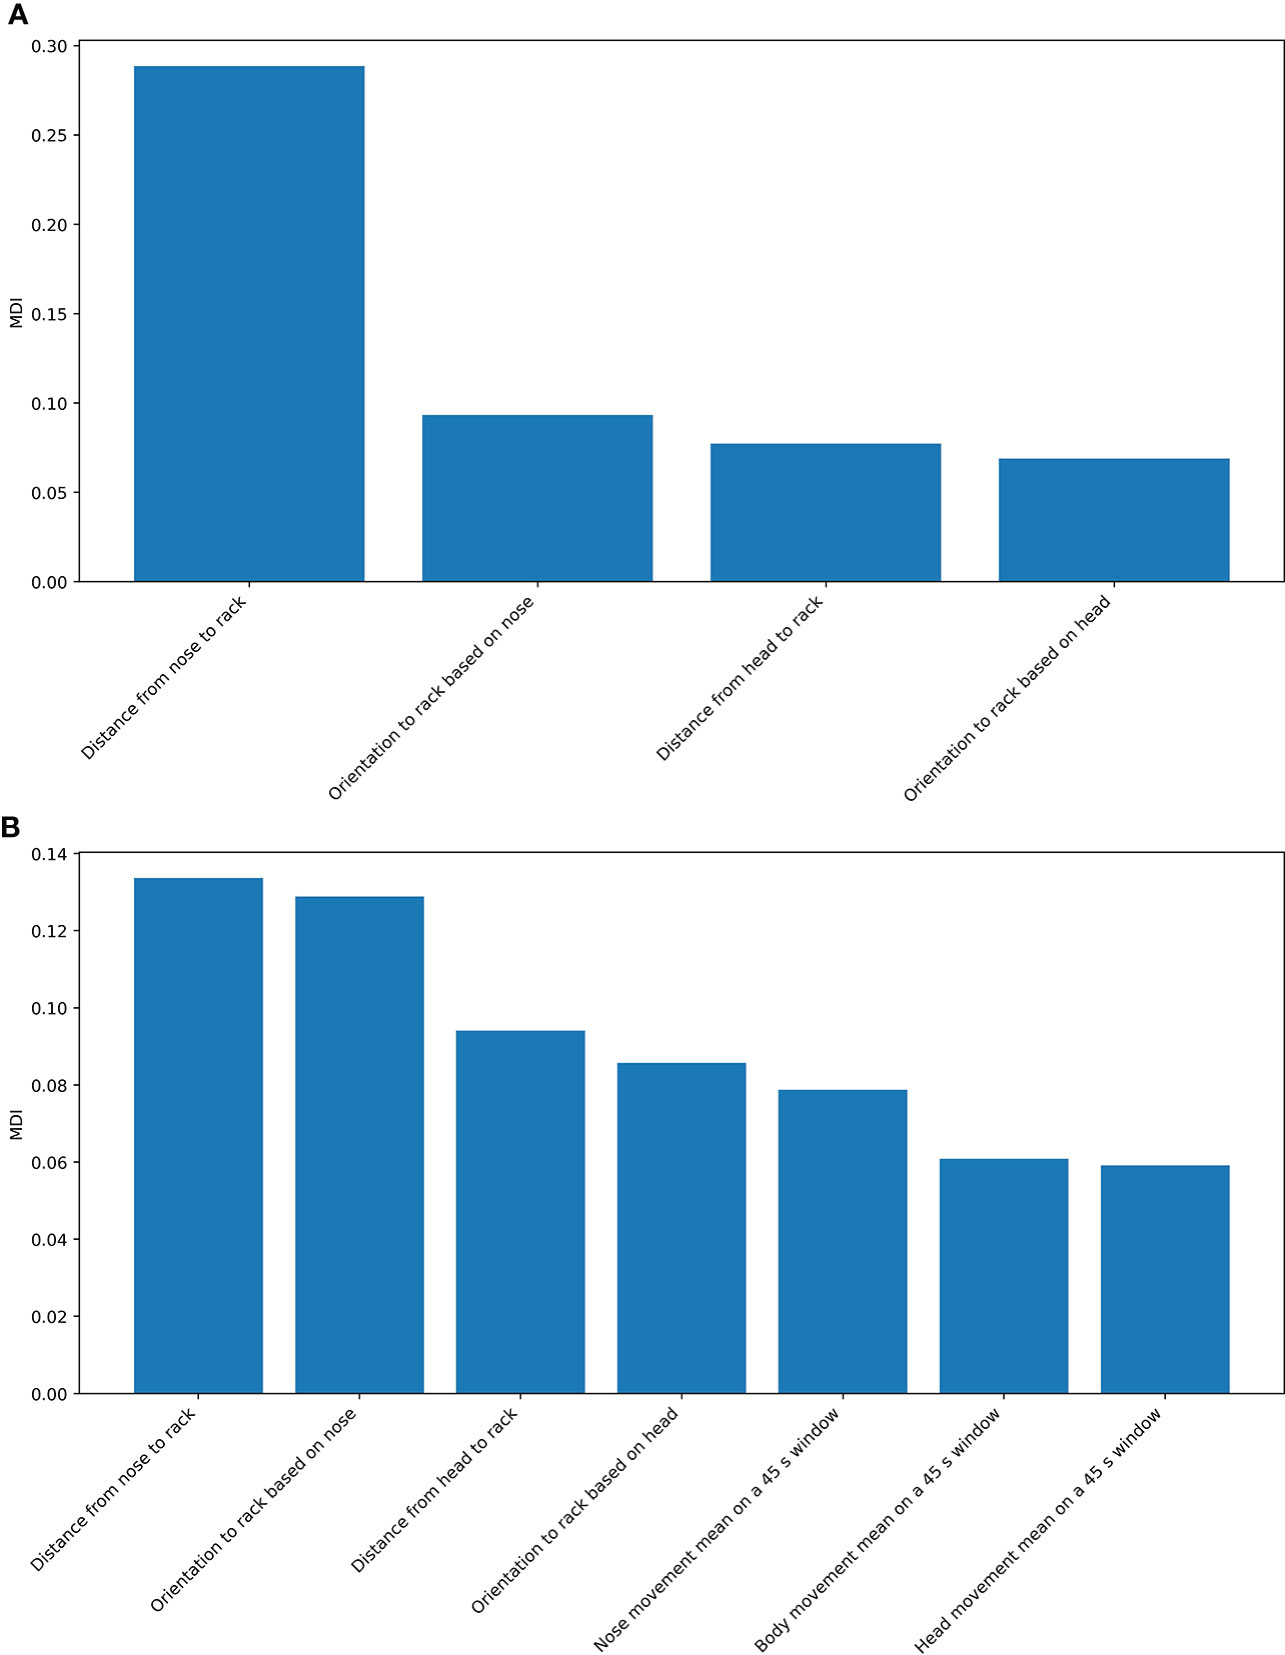
Figure 7 Variable importance based on MDI. Only variable importance higher than 0.05 is shown. (A) Model of pulling hay. (B) Model of all hay rack use behaviors.
Analysis of manually labeled pulling hay and all hay rack use behaviors and comparison of these variables to the automatically estimated activity level of sows in a period from introduction to the farrowing pen until farrowing indicate high variability of expressed hay rack-oriented behaviors. In 11 out of 12 sows, the increase in activity level was very clear with a peak visible several hours before the start of farrowing (Figures 8–10), which is consistent with the reported dynamics of sows’ activity level in this period (Oczak et al., 2019). In contrast, only six out of 12 sows reached their peak of labeled hay rack use and pulling hay behaviors at the same time as their peak of activity level (e.g., Figure 10). The other animals had no clearly visible peak in the labeled hay rack use and pulling hay behaviors or the peak was reached at different times than the peak of activity level, i.e., around 24 h (Figure 9) or 48 or 72 h (Figure 8) before the start of farrowing.
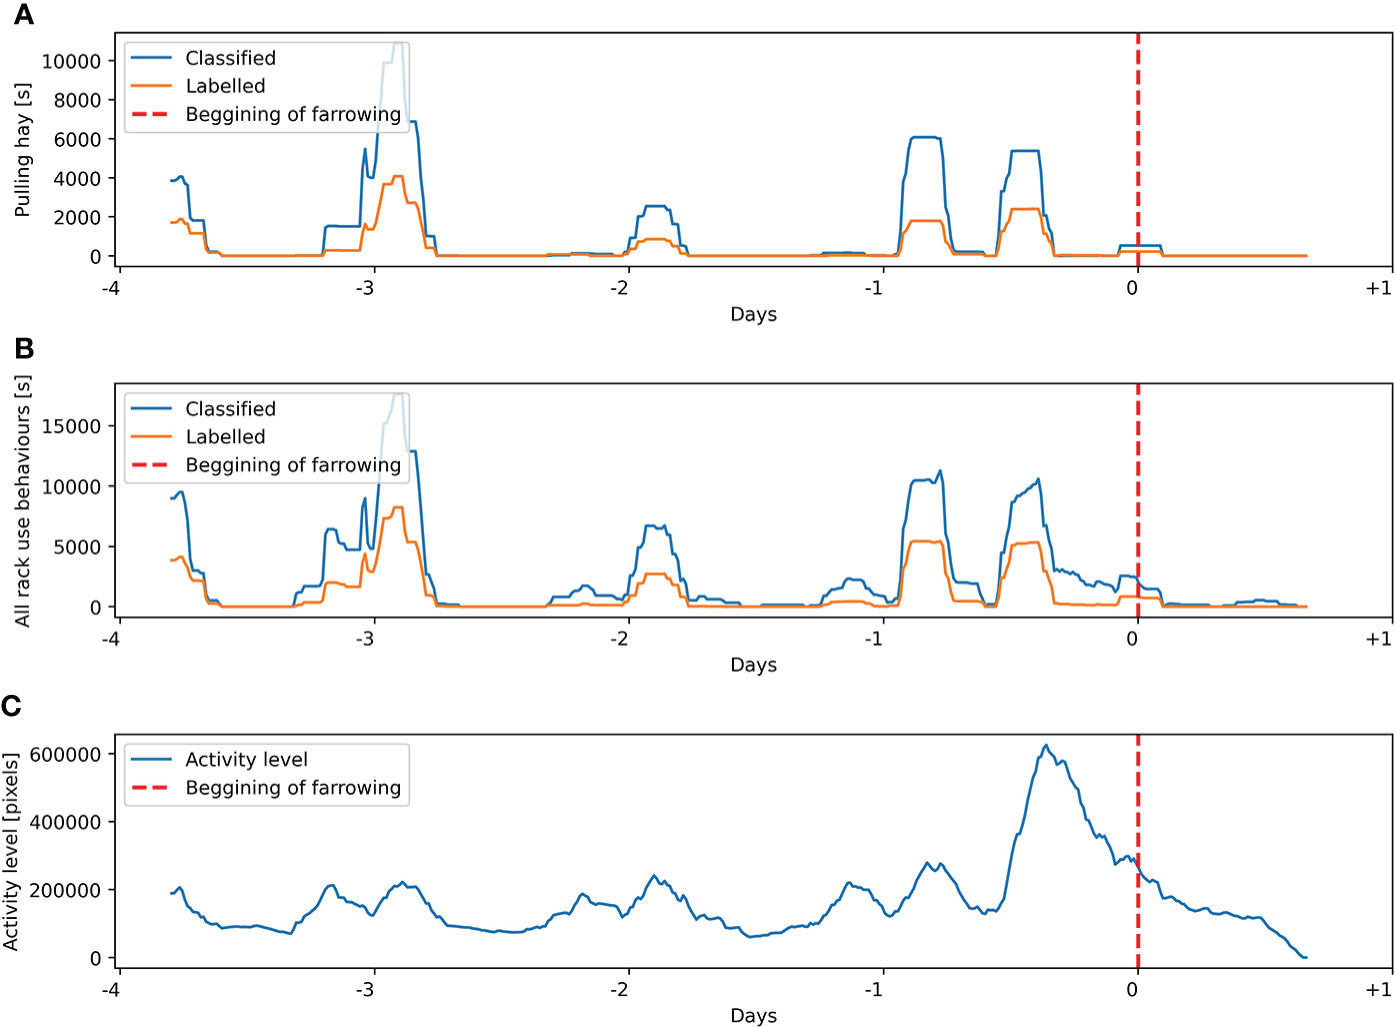
Figure 8 Labeling and classification for sow 5 from the training dataset of (A) pulling hay behavior and (B) all hay rack use behaviors. (C) Activity level estimated on the basis of the Euclidean distance between the centroids of the sow’s body in consecutive frames. Presented variables are calculated on a sliding window of 4 h with 15 min steps.
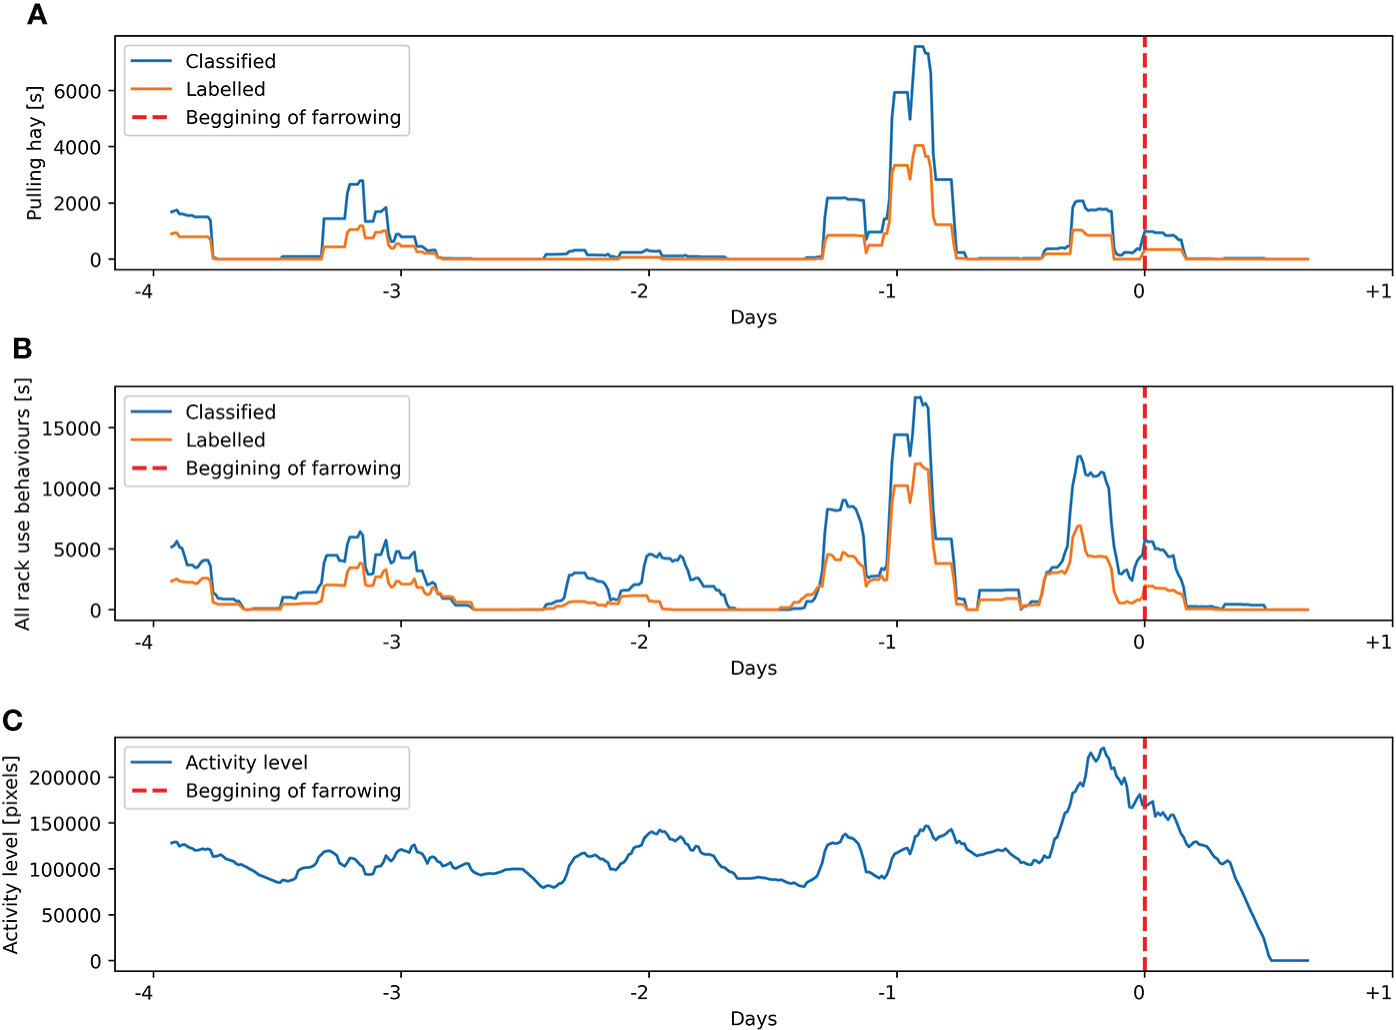
Figure 9 Labeling and classification for sow 1 from the training dataset of (A) pulling hay behavior and (B) all hay rack use behaviors. (C) Activity level estimated on the basis of the Euclidean distance between the centroids of the sow’s body in consecutive frames. Presented variables are calculated on a sliding window of 4 h with 15 min steps.
Comparison of manually labeled pulling hay and all hay rack use behaviors with the results of classification within individual animals suggests a high consistency of overestimates. Peaks of detected behaviors occurred at the same time as labeled by a human observer, and the dynamics of the variables was very similar (e.g., Figures 8–10). It was possible to observe only in one out of 12 sows two automatically detected peaks in hay rack use behaviors, which were not labeled by a human observer at 5.5 and 4 days before the beginning of farrowing.
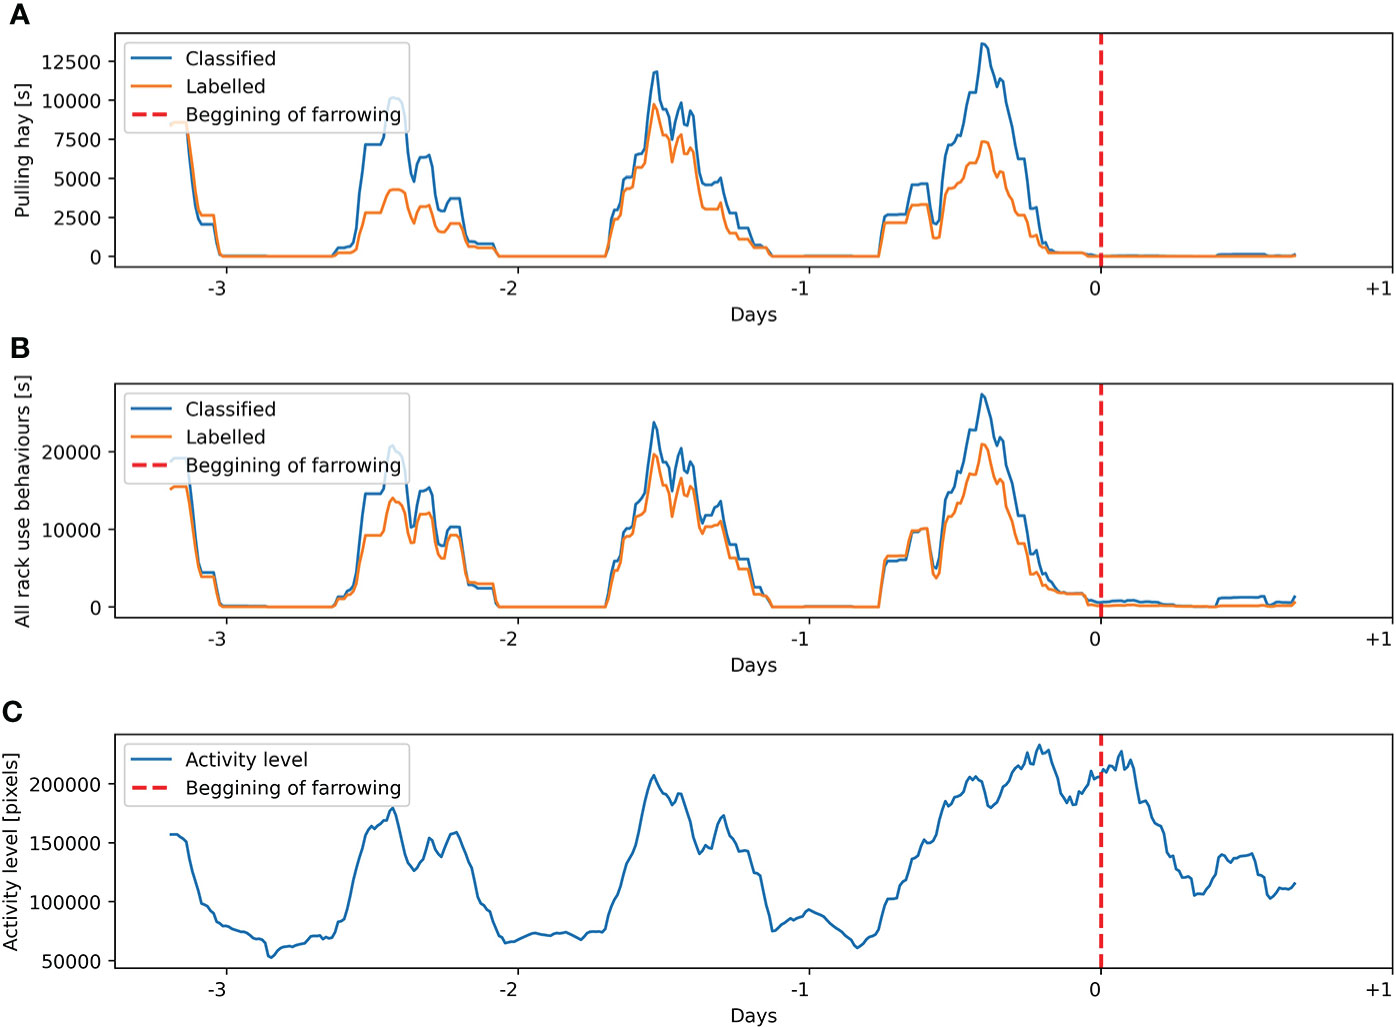
Figure 10 Labeling and classification for sow 12 from the validation dataset of (A) pulling hay behavior and (B) all hay rack use behaviors. (C) Activity level estimated on the basis of the Euclidean distance between the centroids of the sow’s body in consecutive frames. Presented variables are calculated on a sliding window of 4 h with 15 min steps.
4 Discussion
Our proposed method for detection of hay rack use behaviors in farrowing pens was based on the object detection algorithm RetinaNet, extraction of several feature variables from the centroids of detected parts of the sow’s body, and RF for classification. Both trained models, the first for the detection of all hay rack use behaviors and the second for the detection of pulling hay behavior, had good performance metrics with accuracies of 96% and 98.6%, respectively. These results are comparable with the results of Chen et al. (2020) in which a combination of the HSV (hue, saturation, value) tracking algorithm, the convolutional neural network (CNN) architecture InceptionV3, and the long short-term memory (LSTM) was used to detect pig enrichment engagement behaviors. The objective of that research was similar to ours in terms of the behavior of pigs, i.e., to detect engagement with enrichment material. In that research, it was possible to detect the interaction with enrichment material in weaner pigs housed in group pens with performance from 96.5% to 97.6% accuracy depending on which type of enrichment material was used.
What was similar between our results and those of Chen et al. (2020) was the high overestimates of behavior. In the research of Chen et al. (2020), the interactions with the enrichment materials—golden ball (264%) and wooden beam (138%)—were overestimated, while in our research, both types of hay rack use behaviors, i.e., all hay rack use (173%) and pulling hay (209%), were overestimated. Only the most frequent behavior under study in Chen et al. (2020), i.e., blue ball, had a low overestimate value of 107%. In general, in the classification of behavior in PLF applications, overestimation has to be considered very carefully aside from other algorithm performance metrics such as accuracy, sensitivity, or specificity. High overestimates of behavior might lead to low usability of the developed models in some applications, e.g., when comparisons of the duration of the behavior of interest between individuals are important. To reduce the overestimates of hay rack use in future research, we will automatically detect sow’s pose (e.g., the Residual Steps Network; Cai et al., 2020) and apply skeleton-based action recognition algorithms (e.g., PoseConv3D; Duan et al., 2021). Such an approach will include information on the posture of the sow aside from the head, nose, and ears included in this study. Additional information on the posture of the sow might help to reduce overestimates related to, e.g., sleeping in close proximity to the hay rack. Applications where overestimates of behavior might be less problematic are those in which dynamics of behavior of interest is of higher relevance than absolute duration, e.g., in farrowing prediction (Oczak et al., 2019). In the study of Chen et al. (2020), temporal information on modeled variables was included in the LSTM model, while in our study, the RF model included only the current values of the modeled variables. This was an important difference between both studies. As living organisms are time-varying in their nature and are dynamic systems, the most appropriate models used in PLF must continuously adapt to the individual (Berckmans, 2013). This is only possible if models have the ability to process temporal information. On the other hand, the application of RF models on several feature variables extracted from the centroids of detected parts of the sow body allowed the analysis of variable importance based on MDI in our study. Thus, we would argue that the interpretability of such a model is higher than the model in the study of Chen et al. (2020) in which the input to LSTM was a 131,072 (8 × 8 × 2,048)-dimensional vector characterizing images processed by the CNN. Although the authors visualized the heat maps representing the part of an image on which the CNN is focusing on, the main conclusion from visual inspection of the heat maps was that intense movement discriminates engagement with enrichment from behaviors not directed at the enrichment.
Examination of variable importance based on MDI allowed us to conclude that distance from the sow’s nose to the centroid of the hay rack was the most important variable for the classification of pulling hay behavior. For the detection of all hay rack use behaviors, movement of the head, body, and nose and also the distance between the head and the hay rack seemed to be more important than for the detection of pulling hay behavior. The difference in variable importance between pulling hay and all hay rack use behaviors seems logical when considering that pulling hay requires the sow to touch the rack with her nose, and this is represented by close proximity of the nose to the hay rack and the orientation of the head based on the nose location. The other behaviors labeled in our study, such as exploratory behavior, can be performed in close proximity to the rack, but the nose does not necessarily need to be directed at the rack or be located closer to the rack than the centroid of the head.
A similar approach to monitoring pig behavior as in our study was used in the study of Kashiha et al. (2013) where the focus was on automated estimation of water intake in fattening pigs. In this study, a visit to the drinker was detected if either the nose or ears of the pig were in proximity of 10 pixels to the nipple drinker. However, drinking from the nipple drinker was characterized by the lack of movement for at least several seconds (standing still), while especially all hay rack-directed behaviors were related to the intense movement of the head in our study.
The results of our study and those of Kashiha et al. (2013) indicate the importance of nose location and head orientation for the recognition of behaviors in which pigs interact with other objects (i.e., drinker, hay rack). Touch and nose contact has an essential role in communication, recognition, social grooming, and maintenance of dominant relationships (Newberry and Wood-Gush, 1986). The results of our study confirm the important role of the nose for pigs, also apparent from ethological studies such as that of Stolba and Wood-Gush (1989) who showed that pigs spend around half of the daylight period foraging with the nose for feed in a seminatural environment. One obvious explanation for why pigs use their nose is that they obtain important information from their environment by olfactory cues (Camerlink and Turner, 2013).
The onset of nest building is internally triggered by hormonal changes. Specifically, the decline in progesterone concentration starts 72 h before farrowing, while the increase in prolactin starts 24 h before farrowing (Algers and Uvnäs-Moberg, 2007). Due to hormonal changes and the presence of external stimuli, nest building starts 24 h before parturition, reaches maximum frequency 6 to 12 h before parturition, and then decreases as parturition approaches (Castren et al., 1993). The possibility to perform nest-building behavior should be offered to all sows in modern management systems. For this possibility, space and the provision of adequate nest-building material are two relevant prerequisites (Wischner et al., 2009). Automated monitoring of hay rack use in preparturient sows might add important information on sow nest-building behavior. This could support individual care for the sow in this sensitive period, considering that the necessary amount of enrichment or nest-building material is not defined in the law. Based on the information provided by such a monitoring system, the farm staff could offer more nest-building material (refill the dispenser) to the sows that use it more frequently. If some sows use the hay racks very often, then there is a risk that farm staff will not react to repeated alarms especially when they are to be diverted from other tasks. A possible solution to this problem might be further automation and the use of robots in livestock farming. The main advantage of the application of computer vision for monitoring hay rack use is the versatility of a single camera sensor, which could also be used to monitor other nest-building behaviors or body condition or feeding in sows and piglets. Such versatility is difficult to achieve with other sensor-based solutions even if they are simpler to implement for a single application. An alternative approach to hay rack use monitoring might be the application of a weight scale under the hay rack.
The results of our study suggest that some sows use the rack frequently only on some days before the onset of farrowing, not necessarily in the last hours before the onset of farrowing. Thus, nest-building material could be offered precisely on these days when sows use the rack. Additionally, more care could be offered to the sows that rarely use the rack in the preparturient period. The lack of activity around the hay rack might suggest that a dispenser is not a sufficient means of provision of nest-building material for some sows, and it should be offered in a different way (e.g., on the ground) to those sows. In a future study, we plan to focus on automated quantification of the amount of nest-building material used by the sows. A similar research has already been performed with a focus on feed intake estimation in Bezen et al. (2020). Additionally, the detection of how much nest-building material is available in the rack based on computer vision methods will be the focus of our studies. This should allow informing the farmer on when to provide additional nest-building material to the sow, which is not possible based on the algorithm developed in this study. This should also reduce the need for manual observation of hay racks and related workload on the farm.
The second objective of our study was to analyze if the output of the algorithm for hay rack use detection could potentially improve the performance of farrowing prediction compared to current state-of-the-art techniques for farrowing prediction based solely on activity levels (Manteuffel et al., 2015; Pastell et al., 2016; Traulsen et al., 2018; Oczak et al., 2019). Analysis of the performance of the developed models for automated detection of hay rack use suggested that they could be useful for farrowing prediction. The algorithm correctly indicated the dynamics of labeled behaviors, i.e., peaks in the labeled hay rack use behaviors were automatically detected by the algorithm at the same time as by the labeler in 11 out of 12 sows. However, variability in the labeled hay rack use behaviors seems to be much higher than in the activity levels of sows as indicated by the fact that only six out of 12 sows reached their peak of labeled hay rack use and pulling hay behaviors within the last 24 h before the start of farrowing. This is different from the pattern in the activity level of sows, which for all animals in our study was the highest in the last hours before the beginning of farrowing.
Without modeling the data for the purpose of farrowing prediction and also considering the low number of animals in our study, it is not possible to further conclude if automated detection of hay rack use might improve the performance of farrowing prediction beyond the outcome based only on activity levels. The activity level itself allowed the prediction of approaching farrowing in around 70% of sows without false positives, and 61% (11 out of 18) of alarms were generated between 6 and 13 h before the onset of farrowing (Oczak et al., 2019). Thus, even if in one animal out of 12 sows from our study the classification of hay rack use behaviors would allow the generation of correct alarm on approaching farrowing, which would not be otherwise possible solely on the basis of changes of activity levels, this would be an important improvement in the performance of the models for farrowing prediction. However, it has to be noted that based on visual examination of results of labeling and classification of hay rack use behaviors in comparison to changes in activity levels, we did not observe in any of the sows, in the period of 24 h before the onset of farrowing, an increase in the use of hay rack that would not be associated with increased activity level. Half of the sows in our study (6 out of 12) did not increase the use of the hay rack in the nest-building period, although their activity level increased. It is possible that sows express nest-building behavior differently (Oczak et al., 2015) between individuals, and the increase in activity level before the onset of farrowing in some sows is associated with the increase in the other nest-building behaviors, e.g., rooting, bar biting, or pawing. These behaviors were not analyzed in our current study. We aim to focus on these behaviors in our future research.
Data availability statement
The original contributions presented in the study are included in the article/supplementary material. Further inquiries can be directed to the corresponding author.
Ethics statement
Project PIGwatch was authorized by the ethical committee of the Austrian Federal Ministry of Science, Research and Economy and by the ethical committee of Vetmeduni Vienna (GZ: BMWFV-68.205/0082-WF/II/3b/2014) according to the Austrian Tierversuchsgesetz 2012, BGBl. I Nr. 114/2012. Written informed consent was obtained from the owners for the participation of their animals in this study.
Author contributions
MO: conceptualization, methodology, software, and writing—original draft. FB: writing—review and editing. SV: writing—review and editing. KM: resources and data curation. JB: supervision and funding acquisition. All authors contributed to the article and approved the submitted version.
Conflict of Interest
Author KM was employed by the company FFoQSI GmbH.
The remaining authors declare that the research was conducted in the absence of any commercial or financial relationships that could be construed as a potential conflict of interest.
Publisher’s Note
All claims expressed in this article are solely those of the authors and do not necessarily represent those of their affiliated organizations, or those of the publisher, the editors and the reviewers. Any product that may be evaluated in this article, or claim that may be made by its manufacturer, is not guaranteed or endorsed by the publisher.
References
Algers B., Uvnäs-Moberg K. (2007). Maternal behavior in pigs. Horm. Behav. 52 (1), 78e85. doi: 10.1016/j.yhbeh.2007.03.022
Arey D. S., Petchey A. M., Fowler V. R. (1991). The preparturient behaviour of sows in enriched pens and the effect of pre-formed nests. Appl. Anim. Behav. Sci. 31 (1), 61–68. doi: 10.1016/0168-1591(91)90153-O
Belgiu M., Drăguţ L. (2016). Random forest in remote sensing: A review of applications and future directions. ISPRS. J. Photogram. Remote Sens.: Off. Publ. Int. Soc. Photogrammet. Remote Sens. 114, 24–31. doi: 10.1016/j.isprsjprs.2016.01.011
Berckmans D. (2013). “‘Basic principles of PLF: gold standard, labelling and field data’,” in Precision livestock farming 2013-papers presented at the 6th European conference on precision livestock farming, ECPLF 2013, 21–29 Catholic University of Leuven:Leuven, Belgium. Available at: https://lirias.kuleuven.be/1633686?limo=0.
Berckmans D., Guarino M. (2008). Smart sensors in precision livestock farming-preface. Comput. Electron. Agric. 64 (1), 1–1. doi: 10.1016/j.compag.2008.05.006
Bezen R., Edan Y., Halachmi I. (2020). ‘Computer vision system for measuring individual cow feed intake using RGB-d camera and deep learning algorithms’. Comput. Electron. Agric. 172, 105345. doi: 10.1016/j.compag.2020.105345
BMG (2012) ‘Verordnung des bundesministers für gesundheit, mit der die 1. tierhaltungsverordnung geändert wird, BGBl. II nr 61/2012 vom 09.03.2012’. Available at: https://www.ris.bka.gv.at/eli/bgbl/II/2012/61/20120309.
Bradley A. P. (1997). The use of the area under the ROC curve in the evaluation of machine learning algorithms. Pattern Recog. 30 (7), 1145–1159. doi: 10.1016/S0031-3203(96)00142-2
Burne T. H. J., Murfitt P. J. E., Gilbert C. L. (2000). ‘Deprivation of straw bedding alters PGF2α-induced nesting behaviour in female pigs. Appl. Anim. Behav. Sci. 69 (3), 215–225. doi: 10.1016/S0168-1591(00)00135-0
Cai Y., Zhicheng W., Zhengxiong L., Binyi Y., Angang D., Haoqian W., et al. (2020). Learning delicate local representations for multi-person pose estimation. In. Eur. Conf. Comput. Vision 9, 455–472. doi: 10.1007/978-3-030-58580-8_27
Camerlink I., Turner S. P. (2013). The pig’s nose and its role in dominance relationships and harmful behaviour. Appl. Anim. Behav. Sci. 145 (3), 84–91. doi: 10.1016/j.applanim.2013.02.008
Castren H., Algers B., de Passille A. M., Rushen J., Uvnäs-Moberg K. (1993). Preparturient variation in progesterone, prolactin, oxytocin and somatostatin in relation to nest building in sows. Appl. Anim. Behav. Sci. 38 (2), 91–102. doi: 10.1016/0168-1591(93)90059-X
Chen C., Zhu W., Oczak M., Maschat K., Baumgartner J., Larsen M. L. V, et al. (2020). ‘A computer vision approach for recognition of the engagement of pigs with different enrichment objects. Comput. Electron. Agric. 175, 105580. doi: 10.1016/j.compag.2020.105580
Duan H., Yue Z., Kai C., Dian S., Dahua L., Bo D. (2021). Revisiting skeleton-based action recognition. arXiv. Prep 35, 2969–78. doi: 10.48550/arXiv.2104.13586
Edwards L. E., Plush K. J., Ralph C. R., Morrison R. S., Acharya R. Y., Doyle R. E. (2019). Enrichment with Lucerne hay improves sow maternal behaviour and improves piglet survival. Anim. an. Open Access J. MDPI 9 (8), 558–74. doi: 10.3390/ani9080558
Fraser D. (1975). The effect of straw on the behaviour of sows in tether stalls. Anim. Sci. 21 (1), 59–68. doi: 10.1017/S0003356100030415
Herskin M. S., Jensen K. H., Thodberg K. (1998). Influence of environmental stimuli on maternal behaviour related to bonding, reactivity and crushing of piglets in domestic sows. Appl. Anim. Behav. Sci. 58 (3), 241–254. doi: 10.1016/S0168-1591(97)00144-5
Kamphues J. (2004). Supplemente zu vorlesungen und Übungen in der tierernährung (Hannover, Germany:Schlütersche). Available at: https://play.google.com/store/books/details?id=0Y5Ei8kt1H4C.
Kashiha M., Bahr C., Haredasht S. A., Ott S., Moons C. P., Niewold T. A., et al. (2013). The automatic monitoring of pigs water use by cameras. Comput. Electron. Agric. 90, 164–169. doi: 10.1016/j.compag.2012.09.015
Lin T.-Y., Goyal P., Girshick R., He K., Dollár P.. (2017). “‘Focal loss for dense object detection’,” in Proceedings of the IEEE international conference on computer vision, 2980–2988 Computer Vision Fundation:New York, US. Available at: http://openaccess.thecvf.com/content_iccv_2017/html/Lin_Focal_Loss_for_ICCV_2017_paper.html.
Manteuffel C., Hartung E., Schmidt M., Hoffmann G. , Schön P. C. (2015). Towards qualitative and quantitative prediction and detection of parturition onset in sows using light barriers. Comput. Electron. Agric. 116, 201–210. doi: 10.1016/j.compag.2015.06.017
Maschat K., Dolezal M., Leeb C., Heidinger B., Winckler C., Oczak M., et al. (2020). Duration of confinement and pen-type affect health-related measures of welfare in lactating sows. Anim. Welfare. 29 (3), 339–352. doi: 10.7120/09627286.29.3.339
Müller J. (1979). “Tierschutzbestimmungen für die schweinehaltung,” in Eine stellungnahme vorgelegt von der internationalen gesellschaft für nutztierhaltung (IGN)(Bern:Internationale Gesellschaft für Nutztierhaltung (IGN)). Available at: https://play.google.com/store/books/details?id=KOzYjgEACAAJ.
Nembrini S., König I. R., Wright M. N. (2018). The revival of the gini importance? Bioinformatics 34 (21), 3711–3718. doi: 10.1093/bioinformatics/bty373
Newberry R. C., Wood-Gush D. G. M. (1986). Social relationships of piglets in a semi-natural environment. Anim. Behav. 34 (5), 1311–1318. doi: 10.1016/S0003-3472(86)80202-0
Oczak M., et al. (2015). Classification of nest-building behaviour in non-crated farrowing sows on the basis of accelerometer data. Biosyst. Eng. 140, 48–58. doi: 10.1016/j.biosystemseng.2015.09.007
Oczak M., Bayer F., Vetter S., Maschat K., Baumgartner J.. (2022). Comparison of the automated monitoring of the sow activity in farrowing pens using video and accelerometer data. Comput. Electron. Agric. 192, 106517. doi: 10.1016/j.compag.2021.106517
Oczak M., Maschat K., Baumgartner J. (2019). Dynamics of sows’ activity housed in farrowing pens with possibility of temporary crating might indicate the time when sows should be confined in a crate before the onset of farrowing. Animals 10 (1), 6. doi: 10.3390/ani10010006
Pastell M., Hietaoja J., Yun J., Tiusanen J., Valros A. (2016). Predicting farrowing of sows housed in crates and pens using accelerometers and CUSUM charts. Comput. Electron. Agric. 127, 197–203. doi: 10.1016/j.compag.2016.06.009
Pedregosa F., Varoquaux G., Gramfort A., Michel V., Thirion B., Grisel O., et al. (2011). Scikit-learn: Machine learning in Python. J. Mach. Learn. Res. 12, 2825–2830. doi: 10.5555/1953048.2078195
Stolba A., Wood-Gush D. G. M. (1989). The behaviour of pigs in a semi-natural environment. Anim. Sci. 48 (2), 419–425. doi: 10.1017/S0003356100040411
Studnitz M., Jensen M. B., Pedersen L. J. (2007). Why do pigs root and in what will they root?: A review on the exploratory behaviour of pigs in relation to environmental enrichment. Appl. Anim. Behav. Sci. 107 (3), 183–197. doi: 10.1016/j.applanim.2006.11.013
Traulsen I., Scheel C., Auer W., Burfeind O., Krieter J.. (2018). Using acceleration data to automatically detect the onset of farrowing in sows. Sensors 18 (1), 170. doi: 10.3390/s18010170
Vanputten G. (1980). Objective observations on the behavior of fattening pigs. Anim. Regul. Stud. 3 (1-2), 105–118.
Widowski T. M., Curtis S. E. (1990). The influence of straw, cloth tassel, or both on the prepartum behavior of sows. Appl. Anim. Behav. Sci. 27 (1), 53–71. doi: 10.1016/0168-1591(90)90007-Z
Wischner D., Kemper N., Krieter J. (2009). Nest-building behaviour in sows and consequences for pig husbandry. Livestock. Sci. 124 (1), 1–8. doi: 10.1016/j.livsci.2009.01.015
Ziolkowska A., Debska B., Banach-Szott M. (2020). Transformations of phenolic compounds in meadow soils. Sci. Rep. 10 (1), 19330. doi: 10.1038/s41598-020-76316-7
Keywords: sow, nest building, computer vision, hay rack use, automated monitoring, deep learning, precision livestock farming
Citation: Oczak M, Bayer F, Vetter SG, Maschat K and Baumgartner J (2022) Where is the sow’s nose: RetinaNet object detector as a basis for monitoring the use of rack with nest-building material. Front. Anim. Sci. 3:913407. doi: 10.3389/fanim.2022.913407
Received: 05 April 2022; Accepted: 07 July 2022;
Published: 03 August 2022.
Edited by:
Lilong Chai, University of Georgia, United StatesReviewed by:
Yuzhi Li, University of Minnesota Twin Cities, United StatesKeelin Katherine Mary O’Driscoll, Teagasc, Ireland
Copyright © 2022 Oczak, Bayer, Vetter, Maschat and Baumgartner. This is an open-access article distributed under the terms of the Creative Commons Attribution License (CC BY). The use, distribution or reproduction in other forums is permitted, provided the original author(s) and the copyright owner(s) are credited and that the original publication in this journal is cited, in accordance with accepted academic practice. No use, distribution or reproduction is permitted which does not comply with these terms.
*Correspondence: Maciej Oczak, TWFjaWVqLk9jemFrQHZldG1lZHVuaS5hYy5hdA==