 Hassan Khanaki
 Richard J. Dewhurst
 Brian J. Leury3
 Gonzalo Cantalapiedra-Hijar
 Long Cheng
94% of researchers rate our articles as excellent or good
Learn more about the work of our research integrity team to safeguard the quality of each article we publish.
Find out more
ORIGINAL RESEARCH article
Front. Anim. Sci., 04 July 2022
Sec. Animal Nutrition
Volume 3 - 2022 | https://doi.org/10.3389/fanim.2022.911673
This article is part of the Research TopicMitigating the Impact of Animal Production on the Environment: The Ecosystem IntegrationView all 8 articles
Urinary nitrogen (N) excretion (UN) as a proportion of N intake (NI; UN/NI) is a major determinant of N excretion from ruminants and could be predicted from the N isotopic discrimination occurring between dietary and animal proteins (Δ15N). This study investigated the usefulness of Δ15N and other plasma biomarkers to reflect changes in UN/NI from sheep offered different levels of dietary urea. Eighteen Merino rams (age, 1–2 years; live weight, 41 ± 3 kg) were allocated to three dietary N treatments for a N balance study. Treatments were control (C), control + 0.5% urea (C+0.5%), and control + 1.2% urea (C+1.2%) and designed to provide maintenance, maintenance plus an additional 15%, and maintenance plus an additional 33% NI, respectively. The urea effect term was used for one-way ANOVA and regression analysis. As NI increased, the UN and retained N (RN) increased linearly (p < 0.001), but UN/NI only increased in treatment C+1.2% compared with C (p < 0.05). Plasma Δ15N was positively and significantly correlated with UN and UN/NI (r = 0.52, p = 0.028; and r = 0.68, p = 0.002, respectively) and increased linearly (p < 0.001) with the highest values observed in C+1.2%. Urine δ15N changed linearly between C and C+1.2%, but plasma δ15N increased quadratically (p < 0.05). Plasma urea N increased in a linear way across dietary urea levels (p < 0.001). The N isotopic difference between plasma and urine (plasma δ15N–urine δ15N) of C did not vary from either of the other treatments; however, it differed between C+0.5% and C+1.2% (p < 0.05). The study confirmed the potential usefulness of plasma Δ15N to estimate UN/NI from sheep. Moreover, plasma δ15N–urine δ15N can be proposed as a new biomarker of N excretion from small ruminants. These approaches, however, need to be tested in various study conditions.
Ruminants are biologically inefficient utilizers of feed nitrogen (N). In general, dietary N loss from ruminants is 70%–80% (Calsamiglia et al., 2010), which is mainly attributed to urinary N (UN; Dijkstra et al., 2013). While this contributes to inefficient N utilization, it also exacerbates environmental pollution (Galloway and Cowling, 2002; Hristov et al., 2011). Therefore, it is important to reduce UN loss and the proportion of feed N intake (NI), which is partitioned into UN (UN/NI), both of which are used as a proxy to reflect potential N excretion from animal production systems to the environment. Feeding ruminants with high dietary N levels increase UN loss and the ratio of UN/NI (Niu et al., 2016). In contrast, reducing dietary N would reduce UN loss and UN/NI, but this may be economically undesirable for producers because it does not maximize animal performance.
The classical method for evaluating animal N partitioning (i.e., UN loss and UN/NI) is the N balance (NB; MacRae et al., 1993) technique. However, it is difficult for researchers to measure NB precisely, especially for larger numbers of grazing animals (MacRae et al., 1993), as the collection of total urinary and fecal output is required from each animal for several days. Moreover, estimating UN loss and UN/NI in ruminants is difficult due to the complex nature of N metabolism and its interaction with environmental conditions. Earlier studies (Herremans et al., 2019; Mendowski et al., 2020) showed that plasma N isotopic fractionation or discrimination between the animal and its diet (plasma Δ15N; plasma δ15N − feed δ15N), which occurs during animal digestion and metabolism (Cheng et al., 2011; Cantalapiedra-Hijar et al., 2015), was positively related to N excretion (i.e., UN loss and UN/NI) from large ruminants. Previous studies showed that digestion, rumen function, and metabolism may differ between large and small ruminants (Lapierre and Lobley, 2001; Doreau et al., 2003; Kawashima et al., 2007). Since most cited studies are with large ruminants, more research is still required (Lavery and Ferris, 2021; Khanaki et al., 2021) to explore this relationship, particularly as only three studies can be found (Cheng et al., 2013a; Bernard et al., 2020; Khanaki et al., 2021). The NI measurement is hard to measure in grazing systems, though it is needed to quantify N use efficiency (NUE) and UN/NI. The exploration of using plasma Δ15N to indicate these parameters needs only the collection of representative feed samples without measuring NI.
This study was conducted to determine if UN and UN/NI can be predicted by plasma Δ15N in sheep fed pure ryegrass hay with various levels of urea supplementation. We proposed that different urea supplementation could increase NI and microbial crude protein (MCP) synthesis and lead to increased UN and UN/NI, without altering other nutrients involved in sheep N partitioning (Table 1).

Table 1 Chemical composition of diets.
The current study was performed during April and May 2021 at the Dookie campus, the University of Melbourne. All experimental procedures involving sheep were approved by the University of Melbourne Animal Ethics Committee, application number 2015190.1. Eighteen Merino rams (41 ± 3 kg of live weight and age between 1 and 2 years) were used. The live weight and age were equal among treatments. Nine rams were allocated randomly in each period of the 21-day NB study (3 rams/treatment/period). Three dietary treatments were designed to provide increasing NI allowances, as follows: control (C) with maintenance NI allowance; C + 0.5% urea (C+0.5%) with maintenance plus an additional 15% NI allowance; and C + 1.2% urea (C+1.2%) with maintenance plus an additional 33% NI allowance delivered by adding extra N in the feed (Table 1).
Urea supplementation was achieved by spraying urea on the ryegrass to increase hay CP level without altering the concentration of other nutrients; one unit of urea was mixed with five units of water before being sprayed on ryegrass hay, and the urea-treated feed was kept and tied in nylon bags, 6 days prior to feeding the sheep. Each treatment was fed for 13 days in individual animal pens followed by 8 days in individual metabolic cages, including 2 days for acclimatization and 6 days as measurement days for an NB study.
Before the study commenced, all animals were grazed on fresh pasture. Pure ryegrass hay was fed to the animal prior to the adaptation days. Ryegrass hay was fed to the animals prior to the adaptation period, and during measurement periods, all offered feed was consumed. Sheep were fed twice per day at 8 a.m. and 4 p.m. (with an identical and restricted dry matter (DM) intake (DMI) of 0.97 kg/day), and drinking water was freely available. Throughout the study, sheep were healthy with no clinical symptoms of any disease.
Feed refusals were measured once a day to determine the total DMI for each sheep throughout the study. Feed samples were collected twice per day (at 8 a.m. and 4 p.m.) from each sheep for 6 days at feeding time. Daily urine and feces output were measured at 8.30 a.m. during the measurement days, and subsamples were collected and stored at −20°C. The urine from each sheep was collected into a container that included 225 ml of 10% sulfuric acid (H2SO4) prior to collection to keep the urine pH below 3. A bucket with a layer of plastic mesh was placed under the drainage funnel under each metabolism cage (1.2 m × 0.55 m), to allow urine to drain through the mesh, and feces was left on top of the mesh for collection. Blood samples were collected from the jugular vein into 10-ml Li-heparinized evacuated tubes on the last measurement day at 1.30 p.m. Subsequently, plasma was obtained after centrifugation (15 min, 1,200 × g at 4°C). Plasma samples were stored at −20°C for further biochemical analysis.
Plasma, feed (freeze-dried), and feces (oven-dried) samples were analyzed for δ15N according to the procedure described by Cheng et al. (2011), using isotope-ratio mass spectrometry (PDZ Europa Ltd, Crewe, UK), that is, the 15N/14N ratio in the test sample relative to the 15N/14N ratio in the standard (air). The equation [MJ ME/kg of DM = 0.203 × digestibility of organic DM (DOMD; %) − 3.001] was used to predict the dietary ME content (Ministry of Agriculture, Fisheries and Food, 1990). The average daily live weight (g/day) for each animal was determined as the coefficient of the linear regression of live weight (g) over time (days). Feed subsamples were dried (103°C for 24 h) for determination of DM, while another subsample was oven-dried (at 60°C for 72 h) and ground through a 1-mm sieve for subsequent chemical analyses. Feed samples were analyzed for organic matter (OM; 550°C for 6 h) and neutral detergent fiber (NDF) (Van Soest et al., 1991) using a Fibersac analyzer (Ankom Technology Corporation, Fairport, NY, USA). The Kjeldahl method was used to analyze the N concentration in feed (freeze-dried) and feces (oven-dried), and the N concentration of urine (room temperature thawed urine) was analyzed by the Variomax CN analyzer (Elementar Analyzer Systeme GmbH, Hanau, Germany). The sum of allantoin and uric acid was considered as urinary excretion of purine derivatives (PD). Allantoin and uric acid were measured using colorimetric and uricase (kit No. 685-50; Sigma Chemical Co., St. Louis, MO, USA) methods, respectively, as described by Chen and Gomes (1992). To analyze plasma urea N (PUN) and plasma glucose, enzymatic kinetic methods were used on a Daytona RX Clinical Analyzer (Randox, Nishinomiya, Japan). Two liver enzyme activities, alanine aminotransferase (ALT) and aspartate aminotransferase (AST), were measured using methods according to the International Federation of Clinical Chemistry (IFCC). The retained N (RN) (g/day), NUE (%), and apparent N digestibility (ND; %) were calculated by the following equations, respectively:
The statistical package of GenStat (version 16; VSN International Ltd., Hemel Hempstead, UK) was used for linear and quadratic regressions and one-way ANOVAs. As sheep were the replication unit in this study, the average value for each measured parameter per treatment was used for statistical analysis. The significant linear and quadratic effects were performed using one-way ANOVA with urea as a treatment factor and period as a block. The significant thresholds were set at p-value < 0.05; trends were reported at 0.05 < p-value < 0.10.
As shown in Table 2, there was no significant quadratic effect; all significant responses were linear in nature. The NI for treatments C, C+0.5%, and C+1.2% were 22.1, 23.5, and 27.6 g/day, respectively, increasing with higher urea supplementation (p < 0.001). As NI increased, the UN (p < 0.001), manure N (p < 0.001), and RN (p < 0.05) increased linearly. Treatment C+1.2% excreted the most UN (9.6 g/day), whereas treatment C excreted the least (6.7 g/day; p < 0.001). The UN/NI and UN/FN only increased between treatment C to treatment C+1.2% (from 0.30 to 0.35 and 0.8 to 1.1 g/g, respectively; p < 0.05). The PUN increased linearly (p < 0.001), as dietary non-protein N increased, and it was higher in C+1.2% (5.8 mmol/L). The digestibility of N (i.e., ND% and DMD%), urinary PD, plasma glucose, and NUE were not affected by dietary urea supplementation and did not change across treatments (Tables 2, 3).
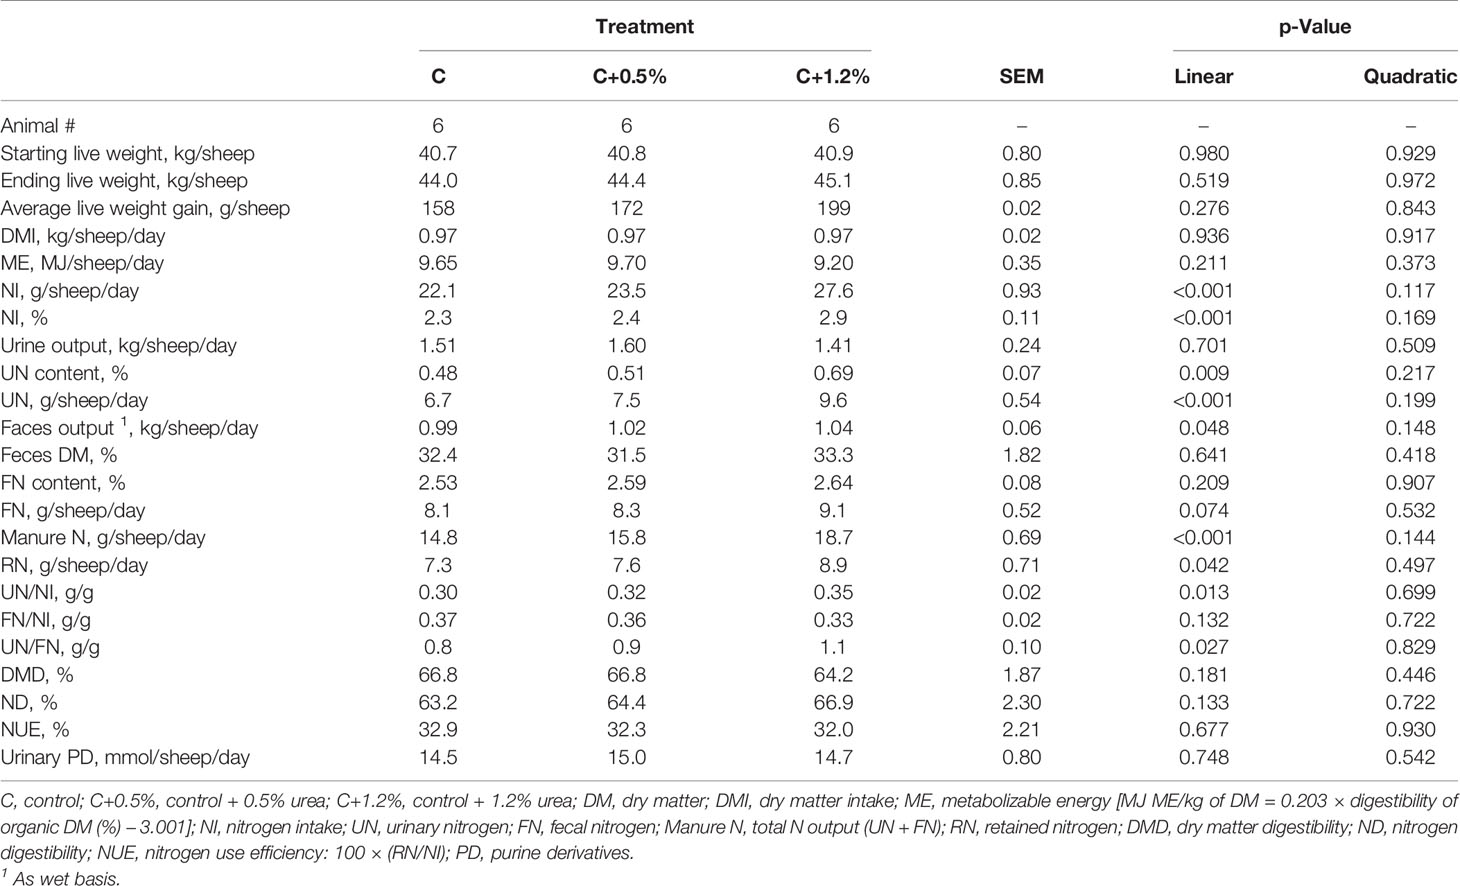
Table 2 Nitrogen (N) partitioning in sheep offered three different levels of non-protein N.
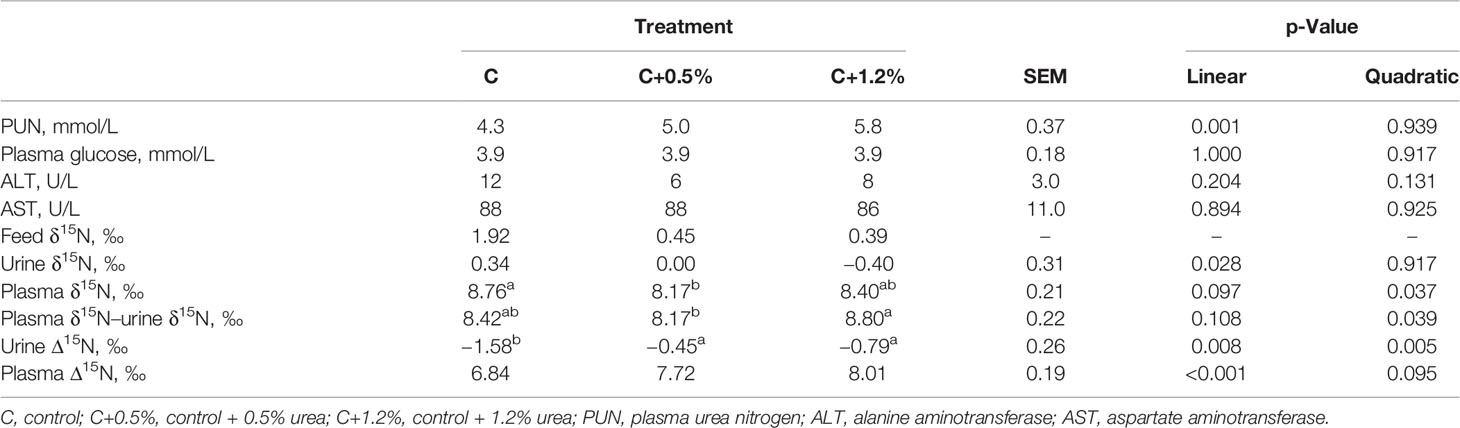
Table 3 Plasma urea nitrogen (PUN), plasma glucose, and natural enrichment of N-15 in feed, urine, and plasma, and nitrogen isotopic discrimination (Δ15N) of sheep offered three different levels of non-protein N.
Urine δ15N only changed linearly between C and C+1.2%, but plasma δ15N altered quadratically (p < 0.05) and tended to be significant linearly (p = 0.097) between C and C+0.5% (Table 3). The plasma δ15N minus urine δ15N was significantly different between C+0.5% and C+1.2% (p < 0.05). The Δ15N between urine and diet (urine Δ15N) increased linearly and quadratically (p < 0.01), across the increase in the urea levels. Plasma Δ15N increased linearly (p < 0.001), and it was the highest in C+1.2% (8.01‰ compared to 6.84‰ and 7.72‰ in C and C+0.05%, respectively).
As shown in Table 4, plasma Δ15N was positively and significantly correlated with UN (r = 0.52; p = 0.028) and manure N (r = 0.56; p = 0.016) as well as UN/NI (r = 0.68; p = 0.002). Despite a lack of correlation with RN (p > 0.05), plasma Δ15N was significantly negatively correlated with NUE (r = −0.65; p = 0.003). Urine Δ15N was positively correlated with manure N (r = 0.47) and UN/NI (r = 0.53) at the same significant level (p < 0.05). Plasma δ15N–urine δ15N was positively correlated with UN/NI (r = 0.50; p = 0.036) and negatively with NUE (r = −0.59; p = 0.010). The PUN was also positively correlated with NI (r = 0.78; p < 0.001), UN (r = 0.72; p < 0.001), manure N (r = 0.71; p < 0.001), UN/NI (r = 0.50; p = 0.033), UN/FN (r = 0.55; p = 0.019), and RN (r = 0.53; p = 0.025). Among all abovementioned biomarkers, only urine Δ15N was correlated with ALT (r = −0.50; p = 0.034) as a reflection of liver function. Moreover, a positive significant relationship between plasma Δ15N and urine Δ15N (r = 0.79; p < 0.001) as well as urine Δ15N with PUN (r = 0.48; p = 0.044) was found.
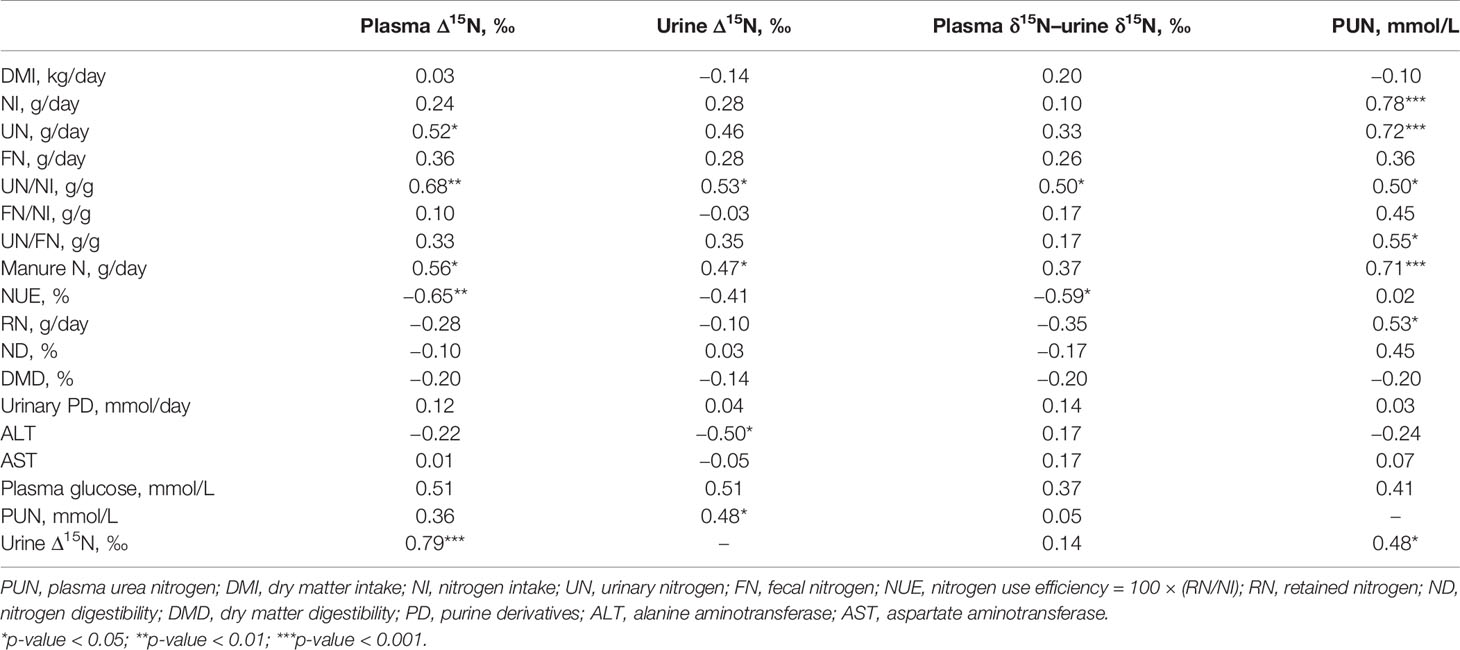
Table 4 Pearson’s correlation coefficients (r) between plasma nitrogen (N) isotopic discrimination (plasma Δ15N), urine Δ15N, and plasma urea N (PUN) with N partitioning variables in sheep.
When diets were supplemented with urea to increase NI, which ranged from 22.1 and 23.5 to 27.6 g/day, the UN increased (C, C+0.5%, and C+1.2% excreted 6.7, 7.5, and 9.6 g/day, respectively; Figure 1). Moreover, when NI increased, manure N increased, which agrees with studies conducted in lactating dairy cows (Colmenero and Broderick, 2006; Kidane et al., 2018) and in mature rams Khanaki et al., 2021). The UN/NI ranged between 0.3 and 0.4 g/g, which was lower than reported by Brand et al. (1992) and within the range observed in other studies (Bernard et al., 2020; Khanaki et al., 2021), and both UN/NI and UN/FN increased significantly from treatment C to treatment C+1.2%. The positive impact of N content on RN was observed, and non-significant sheep average daily live weight gain (158, 172, and 199 g for C, C+0.5%, and C+1.2%, respectively) may explain in part why RN increased with increasing NI (p < 0.001; Figure 2). In contrast, with increasing animal age, less protein is retained, and metabolizable protein requirements decline (Institut national de la rechere agronomique (INRA), 2018), which may cause increased UN/NI if protein supply is not adjusted. However, in this study, the increased UN/NI is due to increased dietary non-protein N. The amount of FN did not change with increasing NI. This result is consistent with the other reports (Niu et al., 2016; Kidane et al., 2018), which showed that as animals consume more N, there is less of an increase in FN than UN. The explanation for finding a non-significant dietary impact on NUE might be due to the methodological limitation of NB studies. Spanghero and Kowalski (1997) indicated that as NI increased, the errors (overestimation) of NB increased. Inconsistent with study results by Ferris et al. (1999) in dairy cows, by adding urea supplementation into the diet in the current study, ND% was not significantly different among treatments.
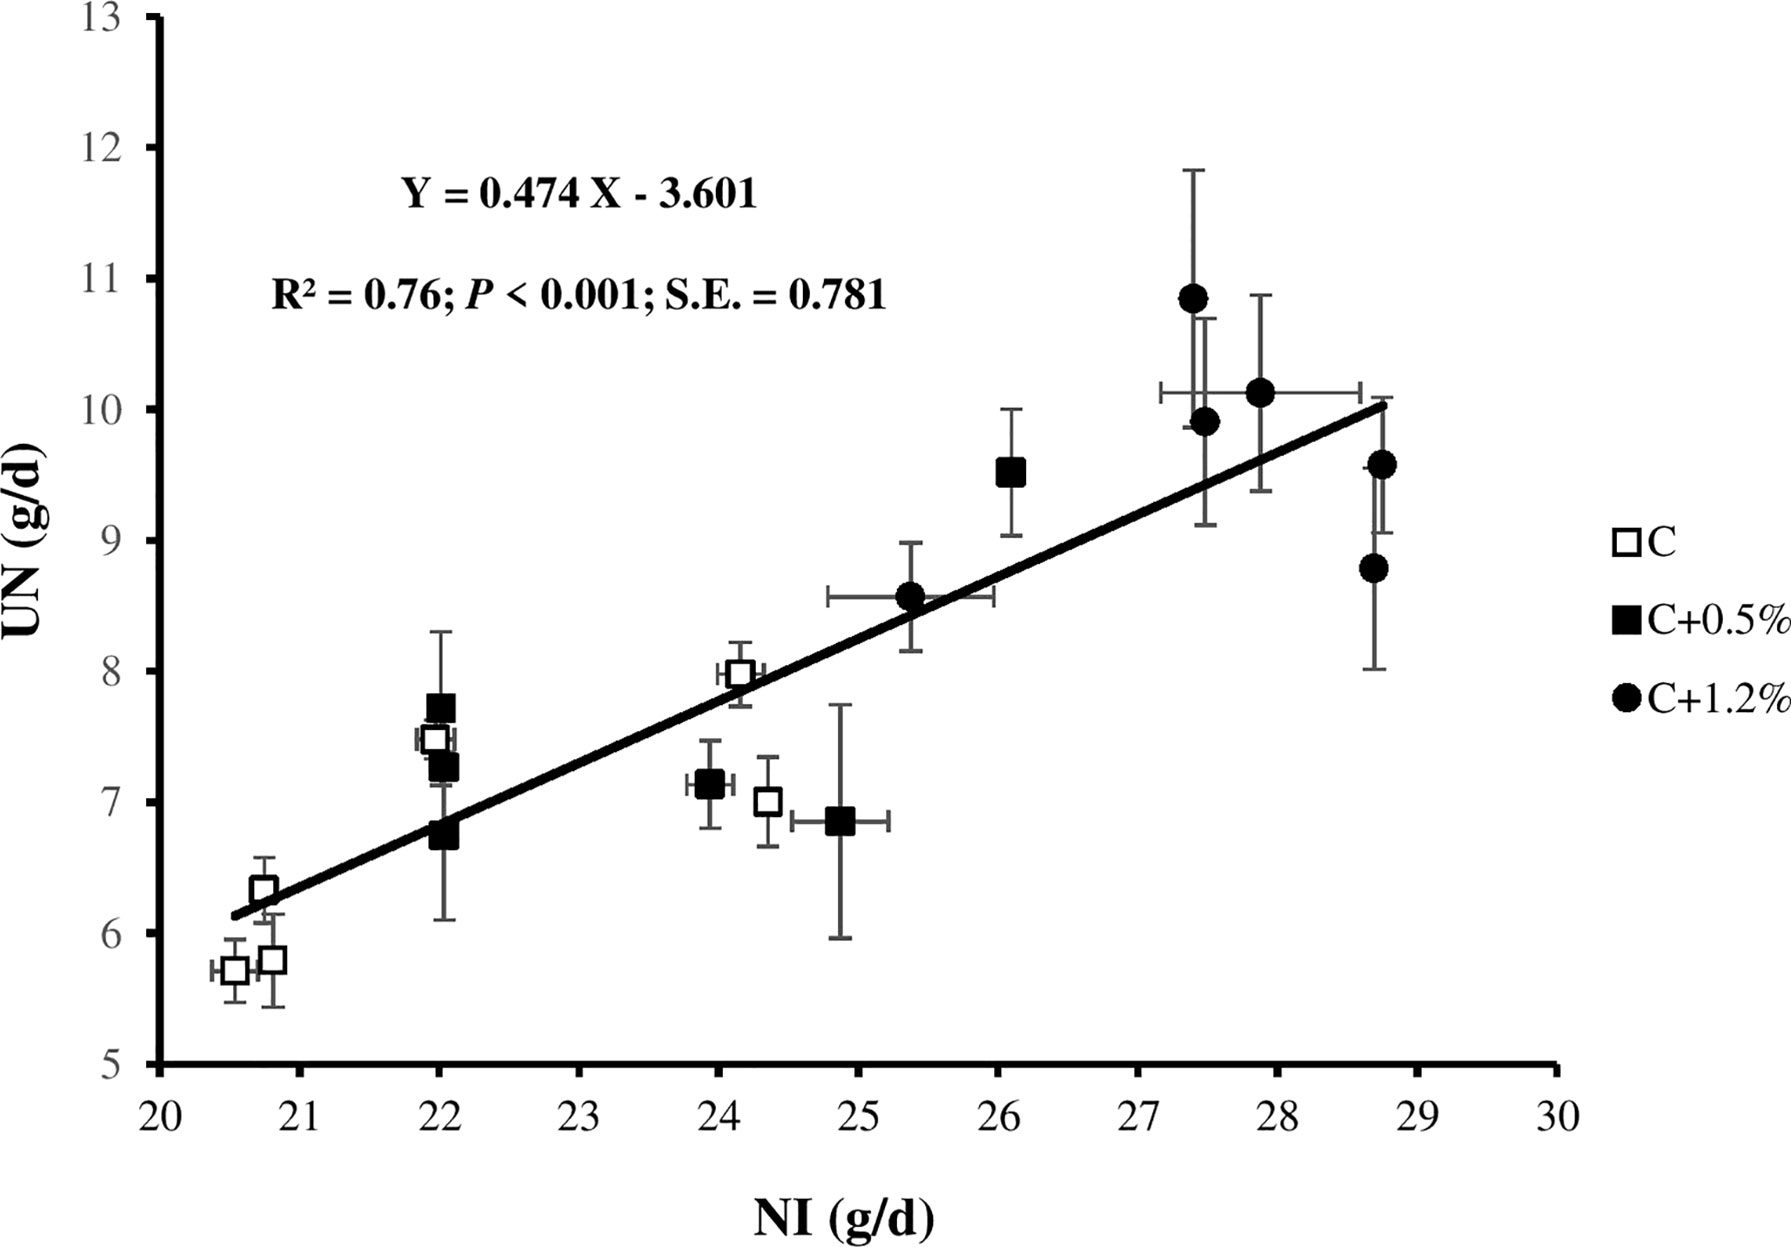
Figure 1 Relationship between urinary nitrogen (UN) and N intake (NI) for individual observations of the sheep offered three different levels of non-protein N: C, control dietary treatment with maintenance NI allowance; C+0.5%, control dietary treatment with maintenance plus an additional 15% NI allowance; C+1.2%, control dietary treatment with maintenance plus an additional 33% NI allowance. The error bars show SE.
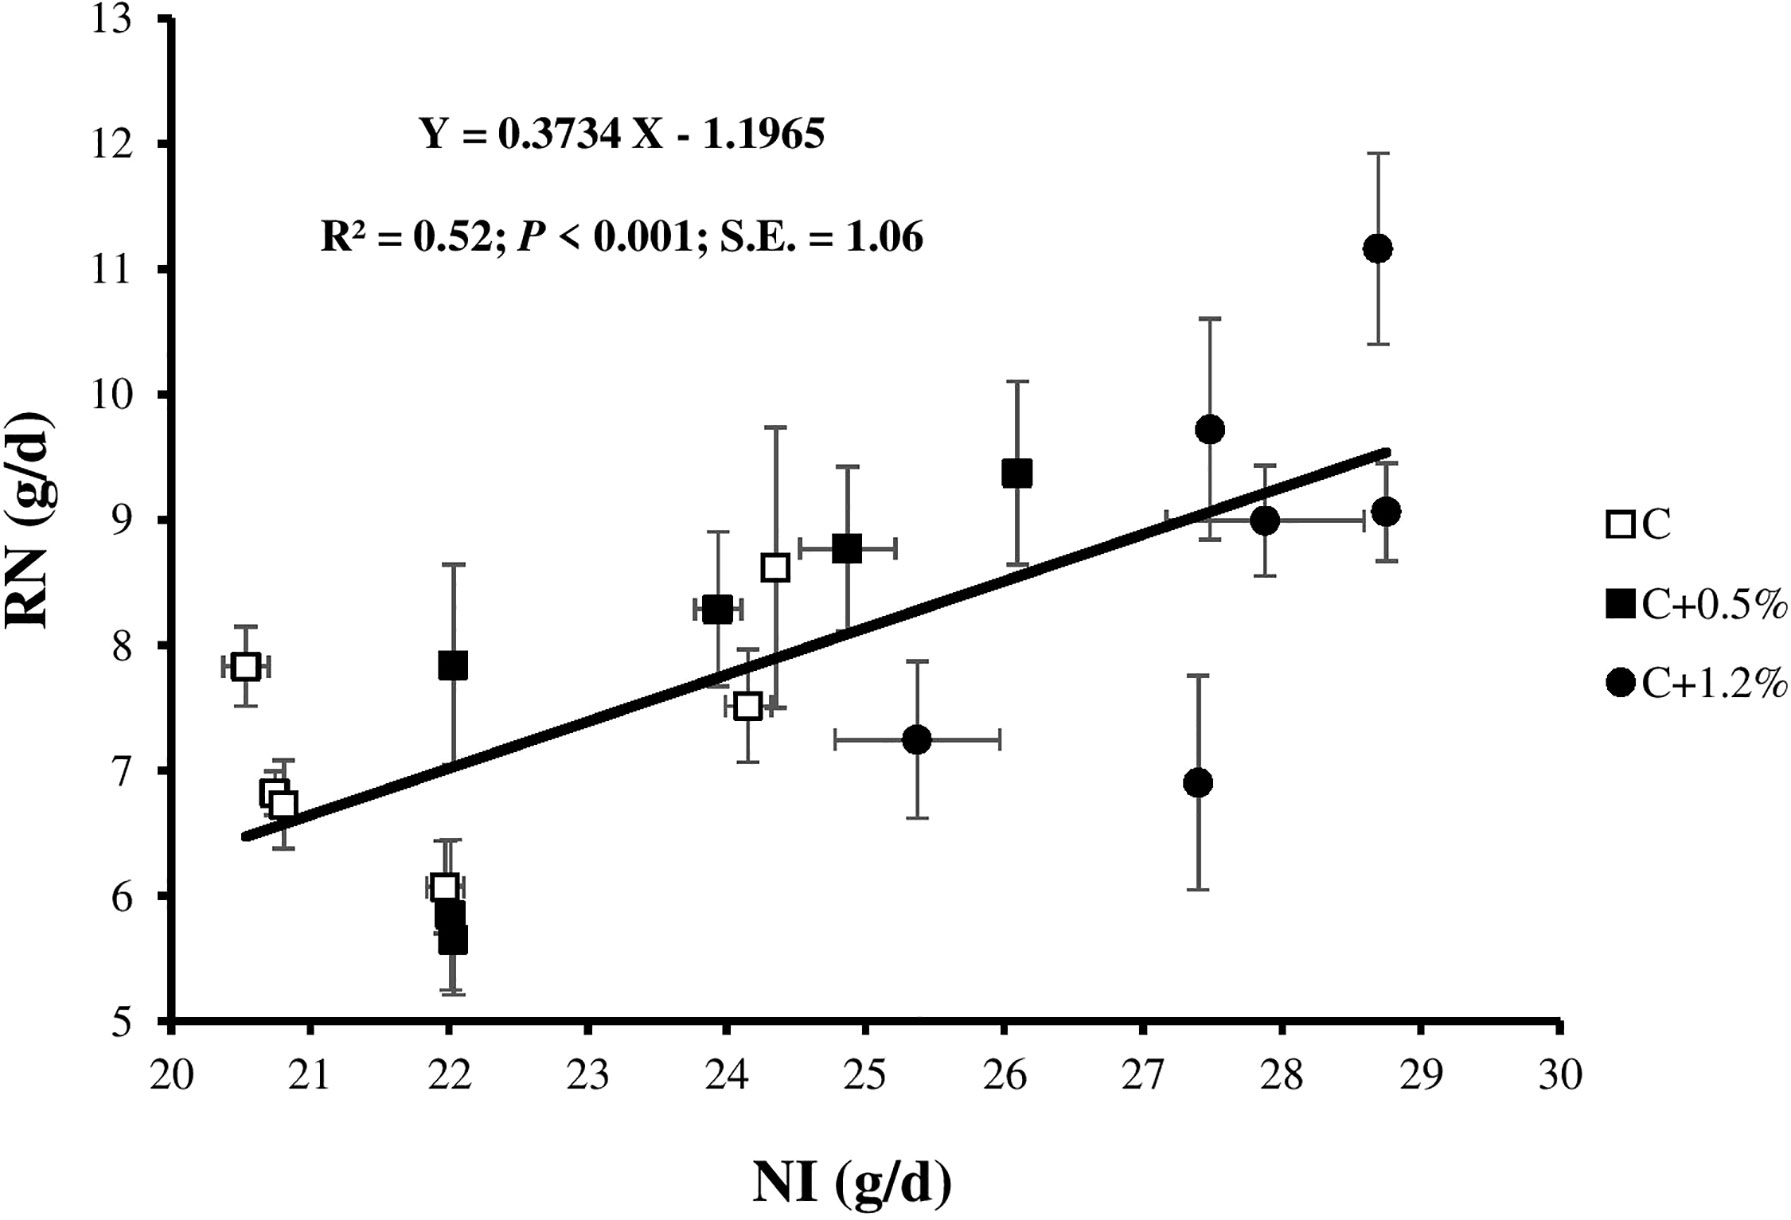
Figure 2 Relationship between retained nitrogen (RN) and N intake (NI) for individual observations of the sheep offered three different levels of non-protein N: C, control dietary treatment with maintenance NI allowance; C+0.5%, control dietary treatment with maintenance plus an additional 15% NI allowance; C+1.2%, control dietary treatment with maintenance plus an additional 33% NI allowance. The error bars show SE.
Plasma Δ15N needs a representative feed sample, which can be hard to achieve in grazing systems. Use of plasma δ15N–urine δ15N requires no feed samples, as long as representative urine samples can be obtained (e.g., multiple urine samples from cows at milking). To the best of our knowledge, this is the first study to introduce plasma δ15N–urine δ15N as a new biomarker to detect N excretion from ruminants.
On average, plasma was enriched in 15N by 7.52‰, while urine was depleted in 15N by 0.94‰ relative to the diet (Table 3). Most of the N in plasma is true protein, which was previously shown to be enriched in 15N (Cheng et al., 2010; Cheng et al., 2016). In contrast, the main source of N in the urine is urea, which is reported to be depleted in 15N (Steele and Daniel, 1978; Cheng et al., 2016). The range of plasma Δ15N values in this study is higher than the range stated in previous studies (Cheng et al., 2013a; Cheng et al., 2016; Bernard et al., 2020; Khanaki et al., 2021). We have no explanation for the differences between these previous studies and our current study, as all sheep were healthy and unstressed throughout the experiment. However, unclear biological or physiological reasons may cause the different plasma δ15N values (Lee et al., 2012). Nonetheless, the higher plasma δ15N led to the higher plasma Δ15N. In this study, plasma Δ15N reflected N partitioning including UN (r = 0.52; p < 0.05; Figure 3), UN/NI (r = 0.68; p < 0.01; Figure 4), and manure N. The results are consistent with the results of other studies (Cheng et al., 2013a; Bernard et al., 2020), as they earlier confirmed the usefulness of using plasma Δ15N for estimating N excretion (i.e., UN and UN/NI) from small ruminants.
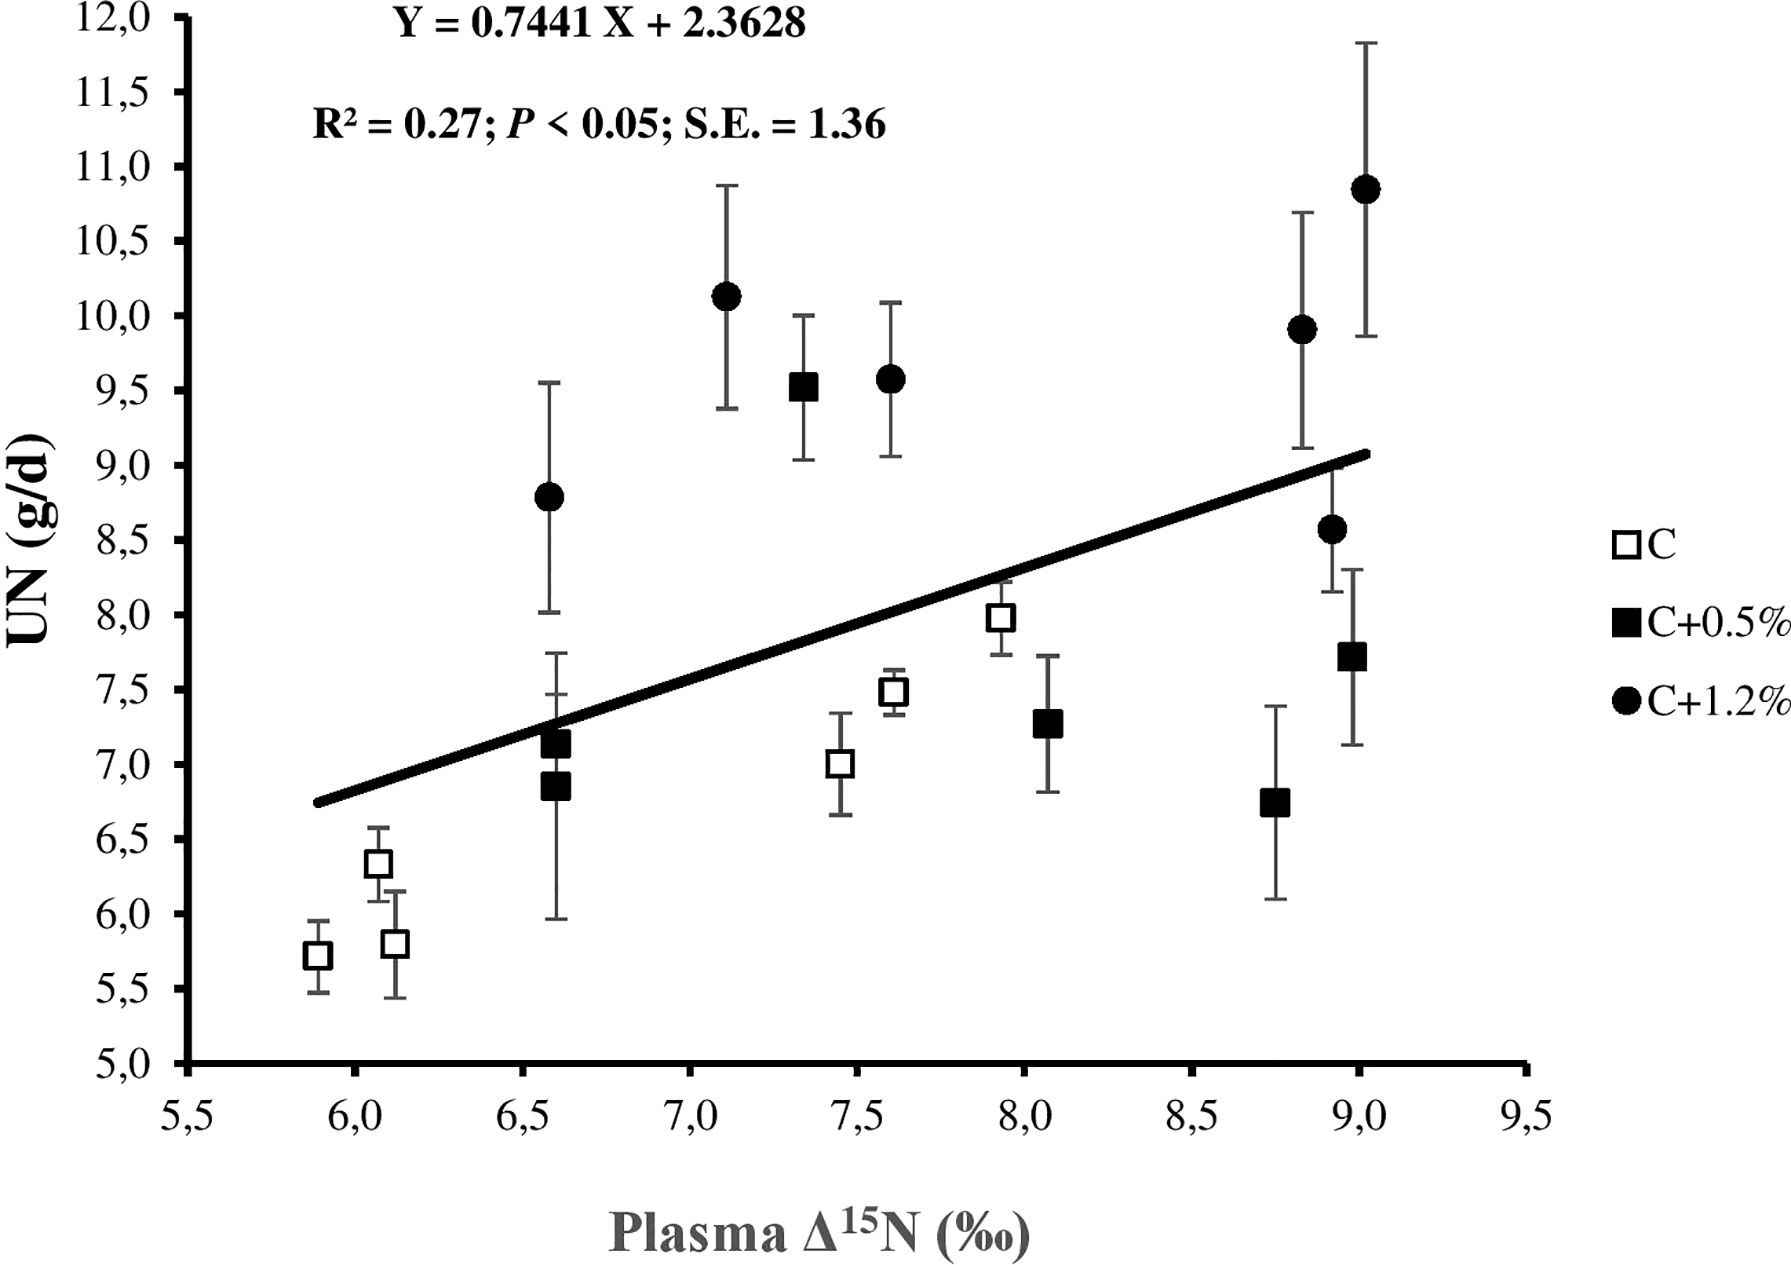
Figure 3 Relationship between urinary nitrogen (N; UN) and plasma N isotopic discrimination (plasma Δ15N) for individual observations of the sheep offered three different levels of non-protein N: C, control dietary treatment with maintenance N intake (NI) allowance; C+0.5%, control dietary treatment with maintenance plus an additional 15% NI allowance; C+1.2%, control dietary treatment with maintenance plus an additional 33% NI allowance. The error bars show SE.
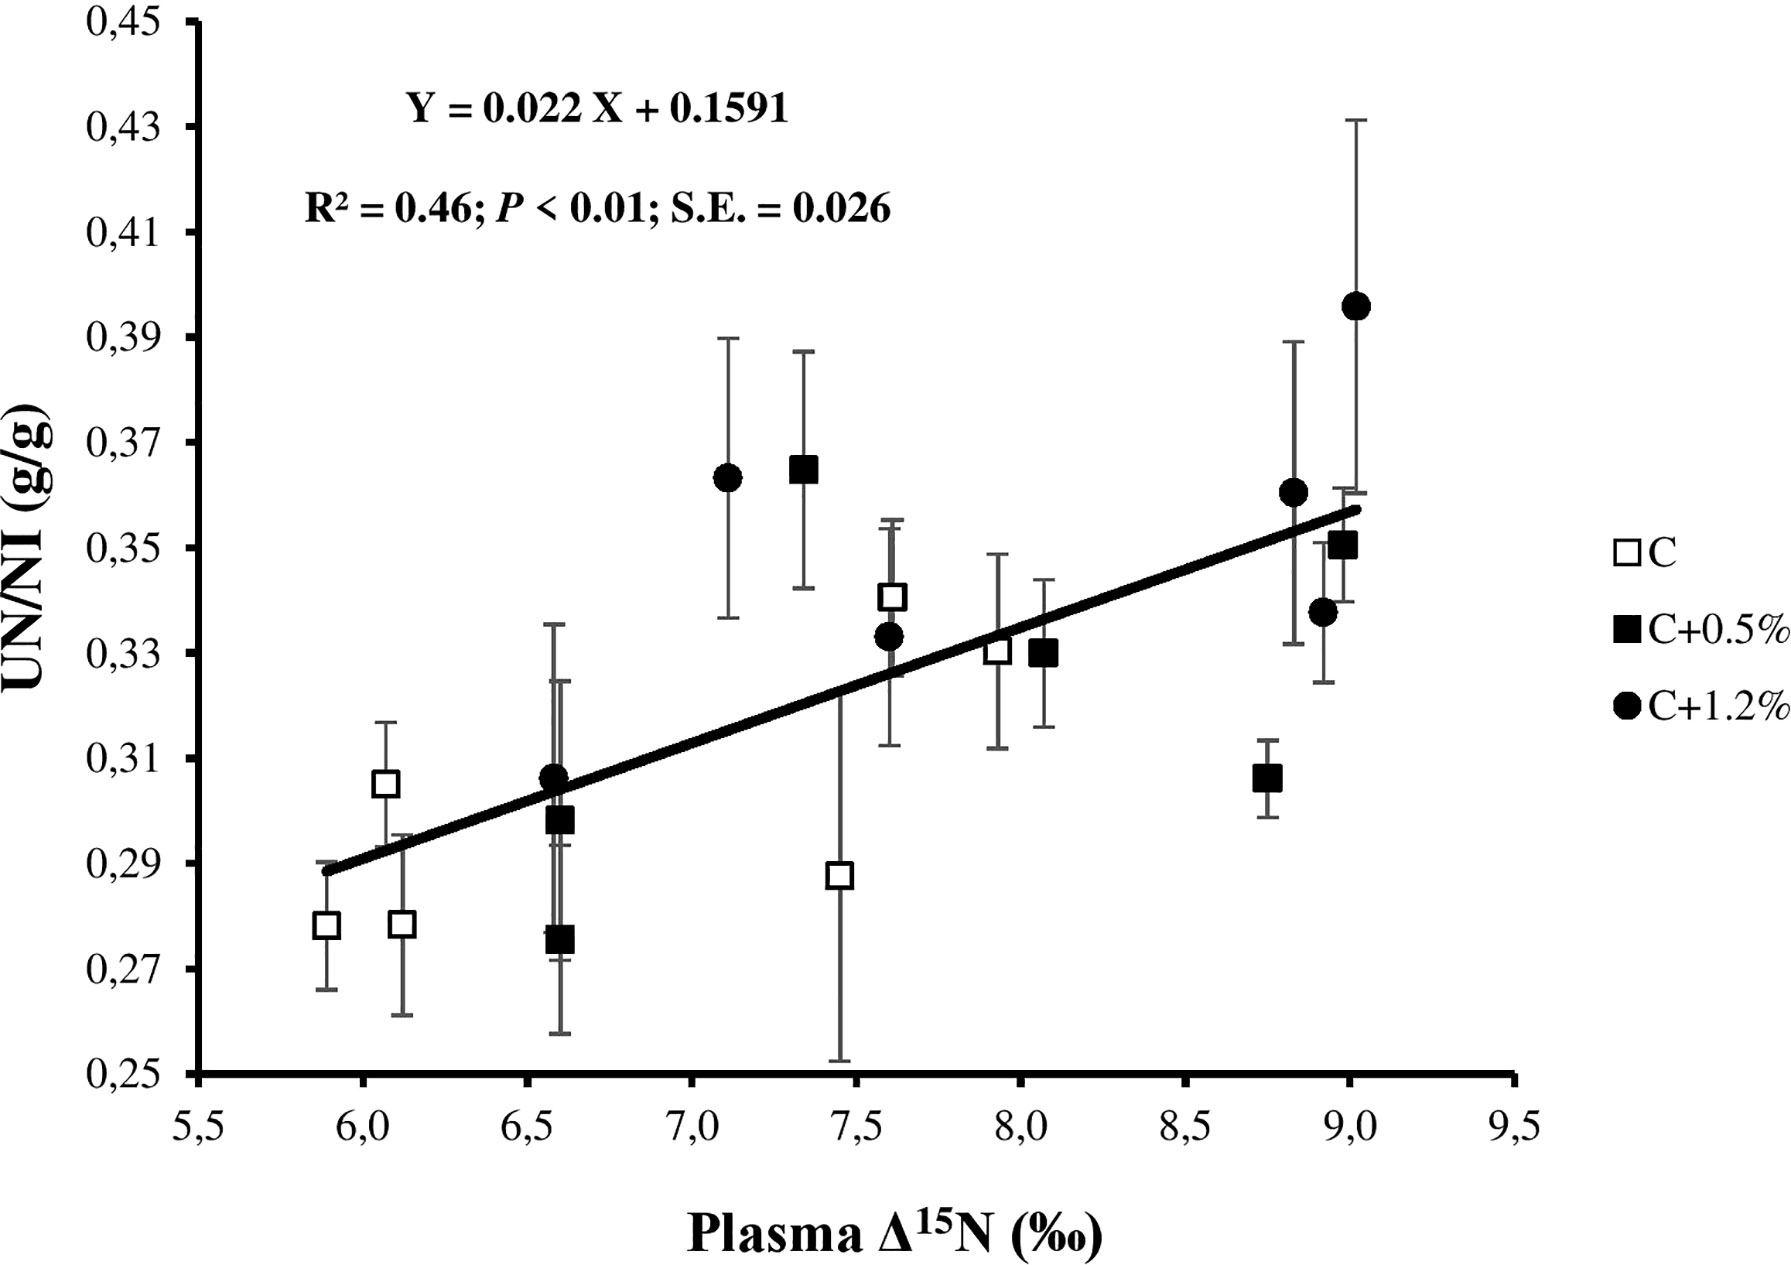
Figure 4 Relationship between urinary nitrogen (N; UN) to N intake (NI) ratio (UN/NI) and plasma N isotopic discrimination (plasma Δ15N) for individual observations of the sheep offered three different levels of non-protein N: C, control dietary treatment with maintenance N intake (NI) allowance; C+0.5%, control dietary treatment with maintenance plus an additional 15% NI allowance; C+1.2%, control dietary treatment with maintenance plus an additional 33% NI allowance. The error bars show SE.
The urine Δ15N value for treatment C was lower than the range, and for treatments C+0.5% and C+1.2%, urine Δ15N values were in the range reported by Cheng et al. (2016). Plasma δ15N–urine δ15N was also positively correlated with UN/NI, but this relationship was not reported in any other NB studies. This result indicated the potential use of this proxy to estimate N excretion, without the need to know the composition of dietary intake. The positive correlations between plasma δ15N and urine δ15N (Figure 5) are consistent with one of our previous studies (unpublished data). Kohn et al. (2005) showed the potential for using PUN as an appropriate biomarker to evaluate N partitioning. In the present study, PUN concentrations were also related to the difference in N partitioning (i.e., NI, UN, UN/NI, UN/FN, manure N, and RN) in C+1.2% compared to the other two treatments and were within the range described by Kohn et al. (2005).
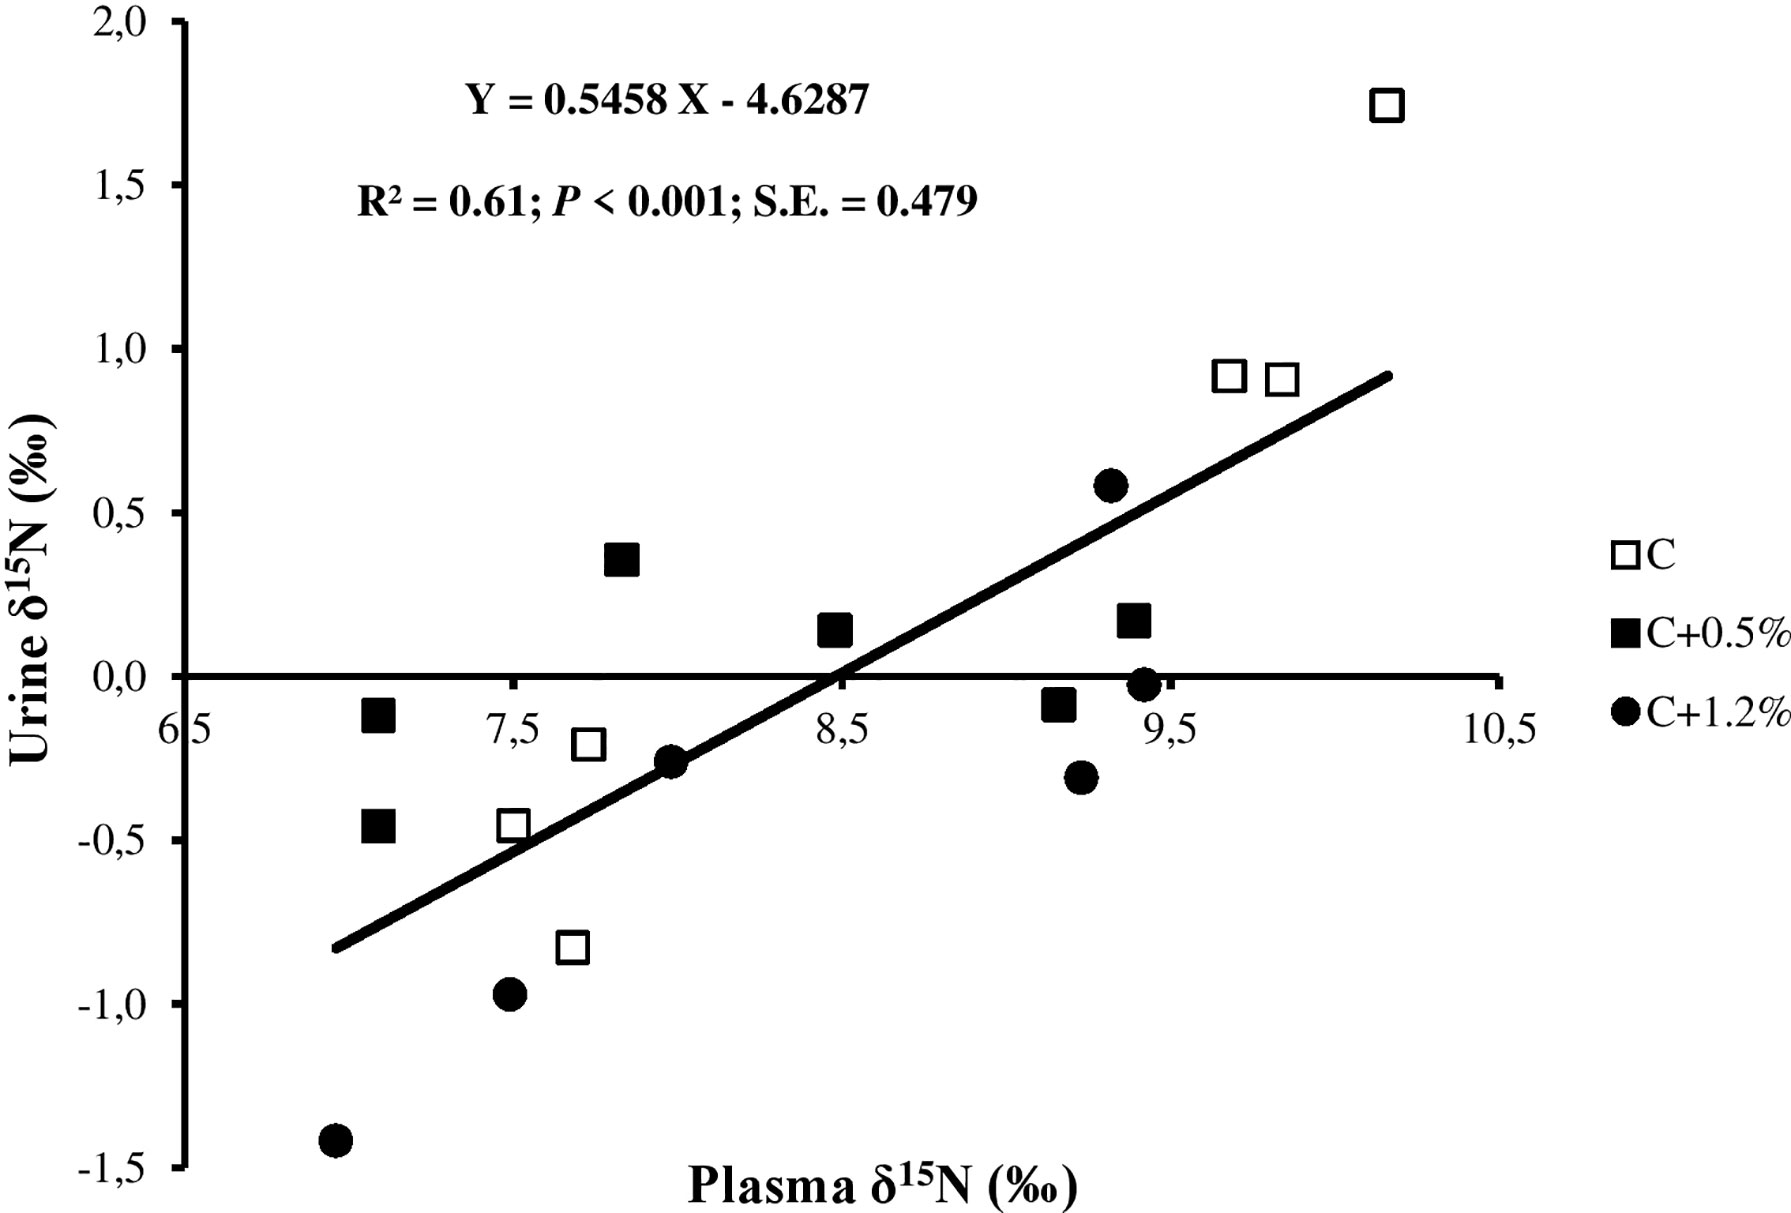
Figure 5 Relationship between urine δ15N and plasma δ15N for individual observations of the sheep offered three different levels of non-protein N: C, control dietary treatment with maintenance N intake (NI) allowance; C+0.5%, control dietary treatment with maintenance plus an additional 15% NI allowance; C+1.2%, control dietary treatment with maintenance plus an additional 33% NI allowance. The error bars show SE.
Previous studies (Sick et al., 1997; Cheng et al., 2011; Cantalapiedra-Hijar et al., 2015) have shown that plasma Δ15N originates from animal digestion (i.e., rumen site) and metabolism (i.e., liver site). Moreover, Zuntz (1981) suggested that rumen microflora have the capabilities to break down cellulose (as an energy source) and convert non-protein N (i.e., urea) to microbial protein. However, in the current study, offering different NI to the animals and similar urinary PD results across treatments could be interpreted as a lower efficiency of MCP synthesis. The explanations for this result are as follows: 1) the sheep were fed marginally above their requirement, possibly explaining the limited change in MCP and 2) the fact that productivity and efficiency do not always go together. For instance, a greater supply of MCP leads to greater milk protein yield or live weight gain but lower MCP efficiency use (National Research Council (NRC), 2001; Institut national de la recherche agronomique (INRA), 2018). In general, and when talking about N whether in digestion or metabolism, increased supply translates to higher productivity but lower efficiency.
The less efficiently the animals use dietary N, the higher the plasma Δ15N (Sick et al., 1997; Cheng et al., 2013a and Cheng et al., 2013b; Cantalapiedra-Hijar et al., 2018). Some other studies (Cheng et al., 2011; Bernard et al., 2020; Khanaki et al., 2021) showed that the NUE decreased when NI increased. However, in the present study, NUE did not change when NI increased from treatment C to treatment C+1.2%. There are three possible reasons for this: 1) the variation in NI among treatments was insufficient to differentiate NUE; 2) the sheep were fed marginally above their requirement, possibly explaining the inability to differentiate NUE; and 3) the errors of NB increased when NI increased. Spanghero and Kowalski (1997) illustrated the difficulties of the NB technique and its tendency to overestimate RN, even when well conducted. A negative significant relationship between NUE and plasma Δ15N (p < 0.01; Figure 6) is similar to the other studies’ reports (Cheng et al., 2013a; Bernard et al., 2020; Khanaki et al., 2021) and the result of a meta-analysis (Cantalapiedra-Hijar et al., 2018).
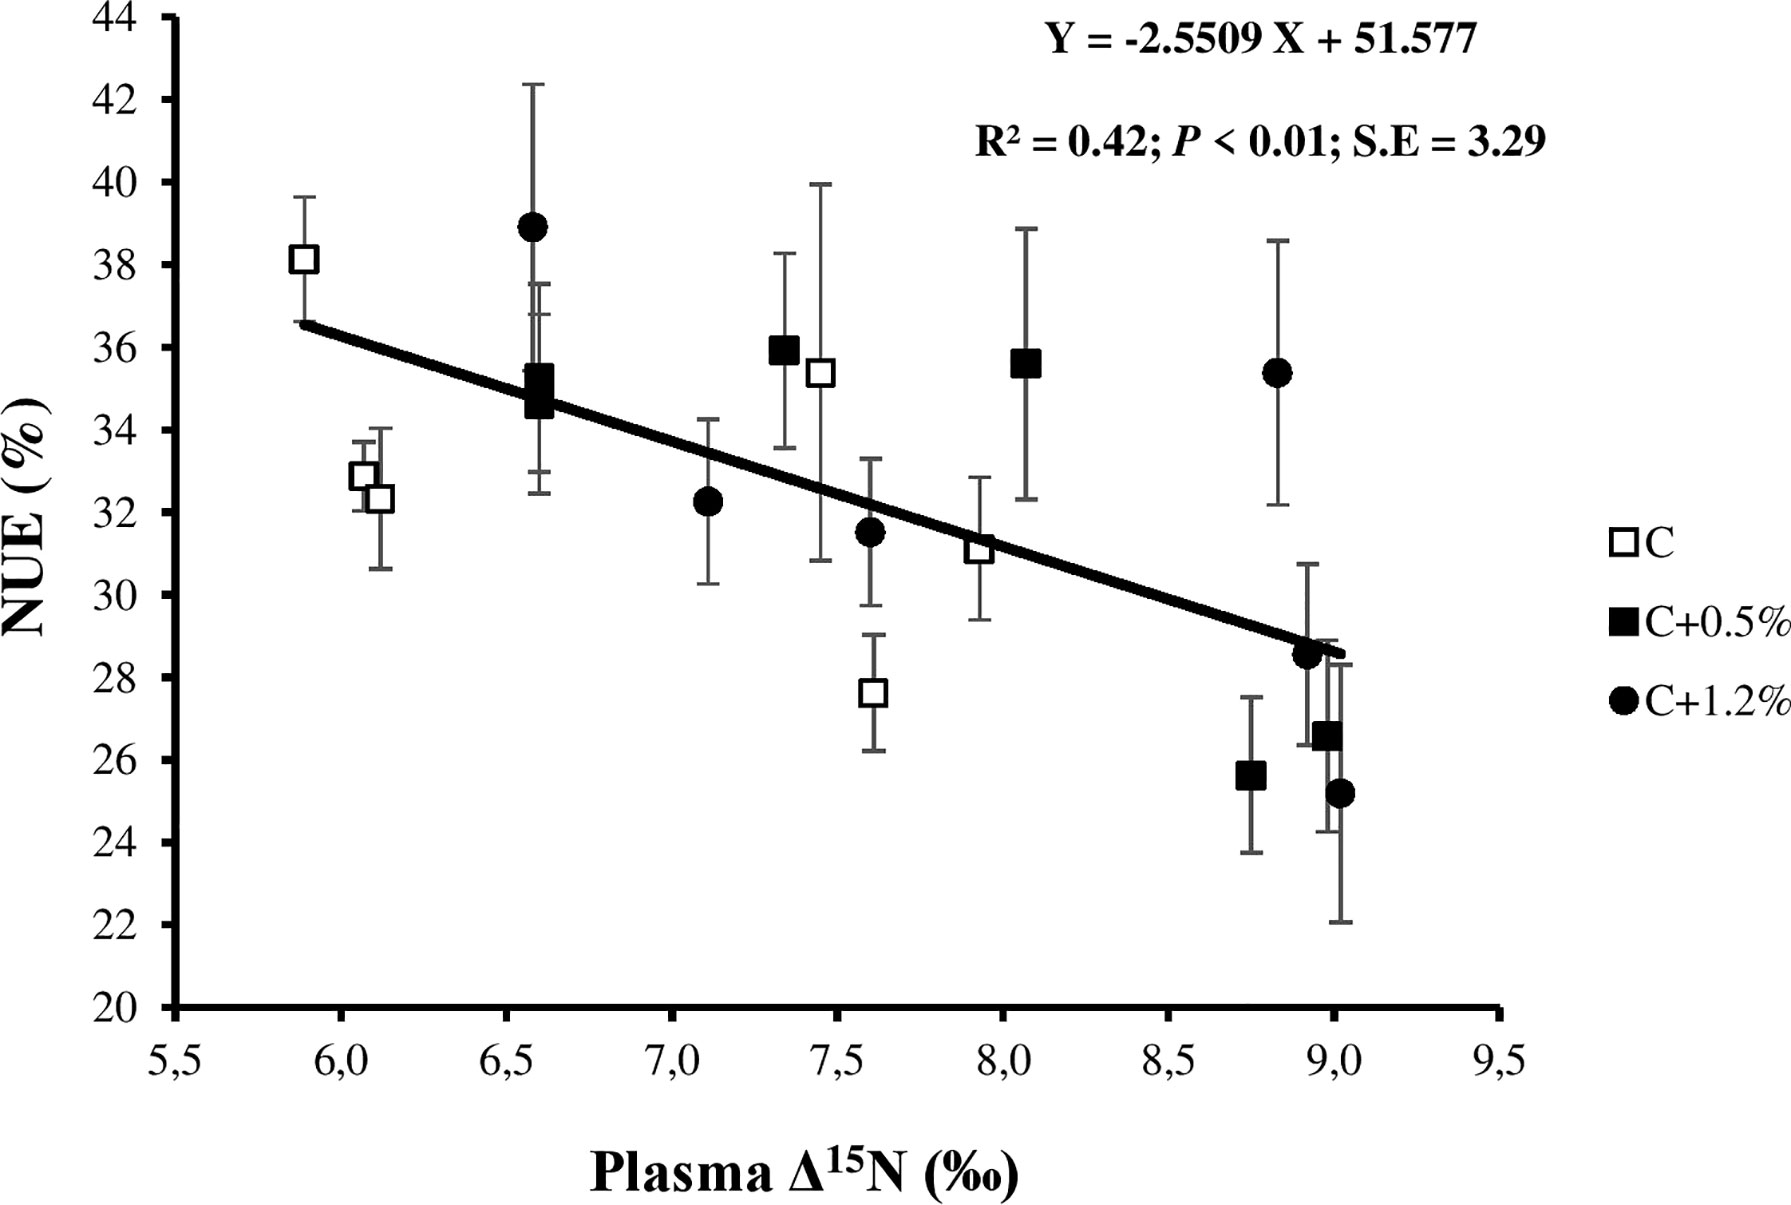
Figure 6 Relationship between nitrogen (N) use efficiency (NUE) and plasma N isotopic discrimination (plasma Δ15N) for individual observations of the sheep offered three different levels of non-protein N: C, control dietary treatment with maintenance N intake (NI) allowance; C+0.5%, control dietary treatment with maintenance plus an additional 15% NI allowance; C+1.2%, control dietary treatment with maintenance plus an additional 33% NI allowance. The error bars show SE.
Plasma Δ15N correlation with NI was low, which suggested that plasma Δ15N was not highly impacted by NI in the current study. There was a significant relationship between UN and plasma Δ15N (r = 0.52), as the animals ate the same diet and differentiated only in NI through urea supplementation. The result is consistent with previous studies by Bernard et al. (2020) and Khanaki et al. (2021), suggesting that plasma Δ15N is more related to UN rather than NUE, likely because some of the mechanisms underlying the latter (i.e., N mobilization) do not fractionate N isotopes. A positive significant relationship between UN/NI and plasma Δ15N (Figure 4) is consistent with the results of other studies (Cheng et al., 2011; Cheng et al., 2013a; Bernard et al., 2020; Khanaki et al., 2021). This emphasized the potential to use plasma Δ15N to estimate UN/NI, which is hard to measure in in-field conditions (Spanghero and Kowalski, 1997), especially under production systems of grazing ruminants (Cheng et al., 2018). Moreover, the ND and DMD relationships with plasma Δ15N (r = −0.10 and r = −0.20, respectively) were low, suggesting that the effect of the overall digestion process on the relationship between UN/NI and Δ15N is limited.
As NI increased by adding more non-protein N to the diet, the UN and UN/NI increased, but the NUE had a limited response to NI in this study. The change in UN and UN/NI was reflected by plasma Δ15N changes. The results support the view that the efficiency of N use in the rumen was highly contrasted across treatments and may have a role in the observed plasma Δ15N. Positive and negative linear relationships between UN/NI and NUE with plasma Δ15N, respectively, were observed. The study showed the potential use of plasma δ15N–urine δ15N to quantify N excretion and NUE from sheep. Moreover, the results demonstrated that plasma Δ15N works better than the other available biomarkers for reflecting changes in N partitioning, including both N excretion and the efficiency of N use from the ruminants. Further research is required to explore these relationships in sheep of different physiological statuses and offered diets differing widely in N.
The raw data supporting the conclusions of this article will be made available by the authors, without undue reservation.
The animal study was reviewed and approved by The University of Melbourne Animal Ethics Committee.
HK: conceptualization, methodology, sampling, data analysis, writing—original draft, and revising. RD: supervision, methodology (supporting), data analysis (supporting), editing, and finalizing the paper for submission. BL: supervision, editing, and finalizing the paper for submission. GC-H: editing and finalizing the paper for submission. LC: supervision, conceptualization (lead), methodology (supporting), data analysis (supporting), writing—review and editing, and finalizing the manuscript for submission. All authors contributed to the article and approved the submitted version.
The authors declare that this study is fully funded by the Faculty of Veterinary and Agricultural Sciences, the University of Melbourne.
The authors declare that the research was conducted in the absence of any commercial or financial relationships that could be construed as a potential conflict of interest.
All claims expressed in this article are solely those of the authors and do not necessarily represent those of their affiliated organizations, or those of the publisher, the editors and the reviewers. Any product that may be evaluated in this article, or claim that may be made by its manufacturer, is not guaranteed or endorsed by the publisher.
The authors thank the Faculty of Veterinary and Agricultural Sciences, the University of Melbourne, for the financial support. The authors would like to thank all contributors from the University of Melbourne including Dr. Ravneet Kaur Jhajj (Dookie college lab manager), Michael Hall (lab technician), and Trace Analysis for Chemical, Earth, and Environmental Science (TrACEES) platform for their support, and Pragna Prathap (PhD scholar), Aleena Joy (PhD scholar), and Md Safiqur Rahaman Shishir (PhD scholar) for their contributions during the experiment.
Bernard M., Cheng L., Chantelauze C., Song Y., Jeanleboeuf A., Sagot L., et al. (2020). Nitrogen Partitioning and Isotopic Discrimination are Affected by Age and Dietary Protein Content in Growing Lambs. Animal 14, 942–951. doi: 10.1017/S1751731119002647
Brand T. S., Frank F., Cloete S. W. P. (1992). Substitution of Lucerne Hay by Untreated, Urea-Enriched and Urea-Ammoniated Wheat Straw in Diets for Sheep. S. Afr. J. Anim. Sci. 22, 185–193.
Calsamiglia S., Ferret A., Reynolds C. K., Kristensen N. B., Van Vuuren A. M. (2010). Strategies for Optimizing Nitrogen Use by Ruminants. Animal 4, 1184–1196. doi: 10.1017/S1751731110000911
Cantalapiedra-Hijar G., Dewhurst R. J., Cheng L., Cabrita A. R. J., Fonseca A. J. M., Nozière P., et al. (2018). Nitrogen Isotopic Fractionation as a Biomarker for Nitrogen Use Efficiency in Ruminants: A Meta-Analysis. Animal 12, 1827–1837. doi: 10.1017/S1751731117003391
Cantalapiedra-Hijar G., Ortigues-Marty I., Sepchat B., Agabriel J., Huneau J., Fouillet H. (2015). Diet–animal Fractionation of Nitrogen Stable Isotopes Reflects the Efficiency of Nitrogen Assimilation in Ruminants. Br. J. Nutr., 1158–1169. doi: 10.1017/S0007114514004449
Cheng L., Al-Marashdeh O., McCormick J., Guo X., Chen A., Logan C., et al. (2018). Live Weight Gain, Animal Behaviour and Urinary Nitrogen Excretion of Dairy Heifers Grazing Ryegrass–White Clover Pasture, Chicory or Plantain. New Z. J. Agric. Res. 61 (4), 454–467. doi: 10.1080/00288233.2017.1411372
Cheng L., Dewhurst R. J., Larkin J., Buckley F., Thackaberry C., Nicol A. M., et al. (2010). ““Brief Communication: Investigation of Nitrogen Isotopic Fractionation in Dairy Cows Using Milk Samples Collected at the Morning and Afternoon Milking”,” in Proceeding of New Zealand Society of Animal Production (NZSAP)(Palmerston North), 65–66.
Cheng L., Edwards G. R., Dewhurst R. J., Nicol A. M., Pacheco D. (2016). The Effect of Dietary Water-Soluble Carbohydrate to Nitrogen Ratio on Nitrogen Partitioning and Isotopic Fractionation of Lactating Goats Offered a High-Nitrogen Diet. Animal 10, 779–785. doi: 10.1017/S1751731115002335
Cheng L., Kim E. J., Merry R. J., Dewhurst R. J. (2011). Nitrogen Partitioning and Isotopic Fractionation in Dairy Cows Consuming Diets Based on a Range of Contrasting Forages. J. Dairy. Sci. 94, 2031–2041. doi: 10.3168/jds.2010-3763
Cheng L., Nicol A. M., Dewhurst R. J., Edwards G. R. (2013a). The Effects of Dietary Nitrogen to Water-Soluble Carbohydrate Ratio on Isotopic Fractionation and Partitioning of Nitrogen in non-Lactating Sheep. Animal 7, 1274–1279. doi: 10.1017/S1751731113000311
Chen X. B., Gomes M. J. (1992). Estimation of Microbial Protein Supply to Sheep and Cattle Based on Urinary Excretion of Purine Derivatives: An Overview of the Technical Details 6–17.
Cheng L., Sheahan A. J., Gibbs S. J., Rius A. G., Kay J. K., Meier S., et al. (2013b). Technical Notes: Nitrogen Isotopic Fractionation can be Used to Predict Nitrogen Use Efficiency in Dairy Cows Fed Temperate Pasture and Supplemented With Urea. J. Anim. Sci. 91, 5785–5788. doi: 10.2527/jas2012-5378
Colmenero J. O., Broderick G. A. (2006). ). Effect of Dietary Crude Protein Concentration on Milk Production and Nitrogen Utilization in Lactating Dairy Cows. J. Dairy. Sci. 89 (5), 1704–1712. doi: 10.3168/jds.S0022-0302(06)72238-X
Dijkstra J., Oenema O., Van Groenigen J. W., Spek J. W., Van Vuuren A. M., Bannink A. (2013). Diet Effects on Urine Composition of Cattle and N2O Emissions. Animal 7, 292–302. doi: 10.1017/S1751731113000578
Doreau M., Michalet-Doreau B., Grimaud P., Atti N., Nozière P. (2003). Consequences of Underfeeding on Digestion and Absorption in Sheep. Small. Rumin. Res. 49 (3), 289–301. doi: 10.1016/S0921-4488(03)00145-7
Ferris C. P., Gordon F. J., Patterson D. C., Porter M. G., Yan T. (1999). The Effect of Genetic Merit and Concentrate Proportion in the Diet on Nutrient Utilization by Lactating Dairy Cows. Agric. Sci. 132, 483–493. doi: 10.1017/S0021859699006553
Galloway J. N., Cowling E. B. (2002). Reactive Nitrogen and the World: 200 Years of Change. AMBIO.: J. Hum. Environ. 31 (2), 64–71. doi: 10.1579/0044-7447-31.2.64
Herremans S., Decruyenaere V., Cantalapiedra-Hijar G., Beckers andFroidmont Y. E. (2020). Effects of Hydrolysable Tannin-Treated Grass Silage on Milk Yield and Composition, Nitrogen Partitioning and Nitrogen Isotopic Discrimination in Lactating Dairy Cows. Animal 14 (4), 771–779. doi: 10.1017/S175173111900226X
Hristov A. N., Hanigan M., Cole A., Todd R., McAllister T. A., Ndegwa P. M., et al. (2011). Ammonia Emissions From Dairy Farms and Beef Feedlots. Can. J. Anim. Sci. 91 (1), 1–35. doi: 10.4141/CJAS10034
Institut national de la recherche agronomique (INRA) (2018). Feeding System for Ruminants (Wageningen, Netherland: Wageningen Academic Publishers).
Kawashima T., Sumamal W., Pholsen P., Chaithiang R., Terada F. (2007). Comparative Study on Energy and Nitrogen Metabolism of Brahman Cattle and Sheep Given Ruzi Grass Hay With Different Levels of Soybean Meal. Jpn. Agric. Res. Q. 41 (3), 253–260. doi: 10.6090/JARQ.41.253
Khanaki H., Dewhurst R. J., Leury B. J., Cantalapiedra-Hijar G., Edwards G. R., Logan C., et al. (2021). The Effect of Sheep Genetic Merit and Feed Allowance on Nitrogen Partitioning and Isotopic Discrimination. Animal 15 (12), 100400. doi: 10.1016/j.animal.2021.100400
Kidane A., Øverland M., Mydland L. T., Prestløkken E. (2018). Interaction Between Feed Use Efficiency and Level of Dietary Crude Protein on Enteric Methane Emission and Apparent Nitrogen Use Efficiency With Norwegian Red Dairy Cows. J. Anim. Sci. 96, 3967–3982. doi: 10.1093/jas/sky256
Kohn R. A., Dinneen M. M., Russek-Cohen E. (2005). Using Blood Urea Nitrogen to Predict Nitrogen Excretion and Efficiency of Nitrogen Utilization in Cattle, Sheep, Goats, Horses, Pigs, and Rats. J. Anim. Sci. 83 (4), 879–889. doi: 10.1093/jas/sky256
Lapierre H., Lobley G. E. (2001). Nitrogen Recycling in the Ruminant: A Review. J. Dairy. Sci. 84, E223–E236. doi: 10.3168/jds.S0022-0302(01)70222-6
Lavery A., Ferris C. P. (2021). Proxy Measures and Novel Strategies for Estimating Nitrogen Utilisation Efficiency in Dairy Cattle. Animals 11, 343. doi: 10.3390/ani11020343
Lee T. N., Buck C. L., Barnes B. M., O’Brien D. M. (2012). A Test of Alternative Models for Increased Tissue Nitrogen Isotope Ratios During Fasting in Hibernating Arctic Ground Squirrels. J. Exp. Biol. 215, 3354–3361. doi: 10.1242/jeb.068528
MacRae J. C., Walker A., Brown D., Lobley G. E. (1993). Accretion of Total Protein and Individual Amino Acids by Organs and Tissues of Growing Lambs and the Ability of Nitrogen Balance Techniques to Quantitate Protein Retention. J. Anim. Sci. 57, 237–245. doi: 10.1017/S000335610000684X
Mendowski S., Chapoutot P., Chesneau G., Ferlay A., Enjalbert F., Cantalapiedra-Hijar G., Germain andNoziere A. P., et al. (1993). Effects of Pretreatment With Reducing Sugars or an Enzymatic Cocktail Before Extrusion of Fava Bean on Nitrogen Metabolism and Performance of Dairy Cows. J. Dairy Sci 103 (1), 396–409. doi: 10.3168/jds.2019-17286
Ministry of Agriculture, Fisheries and Food (1990). UK Tables of Nutritive Value and Chemical Composition of Feeding Stuffs (Aberdeen: Rowett Research Services), 420.
National Research Council (NRC) (2001). Nutrient Requirements of Dairy Cattle (National Academies Press).
Niu M., Appuhamy M. J. A. D. R. N., Leytem A. B., Dungan R. S., Kebreab E. (2016). Effect of Dietary Crude Protein and Forage Contents on Enteric Methane Emissions and Nitrogen Excretion From Dairy Cows Simultaneously. Anim. Prod. Sci. 56, 312–321. doi: 10.1071/AN15498
Sick H., Roos N., Saggau E., Haas K., Meyn V., Walch B., et al. (1997). Amino Acid Utilization and Isotope Discrimination of Amino Nitrogen in Nitrogen Metabolism in Rat LiverIn Vivo. Z. für. Ernährungswissenschaft. 36, 340–346. doi: 10.1007/BF01617819
Spanghero M., Kowalski Z. M. (1997). Critical Analysis of Nitrogen Balance Experiments With Lactating Cows. Livest. Prod. Sci. 52, 113–122. doi: 10.1016/S0301-6226(97)00138-3
Steele K.W., Daniel R. M. (1978). Fractionation of Nitrogen Isotopes by Animals: A Further Complication to the Use of Variations in the Natural Abundance of 15N for Tracer Studies. J. Agric. Sci. 90 (1), 7–9
Van Soest P. V., Robertson J. B., Lewis B. A. (1991). Methods for Dietary Fiber, Neutral Detergent Fiber, and Nonstarch Polysaccharides in Relation to Animal Nutrition. J. Dairy. Sci. 74, 3583–3597. doi: 10.3168/jds.S0022-0302(91)78551-2
Keywords: sheep production, nitrogen utilization, nitrogen isotope, urinary nitrogen, urea supplementation
Citation: Khanaki H, Dewhurst RJ, Leury BJ, Cantalapiedra-Hijar G and Cheng L (2022) Relationship Between Nitrogen Isotopic Discrimination and the Proportion of Dietary Nitrogen Excreted in Urine by Sheep Offered Different Levels of Dietary Non-Protein Nitrogen. Front. Anim. Sci. 3:911673. doi: 10.3389/fanim.2022.911673
Received: 03 April 2022; Accepted: 02 June 2022;
Published: 04 July 2022.
Edited by:
Laíse Pontes, Instituto de Desenvolvimento Rural do Paraná (IDR), BrazilReviewed by:
Peter Erickson, University of New Hampshire, United StatesCopyright © 2022 Khanaki, Dewhurst, Leury, Cantalapiedra-Hijar and Cheng. This is an open-access article distributed under the terms of the Creative Commons Attribution License (CC BY). The use, distribution or reproduction in other forums is permitted, provided the original author(s) and the copyright owner(s) are credited and that the original publication in this journal is cited, in accordance with accepted academic practice. No use, distribution or reproduction is permitted which does not comply with these terms.
*Correspondence: Long Cheng, bG9uZy5jaGVuZ0B1bmltZWxiLmVkdS5hdQ==
Disclaimer: All claims expressed in this article are solely those of the authors and do not necessarily represent those of their affiliated organizations, or those of the publisher, the editors and the reviewers. Any product that may be evaluated in this article or claim that may be made by its manufacturer is not guaranteed or endorsed by the publisher.
Research integrity at Frontiers
Learn more about the work of our research integrity team to safeguard the quality of each article we publish.