 Qing Li1
 Kuey C. Chen
 James C. Matthews
- 1Department of Animal and Food Sciences, University of Kentucky, Lexington, KY, United States
- 2Department of Pharmacology and Nutritional Sciences, University of Kentucky, Lexington, KY, United States
Many supplemental Se-dependent metabolic effects are mediated through the function of selenoproteins. The full complement and relative abundance of selenoproteins expressed by highly metabolic cattle tissues have not been characterized in cattle. The complement and number of selenoprotein mRNA transcripts expressed by the pituitary and liver of healthy growing beef steers (n = 7 to 8) was characterized using NanoString methodology (Study 1). Of the 25 known bovine selenoproteins, 24 (all but SELENOH) were expressed by the pituitary and 23 (all but SELENOH and SELENOV) by the liver. Transcript abundance ranged (P ≤ 0.05) over 5 orders of magnitude in the pituitary (> 10,000 for GPX3, < 10 for DIO1 and GPX2) and liver (> 35,000 for SELENOP, < 10 for DIO2). Also unknown is the sensitivity of the selenoprotein transcriptome to the form of supplemental Se. The effect of form of supplemental Se on the relative content of selenoprotein mRNA species in the pituitary and liver of steers grazing a Se-deficient (0.07 ppm Se) tall fescue pasture and consuming 85 g/d of a basal vitamin-mineral mix that contained 35 ppm Se as either ISe (n = 6), organically-bound Se (SELPLEX; OSe, n = 7 to 8), or a 1:1 blend of ISe and OSe (MIX, n = 7 to 8) was determined by RT-PCR after sequence-validating the 25 bovine selenoprotein cDNA products (Study 2). In the pituitary, Se form affected (P < 0.05) the relative content of 9 selenoprotein mRNAs and 2 selenoprotein P receptor mRNAs in a manner consistent with a greater capacity to manage against oxidative damage, maintain cellular redox balance, and have a better control of protein-folding in the pituitaries of OSe and MIX versus ISe steers. In the liver, expression of 5 selenoprotein mRNA was affected (P ≤ 0.05) in a manner consistent with MIX steers having greater redox signaling capacity and capacity to manage oxidative damage than ISe steers. We conclude that inclusion of 3 mg Se/d as OSe or MIX versus ISe, forms of supplemental Se in vitamin-mineral mixes alters the selenoprotein transcriptome in a beneficial manner in both the pituitary and liver of growing steers consuming toxic endophyte-infected tall fescue.
Introduction
Selenium (Se) is a micronutrient that is integral to a variety of metabolic processes, exerting many of its effects through the function of selenoproteins (Kim et al., 2011). By definition, selenoproteins contain selenocysteine (Sec), the 21st proteinogenic amino acid (Gladyshev et al., 2016). To date, there are 25 known mammalian selenoproteins. Typically, selenoproteins are classified according to their biological function: (1) thyroid hormone metabolism; (2) antioxidant enzymes; (3) redox signaling; (4) protein folding, (5) Sec synthesis; (6) Se transportation and storage; and (7) unknown. For those selenoproteins with a known metabolic activity, the Sec residue(s) conveys its catalytic activity (Papp et al., 2007). Despite the importance of selenoproteins, the complete complement and abundance of selenoprotein mRNA transcripts comprising the transcriptome for many tissues and species is not known, including the pituitary and liver of cattle. Because the principal feedstuff of Kentucky’s cow-calf beef industry is forage, the objective of Study 1 was to characterize (NanoString analysis) the complement and number of selenoprotein mRNA transcripts in the pituitary and liver tissues of growing steers grazing a mixed forage pasture.
The dietary requirement of Se for beef cattle is 0.1 ppm (NRC, 2016). However, many regions of the world contain Se-poor soils (e.g., southeastern United States (Dargatz and Ross, 1996) and northwestern and central China (Huang et al., 2017), resulting in concentrations of Se in grains and forages that are too low to support optimal health and growth. In beef cattle, a deficiency in Se causes a variety of negative effects on reproduction (Qazi et al., 2018), growth rates (Mehdi and Dufrasne, 2016), and physiological parameters including increased inflammation (Matmiller et al., 2013) and reduced immune capacity (Avery and Hoffmann, 2018). Thus, Se supplementation of beef cattle diets is a standard production practice in regions of the United States with Se-poor soils. The most common form of Se supplemented in cattle diets is inorganic Se (sodium selenite, ISe). However, the predominant form of Se in plants is organic (primarily as selenomethionine and Sec-derivatives), and organic forms of supplemental Se derived from specially cultivated Saccharomyces cerevisiae (OSe) also are available and approved for beef cattle production (Juniper et al., 2008).
We have been studying the effect of different forms of supplemental Se on the physiologic capacities of cattle. An important finding is that providing supplemental dietary Se (3 mg/day) as a 1:1 blend of ISe : OSe (MIX) to replacement beef heifers resulted in greater Se assimilation by whole blood, red blood cells, serum, and liver than as ISe, and equal to 100% supplemental OSe (Brennan et al., 2011). Moreover, hepatic transcriptome analysis in heifers indicates that MIX and OSe Se treatments induced a greater capacity for redox potential (Matthews et al., 2014). The goal of study 2 was to gain further insight into a potential mechanism (selenoprotein gene expression) by which cattle withstand a commercially relevant physiologic challenge. The objective of Study 2 was to test the hypothesis that the pituitary and hepatic selenoprotein mRNA content of steers raised on MIX versus ISe forms of supplemental Se, and consumed MIX versus ISe forms of supplemental Se, while undergoing summer-long consumption of toxic endophyte-infected tall fescue, would differ. In addition, due to the putative importance of selenoproteins to support skeletal muscle (Castets et al., 2010) and adipose tissue (Tinkov et al., 2020) accretion, our original hypothesis for Study 2 included evaluation of Se From treatment effects on selenoprotein mRNA content in Longissimus dorsi and 12th-13th rib subcutaneous adipose tissue. However, a freezer failure resulted in the loss of these tissues.
Materials and methods
To avoid confusion in terminology, we have used the HUGO Gene Nomenclature Committee recommendations to identify the genes of selenoproteins without well-described functions by using the “SELENO” root. In contrast, the SELENO root was not used to identify selenoprotein genes with well-defined functions (Gladyshev et al., 2016).
Ethics statement
All experimental procedures were approved by the University of Kentucky Institutional Animal Care and Use Committee. To avoid unnecessary duplication of animal research, and to provide a greater physiological context, Study 1 was conducted using pituitary and liver RNA isolated from the “control” steers of Brown et al. (2009). Study 2 was conducted using pituitary and liver RNA isolated from ISe, OSe, and MIX treatment steers of Jia et al. (2018). The animals and data for Study 1 and 2 are completely independent and data analyzed within a study.
Animal models
The animal model and management regimen for steers that yielded the pituitary and liver tissues for Study 1 has been reported (Brown et al., 2009). Briefly, 9 growing, predominately-Angus, beef steers (BW = 266 ± 10.9 kg) grazed a mixed forage pasture (5.7 ha) that contained a nominal amount of toxic endophyte-infected tall fescue and ergot alkaloids (0.023 ppm ergovaline plus ergovalanine) for 89 days. Immediately after the 89-d common grazing period, the pituitary and liver tissues from each steer were collected over a 17-d slaughter period. Throughout both grazing and slaughter periods, steers had continual ad libitum access to a vitamin-mineral mix that contained 29 ppm sodium selenite.
The animal model and management regimen for steers that yielded the pituitary and liver tissues for Study 2 have been reported (Jia et al., 2018). Briefly, eight suckling, predominantly Angus (100% Angus or ¾ Angus x ¼ Brangus crossed), beef steers (BW: 182.6 ± 33.9 kg, age: 165.5 ± 14.2 day) were randomly selected (n = 8) from within each of 3 herds of fall-calving cows grazing separate toxic endophyte-infected tall fescue mixed forage pastures and having ad libitum access to vitamin-mineral mixes (UK Beef IRM Cow-Calf Mineral, Burkmann Feeds, Danville, KY) that contained 35 mg/kg Se as either ISe (sodium selenite, Prince Se Concentrate; Prince Agri Products, Inc., Quincy, IL), OSe (SEL-PLEX, Alltech Inc., Nicholasville, KY), or an 1:1 blend of ISe : OSe (MIX) forms. The 3 herds (ISe, OSe, MIX) were managed in adjacent pastures. Calves were conceived and suckled by dams consuming ISe, OSe, or MIX forms of supplemental Se, consumed the same form of supplemental Se treatment as their dams during the suckling period and the rest of the study until slaughter. After weaning and being adapted to consume their respective supplemental Se form vitamin-mineral mixes from in-pasture Calan gate feeders, the twenty-four steers (n = 8 for each ISe, OSe, MIX treatments) started a summer-long grazing (86 d) of a single 10.1-ha, predominately toxic endophyte-infected tall fescue, mixed forage pasture. Pasture samples were collected throughout the grazing period, composited, and contained (dry matter basis) 0.07 ppm Se and 0.51 ppm ergovaline plus ergovalanine (Jia et al., 2018). The 3 Se form treatments were administered using in-pasture Calan gate feeders. All three Se-form treatments were manufactured from a common basal vitamin-mineral mix (composition reported in Jia et al., 2018) to which was added 35 ppm Se (3 mg Se/85 g vitamin-mineral mix) as either ISe, OSe, or MIX forms of Se. Eighty-five g of the Se form-specific vitamin-mineral mixes were top-dressed onto 227 g soybean hulls every morning and all steers consumed all of the vitamin-mineral mix/soybean hull mixture every day. Thus, all steers consumed 3 mg Se/d. During the 86-d grazing period, 2 ISe steers were removed from the study due to a bad hoof and failure to consume its mineral treatment.
Immediately after the common 86-d grazing period, the remaining 22 Study 2 steers were slaughtered over a 26-d period (Jia et al., 2018). Steers continued to receive their respective 3 mg Se/day Se treatments throughout the slaughter period. One OSe and one MIX steer were killed on the first two slaughter days. On the remaining six slaughter days, one steer each from ISe, OSe, and MIX treatment groups were killed. On any given slaughter day, steers were transported from the University of Kentucky Research and Education Center at Princeton, KY, to the University of Kentucky Meat Laboratory at Lexington, KY, and allowed to rest 1 to 2 h before slaughter and had ad libitum access to water.
Sample collection and RNA preparation
Steers were stunned by captive bolt pistol and exsanguinated. Within 5 min of death, pituitaries were removed and placed in a foil pack, flash-frozen in liquid nitrogen, and stored at -80°C. Within 15 to 20 minutes of death, liver samples collected from mid-lower right lobe were collected and frozen and stored, as described for pituitaries. For Study 1, eight pituitary and nine liver samples were subjected to NanoString analysis of mRNA abundance. Two pituitaries were not used due to damage during collection, whereas one liver sample was not used due to its being a statistical outlier (see below). For Study 2, of the 22 steers that finished the trial, two pituitary glands (1 OSe and 1 MIX) were not used because of damage incurred during the collection process. As a result, six pituitaries (n = 6) and six liver samples (n = 6) for ISe, and seven pituitaries (n = 7) and eight liver samples (n = 8) for both OSe and MIX treatment groups were subjected to reverse transcription-polymerase chain reaction (RT-PCR) analyses of relative mRNA expression.
Total RNA was extracted from the whole frozen pituitary and liver tissue using TRIzol Reagent (Invitrogen Corporation, Carlsbad, CA) following the manufacturer’s instructions. The quality of the RNA concentrations were determined using a NanoDrop ND-1000 Spectrophotometer (NanoDrop Technologies, Wilmington, DE). Extracted total RNA for Study 1 (Liao et al., 2015; Li et al., 2017) and Study 2 (Jia et al., 2018; Li et al., 2019) was of high purity, with 260:280 nm absorbance ratios ranging from 1.71 to 2.10 and 260:230 nm absorbance ratios ranging from 1.50 to 2.55. The integrity of the total RNA samples was determined using an Agilent 2100 Bioanalyzer System (Agilent Technologies, Santa Clara, CA) at the University of Kentucky Microarray Core Facility. All RNA samples had 28S:18S rRNA absorbance ratios greater than 1.7 and RNA integrity numbers greater than 8.5.
Determination of liver Se content
For Study 2, the content of Se in liver tissue was determined by the Michigan State University Diagnostic Center for Population and Animal Health (DCPAH) using an Agilent 7900 inductively coupled plasma-mass spectrometer as described previously (Wahlen et al., 2005).
NanoString analysis
Selenoprotein mRNA abundance was determined in pituitary (500 ng, n = 7) and liver (400 ng, n = 8) total RNA using a two-step process, the NanoString Human miRNA Expression (miRGE) Assay kit, and custom-designed codeset according to the manufacturer’s instructions (NanoString Technologies, Seattle, WA, USA). The miRGE assays simultaneously detects copies of both miRNA and mRNA. The particular miRNA sequences included in our customized miRGE code set are common (mirbase.org; Kozomara et al., 2019) to both cattle and humans. The limit of detection is > 2.5 copies miRNA and 1 copy mRNA, and the linear dynamic range of this assay is 2 x 10⁶ total counts.
Briefly, codeset-specific DNA tags (miR-tag) were ligated (48°C for 24 min) onto the 3’ end of each mature miRNA and excess tags and bridges removed by restriction digestion (37°C for 70 min). Five microliters of each sample were hybridized (16 to 20 h at 65°C) with 10 μL of hybridization buffer and 5 μL of Capture probes. Hybridization mixtures were loaded into the nCounter Prep Station (NaonoString Technologies) for purification where excess (unhybridized) Reporter probes were removed. The abundance of specific target molecules was determined using the nCounter Digital Analyzer (NanoString Technologies) and 600/600 Fields of View. The raw binding code count data were adjusted for variability in the hybridization and purification processes, using the nSolver Analysis Software 4.0 (NanoString Technologies) and the average counts for all positive control spikes in each sample (Veldman-Jones et al., 2015). For the pituitary, the data (mean and standard deviation) are expressed as adjusted mRNA transcript number (counts) relative to the geometric mean of MARS (1,062 ± 54), OAT (4,727 ± 113), and PAPSS1 (3,466 ± 119). For the liver, counts are expressed relative to the geometric mean of GGCX (1,245 ± 75), MAT2B (2,375 ± 209), and ZNF22 (110 ± 8).
Real-time reverse transcription-polymerase chain reaction analysis
Primer sets (Table 1) for genes selected for real-time reverse-transcription (RT) PCR analysis were designed using the NCBI Pick Primers online program against RefSeq sequences. Real-time RT-PCR was performed using an Eppendorf Mastercycler ep realplex2 system (Eppendorf, Hamburg, Germany) with iQ SYBR Green Supermix (Bio-RAD, Hercules, CA), as described (Bridges et al., 2012). Briefly, cDNA was synthesized using the SuperScript III 1st Strand Synthesis System (Invitrogen), with 1 μg of RNA used for each reverse transcription reaction. Real-time RT-PCR was performed with a total volume of 25 μL per reaction, with each reaction containing 5 μL of cDNA, 1 μL of a 10 μM stock of each primer (forward and reverse), 12.5 μL of 2× SYBR Green PCR Master Mix, and 5.5 μL of nuclease-free water. Gene expression was analyzed by the 2−ΔΔCT method (Livak and Schmittgen, 2001). All RT-PCR reactions were conducted in triplicate.
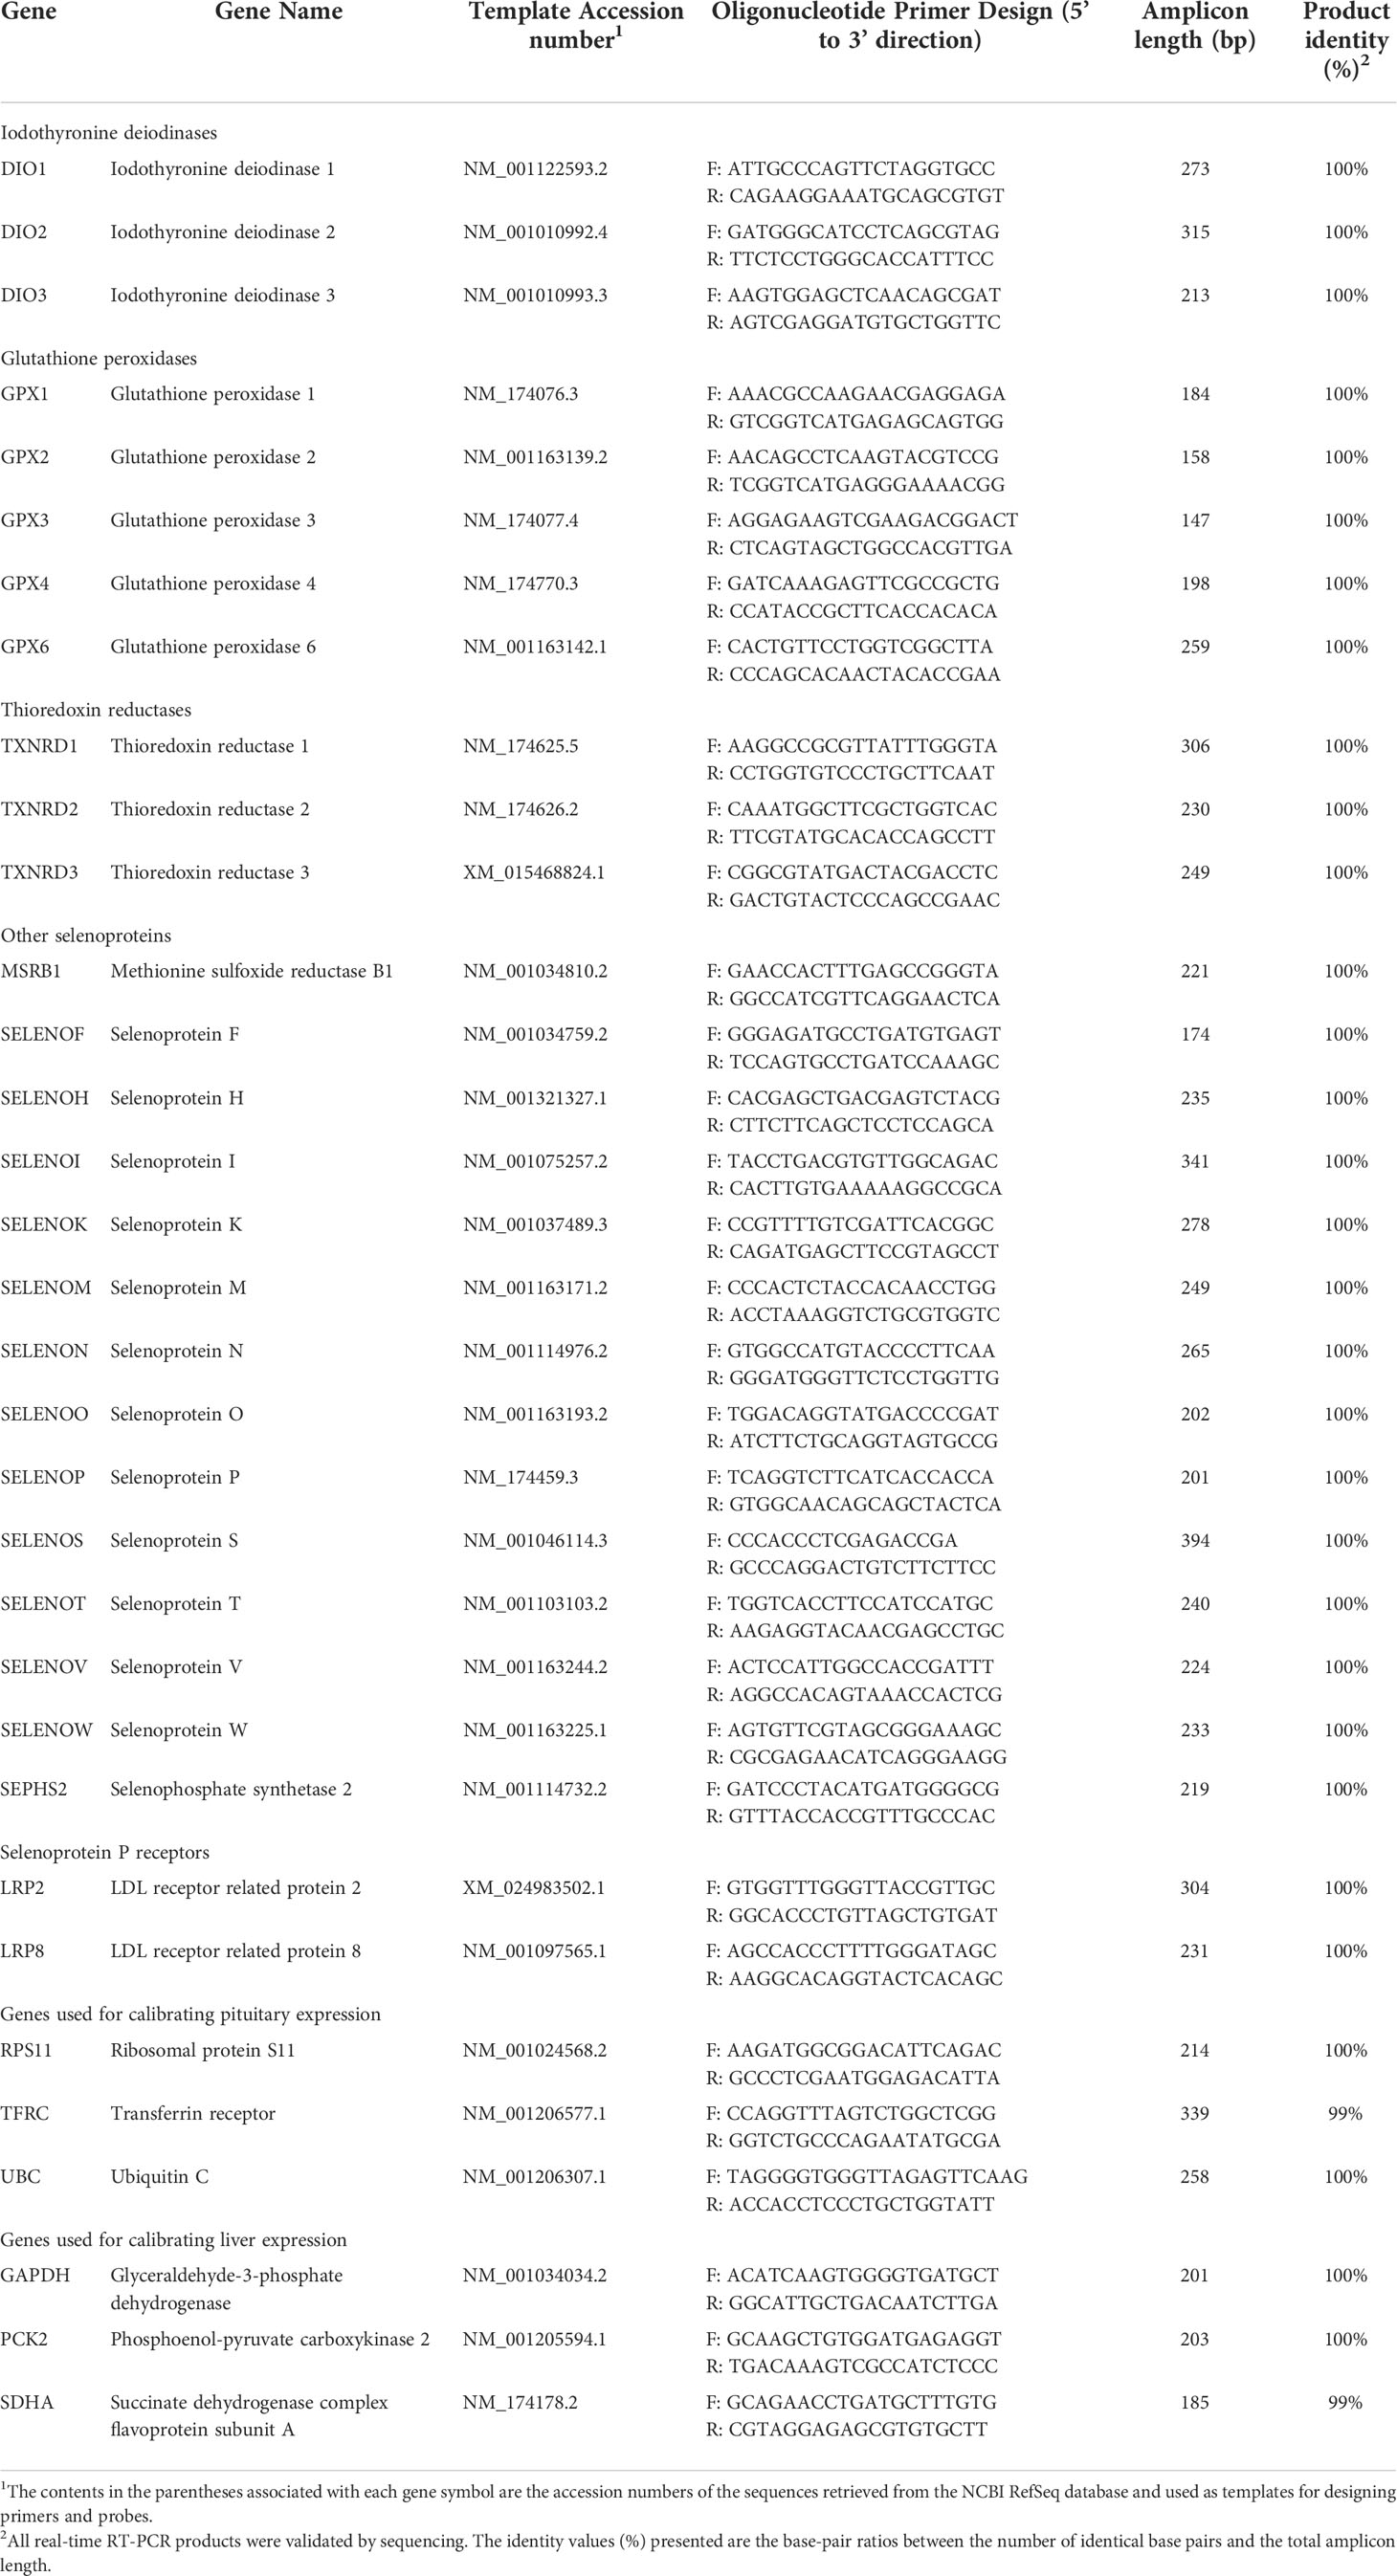
Table 1 Primer sets and product identities of real-time RT-PCR analysis of reference and selenoprotein-associated genes.
The resulting real-time RT-PCR products were purified using a PureLink Quick Gel Extraction Kit (Invitrogen) and sequenced at Eurofins Scientific (Eurofins, Louisville, KY). Sequences were compared with the corresponding RefSeq mRNA sequences used as the templates for primer set design. The geometric mean of the calibrating genes was used to normalize the relative expression of experimental genes. For the pituitary, the three calibrating genes used were RPS11, TFRC, and UBC. For liver, GAPDH, PCK2, and SDHA were used. The RT-PCR data are expressed as abundance of a given gene transcript calibrated to the geometric mean expression of the calibrating genes and normalized to the mean expression of the ISe treatment values.
Statistical analysis
For both studies, steer was the experimental unit. For Study 1, data (NanoString nCounter) were screened for statistical outliers using the Principal Component Analysis of JMP Pro (version 14; SAS Inst. Inc., Cary, NC) software. The relative counts of iodothyronine deiodinase 1, 2 and 3; glutathione peroxidase 1, 2, 3, 4, and 6; and thioredoxin reductase 1, 2, and 3 mRNA species were compared within an enzyme family by one-way ANOVA, using the GLM procedure of the SAS statistical software package (version 9.4; SAS Inst., Inc.) and the mRNA species being the fixed effect. Statistical significance was declared when P ≤ 0.05, and a tendency to differ was declared when 0.10 > P > 0.05.
For Study 2, data were screened for statistical outliers using the mean ± 2 standard deviation as the criterion. The effects of Se treatment on liver Se content, and the relative expression levels of selenoprotein mRNA in pituitary and liver tissues gene analyzed by real-time RT-PCR were determined by one-way ANOVA, using the GLM procedure of SAS and the Se treatment being the fixed effect. Statistical significance was declared when P ≤ 0.05, and a tendency to differ was declared when 0.10 > P > 0.05. When P < 0.10, means were separated (P ≤ 0.05) using Fisher’s LSD procedure.
Results
Study 1
NanoString analysis, which does not involve RNA amplification, was used to determine the complement of selenoprotein mRNA transcripts expressed by steer pituitary (Table 2) and liver (Table 3) tissues. Thus, the use of NanoString analysis allowed us to profile the relative expression among selenoprotein mRNA without amplification of transcript copy numbers, as would be the case if RT-PCR analysis was used.
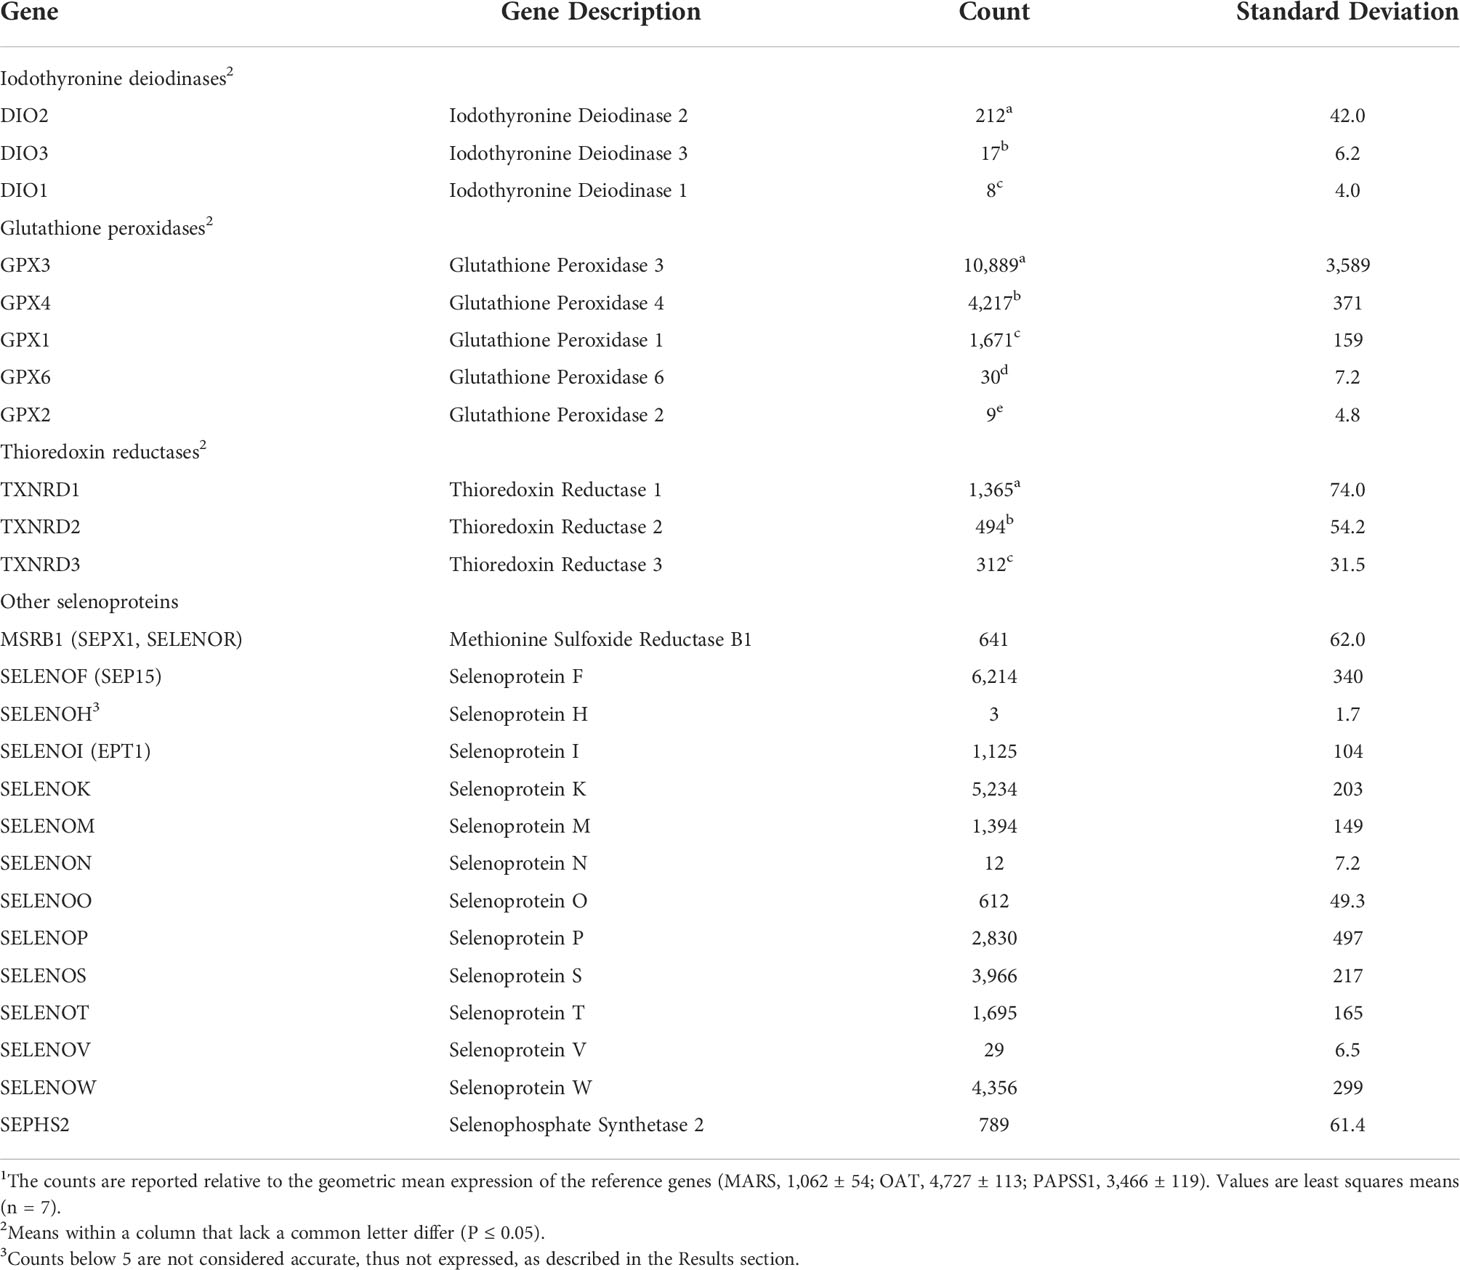
Table 2 NanoString analysis of bovine selenoprotein mRNA abundance (counts) in pituitary tissue of steers grazing high endophyte-infected forages and receiving inorganic supplemental selenium1.
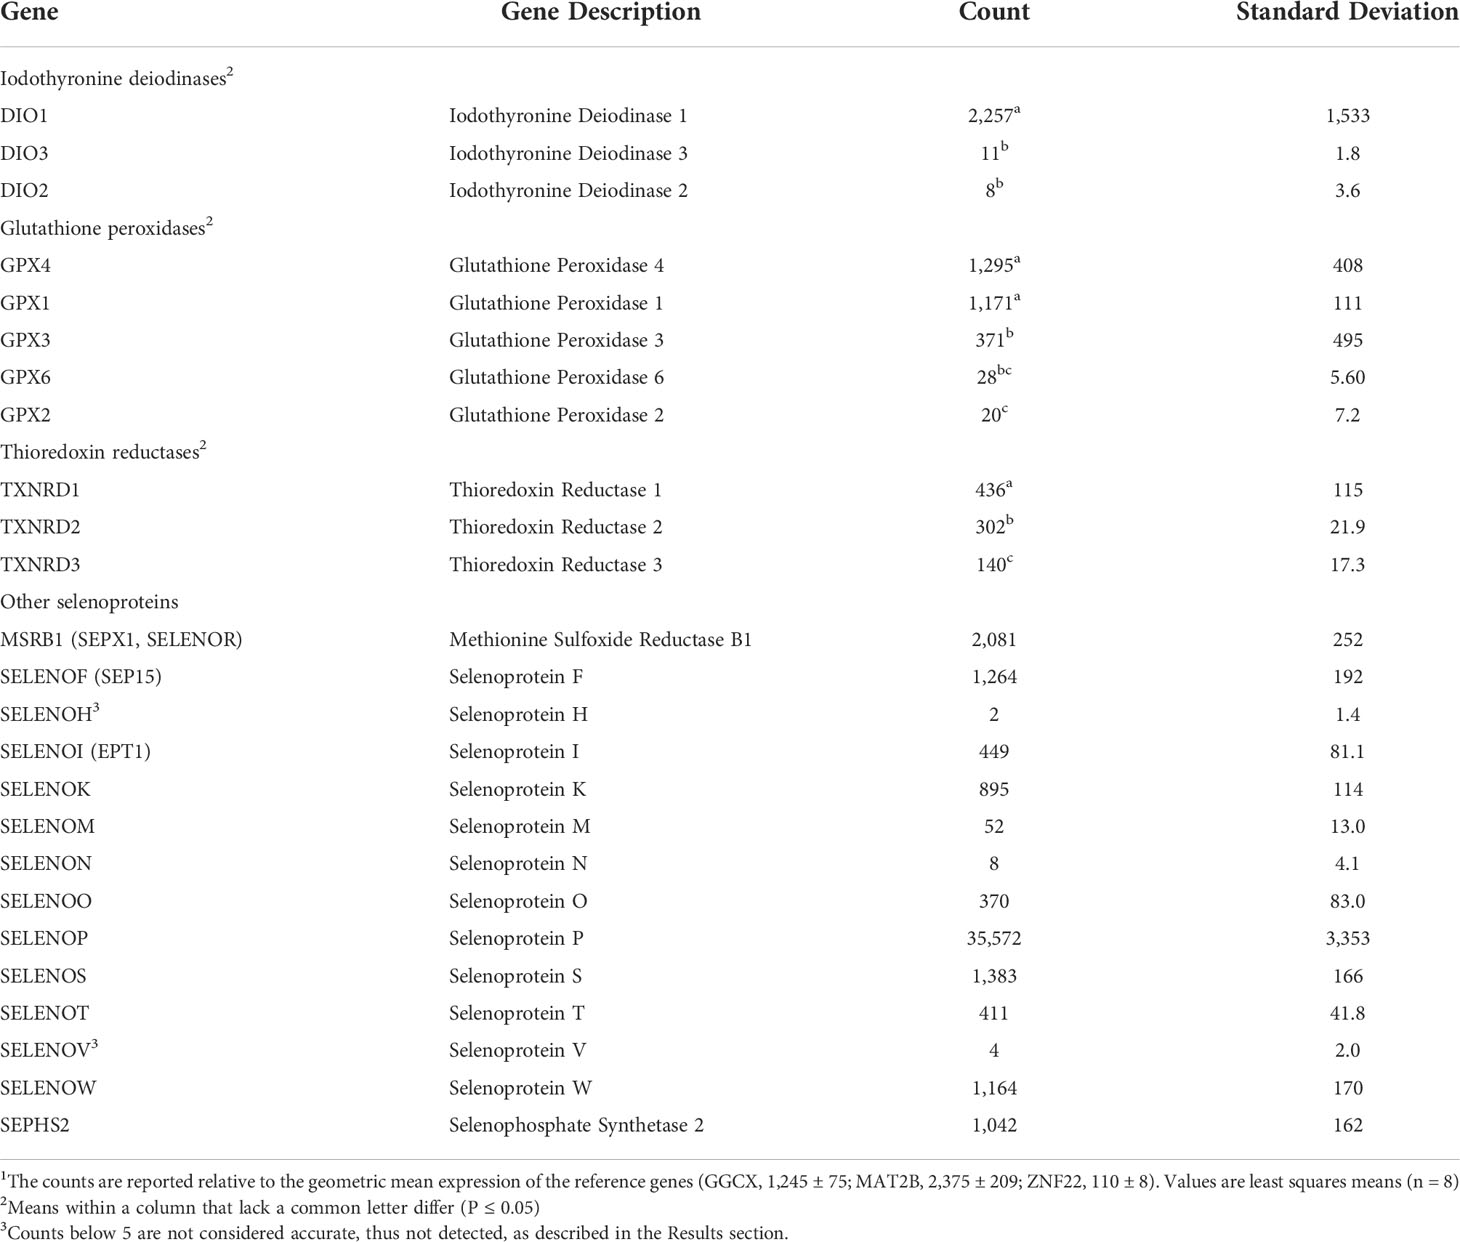
Table 3 NanoString analysis of bovine selenoprotein mRNA abundance (counts) in liver tissue of steers grazing high endophyte-infected forages and receiving inorganic supplemental selenium1.
Pre-study serial RNA dilution experiments (data not shown) found that detection of mRNA transcript counts were not linear below 5 copies and, thus, not reliably detected. Using this 5-count cutoff criterion, the expression of 24 of 25 known bovine selenoprotein mRNA (all except selenoprotein H) was detected in the pituitaries (Table 2) of growing steers, and 23 of 25 bovine selenoprotein mRNA (all except selenoprotein H and selenoprotein V) was detected in the liver (Table 3).
The abundance of NanoString detected mRNA transcripts (normalized counts) ranged over five orders of magnitude within each tissue (Tables 2, 3). For example, in the pituitary, normalized counts of more than 10,000 were determined for glutathione peroxidase 3 vs. less than 10 for DIO1 and GPX2. In the liver, relative counts ranged from more than 35,000 for selenoprotein P to less than 10 for DIO2.
A hierarchy of count abundance was assessed and found to exist (P ≤ 0.05) within the isoforms of iodothyronine deiodinase, glutathione peroxidase, and thioredoxin reductase in both the pituitary (Table 2) and liver (Table 3). Specifically, in the pituitary (P ≤ 0.05), DIO2>DIO3>DIO1, GPX3>GPX4>GPX1>GPX6>GPX2, and TXNRD1>TXNRD2=TXNRD3. For the Liver (P ≤ 0.05), DIO1>DIO3>DIO2, GPX4=GPX1>GPX3=GPX6 and GPX3>GPX2, TXNRD1>TXNRD2>TXNRD3. Thus, although the profile of selenoprotein mRNA transcripts involved with redox potential was almost identical between the pituitary (Table 2) and liver (Table 3), the magnitude of abundance differed within and between tissues.
The abundance of transcripts of selenoproteins responsible for a variety of other metabolic functions also differed substantially, with counts for SELENOF, SELENOP, SELENOS, and SELENOW mRNA being at least an order of magnitude higher than for SELENOH, SELENON, and SELENOV, in both pituitary (Table 2) and liver (Table 3).
Study 2
To gain insight into the potential relationship between these Se form treatment-induced clinical differences and selenoproteins in Study 2 steers, the presence and relative abundance of selenoprotein mRNA transcripts expressed by the pituitary and liver tissues was determined. Reverse-transcription PCR-generated amplicons for the 25 known bovine selenoprotein genes, selenoprotein P receptor genes (LRP2, LRP8), and pituitary (RPS11, TFRC, UBC) and liver (GAPDH, PCK2, SDHA) expression-calibrating genes, were generated and sequence-validated using RNA extracted from the liver or kidney tissues of growing steers. All amplicons had at least 99% identity with their template sequences (Table 1). In terms of expression profiling of the selenoprotein transcriptome, RT-PCR analysis detected mRNA for selenoproteins except for SELENOH in both pituitary (Table 4) and liver (Table 5).
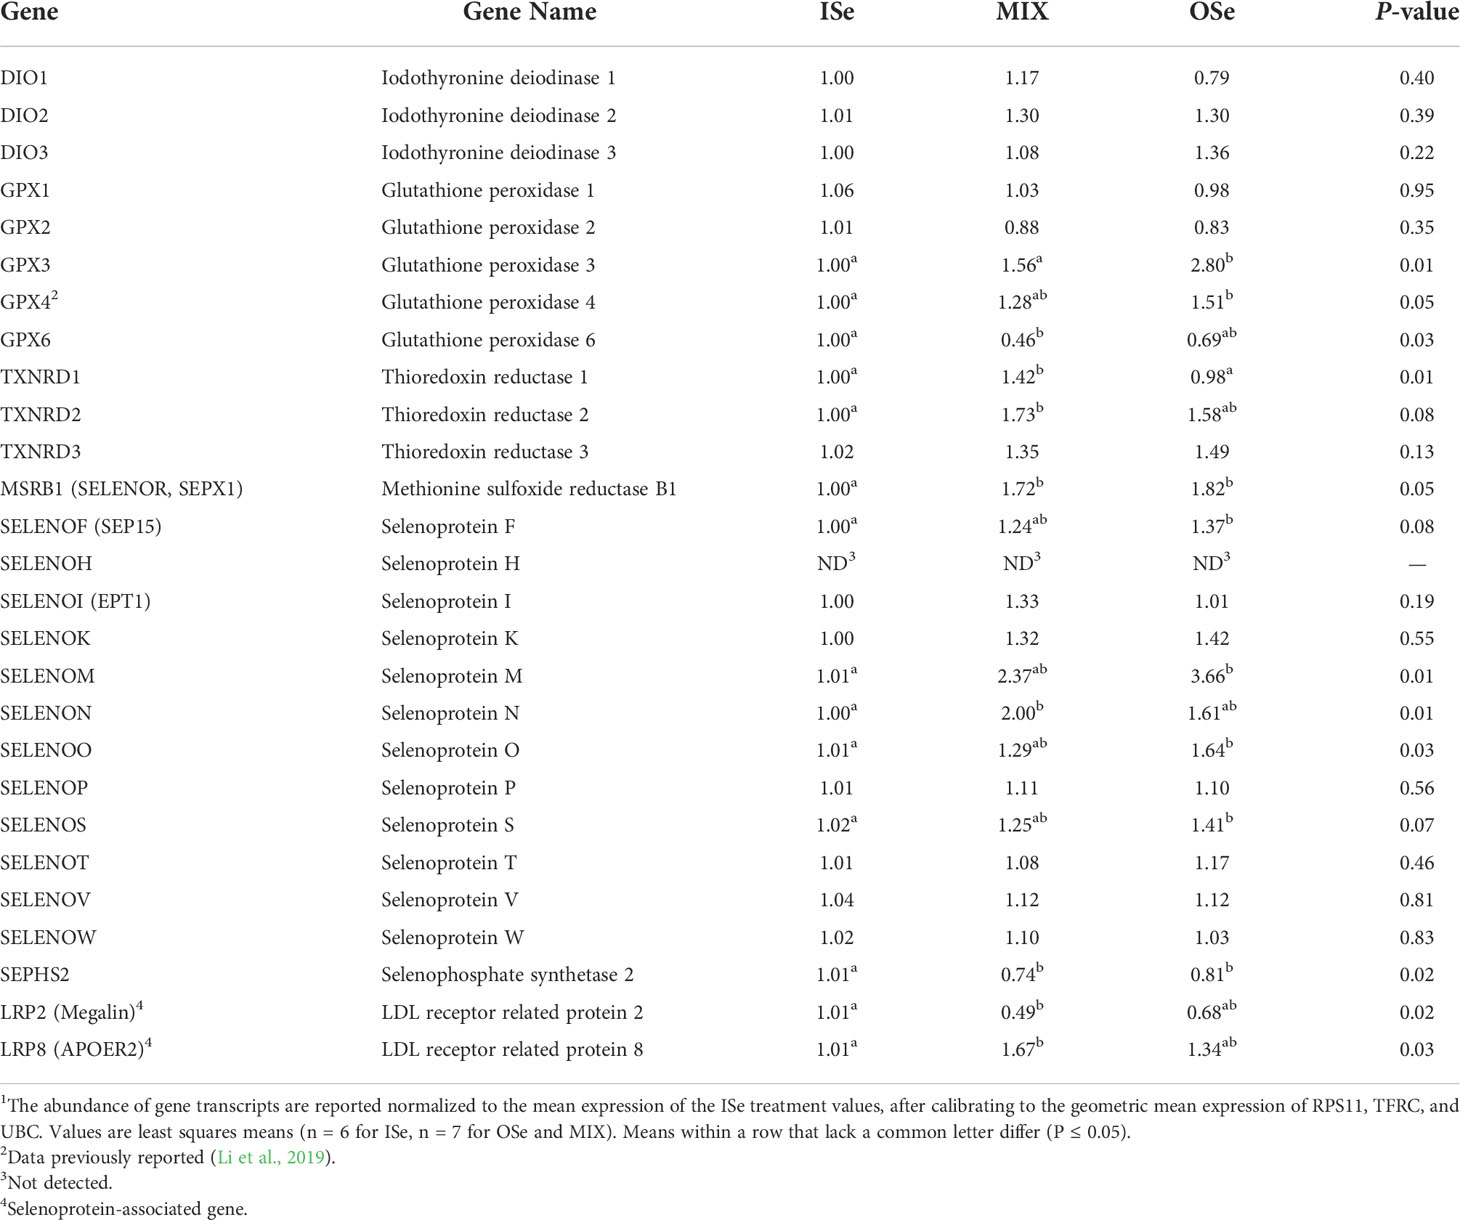
Table 4 Real-time RT-PCR-determined relative expression of selenoprotein genes in pituitary tissue of steers grazing endophyte-infected tall fescue and supplemented with 3 mg Se/d in vitamin-mineral mixes as either sodium selenite (ISe), SEL-PLEX (OSe), or a 1:1 mix of ISe and OSe (MIX)1.
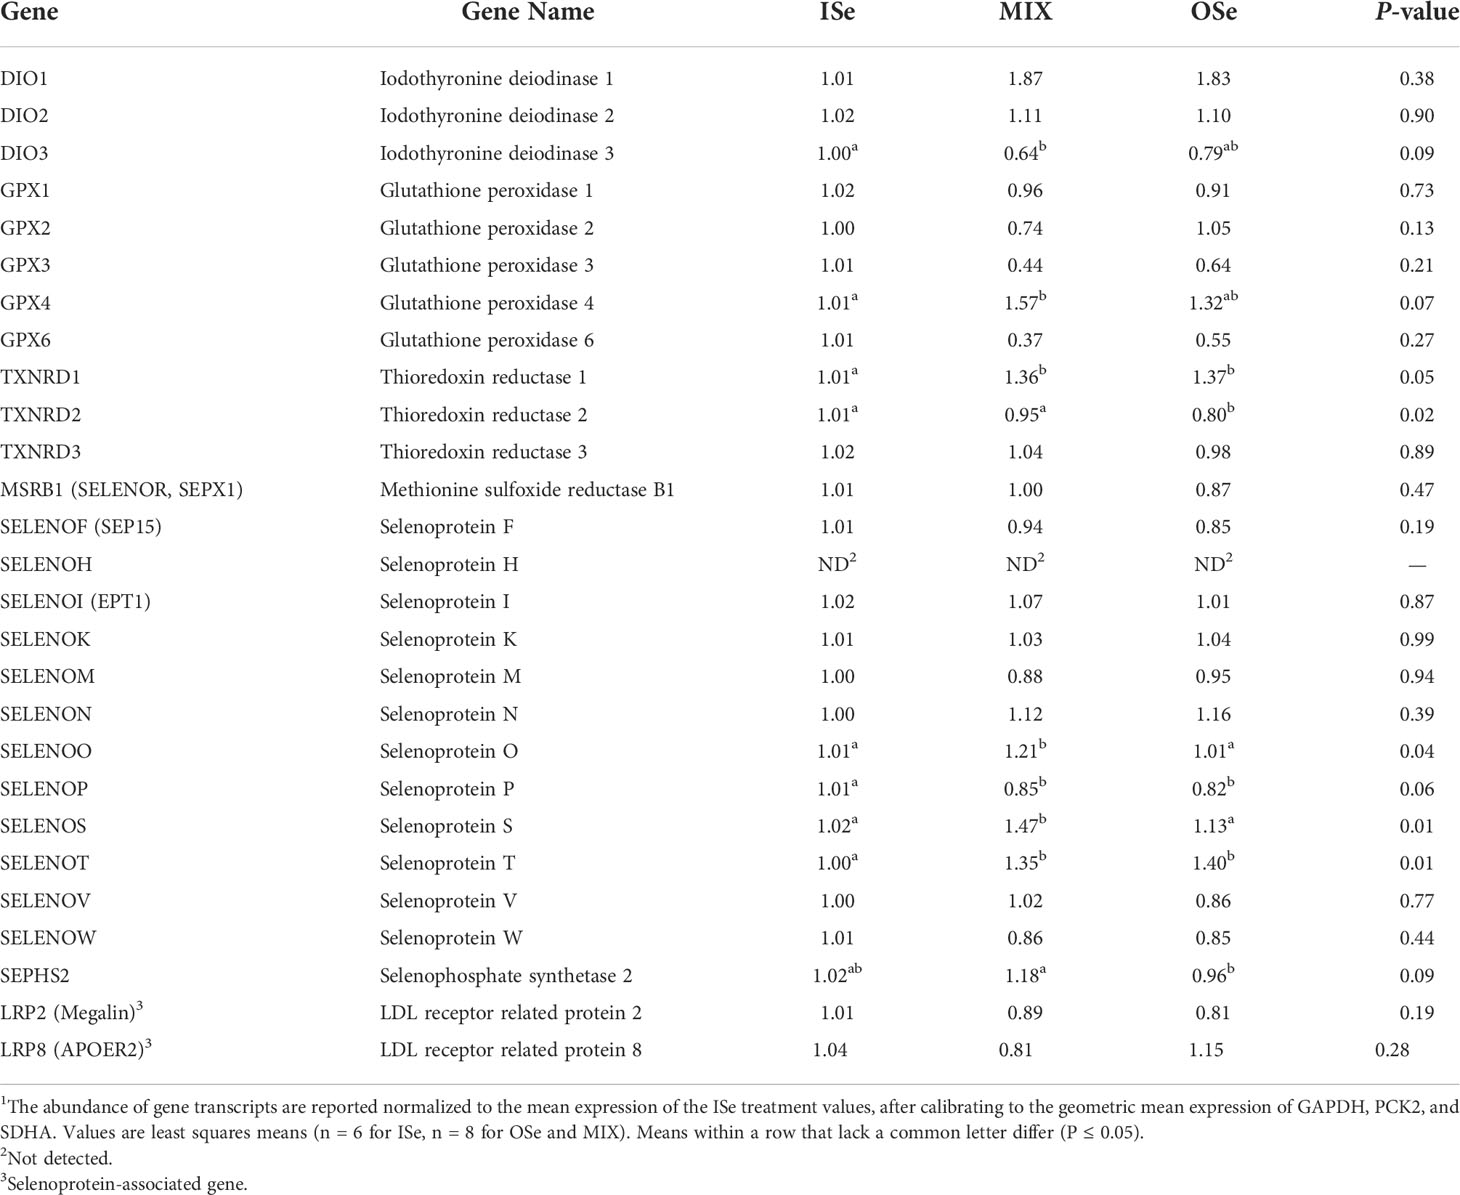
Table 5 Real-time RT-PCR-determined relative expression of selenoprotein genes in liver tissue of steers grazing endophyte-infected tall fescue and supplemented with 3 mg Se/d in vitamin-mineral mixes as either sodium selenite (ISe), SEL-PLEX (OSe), or a 1:1 mix of ISe and OSe (MIX)1.
As noted above, it is widely believed that Se-mediated biological effects occur through selenoprotein function. In the pituitary, the relative expression of genes for 9 selenoproteins and 2 proteins associated with selenoprotein function was affected (P ≤ 0.05) by Se treatment (Table 4). More specifically, the MIX treatment solely increased the expression of SELENON (100%) and TXNRD1 (41%), decreased the expression of GPX6 (54%), and increased the expression of the selenoP receptor LRP8 (65%) while decreasing the expression of selenoprotein receptor LRP2 (51%). In addition, the MIX treatment tended (P = 0.08) to increase the expression of the selenoprotein TXNRD2. In contrast, the OSe treatment solely increased the expression of GPX3 (180%), GPX4 (51%), SELENOM (266%), and SELENOO (62%), and tended (P ≤ 0.08) to increase the expression of SELENOF and SELENOS mRNA expression, whereas both MIX and OSe increased MSRB1 (72%, 83%) and decreased SEPHS2 (27%, 20%) expression, respectively.
In the liver, the Se content (μg/g) among ISe (1.27 ± 0.08), OSe (1.28 ± 0.17), and MIX (1.25 ± 0.28) steers did not differ (P = 0.942). In contrast, the relative expression of five selenoproteins was affected (P ≤ 0.05) by Se treatment (Table 5). More specifically, MIX solely increased the expression of SELENOO (20%) and SELENOS (44%), and tended to decrease the expression of DIO3 (P = 0.09) and increase expression of GPX4 (P = 0.07). In contrast, the OSe treatment solely decreased expression of TXNRD2 (21%) and tended (P = 0.09) to decrease the expression of SEPHS2, whereas both MIX and OSe increased the expression of TXNDR1 (35%, 36%) and SELENOT (35%, 40%), respectively, and tended (P = 0.06) to decrease the expression of SELENOP.
Discussion
Complement and abundance of selenoprotein mRNA expressed by bovine pituitary and liver
To our knowledge, this is the first report characterizing the complete selenoprotein transcriptome expressed by bovine pituitary or liver tissue. Both NanoString analysis and real-time RT-PCR analyses essentially identified the same 24 of the 25 known (Kryukov et al., 2003; Mariotti et al., 2012) mammalian selenoproteins (all but SELENOH) in pituitary and liver tissues, except that the number of SELENOV mRNA counts (4) was one below the technical limit of the assay’s detection minimum (5 counts).
An important feature of NanoString analysis is that potential differences in the abundance of different selenoprotein mRNA species can be determined within a tissue. Thus, assuming that mRNA transcript abundance equals physiological capacity, then important insights can be gained regarding the relative importance of selenoproteins with similar biochemical function to the physiological capacity of the tissue. For example, the order of magnitude for the iodothyronine deiodinases and glutathione peroxidases are not the same for the pituitary and liver.
A limitation of this project is that RNA was extracted from homogenates of the whole pituitary and the right lobe of the liver. As such, any differences in selenoprotein mRNA profiles and relevant content among discrete cell types of the anterior and posterior pituitaries can not be discerned. Similarly, for the liver, differences in selenoprotein and mRNA species and content can not be discerned between pericentral- and periportal-like hepatocytes comprising the hepatic acinus. Nonetheless, the findings of this project suggest some initial selenoproteins targets for subsequent cell type- and region-specific analysis of the localization of selenoprotein expression.
Effect of Se form on expression of selenoprotein and selenoprotein-associated protein genes
Selenoprotein function is critical to maintain redox capacity of highly metabolic tissues, thus cellular metabolic capacity (Matmiller et al., 2013; Labunskyy et al., 2014; Burk and Hill, 2015). We have reported that consumption of forages that contain endophyte-infected tall fescue decreases the mRNA content of a number of genes, including 7 selenoproteins by the liver, pituitary, or both, of growing steers (Liao et al., 2015; Li et al., 2019), and that the expression of some of these selenoprotein genes is increased by supplementing the MIX or OSe vs. ISe forms of Se (Jia et al., 2018; Li et al., 2019). These findings led us to ask the question: How many of the 25 bovine selenoprotein genes are sensitive to the form of supplemental dietary Se in growing cattle?
In Study 2, the pituitary selenoprotein transcriptome was more responsive than the liver to the form of supplemental Se consumed. Of the mRNA species with altered content, only TXNRD1 was affected similarly (increased by MIX treatment) in both the pituitary and liver. Consequently, we accept the hypothesis that the pituitary and hepatic selenoprotein mRNA content of steers raised on MIX versus ISe forms of supplemental Se, and consumed MIX versus ISe forms of supplemental Se, while undergoing summer-long consumption of toxic endophyte-infected tall fescue, differed. When these findings are considered with our recent report that the mRNA content of GPX6, selenoprotein P, selenoR, and selenoV is increased in the corpus luteum (another high metabolic activity tissue) of MIX versus ISe replacement beef heifers (Carr et al., 2022), it seems reasonable to conclude that supplementation of cattle with different forms of Se affects the expressed selenoprotein transcriptome.
Physiological consequence of Se form-induced alteration of selenoprotein transcriptomes
Whereas many studies evaluating the effect of supplemental Se on selenoprotein expression or activity have used a Se-deficient vs. Se-supplementation model, our research has focused on understanding the effect of Se form (inorganic, organic, blend of inorganic and organic sources) using a Se-adequate model because most commercial beef producers use some form of supplemental Se to avoid Se deficiency. To date, our research has shown that the form (inorganic, organic, 1:1 mix of inorganic:organic) of supplemental (3 mg/d) dietary Se affects the concentration of Se in whole blood and expression of certain genes in the testes of neonatal calves (Cerny et al., 2016), livers of replacement beef heifers (Matthews et al., 2014), and livers (Jia et al., 2018) and pituitaries (Li et al., 2019) of growing beef steers. Most recently, we have reported (Jia et al., 2018; Jia et al., 2019) that the whole blood concentration of Se in Study 2 steers was greater for OSe (11%) and MIX (7.5%) vs. ISe steers, indicating a greater whole-body Se assimilation for OSe and MIX steers. In addition, the OSe and MIX steers of Study 2 had greater concentrations of serum prolactin and albumin (Jia et al., 2018), and serum alkaline phosphatase activity (Jia et al., 2019) than ISe steers, and were positively correlated with whole blood Se concentrations.
Despite these identified Se form-altered physiological parameters, a limitation of the present study is that potential differences in selenoprotein activity of differentially expressed mRNA was not determined. Thus, as with most genomic and targeted mRNA studies, the reader is cautioned to keep this limitation in mind when considering the physiologic consequences of reported Se form-induced changes in selenoprotein mRNA content.
In the pituitary, Se treatments had a combination of similar and dissimilar effects on expression of selenoproteins. With regard to redox potential, the increased expression of methionine sulfoxide reductase B1 (MSRB1) mRNA in both MIX and OSe steers suggests that the organic forms of Se resulted in a greater capacity to reduce the R-isomer of oxidized methionine-sulfoxide back to methionine in the nucleus and cytosol (Kim and Gladyshev, 2004), thus a greater capacity to repair oxidative-damaged proteins (Krukov et al., 2002). Although we only measured MSRB1 mRNA content, and not MSRB1 protein content or activity, in human hepatic carcinomas, the expression of MSRB1 protein has been shown to be transcriptionally regulated (He at al., 2018).
Of note, pituitary expression was increased for the two glutathione peroxidases (GPX3, GPX4) and two thioredoxin reductases (TXNRD1, TXNRD2) that had the greatest basal mRNA abundance in OSe and MIX steers, respectively. The OSe-stimulated increase in GPX3 (secreted extracellularly) and GPX4 (functions in the cytosol) suggests that the pituitaries of OSe steers might have a greater blood and pituitary cell (cytosol) potential than ISe steers to reduce hydrogen peroxide and lipid hydroperoxides at the expense of oxidizing glutathione (Flohé, 2012; Sies et al., 2017). From a whole-animal perspective, the physiological consequence of (a) the high basal expression of GPX3 in the pituitary, and (b) that the increase in GPX3 expression was the greatest relative increase of any gene to Se form treatment is not clear, especially given that GPX3 is a secreted protein. In contrast to the pituitaries of OSe steers, MIX steers had an increased expression of TXNRD 1 and TXNRD 2 relative to ISe steers, indicating that the pituitaries of MIX steers might have a greater capacity to regenerate thioredoxin in the nucleus and cytosol, and mitochondrial, respectively (Avery and Hoffmann, 2018).
Selenoprotein P and its receptors
Unlike most other mammalian selenoproteins that usually contain one selenocysteine (Sec) residue, selenoprotein P contains 9 to 12 Sec residues (Read et al., 1990), with bovine selenoprotein P containing 12 Sec residues (Mostert, 2000). Although its mRNA is ubiquitously expressed, selenoprotein P is mainly synthesized and secreted by the liver (Labunskyy et al., 2014), and accounts for approximately 50% of the total Se in plasma (Burk and Hill, 2005). Selenoprotein P mRNA was the most abundant selenoprotein transcript in the liver. In the pituitary, selenoprotein P mRNA was moderately expressed relative to other selenoprotein mRNA.
The main function of selenoprotein P is thought to be that of Se transport, delivery, and storage (Burk et al., 1991; Saito and Takashi, 2002). There are two known endocytic selenoprotein P receptors that enable the tissue-specific absorption of selenoprotein P by extrahepatic cells, lipoprotein-receptor-related protein 8 (LRP8, a.k.a. apoER2), (Olson et al., 2007) and LRP2 (a.k.a. megalin; (Olson et al., 2008). Both of these receptors are members of the low-density lipoproteinreceptor family and recognize a wide variety of substrates besides selenoprotein P (Marzolo and Farfán, 2011). LRP8 is lowly expressed by mouse liver tissue relative to other tissues (Burk and Hill, 2015), whereas the reported expression of LRP8 by the pituitary is unknown to the authors. Similar to LRP8, LRP2 is lowly expressed by rodent liver (Claudius et al., 2007). In contrast to LRP8, LRP2 is highly expressed by the folliculostellate cells in the anterior pituitary tissue of rats (Claudius et al., 2007).
In Study 2, pituitary expression of SELENOP was not affected by Se treatment, whereas expression of LRP2 was decreased and LRP8 increased in MIX steers. Because the hierarchy that exists for Se assimilation among tissues is thought to be largely determined by the binding of liver-produced circulating selenoprotein P by LRP8 (Burk and Hill, 2015), these findings suggest that the pituitaries of MIX steers may have had a greater capacity to absorb SelP from the blood than ISe steers. However, the actual physiological significance of these findings remains to be determined, especially given that the blood concentration of Se was 7.5% greater in MIX than ISe steers of this study, as previously reported (Jia et al., 2018), even though expression of SelP mRNA content tended to be lower than ISe steers and liver secretion of SelP is thought to greatly affect the concentration of Se in blood (Labunskyy et al., 2014). In addition, because selenoprotein P is not the only ligand of LRP8, other changes in MIX steers may be directly responsible for the increased expression of LRP8 in MIX steer liver.
Other selenoproteins
As described above, the mRNA content of selenoproteins M, N, and O in steer pituitaries, and selenoproteins O, S, and T in the liver, were affected by Se treatment. Because the biochemical functions of these proteins have not been clearly defined, the specific physiological consequence of these ostensible shifts in metabolic capacity is not clear. However, in the pituitary, SELENOM (selenoprotein M), which showed the greatest relative increased mRNA content in response to Se treatment, is proposed to be involved both in protection against oxidative damage by H2O2 and regulation of Ca2+ release from ER in neurons (Reeves et al., 2010). Selenoprotein O has been localized to the mitochondria, where it is thought to increase the redox potential (Han et al., 2014). Thus, the increased expression of SELENOM and SELENOO in OSe vs. ISe steers, presumably enhances the metabolic capacity of OSe steers. In contrast, the physiological consequence of the increased expression of SELENON in the pituitaries of MIX vs. ISe steers pituitaries is less obvious. Although Selenoprotein N plays a role in maintenance of muscle progenitor satellite cells and regeneration of impaired skeletal muscle (Castets et al., 2010), its role in other tissues is unknown.
Because the expression of seven other selenoprotein genes were greater for OSe than ISe steers, an unexpected finding was that pituitary expression of SEPHS2 was less in OSe than ISe steers. This finding seems incongruous with the understanding that selenophosphate synthetase 2 is required for selenoprotein synthesis, as it catalyzes the conversion of selenide to active Se donor selenophosphate (Xu et al., 2007). Thus, the significance of a reduced expression of SEPHS2 mRNA in the pituitary of OSe steers is unclear, especially given the increased concentration of Se in the blood of OSe versus ISe steers. However, liver expression of SEPHS2 decreases in lambs supplemented with ISe versus no Se supplementation and that had increased plasma concentrations of Se (Juszczuk-Kubiak et al., 2016).
The liver of MIX steers had greater expression of SELNOO and SELENOS relative to ISe and OSe steers, whereas both MIX and OSe steers had greater expression of SELENOT than ISe steers. Selenoprotein S is localized to the ER membrane and proposed to be involved in degradation of misfolded proteins (Labunskyy et al., 2014) and regulation of inflammatory and immune response (Curran et al., 2005; Gao et al., 2006). Like selenoprotein S, selenoprotein T is localized to the ER membrane (Shchedrina et al., 2010). Unlike selenoprotein S, selenoprotein T is thought to be involved in regulating Ca2+ homeostasis and, in keeping, sensitive to pituitary adenylate cyclase-activating peptide regulation (Grumolato et al., 2008; Youssef et al., 2018). Overall, this pattern of differential sensitivity to Se treatment indicates that MIX steers had a greater capacity to support hepatic metabolism than did ISe steers.
RT-PCR analysis found no difference in pituitary or liver tissue content of selenoprotein I, K, V, or W mRNA. Although the expression of selenoprotein W has been reported to be regulated by the availability of dietary Se (Howard et al., 2013), and by form of Se (Matthews et al., 2014), in this study the form of Se did not affect expression of SELENOW in either pituitary or liver tissue.
Summary
The expressed selenoprotein transcriptome has been characterized for the pituitary and liver of growing steers. The mRNA for 24 of 25 known bovine selenoproteins were detected in the pituitaries of growing beef steers grazing a pasture with low amounts of endophyte-infected tall fescue, whereas the mRNA for 23 selenoproteins were detected in their livers (Study 1). The expression of selenoprotein mRNA transcripts ranged over 5 orders of magnitude (<10 to >10,000). A hierarchy of count abundance was found within the isoforms of iodothyronine deiodinase, glutathione peroxidase, and thioredoxin reductase in both tissues.
Consumption of 3 mg Se/d in vitamin-mineral mixes as ISe, OSe, or MIX treatments differentially affected the expression of selenoprotein genes in both pituitaries and livers of growing beef steers commonly grazing an endophyte-infected tall fescue pasture. Most of the affected genes were either up-regulated by OSe or MIX treatments relative to ISe. The change in selenoprotein gene expression in pituitaries indicates that OSe steers have a greater potential capacity to manage against oxidative damage, maintain cellular redox balance, and have a better quality control of protein-folding in their pituitaries than ISe steers. The change in selenoprotein gene expression by the liver indicates that MIX steers have a greater redox signaling capacity and capacity to manage oxidative damage than ISe steers. We conclude that inclusion of 3 mg Se/d OSe or MIX forms of Se in free-choice vitamin-mineral mixes alters the selenoprotein transcriptome of both the pituitary and liver of growing steers consuming a Se-deficient (0.07 ppm) endophyte-infected tall fescue forage, in an ostensibly positive manner, consistent with the Se treatment-specific amelioration of important markers of fescue toxicosis in these same steers (Jia et al., 2018; Li et al., 2019; Jia et al., 2019).
Data availability statement
The original contributions presented in the study are included in the article/supplementary material. Further inquiries can be directed to the corresponding author.
Ethics statement
The animal study was reviewed and approved by University of Kentucky Institutional Animal Care and Use Committee.
Author contribution
JM and QL conceived and designed the studies. JM and PB garnered funding for the study. KC performed the NanoString analysis. QL performed the RT-PCR analysis. QL and JM conducted the statistical analyses. QL, JM, and KC wrote the initial draft of the manuscript. QL, KC, PB, and JM contributed to revision of the manuscript and approved the final version. All authors contributed to the article and approved the submitted version.
Funding
This work is supported by a United States Department of Agriculture-Agricultural Research Service Cooperative Agreement (JM, PB) and by the National Institute of Food and Agriculture, United States Department of Agriculture, Hatch project No.1010352 (JM).
Conflict of interest
The authors declare that the research was conducted in the absence of any commercial or financial relationships that could be construed as a potential conflict of interest.
Publisher’s note
All claims expressed in this article are solely those of the authors and do not necessarily represent those of their affiliated organizations, or those of the publisher, the editors and the reviewers. Any product that may be evaluated in this article, or claim that may be made by its manufacturer, is not guaranteed or endorsed by the publisher.
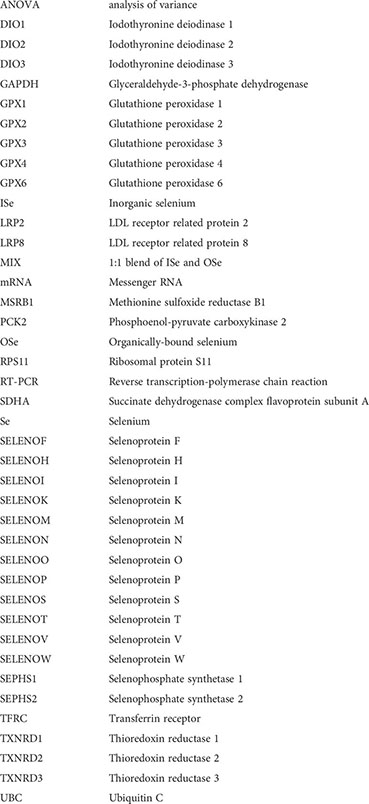
Glossary
References
Avery J. C., Hoffmann P. R. (2018). Selenium, selenoproteins, and immunity. Nutrients 10, 1203. doi: 10.3390/nu10091203
Brennan K. M., Burris W. R., Boling J. A., Matthews J. C. (2011). Selenium content in blood fractions and liver of beef heifers is greater with a mix of inorganic/organic or organic versus inorganic supplemental selenium but the time required for maximal assimilation is tissue-specific. Biol. Trace Elem. Res. 144 (1), 504–516. doi: 10.1007/s12011-011-9069-y
Bridges P. J., Jeoung M., Shim S., Park J. Y., Lee J. E., Sapsford L. A., et al. (2012). Hematopoetic prostaglandin d synthase: an ESR1-dependent oviductal epithelial cell synthase. Endocrinology 153, 1925–1935. doi: 10.1210/en.2011-1900
Brown K. R., Anderson G. A., Son K., Rentfrow G., Bush L. P., Klotz J. L., et al. (2009). Growing steers grazing high versus low endophyte (Neotyphodium coenophialum)-infected tall fescue have reduced serum enzymes, increased hepatic glucogenic enzymes, and reduced liver and carcass mass. J. Anim. Sci. 87, 748–760. doi: 10.2527/jas.2008-1108
Burk R. F., Hill K. E. (2005). Selenoprotein p: an extracellular protein with unique physical characteristics and a role in selenium homeostasis. Annu. Rev. Nutr. 25, 215–235. doi: 10.1146/annurev.nutr.24.012003.132120
Burk R. F., Hill K. E. (2015). Regulation of selenium metabolism and transport. Annu. Rev. Nutr. 35, 109–134. doi: 10.1146/annurev-nutr-071714-034250
Burk R. F., Hill K. E., Read R. ,. T. (1991). Response of rat selenoprotein p to selenium administration and fate of its selenium. Am. J. Physiol. 261, E26–E30. doi: 10.1152/ajpendo.1991.261.1.E26
Carr S. N., Crites B. R., Pate J. L., Hughes C. H. K., Matthews J. C., Bridges P. J. (2022). Form of supplemental selenium affects the expression of mRNA transcripts encoding selenoproteins, and proteins regulating cholesterol uptake, in the corpus luteum of grazing beef cows. Animals 12, 313. doi: 10.3390/ani12030313
Castets P., Bertrand A. T., Beuvin M., Ferry A., Grand F. L., Castets M., et al. (2010). Satellite cell loss and impaired muscle regeneration in selenoprotein n deficiency. Hum. Mol. Genet. 20, 694–704. doi: 10.1093/hmg/ddq515
Cerny K. L., Garbacik S., Skees C., Burris W. R., Matthews J. C., Bridges P. J. (2016). Gestational form of selenium in free-choice mineral mixes affects transcriptome profiles of the neonatal calf testis, including those of steroidogenic and spermatogenic pathways. Biol. Trace Elem. Res. 169, 56–68. doi: 10.1007/s12011-015-0386-4
Claudius L., Masaru U., Horii Y., Rudovick K., Yoshimi Y., Koichi M. (2007). Gene expression and immunohistochemical localization of megalin in the anterior pituitary gland of helmeted guinea fowl (Numida meleagris). J. Mol. Hist. 38, 65–77. doi: 10.1007/s10735-007-9079-4
Curran J. E., Jowett J. B., Elliott K. S., Gao Y., Gluschenko K., Wang J., et al. (2005). Genetic variation in selenoprotein s influences inflammatory response. Nat. Genet. 37, 1234–1241. doi: 10.1038/ng1655
Dargatz D. A., Ross P. F. (1996). Blood selenium concentrations in cows and heifers on 253 cow-calf operations in 18 states. J. Anim. Sci. 74, 2891–2895. doi: 10.2527/1996.74122891x
Flohé L. (2012). “Glutathione peroxidases,” in Selenoproteins and mimics. Eds. Liu J., Luo G., Mu Y. (New York: Zhejiang University Press, Hangzhou and Springer), pp 1–pp25.
Gao Y., Hannan N. R., Wanyonyi S., Konstantopolous N., Pagnon J., Feng H. C., et al. (2006). Activation of the selenoprotein SEPS1 gene expression by pro-inflammatory cytokines in HepG2 cells. Cytokine 33, 246–251. doi: 10.1016/j.cyto.2006.02.005
Gladyshev V. N., Arnér E. S., Berry M. J., Brigelius-Flohé R., Bruford E. A., Burk R. F., et al. (2016). Selenoprotein gene nomenclature. J. Biol. Chem. 291, 24036–24040. doi: 10.1074/jbc.M116.756155
Grumolato L., Ghzili H., Montero-Hadjadje M., Gasman S., Lesage J., Tanguy Y., et al. (2008). Selenoprotein T is a PACAP-regulated gene involved in intracellular Ca2+ mobilization and neuroendocrine secretion. FASEB J. 22, 1756–1768. doi: 10.1096/fj.06-075820
Han S. J., Lee B. C., Yim S. H., Gladyshev V. N., Lee S. R. (2014). Characterization of mammalian selenoprotein O: a redox-active mitochondrial protein. PloS One 9, e95518. doi: 10.1371/journal.pone.0095518
He Q., Li H., Meng F., Sun X., Feng X., Chen J., et al. (2018). Methionine sulfoxide reductase B1 regulates hepatocellular carcinoma cell proliferation and invasion via the mitogen-activated protein kinase pathway and epithelial-mesenchymal transition. Oxid. Med. Cell Longev. 2018, 5287971. doi: 10.1155/2018/5287971
Howard M. T., Carlson B. A., Anderson C. B., Hatfield D. L. (2013). Translational redefinition of UGA codons is regulated by selenium availability. J. Biol. Chem. 288, 19401–19413. doi: 10.1074/jbc.M113.481051
Huang Y., Rosenberg M., Hou L., Hu M. (2017). Relationships among environment, climate, and longevity in China. Int. J. Environ. Res. Public Health 14, 1195. doi: 10.3390/ijerph14101195
Jia Y., Li Q., Burris W. R., Aiken G. E., Bridges P. J., Matthews J. C. (2018). Forms of selenium in vitamin-mineral mixes differentially affect serum prolactin concentration and hepatic glutamine synthetase activity of steers grazing endophyte-infected tall fescue. J. Anim. Sci. 96, 715–727. doi: 10.1093/jas/skx068
Jia Y., Son K., Burris W. R., Bridges P. J., Matthews J. C. (2019). Forms of selenium in vitamin-mineral mixes differentially affect serum alkaline phosphatase activity, and serum albumin and blood urea nitrogen concentrations, of steers grazing endophyte-infected tall fescue. J. Anim. Sci. 97, 2569–2582. doi: 10.1093/jas/skz109
Juniper D. T., Phipps R. H., Ramos-Morales E., Bertin G. (2008). Effect of dietary supplementation with selenium-enriched yeast or sodium selenite on selenium tissue distribution and meat quality in beef cattle. J. Anim. Sci. 86, 3100–3109. doi: 10.2527/jas.2007-0595
Juszczuk-Kubiak E., Bujko K., Cymer M., Wicińska K., Gabryszuk M., Pierzchała M. (2016). Effect of inorganic dietary selenium supplementation on selenoprotein and lipid metabolism gene expression patterns in liver and loin muscle of growing lambs. Biol. Trace Elem. Res. 172, 336–345. doi: 10.1007/s12011-015-0592-0
Kim J. Y., Carlson B. A., Xu X., Zeng Y., Chen S., Gladyshev V. N., et al. (2011). Inhibition of selenocysteine tRNA[Ser] sec aminoacylation provides evidence that aminoacylation is required for regulatory methylation of this tRNA. Biochem. Biophys. Res. Commun. 409, 814–819. doi: 10.1016/j.bbrc.2011.05.096
Kim H. Y., Gladyshev V. N. (2004). Methionine sulfoxide reduction in mammals: characterization of methionine-r-sulfoxide reductases. Mol. Biol. Cell 15, 1055–1064. doi: 10.1091/mbc.e03-08-0629
Kozomara A., Birgaoanu M., Griffiths-Jones S. (2019). miRBase: from microRNA sequences to function. Nucleic Acids Res. 47, D155–D162. doi: 10.1093/nar/gky1141
Kryukov G. V., Castellano S., Novoselov S. V., Lobanov A. V., Zehtab O., Guigó R., et al. (2003). Characterization of mammalian selenoproteomes. Science 300, 1439–1443. doi: 10.1126/science.1083516
Kryukov G. V., Kumar R. A., Koc A., Sun Z., Gladyshev V. N. (2002). Selenoprotein r is a zinc-containing stereo-specific methionine sulfoxide reductase. Proc. Natl. Acad. Sci. U.S.A. 99, 4245–4250. doi: 10.1073/pnas.072603099
Labunskyy V. M., Hatfield D. L., Gladyshev V. N. (2014). Selenoproteins: molecular pathways and physiological roles. Physiol. Rev. 94, 739–777. doi: 10.1152/physrev.00039.2013
Liao S., Boling J. A., Matthews J. C. (2015). Gene expression profiling indicates an increased capacity for proline, serine, and ATP synthesis and mitochondrial mass by the liver of steers grazing high vs. low endophyte-infected tall fescue. J. Anim. Sci. 93, 5659–5671. doi: 10.2527/jas.2015-9193
Li Q., Hegge R., Bridges P. J., Matthews J. C. (2017). Pituitary genomic expression profiles of steers are altered by grazing of high vs. low endophyte-infected tall fescue forages. PloS One 12, e0184612. doi: 10.1371/journal.pone.0184612
Li Q., Jia Y., Burris W. R., Bridges P. J., Matthews J. C. (2019). Forms of selenium in vitamin-mineral mixes differentially affect the expression of genes responsible for prolactin, ACTH, and α-MSH synthesis and mitochondrial dysfunction in pituitaries of steers grazing endophyte-infected tall fescue. J. Anim. Sci. 97, 631–643. doi: 10.1093/jas/sky438
Livak K. J., Schmittgen T. D. (2001). Analysis of relative gene expression data using real-time quantitative PCR and the 2-ΔΔCT method. Methods 25, 402–408. doi: 10.1006/meth.2001.1262
Mariotti M., Ridge P. G., Zhang Y., Lobanov A. V., Pringle T. H., Guigo R., et al. (2012). Composition and evolution of the vertebrate and mammalian selenoproteomes. PloS One 7 (3), e33066. doi: 10.1371/journal.pone.0033066
Marzolo M. P., Farfán P. (2011). New insights into the roles of megalin/LRP2 and the regulation of its functional expression. Biol. Res. 44, 89–105. doi: 10.4067/S0716-97602011000100012
Matthews J. C., Zhang Z., Patterson J. D., Bridges P. J., Stromberg A. J., Boling J. A. (2014). Hepatic transcriptome profiles differ among maturing beef heifers supplemented with inorganic, organic, or mixed (50% inorganic: 50% organic) forms of dietary selenium. Biol. Trace Elem. Res. 160, 321–339. doi: 10.1007/s12011-014-0050-4
Mattmiller S. A., Carlson B. A., Sordillo L. M. (2013). Regulation of inflammation by selenium and selenoproteins: impact on eicosanoid biosynthesis. J. Nutr. Sci. 2, e28. doi: 10.1017/jns.2013.17
Mehdi Y., Dufrasne I. (2016). Selenium in cattle: A review. Molecules 21, 545. doi: 10.3390/molecules21040545
Mostert V. (2000). Selenoprotein p: properties, functions, and regulation. Arch. Biochem. Biophys. 376, 433–438. doi: 10.1006/abbi.2000.1735
NRC. (2016). “Minerals,” in Nutrient requirements of beef cattle, 8th rev (Washington, DC: National Academy Press), pp 127–pp 128. doi: 10.17226/19014
Olson G. ,. E., Winfrey V. P., Hill K. E., Burk R. F. (2008). Megalin mediates selenoprotein p uptake by kidney proximal tubule epithelial cells. J. Biol. Chem. 283, 6854–68560. doi: 10.1074/jbc.M709945200
Olson G. E., Winfrey V. P., NagDas S. K., Hill K. ,. E., Burk R. F. (2007). Apolipoprotein e receptor-2 (ApoER2) mediates selenium uptake from selenoprotein p by the mouse testis. J. Biol. Chem. 282, 12290–12297. doi: 10.1074/jbc.M611403200
Papp L. V., Lu J., Holmgren A., Khanna K. K. (2007). From selenium to selenoproteins: synthesis, identity, and their role in human health. Antioxid. Redox Signal. 9, 775–806. doi: 10.1089/ars.2007.1528
Qazi I. H., Angel C., Yang H., Pan B., Zoidis E., Zeng C. J., et al. (2018). Selenium, selenoproteins, and female reproduction: A review. Molecules 23, 3053. doi: 10.3390/molecules23123053
Read R., Bellew T., Yang J. G., Hill K. E., Palmer I. S., Burk R. F. (1990). Selenium and amino acid composition of selenoprotein p, the major selenoprotein in rat serum. J. Biol. Chem. 265, 17899–17905. doi: 10.1016/S0021-9258(18)38248-6
Reeves M. A., Bellinger F. P., Berry M. J. (2010). The neuroprotective functions of selenoprotein m and its role in cytosolic calcium regulation. Antioxid. Redox Signal. 12, 809–818. doi: 10.1089/ars.2009.2883
Saito Y., Takahashi K. (2002). Characterization of selenoprotein p as a selenium supply protein. Eur. J. Biochem. 269, 5746–5751. doi: 10.1046/j.1432-1033.2002.03298.x
Shchedrina V. A., Zhang Y., Labunskyy V. M., Hatfield D. L., Gladyshev V. N. (2010). Structure–function relations, physiological roles, and evolution of mammalian ER-resident selenoproteins. Antioxid. Redox Signal. 12, 839–849. doi: 10.1089/ars.2009.2865
Sies H., Berndt C., Jones D. P. (2017). Oxidative stress. Annu. Rev. Biochem. 86, 715–748. doi: 10.1146/annurev-biochem-061516-045037
Tinkov A. A., Ajsuvakova O. P., Filippini T., Zhou J.-C., Lei X. G., Gatiatulina E. R., et al. (2020). Selenium and selenoproteins in adipose tissue physiology and obesity. Biomolecules 10, 658. doi: 10.3390/biom10040658
Veldman-Jones M. H., Lai Z., Wappett M., Harbon C. G., Barrett J. C., Harrington E. A., et al. (2015). Reproducible, quantitative, and flexible molecular subtyping of clinical DLBCL samples using the NanoString nCounter system. Clin. Cancer Res. 21, 2367–2378. doi: 10.1158/1078-0432.CCR-14-0357
Wahlen R., Evans L., Turner J., Hearn R. (2005). The use of collision/reaction cell ICP-MS for the determination of elements in blood and serum samples. Spectroscopy 20, 84–90.
Xu X. M., Carison B. A., Irons R., Mix H., Zhong N., Gladyshev V. N., et al. (2007). Selenophosphate synthetase 2 is essential for selenoprotein biosynthesis. Biochem. J. 404, 115–120. doi: 10.1042/BJ20070165
Keywords: selenium supplementation, selenoprotein transcriptome, liver, pituitary, cattle
Citation: Li Q, Chen KC, Bridges PJ and Matthews JC (2022) Pituitary and liver selenoprotein transcriptome profiles of grazing steers and their sensitivity to the form of selenium in vitamin-mineral mixes. Front. Anim. Sci. 3:911094. doi: 10.3389/fanim.2022.911094
Received: 01 April 2022; Accepted: 06 July 2022;
Published: 04 August 2022.
Edited by:
Graham Cliff Lamb, Texas A&M University College Station, College Station, United StatesReviewed by:
Rodolfo Cardoso, Texas A&M University, United StatesJuliana Ranches, Oregon State University, United States
Pedro Fontes, University of Georgia, United States
Copyright © 2022 Li, Chen, Bridges and Matthews. This is an open-access article distributed under the terms of the Creative Commons Attribution License (CC BY). The use, distribution or reproduction in other forums is permitted, provided the original author(s) and the copyright owner(s) are credited and that the original publication in this journal is cited, in accordance with accepted academic practice. No use, distribution or reproduction is permitted which does not comply with these terms.
*Correspondence: James C. Matthews, amFtZXMubWF0dGhld3NAdWt5LmVkdQ==