 Keni Ren
 Moudud Alam
 Per Peetz Nielsen
 Maya Gussmann
 Lars Rönnegård
94% of researchers rate our articles as excellent or good
Learn more about the work of our research integrity team to safeguard the quality of each article we publish.
Find out more
ORIGINAL RESEARCH article
Front. Anim. Sci., 24 May 2022
Sec. Precision Livestock Farming
Volume 3 - 2022 | https://doi.org/10.3389/fanim.2022.896666
Position data from real-time indoor positioning systems are increasingly used for studying individual cow behavior and social behavior in dairy herds. However, missing data challenges achieving reliable continuous activity monitoring and behavior studies. This study investigates the pattern of missing data and alternative interpolation methods in ultra-wideband based real-time indoor positioning systems in a free-stall barn. We collected 3 months of position data from a Swedish farm with around 200 cows. Data sampled for 6 days from 69 cows were used in subsequent analyzes to determine the location and duration of missing data. Data from 20 cows with the most reliable tags were selected to compare the effects of four different interpolation methods (previous, linear interpolation, cubic spline data interpolation and modified Akima interpolation). By comparing the observed data with the interpolations of the simulated missing data, the mean error distance varied from around 55 cm, using the previously last observed position, to around 17 cm for modified Akima. Modified Akima interpolation has the lowest error distance for all investigated activities (rest, walking, standing, feeding). Larger error distances were found in areas where the cows walk and turn, such as the corner between feeding and cubicles. Modified Akima interpolation is expected to be useful in the subsequent analyses of data gathered using real-time indoor positioning systems.
Real-time indoor positioning systems that provide the position of individual cows inside dairy barns allow modern farms to monitor cows' behavior and activity patterns continuously. Ultra-wideband (UWB) technology, one of the most accurate indoor positioning technologies (Pascacio et al., 2021), has been used to monitor individual cows' feeding behavior (Pastell and Frondelius, 2018), activity patterns (Benaissa et al., 2020) and social bonds within cow groups (Rocha et al., 2020).
However, sufficient data quality is needed to achieve reliable behavior studies using the data from positioning systems. Real-time position systems may have problems with missing data due to physical structures, calibration, or communication failures between resources in the system. Missing data brings challenges for reliable continuous monitoring of animal activity and subsequent studies of behavior and social interactions, especially if there are long time-gaps in the data. Missing data issues have been reported in several previous studies. Gygax et al. (2007) demonstrated a UWB system (Abatec, Regau, Austria) with 0.5 m spatial precision and 13% missing values. Porto et al. assessed UWB ear-tags (Ubisense, UK) with a mean accuracy of 0.51 m and 2% missing values (Porto et al., 2014). Meunier et al. reported that, on average, 2.6 h of data was missing per 24 h (CowView, GEA Farmtechnology, Germany). The variance of the missing data between cows was 10%, and within the tag for different days it was 5% (Meunier et al., 2018). Pastell et al. reported a UWB system (Ubisense, UK) where 58% of data was missing, with a large variation of missing data between cows (ranging from 11 to 76%). Most of the missing data in the trial of Pastell et al. (2018) occurred in the stalls and near the edges of the coverage of the positioning system. Still, the effects on the data reliability have rarely been quantified in the livestock production research literature.
Data interpolation methods can standardize the resolution of the real-time location data and it is necessary to fill in the missing data to continuously calculate spatial proximity interactions between cows used in social network studies. For a real-time system, it is difficult to make better predictions of missing positions than applying extrapolation using the previous last non-missing entry. Whereas, detailed analyses of already collected data can be improved substantially by using suitable interpolation methods for the positioning data. A median filter and image analyses have been used to refine UWB-based behavior classification (Meunier et al., 2018). UWB and computer vision modules have been combined using timestamp and floor plans to analyze social interactions in dairy cattle (Ren et al., 2021a). Pastell et al. designed a jump filter and Kalman filter to improve the accuracy of the UWB positioning system at the same time as linear piecewise interpolation was used to fill in missing data (Pastell et al., 2018). Melzer et al. (2021) used a stepwise linear interpolation method while calculating proximity relationships between cows. However, previous studies have only conducted limited validations from the aspect of data interpolation.
In this study, we investigate the pattern of missing data and alternative interpolation methods for data collected in free-stall barns using UWB-based real-time locating system. The aim of the study is to find an appropriate interpolation method by evaluating several methods in terms of prediction accuracy for various sections of the barn where different cow activities occur.
The study was conducted on a commercial dairy farm located in Sweden. It houses around 200 milking cows (purebred Holstein Friesian or Swedish Red and crossbreds) in a non-insulated free-stall barn (Churakov et al., 2021; Ren et al., 2021b). The barn had a rectangular plan of 74 × 33 m, with feeding alleys on both sides of the barn along the outer walls (Figure 1A). The cows were kept in two groups where each group had access to one of the two feeding alleys (Figure 1A). They were fed a total mixed ratio ad libitum with fresh feed delivered 12 times a day. The cows were milked twice a day in an adjoining milking barn with a milking parlor (2 × 12 GEA Euro class 800 with Dematron 75, GEA Farm Technology, Bönen, Germany). The cubicles were fitted with rubber mattresses and sawdust.
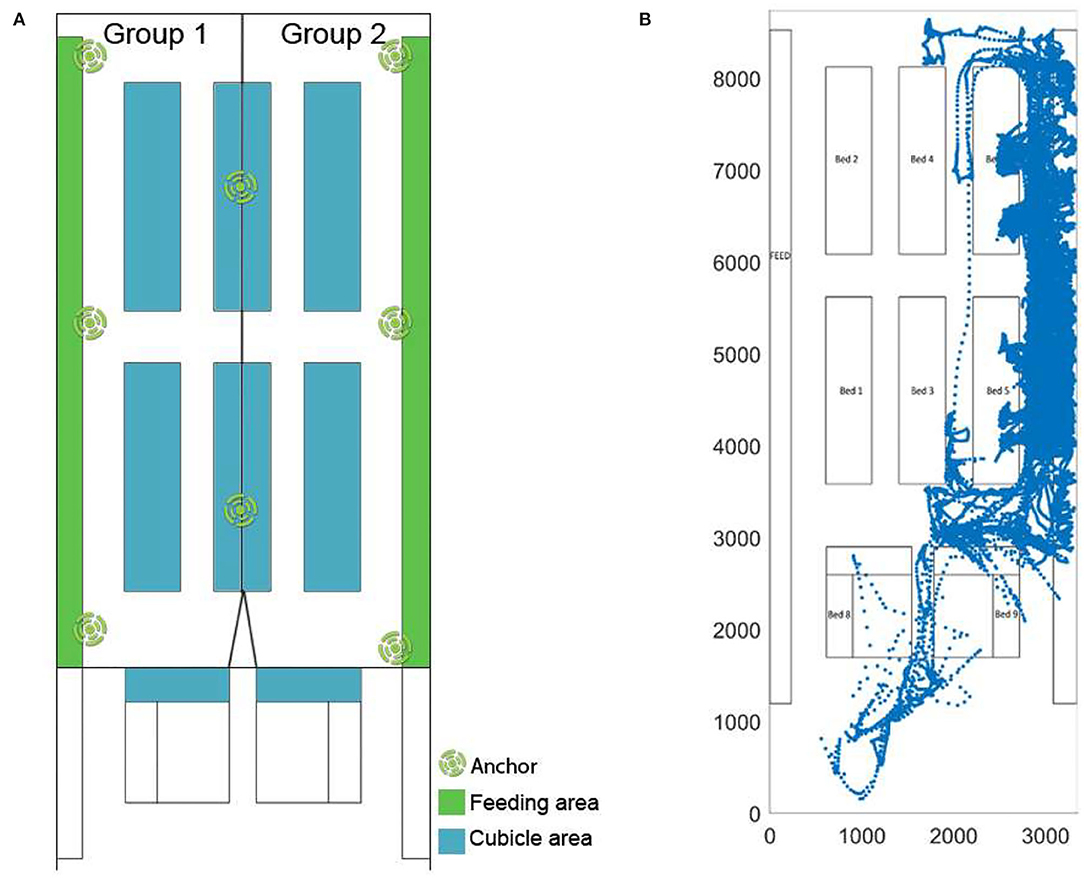
Figure 1. (A) Layout of the barns equipped with the CowView system (GEA Farm Technologies). The barn under study (74 × 33 m) has feeding alleys on both sides of the barn toward the wall, and cubicles are in the central parts of the barn. (B) One example of a cow's trajectory of a day (24 h).
The CowView positioning system was installed and has been actively used on the farm for around 10 years for health surveillance, heat detection and identification of cows. All the cows were equipped with an active tag embedded collar, with the tag mounted on top of the neck. The position of each individual was provided at a temporal resolution of 1 Hz approximately throughout the entire study duration. The real-time locating system had eight anchors (fixed points to define the coordinate system) installed on the ceiling at the same height throughout the barn to provide coverage of the whole barn area (Figure 1A). Each anchor was powered and connected to the local system through an Ethernet cable. The data was automatically logged by adding an external computer to the CowView system at the farm. It was pre-processed through a chain of data processing modules and then transmitted to the GEA database (Sloth and Frederiksen, 2019). It resulted in an output file containing tag name, timestamp, and the (x, y) coordinate (FA data files in the CowView system). One example of a cow's trajectory for a full day is shown in Figure 1B. The study utilized position data from November 2019 to January 2020. Six days (continuous 24 h on each day) evenly distributed throughout the 3-month period were sampled to reduce the burden of the huge volume of data.
The missing data pattern was quantified based on 69 cows' movement patterns in the dairy barn for 6 days. The data from these cows are the same as in Ren et al. (2021b) with in total 80,598,108 observations. Data missing 1 s, 5 consecutive s, and 10 consecutive min averaged 31.29, 18, and 4% of the study duration, respectively. A short period of missing data can easily be interpolated. Therefore, more than 5 s of continuous missing data from the UWB system was considered as missing in this study.
The proportion of missing data and the duration of missing data were analyzed. To quantify the missing data pattern, a 20 × 17 grid was applied for the farm's floorplan. The proportion of missing data positions was previously analyzed in Ren et al. (2021b), where the probability of having missing data within a pre-defined grid square was fitted. In the current study, we quantify the duration of missing data using a similar model with pre-defined grid squares.
The proportion of missing data was calculated for each grid square (Ren et al., 2021b) as
where xijk is the number of data points from cow i (i = 1,2,…, m) in grid square j (j = 1,2,…, q) at day k (k = 1,2,…,d), zijk is the number of times the positions were lost for more than 5 s for cow i in square j at day k, and consequently pijk is the proportion of lost positions for cow i in square j at day k.
Similarly, the duration of missing data was calculated for each grid square as
where gijk is the gap time for cow i in last non-missing entry square j at day k, and tijk is the average duration of missing data for cow i in square j at day k.
The proportion of missing data within each grid square was estimated by fitting a linear mixed model with spatial smoothing to logit transformed proportions (Ren et al., 2021b). In the current study, we also fit the duration of missing data using a similar model with spatial smoothing but with the duration of missing data as a Gamma distributed response variable. As in Ren et al. (2021b), we used the hglm package in R to fit this hierarchical generalized linear mixed model (HGLM) with spatial smoothing (Rönnegård et al., 2010; Alam et al., 2015). This model will from hereon be referred to as the duration of missing data model.
To evaluate and compare the different interpolation methods, 20 reliable tags were selected. These 20 tags were quantified for 6 days giving a total of 7,689,018 observations. These 20 tags had <25% data missing for 1 s or more and <13% data missing for 5 consecutive s or more. Although cows changed group during the study period, the number of cows in each group was similar (Table 1).
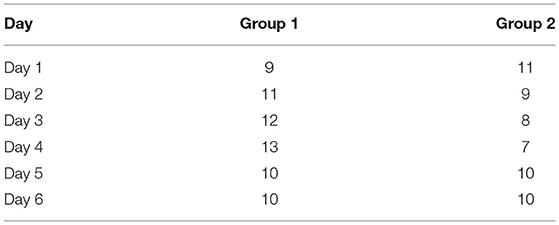
Table 1. Number of selected individuals in each group during the study period.
Missing data were simulated as follows:
1. The estimated probability of having a streak of missing data in grid square j (Equation 3) was used in the simulation to sample an instance of missing data given the position of the cow.
2. Given that an individual did get a streak of missing data, the duration of missing data was sampled from a Gamma distributed random variable, with parameters estimated from the fitted HGLM (Equation 4).
3. The simulations were repeated 10 times for every individual on all 6 days.
To model the missing data proportion, we fitted the following HGLM
where α is an intercept term, βi is the cow specific fixed effect, and uj is the j:th grid effect, such that where D is the q × q neighborhood matrix specifying which grid squares are neighbors with common edges. After fitting with the observed data, we estimated α = 8.5, σ = 2.4, ρ = 0.2. The minimum, maximum and median of the cow fixed effects were −7.7, 0.4, −5.7, respectively.
For the duration of missing data, no spatial correlations were detected in a Gamma HGLM and the model was reduced to the following generalized linear model
where αl is an intercept term, βli is the cow specific fixed effect and wj is the j:th grid specific fixed effect. After fitting the model with the data, we obtained −0.944. The minimum, maximum and median of the cow fixed effects were −0.17, 1.32, 0.52, respectively.
In the simulation study, the estimated model parameters (including the random effects) were used. For example, in simulating missing data occasion at location j, for cow i, we simulate a binary random variable with success probability where . Then, when a missing occasion is simulated (i.e., the value of the simulated binary random variable is 1), the respective length of missing data is simulated as a Gamma variable with mean , and the coefficient of variation (dispersion parameter) . A summary of the simulated missing data is given in the following sub-section.
The missing data pattern and missing data simulation steps were performed in R (Team, 2020). In total, 24,158,870 observations of missing data were simulated from the observed cow positions. Thus, for every position of simulated missing data, the observed position recorded in CowView was available, enabling assessment of the interpolation error. The simulated missing data heat map is shown in Figure 2A.
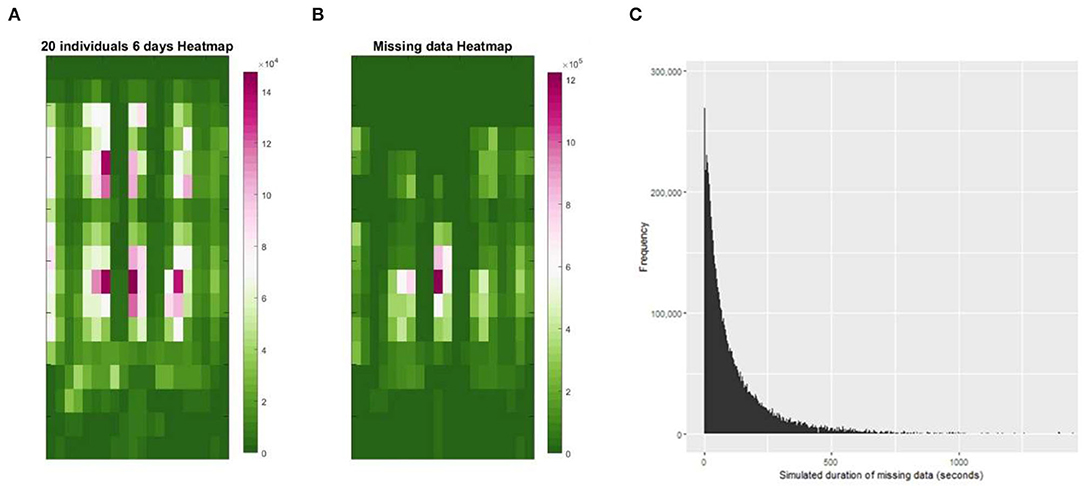
Figure 2. (A) Density plot of recorded positions for 20 individuals during 6 days. These were used for missing data simulation. (B) Density plot obtained by simulating missing data. (C) In total, there were 24,158,870 s of simulated missing data with the frequencies shown for values up to 1,400 s.
We investigated the impacts of four commonly used approaches for handling data interpolation: previous position, linear interpolation, cubic spline data interpolation and modified Akima interpolation:
Previous position fills missing data using the previous last non-missing entry. Hence, when missing data occurred, the cow was considered to be in its last recorded position. This is a simple extrapolation method often used by the farmer in real time to locate cows in the barn.
Linear interpolation interpolates a straight line between observed non-missing positions for every gap of missing data.
Spline interpolation performs cubic interpolation to produce piecewise polynomials with continuous second-order derivatives, which guarantees a smooth interpolation result (De Boor, 1978).
Modified Akima (Makima) is based on the Akima algorithm (Akima, 1970) and performs cubic interpolation to produce piecewise polynomials with continuous first-order derivatives.
Modified Akima works as follows. If is the slope on interval [xi, xi+1), the value of the derivative di at the point xi is a weighted average of nearby slopes:
with weight w1 and w2 as
The original Akima algorithm gives equal weight to the points on both sides, evenly dividing an undulation (Akima, 1970). When two flat regions with different slopes meet, the modification made to the original Akima algorithm gives more weight to the side where the slope is closer to zero. This modification prioritizes to the side that is closer to horizontal, which is more intuitive and avoids overshoot (Fried and Zietz, 1973). Whenever, there are three or more consecutive collinear points, the algorithm connects them with a straight line and thus avoids an overshoot. The modified Akima produces fewer undulations than “Spline” but does not flatten as aggressively as “Linear”.
All data sets were interpolated to a temporal resolution of 1 Hz, i.e., one position per second. For cow position data for each day with leading and trailing missing values, the nearest non-missing value was interpolated. For every position of simulated missing data, the observed position recorded in CowView was available. The error distance was calculated using the Euclidean distance between the interpolated result and the observed position.
The CowView system uses raw position data to produce clustered positions, which are then compared to a virtual map of the barn to detect basic activities such as resting, feeding, standing and walking. These activities are assigned reliably by the CowView system with an accuracy higher than 95% (Tullo et al., 2016) and were used in our assessment of interpolation errors for the four different activities: resting, feeding, standing and walking.
The simulated duration of missing data was Gamma distributed (Figure 2C). The longest simulated duration of missing data was 4,771 s, i.e., around 1 h 20 min, with 3,770 observations. Most of the simulated missing data are found in the cubicle area and close to the feeding tables (Figure 2B).
By comparing the observed data from the CowView system with the interpolations of the simulated missing data, the mean error distance varied from around 55 cm, using the crude method of previously last observed position, to around 17 cm for modified Akima (Table 2).
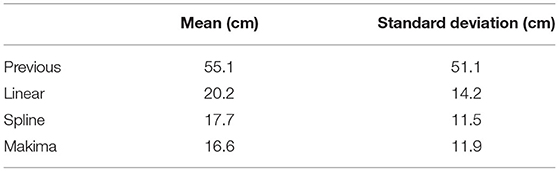
Table 2. Overall performance of different interpolation methods in centimeters.
Modified Akima interpolation has the lowest error distance for all investigated activities (Figure 3). The improvement in interpolation methods compared to using the last observed position (“Previous”) was largest when tracking individuals walking, while the error distances were smallest for animals resting in the cubicle area.
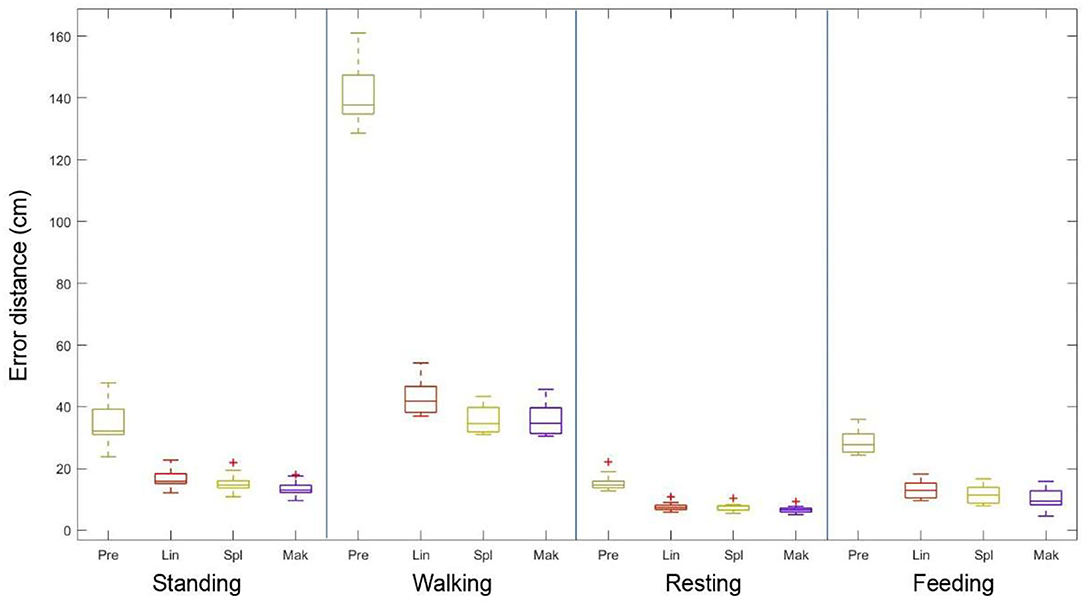
Figure 3. The performance of the four interpolation methods for different activities. The error distances were the largest for animals walking, while they were the smallest for animals resting in the cubicle area. The modified Akima interpolation methods improved performance compared to using the previous position (Pre); the improvement was the largest when tracking individuals walking.
Mean error distance in each grid square of the floorplan was calculated to investigate where the larger error distances occurred according to the layout of the barn. Larger errors were found in areas where the cows walk, i.e., between the cubicles (Figure 4).
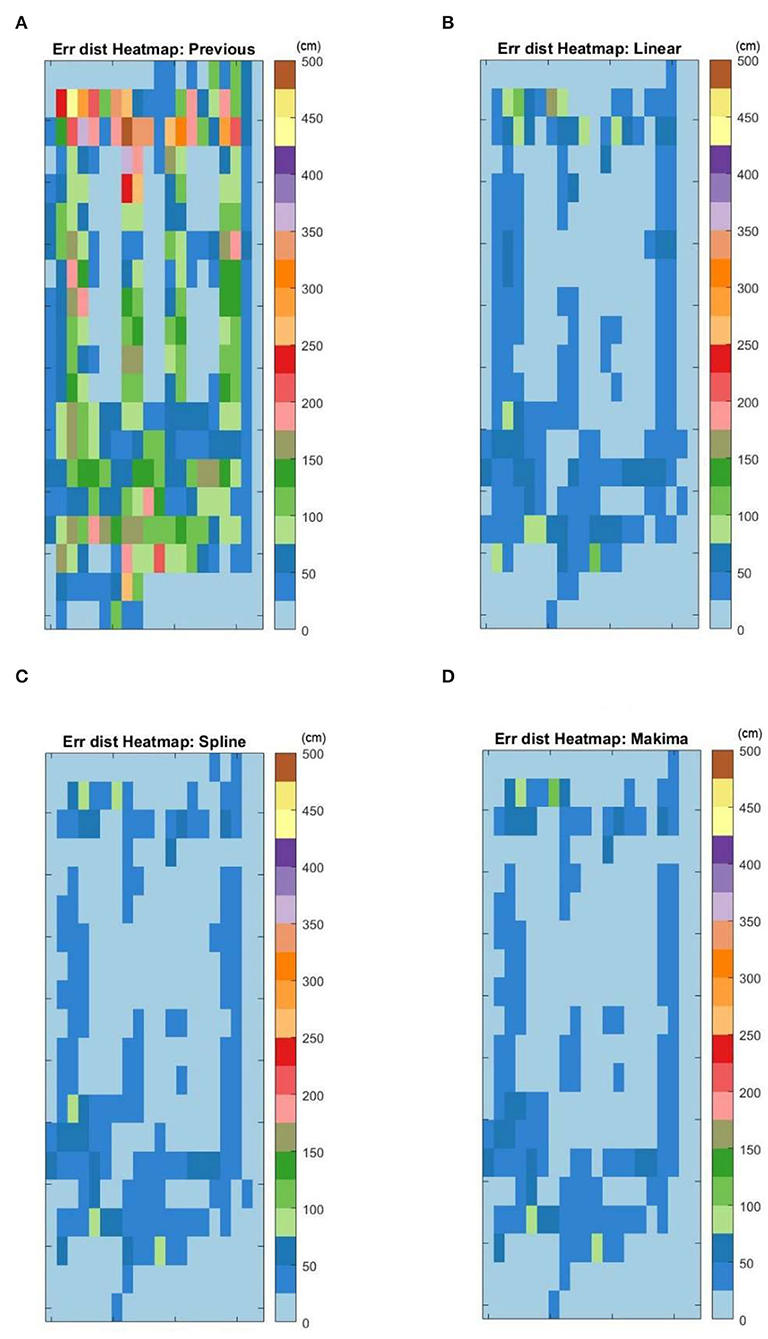
Figure 4. Mean error distance in each grid square of the floorplan was calculated to investigate where the larger error distances occurred according to the layout of the barn. (A) Mean error distances using Previous position. (B) Mean error distances using Linear interpolation. (C) Mean error distances using Spline interpolation. (D) Mean error distances using modified Akima interpolation.
All four interpolation methods were compared to assess how the error distance changes with the duration of the missing data. The mean error distance increased sharply for data missing from zero up to 1 min (Figures 5, 6). When the missing data duration was longer than 1 min, the mean error distances stabilized, while the variance of the error distance increased (Figure 5). The modified Akima interpolation method stabilized at a lower level than the other interpolation methods.
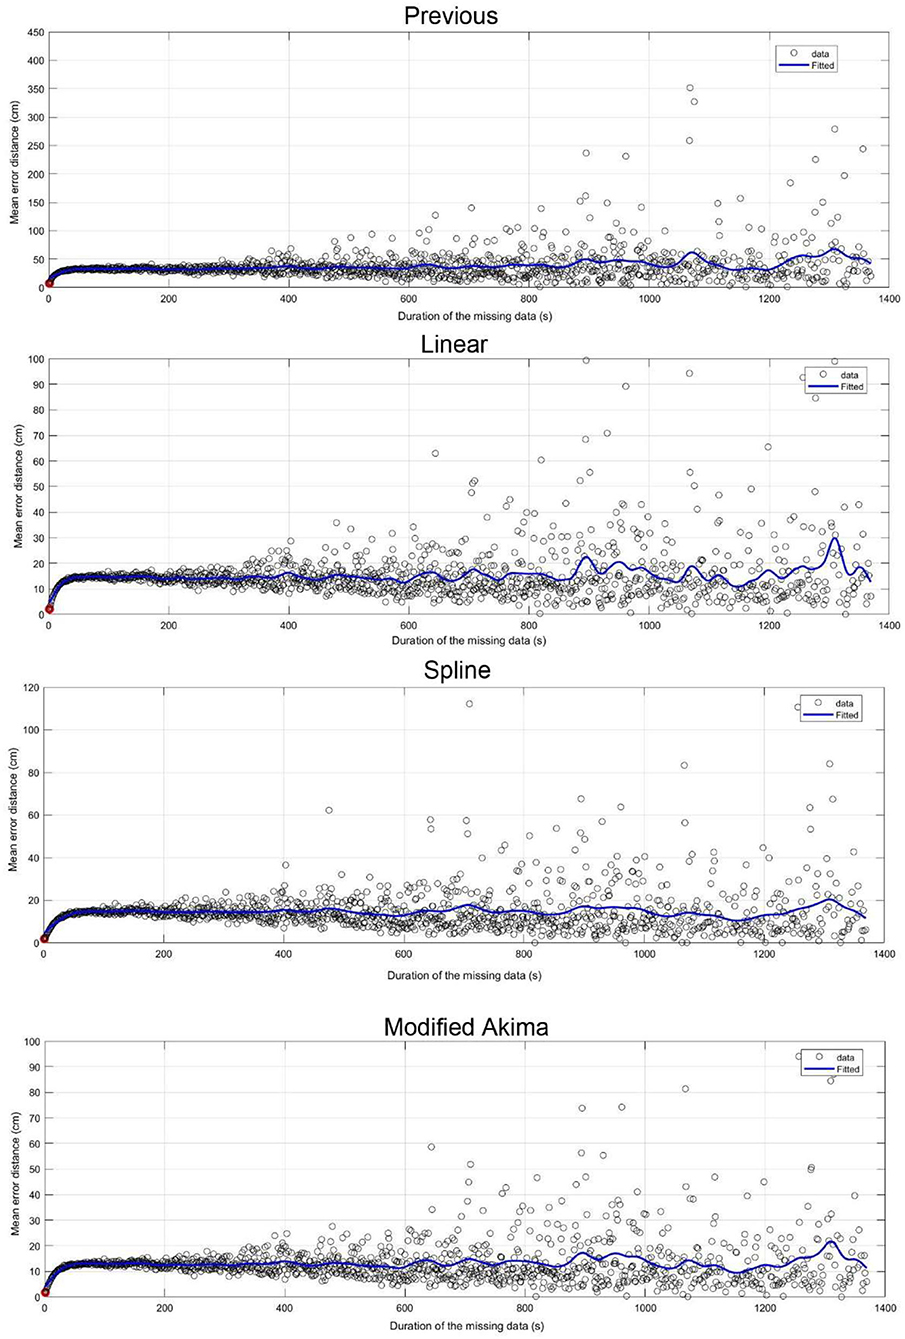
Figure 5. Development of mean error distance with the four different interpolation methods. The data points “o” (blank dots) are the mean error distances related to the duration of the missing data. The smooth curves are spline curves fitted to the data points.
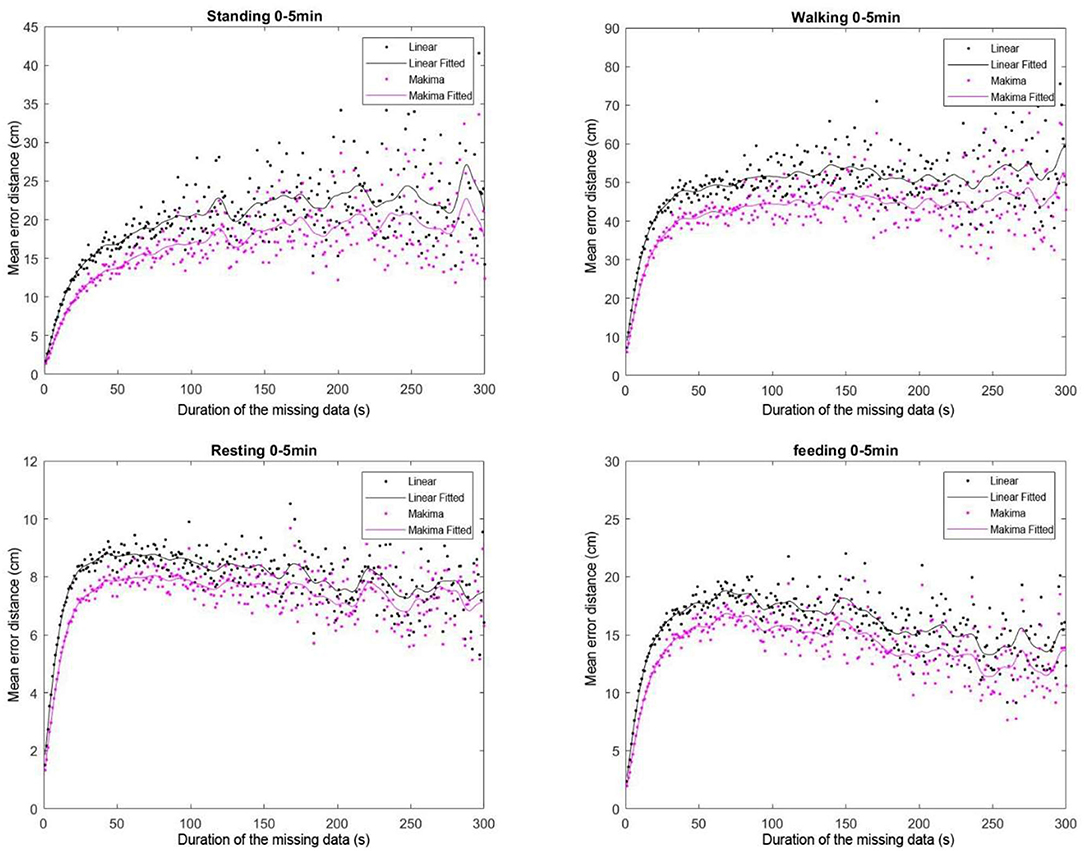
Figure 6. Development of mean error distance with the duration of the missing data for the four recorded activities. Linear interpolation (black) and modified Akima interpolation (pink) were compared for missing values up to 300 s. Using modified Akima interpolation, the mean error distances stabilized at lower levels than linear interpolation for all four activities.
Linear and Modified Akima interpolation was compared for different activities when the duration of the missing data was under 5 min. Modified Akima interpolation was substantially superior to linear interpolation for all four activities (Figure 6), with mean error distances stabilizing at lower levels.
We investigated the pattern of missing data and alternative interpolation methods for UWB positioning data collected in a free-stall barn. We aimed to find an appropriate interpolation method by evaluating alternative methods in terms of prediction accuracy for various sections of the barn where different cow activities occur. Extrapolation of missing data using the previous last non-missing entry is an obvious simple choice for real-time systems where the user expects a prediction in real time and cannot wait for interpolated data on future observations. Therefore, we evaluated the method “Previous position”. Our results show that detailed analyses of already collected positioning data can be improved substantially compared to the “Previous position” method by using suitable interpolation methods. Linear interpolation has previously been applied by Pastell et al. (2018) and Melzer et al. (2021) to deal with missing data. However, we chose to investigate the spline and modified Akima algorithms since they are not as flattened compared to the linear algorithm and are therefore expected to give better predictions for oscillatory data. The modified Akima algorithm produces fewer undulations than the spline algorithm and is more suited to deal with quick changes between flat regions. The modified Akima uses different weights to avoid overshoot and has been shown to adequately fit different types of movement data (Dan et al., 2020; Sakkos et al., 2021). In our analyses, we investigated the improvement in accuracy compared to simple extrapolation and found that modified Akima was the most accurate in all parts of the barn and for the different activities. Modified Akima showed a substantial improvement compared to simple extrapolation using the last previously observed position. The mean error distance was 55 cm using simple extrapolation, whereas for modified Akima the overall mean error distance was around 17 cm. Considering that there is noise in the data with a claimed accuracy of 50 cm for the CowView system (Meunier et al., 2018), it is not feasible to find a perfect interpolation, but given our results modified Akima showed the best performance.
The observed 20 cows spent 57% of the day resting, 20% of the day feeding, 10% of the day standing and 13% walking on average. We evaluated the prediction accuracy for resting, feeding, standing, and walking in different sections of the barn. The error distance was largest when tracking individuals walking, but once again modified Akima showed the best performance. When cows are in the feeding area, they often move back and forth within a limited area, which might explain why smaller error distances were found in the feeding area than in the walking area since smaller movements are easier to predict than large ones.
We investigated how the error distance changed when the duration of the missing data increased. For missing data durations longer than 1 min, the mean error distances from all four interpolation methods stabilized, while the variance of the error distance increased. A possible explanation for the stabilization of error distances after 1 min or more of missing data could be the fact that the animals move within a limited area inside the barn and tend not to move too far away.
The mean error distance increased sharply, as expected, for data missing up to 1 min since trajectories in shorter intervals are easier to interpolate. However, after around 1 min the mean error distance reaches a plateau (see Figure 6), which may be attributed to the system noise and features in cow movement trajectories. For cows in the resting area, the position of the tags can jump a small and limited distance on average around the actual lying position due to noise. Furthermore, for cows on the move, all interpolation methods predict a smooth trajectory; however, a cow's movement over a limited period of time is a mixture of standing and walking in different directions resulting in a limited mean error distance.
We found larger errors in areas where the cows walk, e.g., corners around the feeding area and across cubicles (Figure 4). A free-stall barn is a known, fixed, and segmented environment. Interpolation methods considering the barn's structure could be investigated more in future studies to increase interpolation accuracy in these areas of the barn. The need for refinement in accuracy depends on the analyses that the data is intended for. If, for instance, the data is intended for studying social interactions during a short specific time of the day, there is a stronger need for accurate interpolations than computations of summary statistics for social interactions over an entire day. Nevertheless, the noise in the observed positions limits how much the data interpolation can be improved.
Positioning data collected by RTLS for detailed analysis of animal activity and social interactions need to be well prepared. Our results demonstrated how well missing positioning data inside free-stall dairy farms can be interpolated. Modified Akima interpolation was found to give a substantial improvement compared to simple extrapolation and was found to be the most accurate interpolation method in all parts of the barn. Modified Akima interpolation has the lowest error distance for resting, feeding, standing, and walking activities. Interpolation of missing data is expected to provide more reliable position data; therefore it may come handy in enhancing further analyses of indoor cow behavior and social interactions. However, how much do these proposed imputation methods contribute to a typical cow behavior analysis (e.g., in terms of accuracy of a cow social network analysis) would be an interesting issue to further investigate. We leave this issue for a possible future work.
The raw data supporting the conclusions of this article will be made available by the authors, without undue reservation.
Ethical review and approval was not required for the animal study because the authors declare that according to the Swedish Animal Welfare Act, no ethical approval is needed for this type of study, so the research was not submitted to an Animal Ethics Committee.
KR, MA, and LR conceived and planned the simulation study and analyses. PN was responsible for data collection. KR, MA, and MG were responsible for data curation. KR took the lead in writing the manuscript. All authors provided critical feedback, contributed to the interpretation of the results, and helped shape the research, analyses and manuscript. All authors contributed to the article and approved the submitted version.
This project was funded by Formas—The Swedish Research Council for Sustainable Development (Stockholm, Sweden; ID: 2019-02276 and 2019-02111) and by the Kjell and Märta Beijer Foundation (Stockholm, Sweden).
The authors declare that the research was conducted in the absence of any commercial or financial relationships that could be construed as a potential conflict of interest.
All claims expressed in this article are solely those of the authors and do not necessarily represent those of their affiliated organizations, or those of the publisher, the editors and the reviewers. Any product that may be evaluated in this article, or claim that may be made by its manufacturer, is not guaranteed or endorsed by the publisher.
Akima, H. (1970). A new method of interpolation and smooth curve fitting based on local procedures. J. ACM. 17, 589–602. doi: 10.1145/321607.321609
Alam, M., Rönnegård, L., and Shen, X. (2015). Fitting conditional and simultaneous autoregressive spatial models in hglm. R J. 7, 5–18. doi: 10.32614/RJ-2015-017
Benaissa, S., Tuyttens, F. A. M., Plets, D., Trogh, J., Martens, L., Vandaele, L., et al. (2020). Calving and estrus detection in dairy cattle using a combination of indoor localization and accelerometer sensors. Comput. Electr. Agric. 168, 105153. doi: 10.1016/j.compag.2019.105153
Churakov, M., Silvera, A. M., Gussmann, M., and Nielsen, P. P. (2021). Parity and days in milk affect cubicle occupancy in dairy cows. Appl. Anim. Behav. Sci. 244, 105494. doi: 10.1016/j.applanim.2021.105494
Dan, E. L., Dînşoreanu, M., and Mureşan, R. C. (2020). “Accuracy of six interpolation methods applied on pupil diameter data,” in 2020 IEEE International Conference on Automation, Quality and Testing, Robotics (AQTR). Cluj-Napoca: IEEE.
Fried, J., and Zietz, S. (1973). Curve fitting by Spline and Akima methods: possibility of interpolation error and its suppression. Phys. Med.and Biol. 18, 550. doi: 10.1088/0031-9155/18/4/306
Gygax, L., Neisen, G., and Bollhalder, H. (2007). Accuracy and validation of a radar-based automatic local position measurement system for tracking dairy cows in free-stall barns. Comput. Electr. Agric. 56, 23–33. doi: 10.1016/j.compag.2006.12.004
Melzer, N., Foris, B., and Langbein, J. (2021). Validation of a real-time location system for zone assignment and neighbor detection in dairy cow groups. Comput. Electr. Agric. 187, 106280. doi: 10.1016/j.compag.2021.106280
Meunier, B., Pradel, P., Sloth, K. H., Cirié, C., Delval, E., Mialon, M. M., et al. (2018). Image analysis to refine measurements of dairy cow behaviour from a real-time location system. Biosyst. Eng. 173, 32–44. doi: 10.1016/j.biosystemseng.2017.08.019
Pascacio, P., Casteleyn, S., Torres-Sospedra, J., Lohan, E. S., and Nurmi, J. (2021). Collaborative indoor positioning systems: a systematic review. Sensors 21, 1002. doi: 10.3390/s21031002
Pastell, M., and Frondelius, L. (2018). A hidden Markov model to estimate the time dairy cows spend in feeder based on indoor positioning data. Comput. Electr. Agric. 152, 182–185. doi: 10.1016/j.compag.2018.07.005
Pastell, M., Frondelius, L., Järvinen, M., and Backman, J. (2018). Filtering methods to improve the accuracy of indoor positioning data for dairy cows. Biosyst. Eng. 169, 22–31. doi: 10.1016/j.biosystemseng.2018.01.008
Porto, S. M. C., Arcidiacono, C., Giummarra, A., Anguzza, U., and Cascone, G. (2014). Localisation and identification performances of a real-time location system based on ultra wide band technology for monitoring and tracking dairy cow behaviour in a semi-open free-stall barn. Comput. Electr. Agric. 108, 221–229. doi: 10.1016/j.compag.2014.08.001
Ren, K., Bernes, G., Hetta, M., and Karlsson, J. (2021a). Tracking and analysing social interactions in dairy cattle with real-time locating system and machine learning. J. Syst. Architect. 116, 102139. doi: 10.1016/j.sysarc.2021.102139
Ren, K., Nielsen, P. P., Alam, M., and Rönnegård, L. (2021b). Where do we find missing data in a commercial real-time location system? Evidence from 2 dairy farms. JDS Commun. 2:345–350. doi: 10.3168/jdsc.2020-0064
Rocha, L. E., Terenius, O., Veissier, I., Meunier, B., and Nielsen, P. P. (2020). Persistence of sociality in group dynamics of dairy cattle. Appl. Anim. Behav. Sci. 223, 104921. doi: 10.1016/j.applanim.2019.104921
Rönnegård, L., Shen, X., and Alam, M. (2010). hglm: a package for fitting hierarchical generalized linear models. R J. 2, 20–28. doi: 10.32614/RJ-2010-009
Sakkos, D., Mccay, K. D., Marcroft, C., Embleton, N. D., Chattopadhyay, S., and Ho, E. S. (2021). Identification of abnormal movements in infants: a deep neural network for body part-based prediction of cerebral palsy. IEEE Access 9, 94281–94292. doi: 10.1109/ACCESS.2021.3093469
Sloth, K. H., and Frederiksen, D. (2019). Computer System for Measuring Real Time Position of a Plurality of Animals. Washington, DC: Google Patents.
Team, R. C. (2020). R: A Language and Environment for Statistical Computing. Vienna: R Foundation for Statistical Computing.
Keywords: ultra-wideband, dairy cow, indoor positioning, data interpolation, precision livestock farming
Citation: Ren K, Alam M, Nielsen PP, Gussmann M and Rönnegård L (2022) Interpolation Methods to Improve Data Quality of Indoor Positioning Data for Dairy Cattle. Front. Anim. Sci. 3:896666. doi: 10.3389/fanim.2022.896666
Received: 15 March 2022; Accepted: 29 April 2022;
Published: 24 May 2022.
Edited by:
Suresh Neethirajan, Wageningen University and Research, NetherlandsReviewed by:
Agus Setiadi, Diponegoro University, IndonesiaCopyright © 2022 Ren, Alam, Nielsen, Gussmann and Rönnegård. This is an open-access article distributed under the terms of the Creative Commons Attribution License (CC BY). The use, distribution or reproduction in other forums is permitted, provided the original author(s) and the copyright owner(s) are credited and that the original publication in this journal is cited, in accordance with accepted academic practice. No use, distribution or reproduction is permitted which does not comply with these terms.
*Correspondence: Keni Ren, a2VuaS5yZW5Ac2x1LnNl
Disclaimer: All claims expressed in this article are solely those of the authors and do not necessarily represent those of their affiliated organizations, or those of the publisher, the editors and the reviewers. Any product that may be evaluated in this article or claim that may be made by its manufacturer is not guaranteed or endorsed by the publisher.
Research integrity at Frontiers
Learn more about the work of our research integrity team to safeguard the quality of each article we publish.