
95% of researchers rate our articles as excellent or good
Learn more about the work of our research integrity team to safeguard the quality of each article we publish.
Find out more
ORIGINAL RESEARCH article
Front. Anim. Sci. , 26 July 2022
Sec. Precision Livestock Farming
Volume 3 - 2022 | https://doi.org/10.3389/fanim.2022.883940
This article is part of the Research Topic Understanding Animals' Phenotype through Automatic Behavior Assessment View all 6 articles
 Lisette E. van der Zande1*
 Oleksiy Guzhva2
 Séverine Parois1,3
 Ingrid A. van de Leemput4
 J. Elizabeth Bolhuis1
 T. Bas Rodenburg1,5
Resilience could be referred to as the animal’s ability to successfully adapt to a challenge. This is typically displayed by a quick return to initial metabolic or activity levels and behaviors. Pigs have distinct diurnal activity patterns. Deviations from these patterns could potentially be utilized to quantify resilience. However, human observations of activity are labor intensive and not feasible in practice on a large scale. In this study, we show the use of a computer vision tracking algorithm to quantify resilience based on activity individual patterns following a lipopolysaccharide (LPS) challenge, which induced a sickness response. We followed 121 individual pigs housed in barren or enriched housing systems, as previous work suggests an impact of housing on resilience, for eight days. The enriched housing consisted of delayed weaning in a group farrowing system and extra space compared with the barren pens and environmental enrichment. Enriched housed pigs were more active pre-injection of LPS, especially during peak activity times, than barren housed pigs (49.4 ± 9.9 vs. 39.1 ± 5.0 meter/hour). Four pigs per pen received an LPS injection and two pigs a saline injection. LPS injected animals were more likely to show a dip in activity than controls (86% vs 17%). Duration and Area Under the Curve (AUC) of the dip were not affected by housing. However, pigs with the same AUC could have a long and shallow dip or a steep and short dip. Therefore the AUC:duration ratio was calculated, and enriched housed pigs had a higher AUC:duration ratio compared to barren housed pigs (9244.1 ± 5429.8 vs 5919.6 ± 4566.1). Enriched housed pigs might therefore have a different strategy to cope with an LPS sickness challenge. However, more research on this strategy and the use of activity to quantify resilience and its relationship to physiological parameters is therefore needed.
Several modern animal welfare definitions incorporate the animal’s ability to successfully cope with challenges in the environment (i.e. maintain homeostasis), and to reach a mental state that the animal experiences as positive (Ohl and Van der Staay, 2012; Mellor, 2016). Successful adaptation to a challenge results in a relatively swift recovery of baseline parameters, and this could be referred to as resilience (Colditz and Hine, 2016). Resilient animals are able to recover quickly from a challenge. This quick recovery implies a shorter exposure to a challenging situation that may impair welfare.
Pigs have a distinct diurnal activity pattern, where they usually have two activity peaks during the day (one in the morning and one in the afternoon), and are, on commercial farms, approximately 70% of their time relatively inactive (Fraser, 1985; Maselyne et al., 2014). Deviations from this rhythm might be used to determine the level of resilience of the animals (Aubert, 1999; van der Zande et al., 2020). Several studies showed deviations from daily activity patterns in both directions following a challenge. For instance, injection of a hypothalamic stress hormone (Corticotropin-releasing factor or CRF) increases locomotor activity in pigs (Salak-Johnson et al., 2004), whereas sickness often causes a decrease in active behavior (more lying, less standing) (Escobar et al., 2007; Nordgreen et al., 2018; Munsterhjelm et al., 2019). These deviations from daily activity patterns might be influenced by the housing conditions or the sex of the animal. Van van Dixhoorn et al. (2016) showed that housing pigs in an enriched environment, with increased space allowance, rooting materials and early-life access to non-littermates, reduced disease susceptibility to co-infection of PRRSV and A. pleuropneumoniae (APP), as reflected in a quicker clearance of the PRRSV virus, and a lower probability to develop lung lesions in response to the APP infection that followed. In addition, barren housed pigs showed a stronger decrease in activity than enriched housed pigs the day after infection with A. pleuropneumoniae. This suggests a better resilience to a sickness challenge when enrichment is provided.
Quantification of behavioral changes through human observations could be time consuming and subjective, especially when the number of animals to observe increases. Computer vision has the capacity to automatically track individual pigs in a fast and objective manner (Alameer et al., 2020; Psota et al., 2020; van der Zande et al., 2021). Based on the continuous location data of each individual pig generated by a computer vision tracking algorithm, the distance moved can be calculated. Distance moved is, in turn, a quantitative measure for activity. A computer vision tracking algorithm is, therefore, able to quantify the diurnal activity rhythm and its corresponding deviations at the level of the individual pig.
Lipopolysaccharide (LPS) endotoxin, a component of the cell wall of gram-negative bacteria, is a well-known agent used in different sickness models. The sickness response includes physiological changes like fever, but also behavioral changes, referred to as ‘sickness behavior’, such as lethargy, anorexia and decreased social motivation (Aubert, 1999; Weary et al., 2009). Sickness behavior involves deviations from the diurnal activity rhythm (Moya et al., 2008; Nordgreen et al., 2018; Munsterhjelm et al., 2019; Veit et al., 2021; Parois et al., 2022). An LPS challenge is a suitable sickness model to verify whether a computer vision tracking algorithm is able to detect potential deviations from a diurnal activity rhythm in a controlled and measurable manner. Most studies using an LPS challenge in pigs observe the animals for 24 hours or less (Johnson and Von Borell, 1994; Moya et al., 2006; Parois et al., 2022). However, Munsterhjelm et al. (2019) observed a change in social behavior even 40 hours after physiological signs of sickness had dissipated. So even without physiological signs of sickness, the behavior could still be affected by an LPS injection, even after several days post-challenge. Therefore, this study focused on the assessment of individual and group activity rhythms for eight days around an LPS challenge in barren and enriched housed pigs. We hypothesized to find a clear dip in activity following LPS injection as compared with controls. The aim of this study was to quantify resilience to LPS injection effects using derivatives from location data generated by a computer vision tracking algorithm and to investigate the possible effect of housing conditions and sex on resilience parameters.
The protocol of the experiment (AVD1040020186245) was approved by the Animal Care and Use Committee of Wageningen University & Research (Wageningen, The Netherlands) and in accordance with the Dutch law on animal experimentation, which complies with the European Directive 2010/63/EU on the protection of animals used for scientific purposes.
A total of 144 Topigs-20 x Tempo pigs (n = 71 females; n = 73 males) divided over three batches (n = 48 pigs per batch) were used [same animals as (Parois et al., 2022)]. Half of the pigs originated from a conventional farrowing pen (CONV) and the other half from an alternative group housing system (AHS) at the Swine Innovation Centre (Sterksel, The Netherlands). See below for details. All pigs were not castrated, nor tail docked, or teeth clipped.
Piglets were raised in two different housing systems, both at VIC Sterksel [similar to Van Nieuwamerongen et al. (2015)]. The AHS consisted of five farrowing pens of 3.2 × 2.2 m (mix solid and slatted floor), adjacent to a common area of 11.1 × 2.80 m (solid floor), dunging area (2.8 x 3.3m, slatted floor) and a feeding area (4.2 × 3.3 m, solid floor). Four jute bags were provided in the common area as enrichment. One week prior to the expected farrowing date, sows were moved to the AHS system, and a slide of straw was provided in the farrowing pens. Two days before the expected farrowing date, the sows were isolated in a farrowing pen and confined to a crate. They regained access to the full AHS system two days post farrowing. The piglets gained access to the full system one week post farrowing. Heated piglet nests were attached to the farrowing pen (0.7 x 1.6 m), with a temperature of 33-35°C (day 1 till day 7), 29-31°C (day 7 till day 25) and 23-26°C (day 25 till weaning). Piglets were fed in round bowls (until 5 weeks of age) and from a sensor-controlled automatic feeder (Rondomat, from 3 weeks of age). Sows were fed in a large trough placed on the floor, where piglets could participate in feeding. Ingestion of solid feed was stimulated with the use of intermittent suckling to facilitate gradual weaning from 4 weeks of age onwards, i,e., from day 28-34 sows were separated from the piglets from 7h till 17h in a separate area, and from day 35 onwards, sows could voluntarily access both this area and the AHS by stepping over a flexible partition. AHS piglets were weaned at an average of 62.6 ± 1.9 days and a bodyweight of 26.6 ± 4.9 kg. They received a starter diet from 35 days onwards.
In the CONV system, sows and their piglets stayed in the farrowing pens of 2.8 × 1.8 m until weaning. Sows were confined in crates with metal slats within the crate. Outside the crate was a part with a solid floor (1.2 x 0.3 m) with a heating lamp, and the remaining area was plastic slats. Piglets received additional creep feed in the farrowing pens from 1 week after birth. Piglets were weaned at average 27.4 ± 1.2 days of age and a bodyweight of 8.7 ± 1.3 kg. After weaning, eight piglets were housed with littermates in nursery pens of 3.18 × 1.0 m (0.40 m2 per piglet) for 5 additional weeks with a chain and jute bag as enrichment. A commercial weaner diet was provided for 10 days after weaning, and a starter diet, similar to that provided to AHS piglets, from 35 days onwards.
Lights were on from 7h to 19h in both systems, giving the sows and piglets a 12- hour light regime with 115 Lux. In addition, the AHS had natural daylight in the system. The transition between day and night light settings was done progressively in 10 min. The ambient temperature was set to 23°C in both systems. Water was available ad libitum in both systems.
After weaning of the AHS piglets at 9 weeks of age, all piglets were moved from VIC Sterksel to the Carus research facilities in Wageningen, the Netherlands, where they were mixed in groups of six unrelated piglets originating from the same system. Litter, sex and weight were balanced between pens. Four animals per pen (focals, two males and two females) were exposed to experimental challenges, i.e. isolation, transport, LPS, heat, and wound healing, of which isolation and transport took place before the LPS challenge (for further details see Parois et al. (2022), while two other pigs, with the most deviating body weight from the pen average, served as controls.
CONV pigs were housed in standard barren pens 1.20 x 4.67 m with conventional space allowance (0.93 m2 per pig), with a solid and slatted floor without substrate. A ball with chain and a chain with screws were attached to the pen wall as enrichment. AHS pigs were housed in an enriched pen, double the size of a conventional pen, namely 2.40 x 4.67 m (1.87 m2 per pig). The pen was enriched with deep straw, peat and sawdust bedding, which was replenished regularly (2.5 kg of straw and 30 L of sawdust every day, 22.5 L peat every week). In addition to the bedding, AHS pigs were provided with hay, egg trays or alfalfa once a week and a chain, jute bag or rope (rotation every week), plus one extra toy out of six toys, which was rotated every two days. Enriched and barren pens were placed alternately in the rooms. All pigs had ad libitum access to water and to a standard commercial diet for growing pigs from a single pig feeder.
All pens were equipped with an RGB camera (Velleman: 1lux/f2.0) mounted perpendicular (top-down) above the pen. Videos from 3 barren pens were not used because the full pen was not visible due to a tilted camera. Videos were recorded with a frame rate of 25 FPS for 24 hours per day during the entire experiment. The resolution of the videos was 352 by 288 pixels. The total duration of the recorded video material was approximately 4600 hours.
The light regime was similar to that before 9 weeks of age, giving the pigs 115 Lux in the pens during the day (from 7h to 19h; 5000K ultraviolet A at an intensity of 42, 2700K at 60) and 30 Lux during the night (5000K ultraviolet A at an intensity of 3, 2700K at 0). The transition between the day and night rhythm was done progressively for 10 min. No natural daylight was available. The temperature was kept at 23°C for the first two days, then at 22°C for the two subsequent days and at 21°C onwards.
All focal pigs underwent multiple challenges described in (Parois et al., 2022). This study only uses data around the LPS challenge. Briefly, 92 focal pigs, four pigs per pen (two males and two females), at the age of 104.4 ± 1.7 days (weight: 60.0 ± 7.5 kg) were injected in the ear vein with 2 μg of LPS/kg of body weight [LPS sigma L4391 Escherichia coli O111:B4, dose and strain based on (Clouard et al., 2015)]. The animals were restrained using a nose-sling and LPS was injected using a catheter. Four animals were not injected with LPS due to health issues, and these were not included in this study. The other 48 control pigs, two pigs per pen (one male and one female), received a sterile saline injection in the same location as the LPS injected pigs. Due to time constraints, the pens were divided into two groups, balanced for the housing system, and injected on two consecutive days. Blood samples were collected at 24h before and 1h, 3h, 5h and 24h after the injection to characterize the physiological response to the challenge (Parois et al., 2022), which is not reported here. To minimize the effect of human interventions on distance moved, data of the whole pen were removed from 1 minute before until 4 minutes after the start of LPS injection and blood sampling. Videos from 3 days prior to injection starting at 7:00 till 4 days post-injection ending at 18:00 were selected to measure the distance moved (see below).
The computer vision tracking algorithm for object detection and tracking developed by van der Zande et al. (2021) was used to analyze the recorded videos. In short, this algorithm was trained on 4,000 annotated images originating from the same experiment (but different days) as described above. The You Only Look Once version 3 (YOLOv3) algorithm was used to detect pigs in their home pens (Redmon and Farhadi, 2018). The barren environment had a region of interest (ROI) zone manually defined, since pigs from neighboring pens were also visible due to the smaller size of the pen (Figure 1). Detections outside the pre-defined ROI zone were removed. For both environments, the numeric data for the detected bounding boxes was cleaned by removing false positive (FP) detections. FP detections were identified when more than six ‘pigs’ were detected within the frame. Only six pigs were housed per pen, so the six bounding boxes with the highest detection probability were kept for each processed frame. After the initial removal of extra detections, all bounding boxes with a probability of detecting a pig lower than 0.5 were removed to ensure that all random detections were deleted.
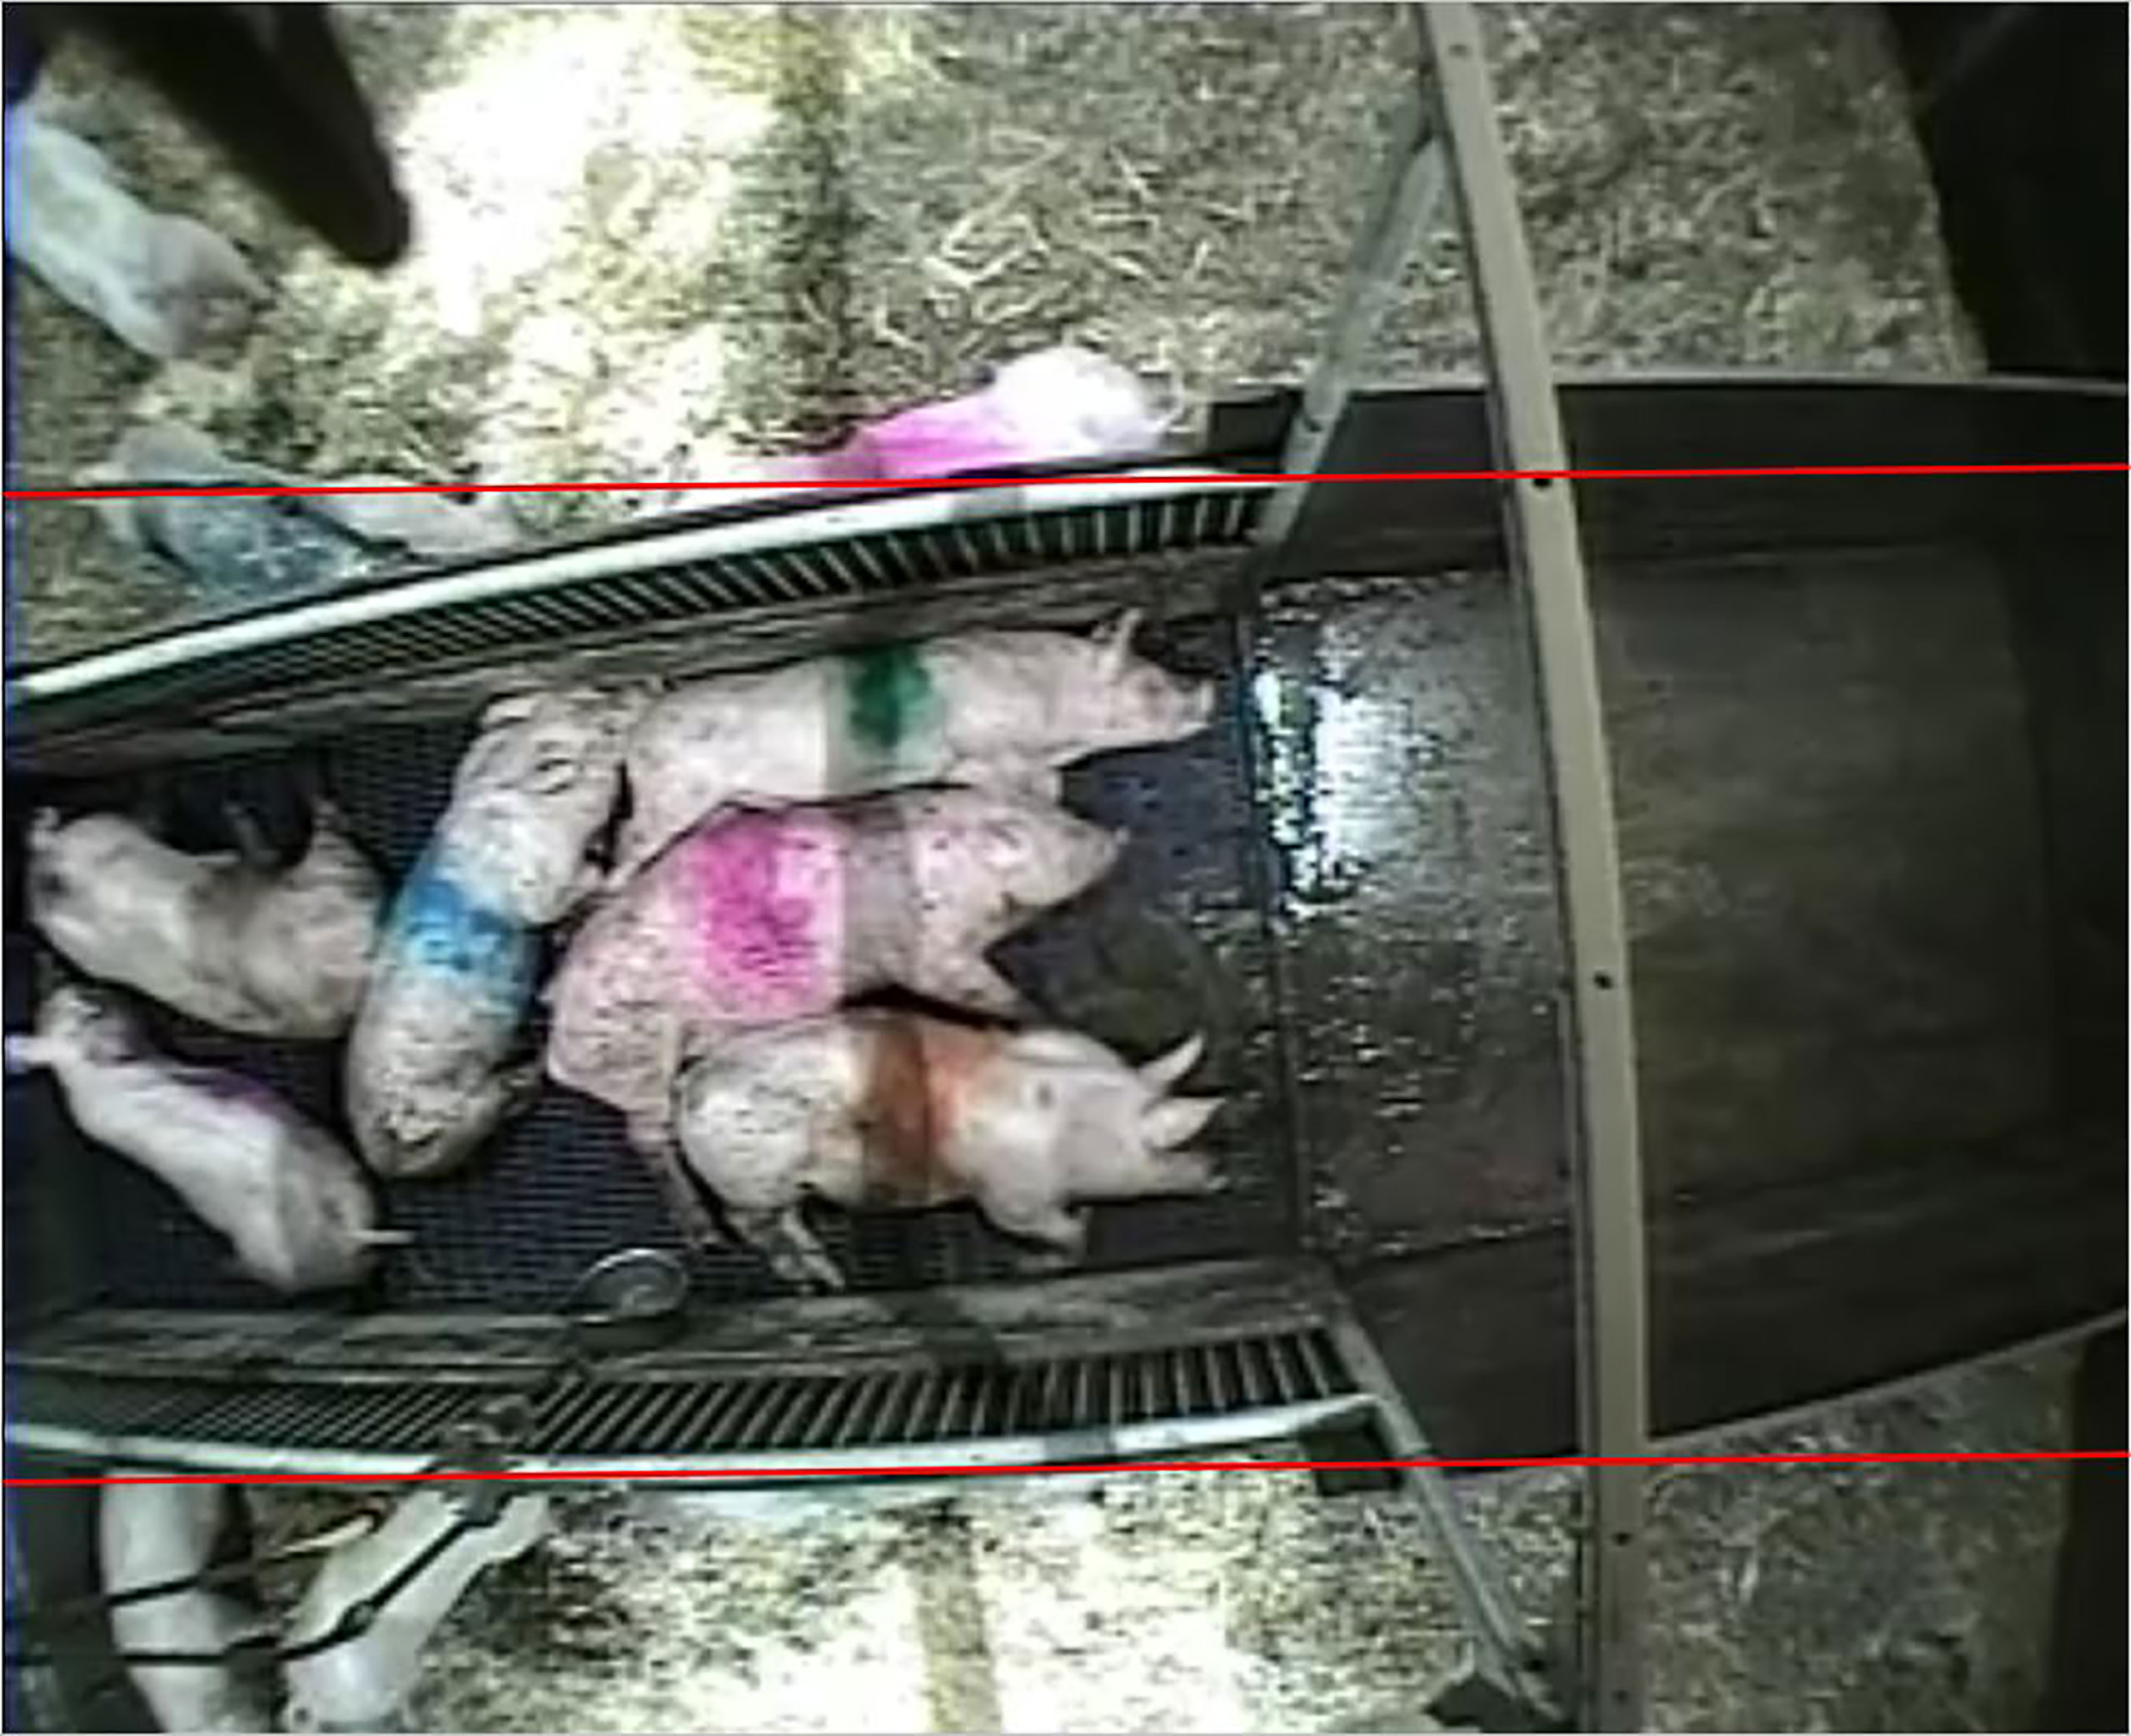
Figure 1 Example of the region of interest (ROI) indicated with the red horizontal lines. Detections above the upper red horizontal line and detections below the lower red horizontal line were outside the ROI and therefore removed.
Based on earlier experience (van der Zande et al, 2021), there was inconsistency from the tracking algorithm on how precise the bounding boxes were placed in a frame, even though the pigs themselves were not moving (e.g. sleeping). For calculating distance moved, this would lead to a considerable overestimation of activity. By not using all the 10 FPS of the video, some of the noise could also be deleted. To find the optimal frame rate, a gold standard dataset was annotated using the computer vision annotation tool CVAT (Sekachev et al., 2019). To create the gold standard, every 4th frame was manually annotated, and CVAT interpolated the frames in between to minimize the noise an annotator could introduce by manually drawing bounding boxes for every frame. All the frames of in total 12 videos of three minutes each were annotated, balanced for enriched and barren housing, and high and low activity levels, where in a low activity video at least 5 pigs were not moving, and high activity had at least 5 pigs moving. The developed computer vision algorithm then analyzed these exact same 12 videos. Distance moved was calculated as mentioned below using different frame rates (10, 5, 1, 0.5, 0.25 and 0.1 FPS) and performance was compared using Pearson correlation.
Distance moved was calculated between the centroids of the bounding boxes, assigned to the same individual between two consecutive frames. The distance (d) between two frames was calculated using Pythagorean theorem using the following formula,
where d is the distance moved, xt the x-coordinate of frame t, xt+1 the x-coordinate of frame t+1, yt the y-coordinate of frame t and yt+1 the y-coordinate of frame t+1.
Pigs have a distinct diurnal pattern in their activity (Fraser, 1985). To correct for this diurnal rhythm, the rolling mean of distance moved with a window of 24 hours was used (Ten Thij et al., 2020). The data contained missing data, for example, around blood sampling or when pigs were visually obstructed. A maximum of 25% missing values in 24 hours was still considered as a reliable mean.
Based on the rolling mean using a 24-hour window, resilience parameters could be quantified (Figure 2). During the three-day baseline, the mean and maximum error (i.e. maximum deviation observed from the mean) was calculated for each individual. The mean and boundary of the error were applied to post LPS injection observations and represented their original state, i.e. state before injection. Changes in activity were identified by finding the longest consecutive stretch of data points below the boundary starting not later than 24 hours post-injection of LPS. From this change (i.e., a dip), several resilience parameters could be quantified, namely a binary trait of showing a dip in activity or not, the time from the injection to the start of the dip (referred to as onset of the dip), the recovery time from injection to the end of the dip, the Area Under the Curve (AUC) of the dip to the boundary (Figure 2). When no measurable dip was observed, the onset of the dip was set to the maximum value, whereas the other resilience parameters were set to zero (e.g. duration of the dip was zero when no dip was observed). The AUC could be the same for a short deep dip and a long shallow dip, therefore the ratio of AUC and duration of the dip was calculated. The ratio represents the severity per time unit (for pigs with a dip only). In addition, the time to reach the maximum percentual decrease was calculated. The maximum percentual decrease was calculated by:
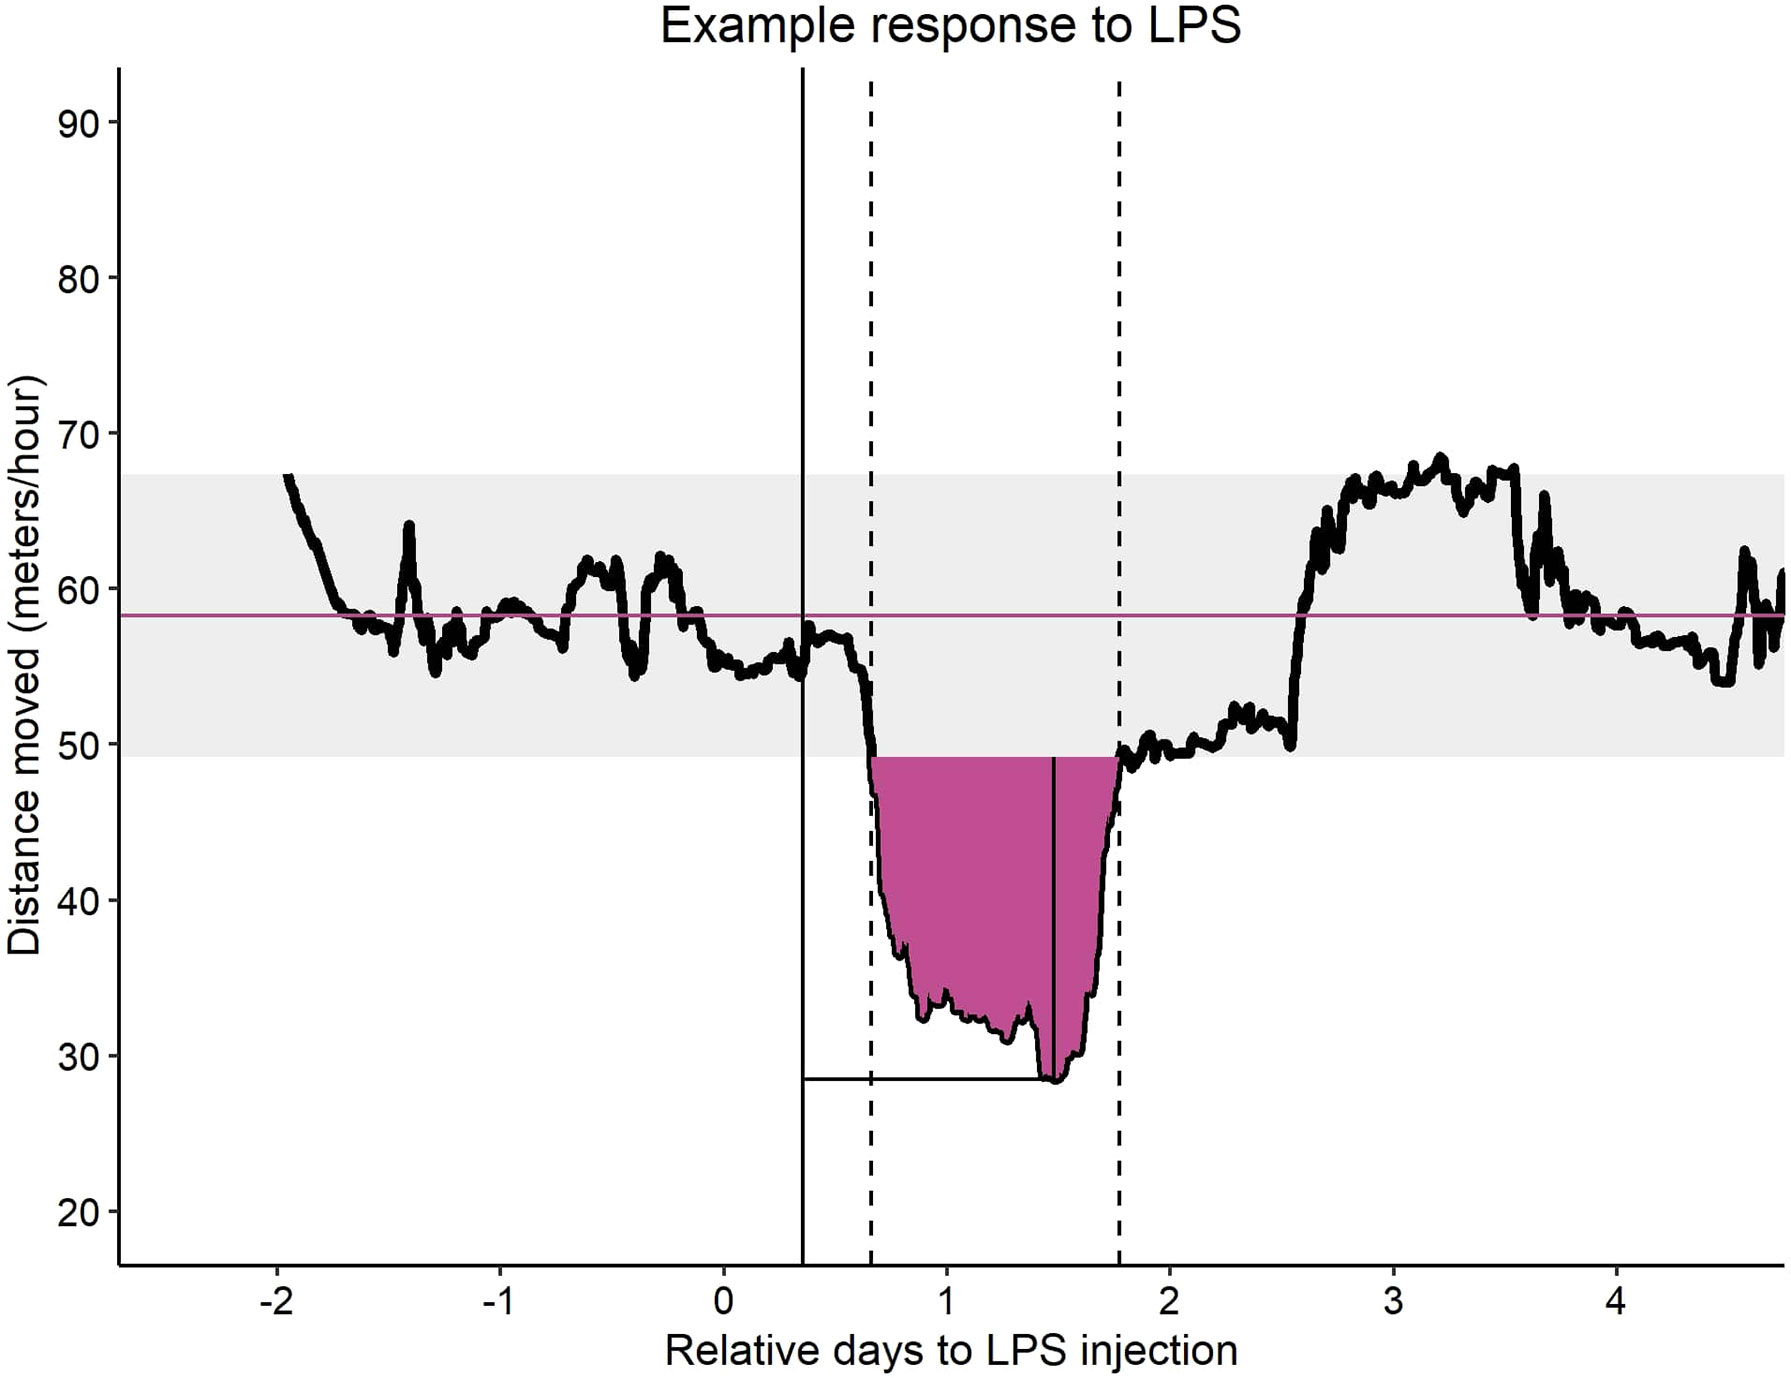
Figure 2 Example of rolling mean of distance moved with 24 hour window of an LPS injected animal. The black points are the rolling means. The purple solid horizontal line is the mean distance moved of the baseline observations before injection. The light grey area around the mean is the maximum error (i.e. maximum deviation observed from the mean) during the baseline observations. The black solid vertical line indicates the LPS or saline injection. The black dashed vertical lines represent the start and end of a dip in activity (i.e. observation below the grey area). The purple filled area represents the Area Under the Curve (AUC) of the dip in activity. The black solid vertical line in the AUC area indicates the maximum decrease and the horizontal black line indicates the time to reach this point.
Statistical analyses were performed with the software R 4.1.0. (R Core Team, 2013). Pearson correlations were calculated between the distance moved according to the gold standard and the tracking algorithm at different frame rates, to assess the optimal frame rate for assessing distance moved. Resilience parameters were analyzed using (generalized) linear mixed models with the function ‘glmer’ and ‘lmer’ from the R package ‘lme4’. All parameters, except the ratio of AUC and maximum percentual decrease, were log-transformed to obtain normality.
The effect of housing, sex and their interaction on average distance moved and maximum error during the baseline was analyzed with a linear mixed model. Concerning the response to LPS, first, the effect of the challenge treatment (LPS injected vs. control) on the probability to show a dip was analyzed using a generalized linear mixed model with binary distribution and logit link function. Due to an unequal distribution of control and LPS injected animals in the probability of showing a dip (much lower in controls), we created a subset of the data with only LPS injected animals. The effect of housing, sex, and their interaction on the resilience parameters (time from the injection to start of the dip, the duration of the dip, the recovery time from injection to the end of the dip on time from the injection to start of the dip, the duration of the dip, the AUC of the dip to the boundary, the ratio of AUC and duration, the time to reach the lowest distance moved of the dip (i.e. time to reach the maximum decrease in activity) and the maximum percentual decrease) were analyzed with a linear mixed model using the subset of LPS injected animals only. The time from injection to start of the dip (onset of the dip) and ratio of AUC were analyzed for the pigs with a dip in activity only.
Pen and batch were included as random effects in each model. P-values below 0.05 were considered as significant effects, and P-values below 0.1 as tendencies. When a significant effect was found, comparisons between groups were made with the ‘emmeans’ function from the R package ‘emmeans’, including a Tukey correction.
Figure 3 shows the correlation between distance moved calculated based on the manually annotated gold standard and based on the tracking algorithm at different FPS rates (dashed line: “Gold standard vs. tracking algorithm”). The correlation between both increased when fewer frames were used to calculate distance moved and seemed to reach a plateau from 0.5 FPS onwards. In other words, potential noise due to micro-movement of the bounding boxes was removed when decreasing the frame rate. To verify whether too much information was lost, the correlation within the gold standard was evaluated (Figure 3; solid line: “Gold standard (different frame rates)”). We assumed that the gold standard at 10 FPS was the ‘true gold standard’, since it contained most information. The correlations between the distance moved based on the ‘true gold standard’ and distance moved using lower frame rates were calculated (e.g. a correlation at 2 FPS is the correlation between distance moved of the gold standard at 10 FPS and of the gold standard at 2 FPS). This correlation dropped significantly after 0.5 FPS, indicating a loss of accuracy in distance moved. The intersection indicates an optimum frame rate, namely 0.5 FPS or 1 frame every 2 seconds, to calculate distance moved. This frame rate was used for further calculations.
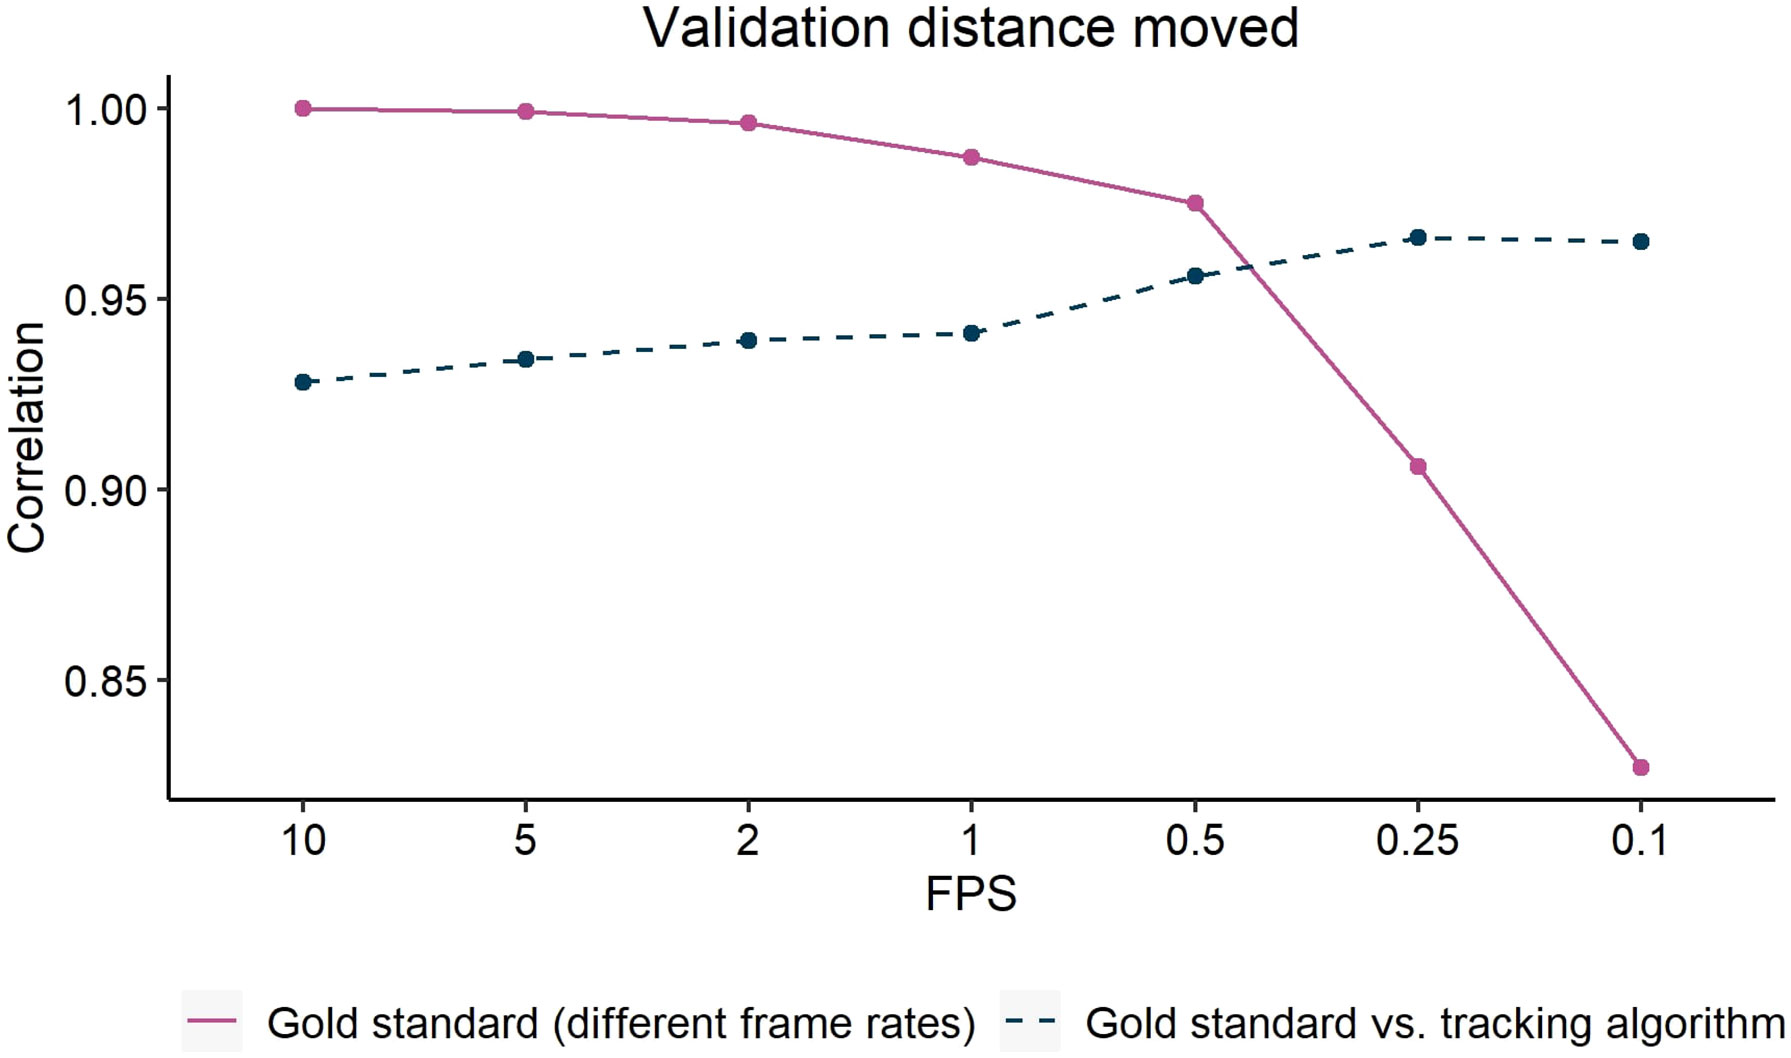
Figure 3 Validation of distance moved using different frame rates. ‘Gold standard (different frame rates)’ displays the correlation between distance moved of the gold standard at 10 frames per second (FPS) with different frame rates to calculate distance moved in the gold standard (i.e. correlation within the gold standard). ‘Gold standard vs. tracking algorithm’ displays the correlation between distance moved of the gold standard and the tracking algorithm with corresponding frame rates (i.e. correlation between gold standard and tracking algorithm).
According to (van der Zande et al., 2021), this computer vision algorithm had a different performance between the two housing systems and overestimation was expected due to micro-movements of the bounding boxes. Not all overestimation was removed by lowering the frame rate to 0.5 FPS. During the low activity, activity in the enriched environment was overestimated 34.1 fold and in the barren environment 21.8 fold, compared to the annotated gold standard using 10 fps. This overestimation only occurred in the low activity videos and not in the high activity videos. During the high activity, the overestimation was 1.05 fold in the enriched environment and 1.06 fold in the barren environment.
Figure 4 shows the distribution of average distance moved during a 24 hour period pre-injection for both housing conditions. The mean distance moved during this baseline period was higher in the enriched housing system (P < 0.001) and tended to be affected by the sex x housing interaction (P < 0.1). Post hoc pairwise comparison of this tendency showed that the difference between sexes was only present within the enriched housing system (P < 0.05), where boars showed a higher distance moved than gilts, but not within the barren housing system (Figure 5A). The maximum error during the baseline was affected by the housing system (P < 0.05) and sex (P < 0.01). Enriched pigs had a larger maximum error during the baseline than barren pigs, and boars larger than gilts. The interaction between housing and sex on maximum error was not significant (Figure 5B).
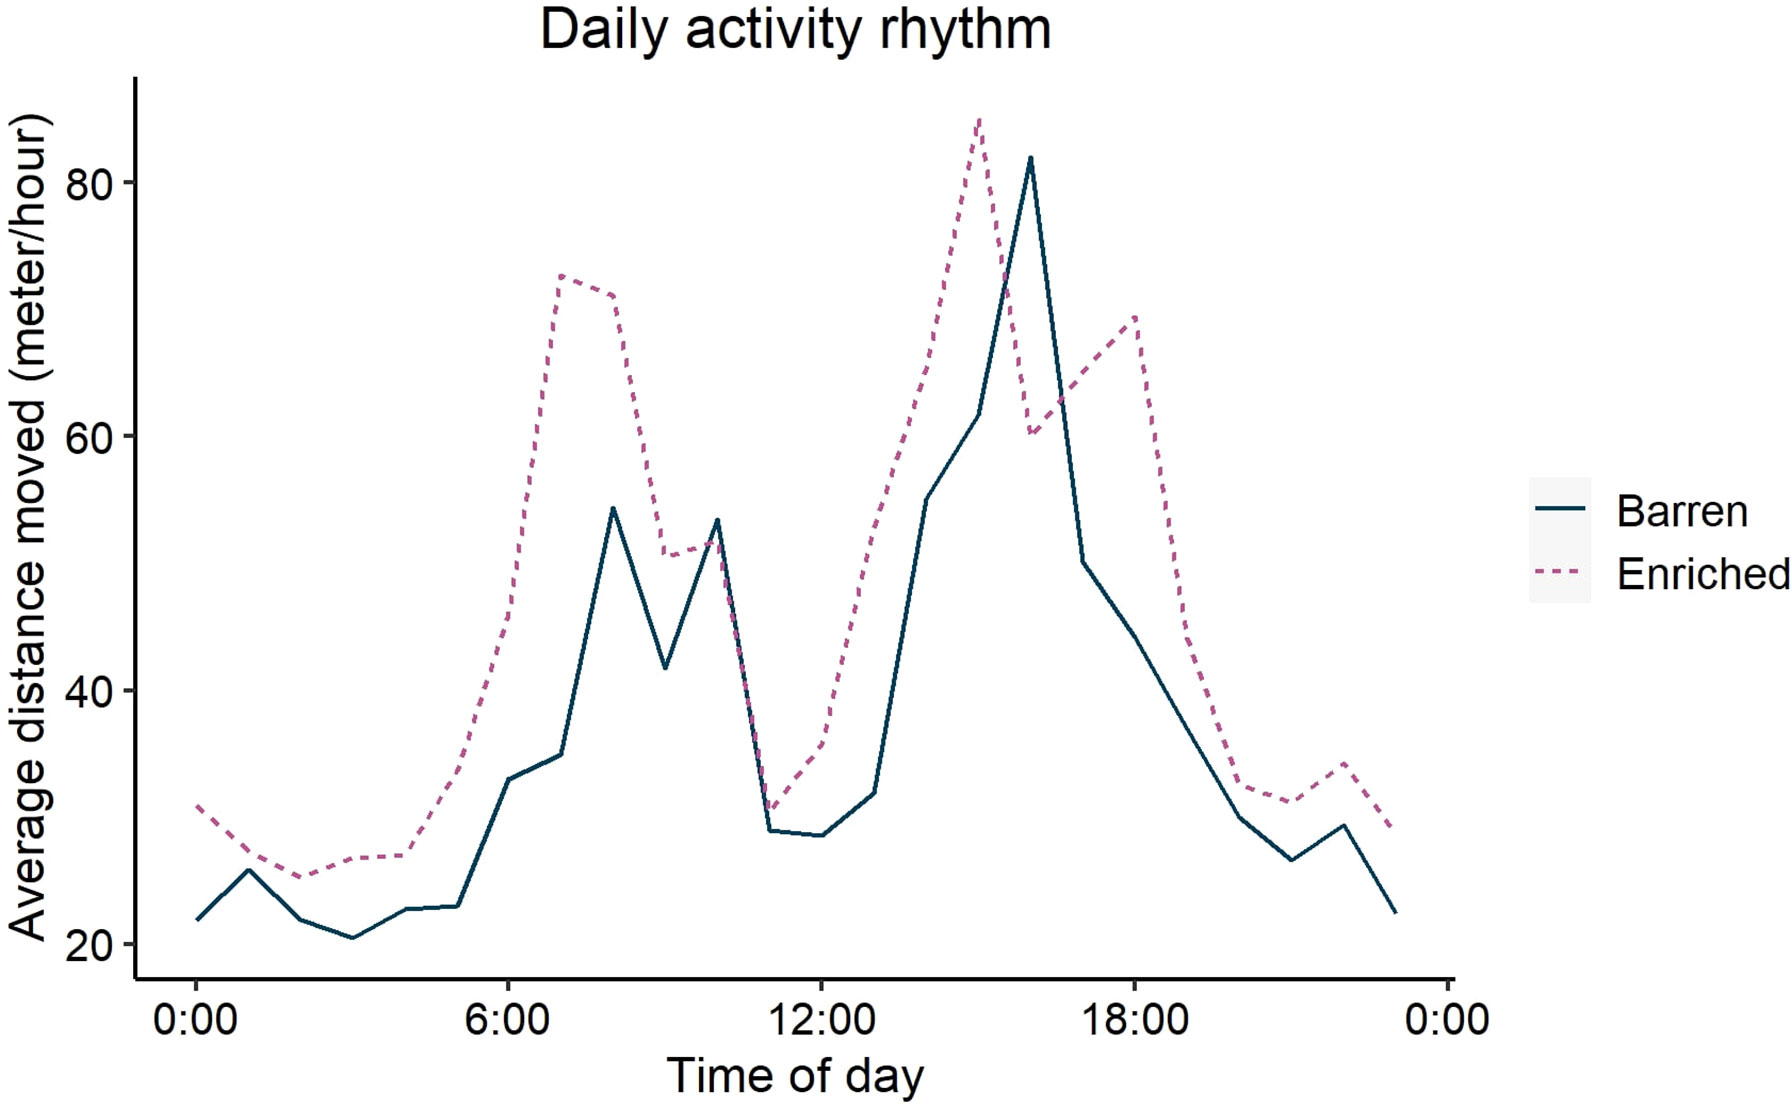
Figure 4 Average daily activity rhythm per hour during one day grouped by housing system. The solid blue line represents the barren housing system and the purple dashed line the enriched housing system.
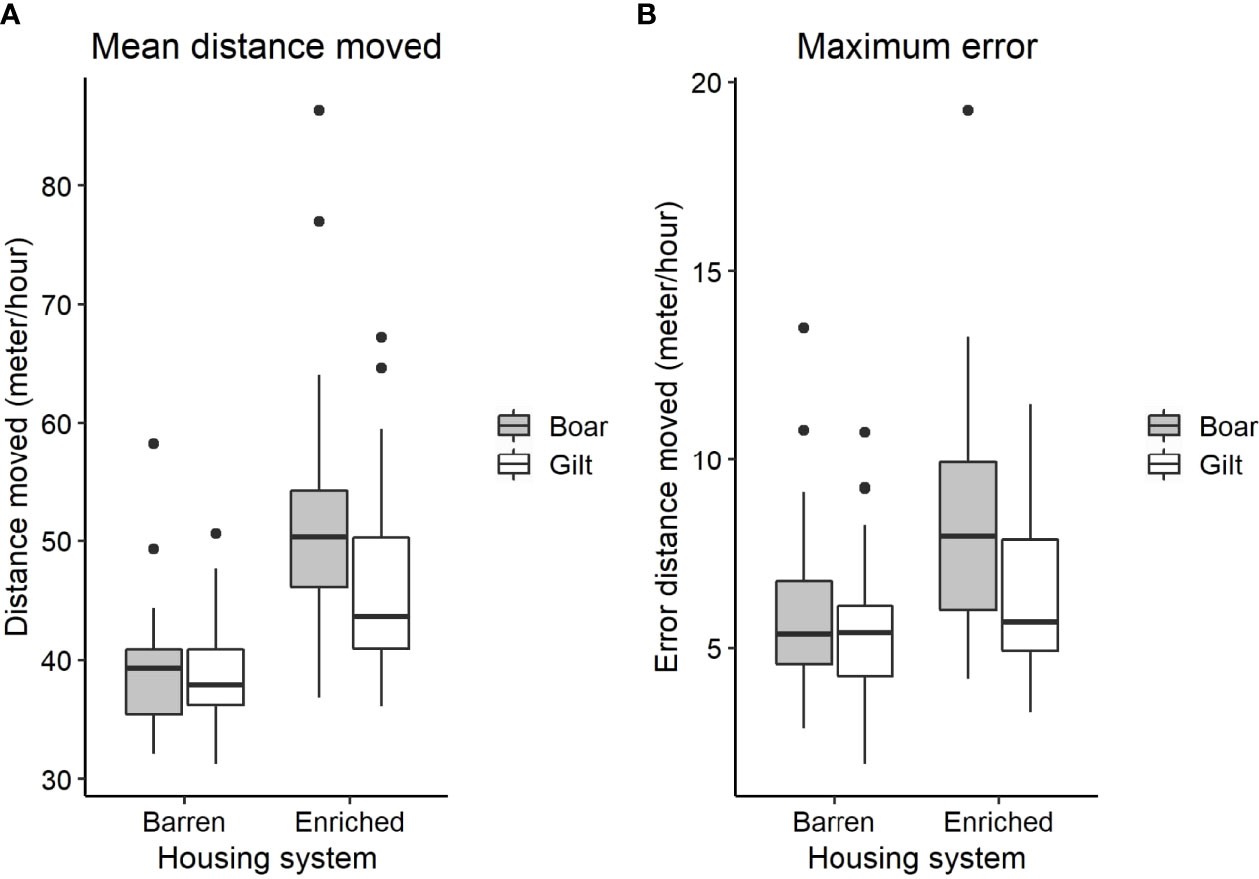
Figure 5 (A) Boxplot of the mean distance moved, based on the rolling window, during the baseline grouped by housing system and sex. (B) Boxplot of the maximum error of the mean distance moved (i.e. maximum deviation observed from the mean), based on the rolling window, during the baseline grouped by housing system and sex.
As illustrated in Figure 6 and in the Supplementary material, LPS injected and control pigs showed different activity patterns following LPS or saline injection. The probability of showing a dip in activity was significantly higher when injected with LPS compared to a saline injection (P < 0.001): 69 out of 80 pigs injected with LPS (86%) versus 7 out of 41 (17%) control animals showed this dip. Further characteristics on the dip will be presented on only LPS injected animals due to the imbalanced presence of the dip in activity between LPS injected animals and control.
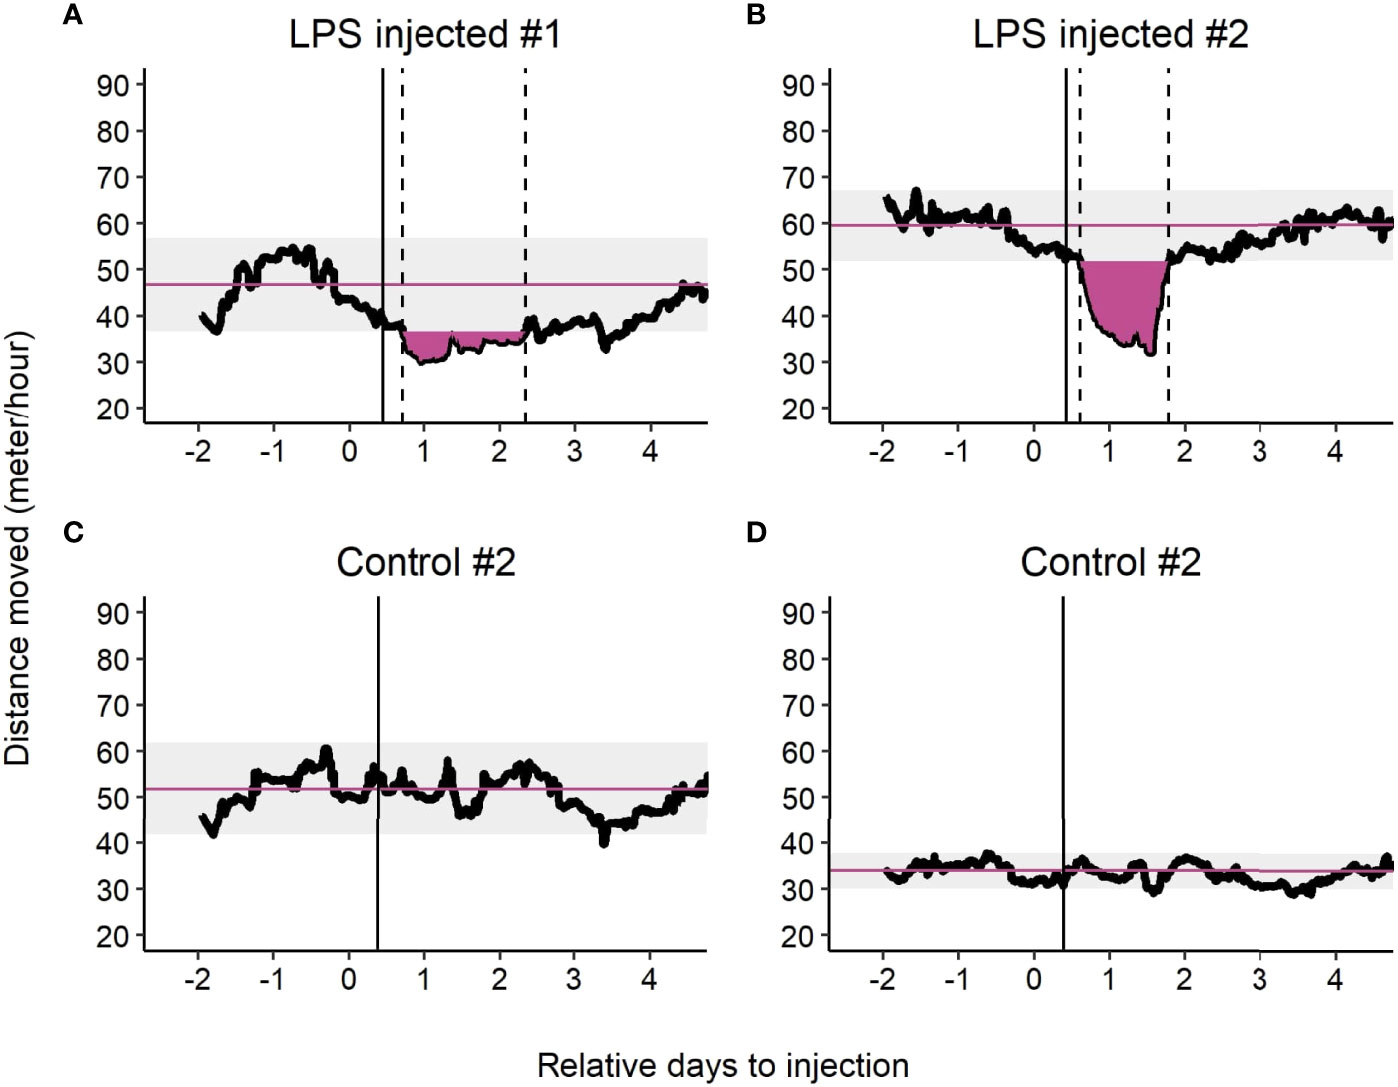
Figure 6 Example of rolling mean of distance moved with 24 hour window of LPS injected animals (A, B) and control animals injected with saline (C, D). The black points are the rolling means. The purple solid horizontal line is the mean of the baseline observations before injection. The light grey area around the mean is the maximum error (i.e. maximum deviation observed from the mean) during the baseline observations. The black solid vertical line indicates the LPS or saline injection. The black dashed vertical lines represent the start and end of a dip in activity (i.e. observation below the grey area). When the black dashed vertical lines are absent indicates no dip in activity was observed. The purple filled area represents the Area Under the Curve (AUC) of the dip in activity.
The onset of the dip (8.6 ± 4.8 h, calculated based on LPS injected animals with a dip in activity), duration of the dip (30.1 ± 24.4 h), recovery time (37.5 ± 25.5 h), and AUC (267,394 ± 295,623 days*m/h) were not affected by housing or sex (Figures 7A–D). The AUC could be the same for a short deep dip and a long shallow dip, so the ratio of the AUC and the duration was calculated. This ratio reflects the severity of the dip per time unit (only for the LPS injected pigs showing a dip in activity). The ratio of AUC and duration was affected by housing (P < 0.05), where enriched housed pigs (9,740 ± 5,485) had a higher ratio than barren housed pigs (6,184 ± 4,613) (Figure 7E).
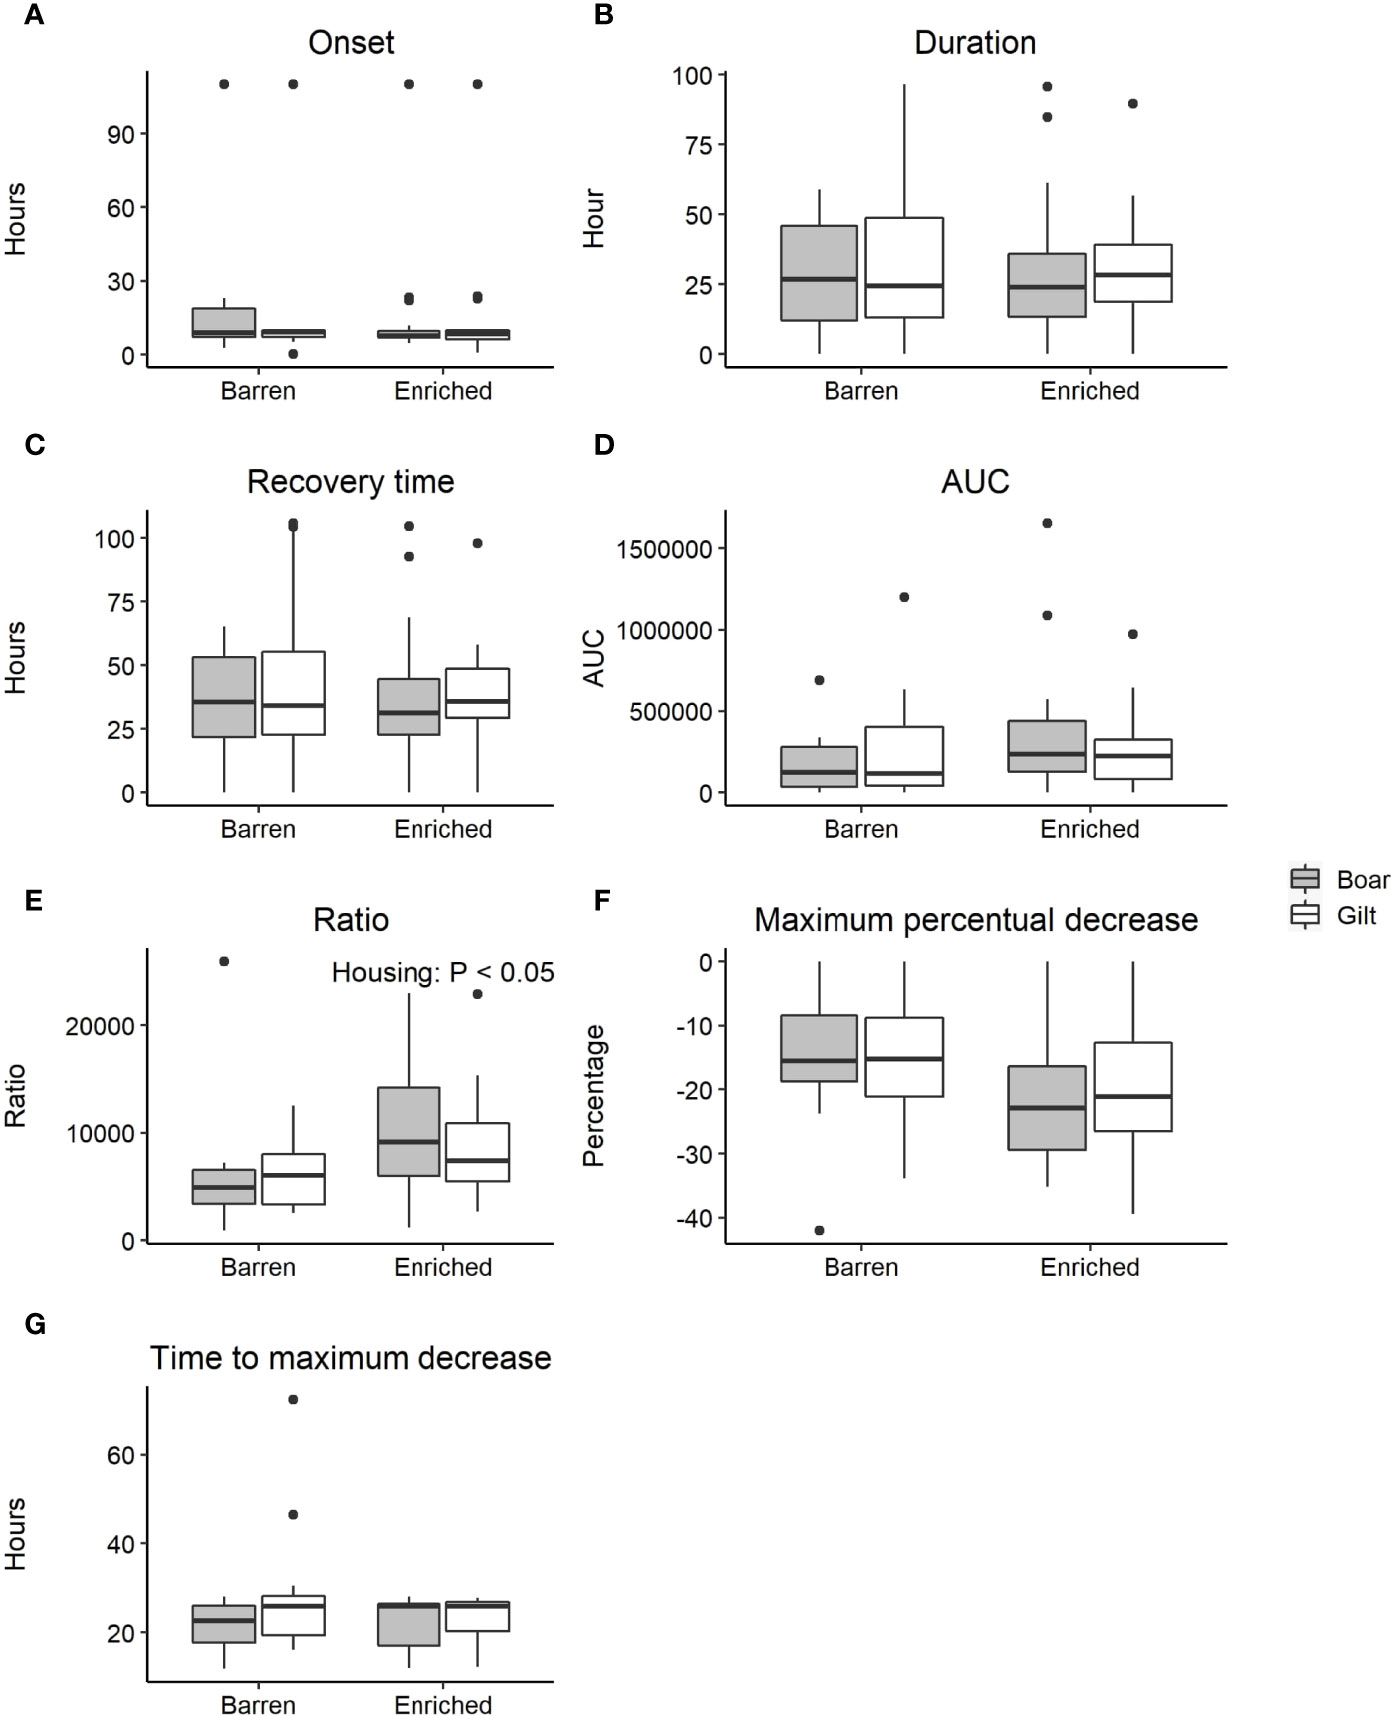
Figure 7 Boxplots of resilience parameters following a lipopolysaccharide (LPS) challenge grouped by housing and sex. Only animals with an LPS injection were used in these boxplots. (A) Boxplot of the time from injection to the onset of the dip in activity. (B) Boxplot of the duration of the dip in activity. (C) Boxplot of the time from injection to the end of the dip in activity (i.e. recovery time). (D) Boxplot of the Area Under the Curve (AUC) of the dip in activity. (E) Boxplot of the ratio of AUC and duration of the dip in activity. (F) Boxplot of maximum percentual decrease of the dip in activity. (G) Boxplot of the time to reach the maximum percentual decrease of the dip in activity.
The maximum percentual decrease (i.e. maximum deviation of the dip in activity, expressed as a percentage from the lower boundary) was not affected by housing or sex within the LPS injected animals (-17.9 ± 10.9%) (Figure 7F). The time to reach this maximum decrease was not affected by housing, but tended to be affected by sex (P < 0.1). Within the LPS injected animals, gilts tended to take longer to reach the maximum deviation (25.5 ± 10.4 h) compared to boars (22.1 ± 5.3 h) (Figure 7G).
The aim of this study was to quantify recovery of normal activity patterns as an indicator of resilience to an LPS sickness challenge, using location data from a computer vision tracking algorithm, and to study the impact of housing and sex on the recovery of these patterns.
We transformed location data to distance moved using a reduced frame rate of 0.5 FPS to remove potential noise due to micro-movements of the bounding boxes. However, a reduced frame rate did not remove all the noise. The tracking algorithm showed an overestimation in low activity videos of up to 34.1 fold in the enriched environment, and 21.8 fold in the barren environment. This overestimation was only observed when there was no visible movement of the pigs. This overestimation is mainly caused by the inaccuracy of the tracking algorithm. The difference in overestimation between the housing systems could be due to the bedding material in the enriched housing system, where animals could be (partly) hidden by the bedding material, making them less visible and harder to follow from frame to frame for the tracking algorithm.
Pigs that moved less than 5 pixels in the annotated gold standard, moved on average 74.5 pixels (approximately 1 meter) according to the tracking algorithm. The videos used for the gold standard were 3 minutes each, so in other words, about 20 meters of noise per hour was generated during inactivity when using the tracking algorithm. Lind et al. (2005) also reported overestimation in non-moving pigs. They compared the distance moved of non-moving pigs to a stationary object of the same size, and the estimated distance travelled of the pig was twice as high compared to the stationary object. This suggests that the bounding box recorded entire body movements without the animal actually moving around. To only measure the distance moved without body movement while standing still, we recommend a variable frame rate with 0.5 FPS as a basis, where the distance between frame t and t+1 needs to exceed a threshold for the frame to be used. When there is no activity, the threshold will not be met, and frame t+1 could be skipped so no noise is added to the dataset. Effectively, only frames with activity will be used to calculate distance moved, and the overestimation could be removed using this method.
This unique dataset showed higher baseline activity (activity pre-challenge) and baseline variation in activity in pigs kept in an enriched environment compared to a barren environment. In the literature, it has been found that pigs housed on straw bedding show higher activity (Day et al., 2008; Luo et al., 2020b). Previously we mentioned an overestimation of distance moved by the tracking algorithm during inactive periods only. Therefore, during inactive periods we could not differentiate between actual movement or noise. During active periods, the tracking algorithm did not overestimate the distance moved. So in these periods, enriched pens were indeed more active than barren pens (Figure 4). During active periods, this (true) difference in activity between pigs in enriched and housing could be explained by the availability of bedding leading to increased exploration (Bolhuis et al., 2005) and more space allowance per animal (Day et al., 2008).
Boars tended to move more during the baseline period within the enriched housing system. A previous study showed that entire males of approximately the same age, housed in either single-sex or mixed-sex groups, showed more aggression and mounting than gilts (Holinger et al., 2015), which are highly active behaviors. The tracking algorithm only estimated the location of individual pigs, and not the behaviors performed. So future work would be needed to establish if this higher activity in male pigs is a result from aggression or related to other behaviors.
From previous literature, we know that LPS induces symptoms such as fever, anorexia, somnolescence and a reduction in general activity, often referred to as a sickness response, of which the behavioral symptoms reflect sickness behavior (Johnson and Von Borell, 1994). Indeed, almost all LPS injected animals (86%) showed decreased activity post-injection, whereas only a minor part of the saline-injected control pigs did (17%). It is unknown why some control pigs showed a dip in activity too. Possibly, these animals were affected by the inactivity of their LPS-injected pen mates. Pigs tend to synchronize their behavioral activities, which is at least partly driven by social facilitation of behavior (Docking et al., 2008). It could be hypothesized that, since four of their pen mates were inactive due to sickness, some control pigs adjusted their behavior to the majority of the group. Additionally, control pigs may also have been influenced by their pen mates’ negative affective states, i.e. emotional contagion (Reimert et al., 2013; Reimert et al. 2015). It has been shown that following a negative treatment of one pig, this pig but also all of its pen mates that had not been exposed to this negative event showed more lying behavior (Reimert et al., 2017).
This study showed different parameters that could reflect sickness behavior, namely the time between injection and onset of the dip in activity, the duration of the dip, the AUC of the dip, the ratio of the AUC and duration of the dip, the maximum percentual decrease in the dip and the time to reach this maximum decrease. The computer vision tracking algorithm is thus able to quantify a sickness response.
Physiological responses to LPS show varying dynamics. In the pigs from this study, the cortisol response peaked at 3 hours post-injection, and this was still not back to basal level at 5 hours post LPS injection, whereas at the next sampling point, 24 hours post-injection, basal levels were seen again (Parois et al., 2022). This pattern of recovery in cortisol is in line with Sali et al. (2021). Using a similar dose of LPS, others showed a rise in cortisol levels for at least 7 hours post-injection (de Groot et al., 2007). As in other studies (de Groot et al., 2007; Clouard et al., 2015; Luo et al., 2022), pigs from this study had increased body temperatures until at least 5 hours post-injection and had returned to basal levels 24 hours post-injection with no additional measurements between 5 and 24 hours post-injection (Parois et al., 2022). Clouard et al. (2015), however, showed a return to basal body temperature at 9 hours post-injection. Other studies found a more prolonged lasting physiological responses to LPS. Recently Nordgreen et al. (2018) found a decrease in noradrenaline and an increase in serotonin in different parts of the brain still 72 hours after LPS injection. Veit et al. (2021) showed that LPS injected pigs had lower concentrations of tryptophan (the precursor of serotonin) in their plasma 72 hours after injection. Our results show that changes in behavior may last for days.
This study showed that pigs injected with LPS started to decrease their activity below basal level 8.6 ± 4.8 hours post-injection and that this dip lasted on average for 30.1 ± 24.4 hours. The peak response in sickness behavior, with a decrease of 17.9 ± 10.9% in activity, was 25.5 ± 10.4 hours post LPS injection. The onset of this dip in activity is later compared with Moya et al. (2008), demonstrating a significant reduction in activity levels from 1 hour post-injection onwards, which lasted for 3 hours. However, it should be noted that this previous study used a higher dose of LPS and intraperitoneal injection instead of intravenously. Studies using a similar dose injected intravenously showed an increased latency to approach a human, which lasted for at least 6 hours post-injection (de Groot et al., 2007), and in one study, the latency to approach peaked at 3 hours and ended about 9 hours post-injection (Clouard et al., 2015). In addition, two studies observing active behaviors for 6 hours (Veit et al., 2021) and 72 hours (Nordgreen et al., 2018), reported decreased activity between 3-5h and 3-4h, respectively, after LPS injection. Thus, these studies demonstrate a change in behavior or behavioral motivation that seems to start and end earlier than the dip in activity in this study. Munsterhjelm et al. (2019) reported a dip in social and damaging behavior, like tail and ear biting, on the day of injection, and a tendency for lower activity, but did not specify during which hours of the day this was. Intriguingly, in the latter study, social and damaging behaviors reached levels above baseline from two days post-injection. This study observed sickness behavior later and for a longer period of time. The method to measure activity differs between our study and that of Munsterhjelm et al. (2019). We used tracking data and applied a rolling mean with a 24-hour window to measure activity, whereas the previously mentioned study used scan sampling to observe the activity. A rolling mean with a large window causes a delay in observing an effect, which might explain the difference in observing sickness behavior. In the simulation showed in Figure 8, the delay to the onset of the dip is 5 hours, and to recovery is 19 hours compared to raw data. Without the use of a rolling window, the onset of the dip in activity and time to recovery become closer to values reported in other studies.
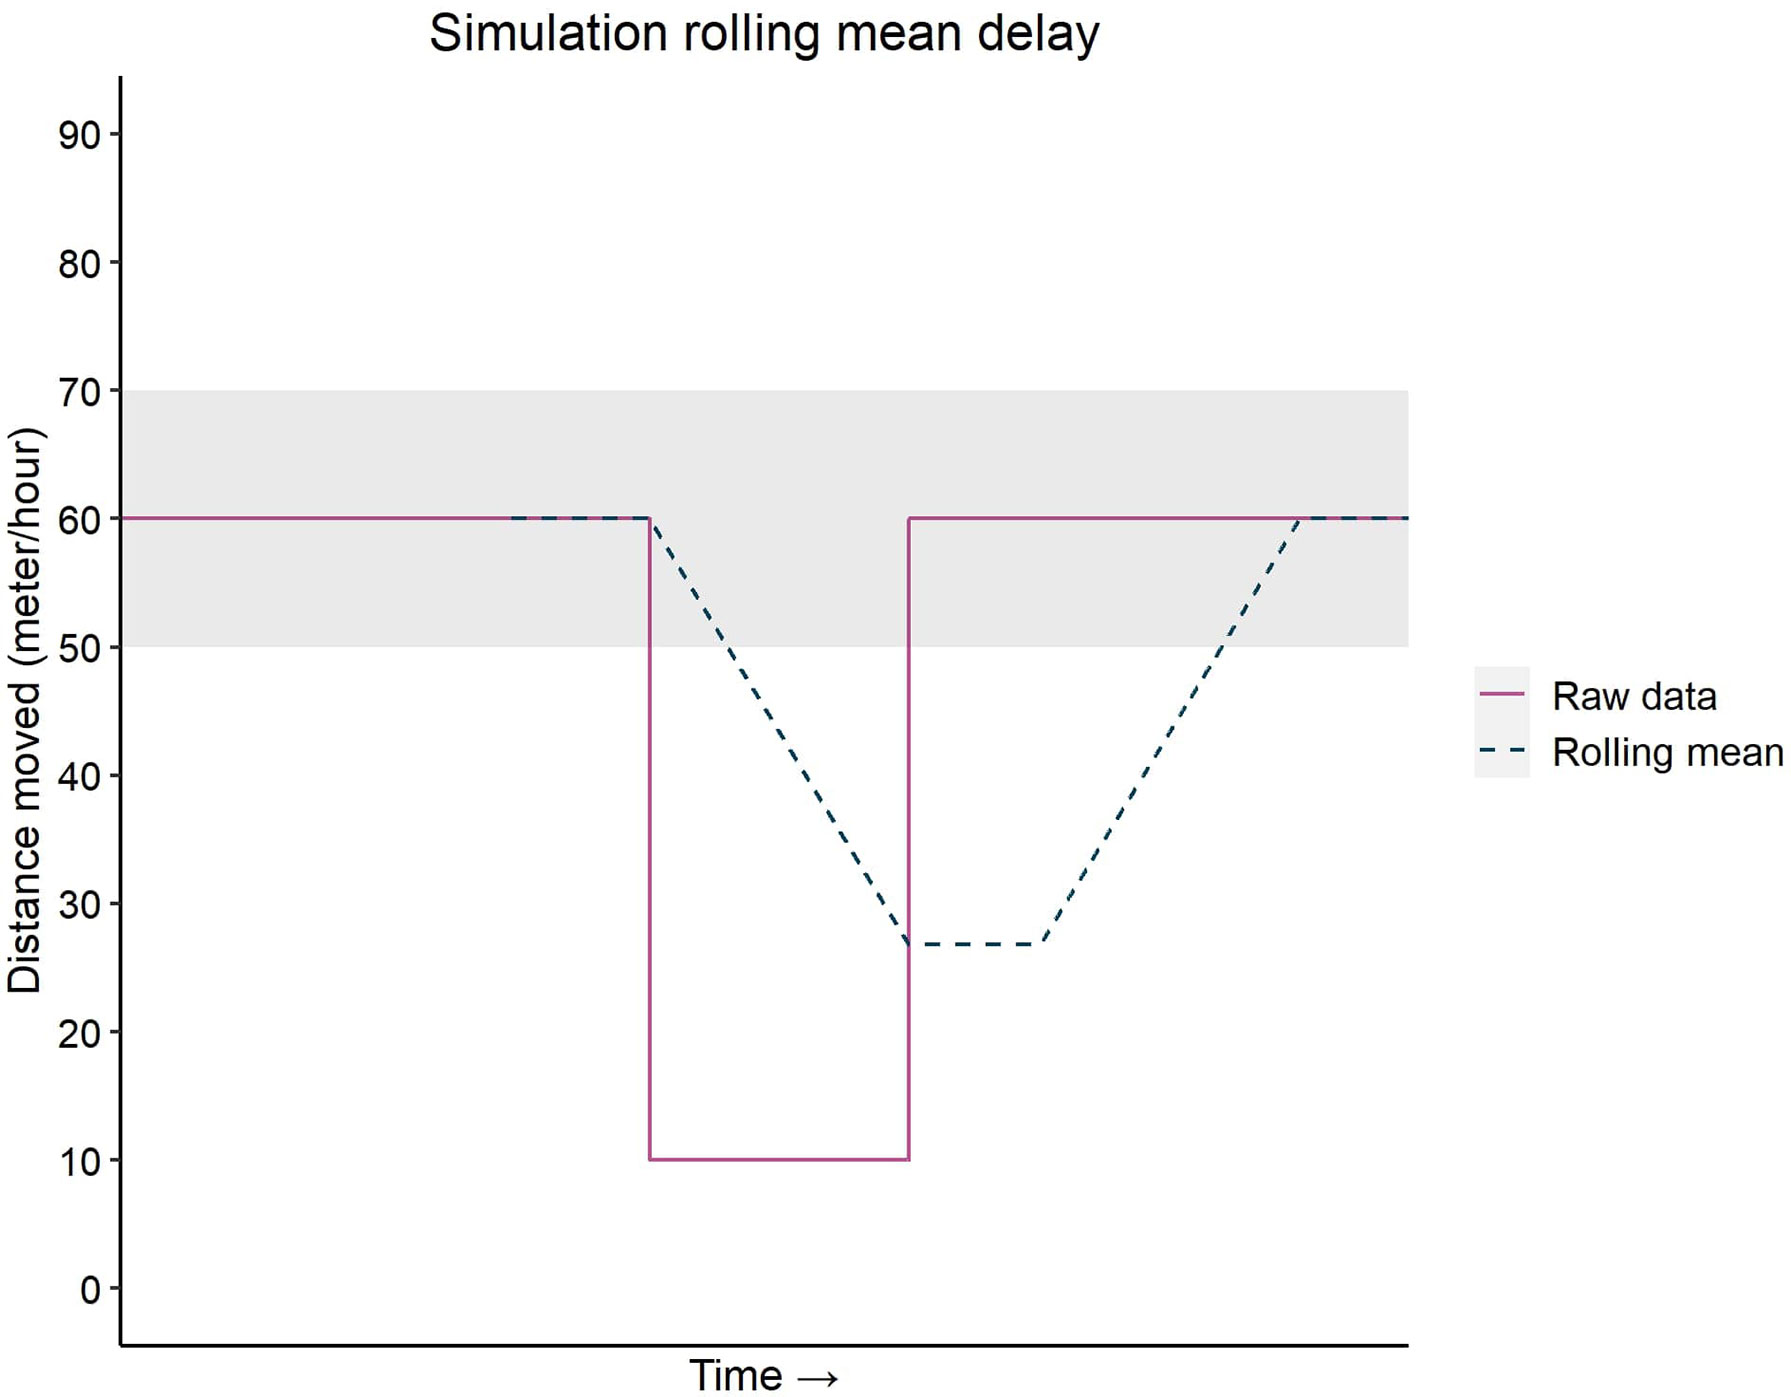
Figure 8 Simulation of a possible delay in detection of a dip in activity using a rolling mean with a large window. The solid purple line indicates raw distance moved, assuming an immediate response to inactivity after LPS injection. The dashed blue line represents the rolling mean with a large window of the raw data. The light grey area represents the baseline area. Below this boundary is defined as a dip in activity. The dashed line crossed down the boundary 5 hours later than the raw data and crossed up 19 hours later than the raw data.
The only sex effect on recovery in activity found in this study was on the time to the maximum decrease in activity during the dip, where gilts tended to take longer to reach this point compared to boars. Most studies reported results on sickness behavior on gilts only (de Groot et al., 2007; Clouard et al., 2015; Nordgreen et al., 2018; Munsterhjelm et al., 2019; Veit et al., 2021) or did not report sex effects (Clouard et al., 2015).
It has been shown that housing conditions that better meet their behavioral needs and that have the potential to improve welfare, i.e. enriched environments, may improve the resilience of pigs (van Dixhoorn et al., 2016; Luo et al., 2020a). Concerning the pigs used in this study, Parois et al. (2022) showed that pigs housed in the enriched environment recovered faster and/or had a lower response to a 2 hour transport challenge than barren housed animals in several metabolic indicators (cortisol, glucose and non-esterified fatty acids). Enriched housed animals also showed a less pronounced response and/or faster recovery in cortisol and non-esterified fatty acids.
Regarding sickness behavior, no effects of housing were found on the duration of the dip, its Area Under the Curve (AUC) or the time to recover to normal activity levels. This seems not in line with the reported effects of housing on the physiological responses in the same pigs (Parois et al., 2022). However, housing did have an effect on the ratio between the AUC and the duration of the dip. This ratio between AUC and duration reflects the severity of the dip in activity per time unit. Enriched housed animals had a higher ratio than barren housed animals. This coincides with a stronger fever response, i.e. a higher peak but similar AUC, for the enriched housed animals in this study, as reported by Parois et al. (2022). However, housing did not affect the maximum percentual decrease, which reflects a higher response, or the other parameters, so the effect on the AUC:duration ratio should be interpreted with caution. More research is needed to investigate the relationship between a stronger fever reaction and decrease in activity.
This study showed a clear difference in the presence of a dip in activity following an LPS injection or a saline injection. The individual tracking algorithm could thus be used to measure resilience in pigs, since the dip and its corresponding characteristics could be estimated using the novel technology. Nevertheless, the strong indication of housing effects on response to the LPS challenge as found by Parois et al. (2022) was not established in this study so far. As data were generated from the same animals, it is a strong indication that the sickness behavior response represents a different aspect than the physiological responses measured. More research on the use of activity to quantify resilience and its relation to physiological parameters is needed.
In conclusion, it was shown that distance moved calculated from a computer vision tracking algorithm captures the change in activity following an LPS sickness challenge and the recovery thereof, which could indicate resilience to this challenge. Differences in characteristics of the sickness response were identified between LPS injected animals and control animals. Enrichment did not affect the duration or magnitude of the activity change, but showed an increased ratio between the magnitude and duration, indicating a higher intensity of the dip in activity which could reflect a different strategy to cope with the sickness challenge. More research is needed to validate activity as a proxy for resilience to LPS.
The raw data supporting the conclusions of this article will be made available by the authors, without undue reservation.
The animal study was reviewed and approved by Animal Care and Use Committee of Wageningen University & Research.
LZ, SP, TR, and JB designed the animal experiment. LZ and SP conducted the animal experiment. LZ and OG developed the computer vision tracking algorithm. LZ and IL performed the analysis. LZ wrote the first draft. All authors contributed to the article and approved the submitted version.
This study was part of research program Green II – Towards A groundbreaking and future-oriented system change in agriculture and horticulture with project number ALWGR.2017.007 and was financed by the Netherlands Organization for Scientific Research and Topigs Norsvin.
The authors declare that the research was conducted in the absence of any commercial or financial relationships that could be construed as a potential conflict of interest.
All claims expressed in this article are solely those of the authors and do not necessarily represent those of their affiliated organizations, or those of the publisher, the editors and the reviewers. Any product that may be evaluated in this article, or claim that may be made by its manufacturer, is not guaranteed or endorsed by the publisher.
The authors would like to thank Manon van Marwijk, Bjorge Laurenssen, Monique Ooms, Ilona van den Anker, Sandra van Iwaarden, and the caretakers of Carus, especially Arjan van Dolderen, for the help during experimental work. In addition we would like to thank Egbert van Nes for his valuable input for this study.
The Supplementary Material for this article can be found online at: https://www.frontiersin.org/articles/10.3389/fanim.2022.883940/full#supplementary-material
Alameer A., Kyriazakis I., Dalton H. A., Miller A. L., Bacardit J. (2020). Automatic Recognition of Feeding and Foraging Behaviour in Pigs Using Deep Learning. Biosyst. Eng. 197, 91–104. doi: 10.1016/j.biosystemseng.2020.06.013
Aubert A. (1999). Sickness and Behaviour in Animals: A Motivational Perspective. Neurosci. Biobehav. Rev. 23 (7), 1029–1036. doi: 10.1016/S0149-7634(99)00034-2
Bolhuis J. E., Schouten W. G., Schrama J. W., Wiegant V. M. (2005). Behavioural Development of Pigs With Different Coping Characteristics in Barren and Substrate-Enriched Housing Conditions. Appl. Anim. Behav. Sci. 93 (3-4), 213–228. doi: 10.1016/j.applanim.2005.01.006
Clouard C., Souza A. S., Gerrits W. J., Hovenier R., Lammers A., Bolhuis J. E. (2015). Maternal Fish Oil Supplementation Affects the Social Behavior, Brain Fatty Acid Profile, and Sickness Response of Piglets. J. Nutr. 145 (9), 2176–2184. doi: 10.3945/jn.115.214650
Colditz I. G., Hine B. C. (2016). Resilience in Farm Animals: Biology, Management, Breeding and Implications for Animal Welfare. Anim. Product. Sci. 56 (12), 1961–1983. doi: 10.1071/AN15297
Day J. E., Van de Weerd H. A., Edwards S. A. (2008). The Effect of Varying Lengths of Straw Bedding on the Behaviour of Growing Pigs. Appl. Anim. Behav. Sci. 109 (2-4), 249–260. doi: 10.1016/j.applanim.2007.02.006
de Groot J., Kranendonk G., Fillerup M., Hopster H., Boersma W., Hodgson D., et al. (2007). Response to LPS in Female Offspring From Sows Treated With Cortisol During Pregnancy. Physiol. Behav. 90 (4), 612–618. doi: 10.1016/j.physbeh.2006.11.013
Docking C. M., Van de Weerd H. A., Day J., Edwards S. A. (2008). The Influence of Age on the Use of Potential Enrichment Objects and Synchronisation of Behaviour of Pigs. Appl. Anim. Behav. Sci. 110 (3-4), 244–257. doi: 10.1016/j.applanim.2007.05.004
Escobar J., Van Alstine W. G., Baker D. H., Johnson R. W. (2007). Behaviour of Pigs With Viral and Bacterial Pneumonia. Appl. Anim. Behav. Sci. 105 (1-3), 42–50. doi: 10.1016/j.applanim.2006.06.005
Fraser D. (1985). Selection of Bedded and Unbedded Areas by Pigs in Relation to Environmental Temperature and Behaviour. Appl. Anim. Behav. Sci. 14 (2), 117–126. doi: 10.1016/0168-1591(85)90023-1
Holinger M., Früh B., Hillmann E. (2015). Group Composition for Fattening Entire Male Pigs Under Enriched Housing Conditions—Influences on Behaviour, Injuries and Boar Taint Compounds. Appl. Anim. Behav. Sci. 165, 47–56. doi: 10.1016/j.applanim.2015.01.016
Johnson R. W., Von Borell E. (1994). Lipopolysaccharide-Induced Sickness Behavior in Pigs is Inhibited by Pretreatment With Indomethacin. J. Anim. Sci. 72 (2), 309–314. doi: 10.2527/1994.722309x
Lind N. M., Vinther M., Hemmingsen R. P., Hansen A. K. (2005). Validation of a Digital Video Tracking System for Recording Pig Locomotor Behaviour. J. Neurosci. Methods 143 (2), 123–132. doi: 10.1016/j.jneumeth.2004.09.019
Luo L., Jansen C. A., Bolhuis J. E., Arts J. A., Kemp B., Parmentier H. K. (2020a). Early and Later Life Environmental Enrichment Affect Specific Antibody Responses and Blood Leukocyte Subpopulations in Pigs. Physiol. Behav. 217, 112799. doi: 10.1016/j.physbeh.2020.112799
Luo L., Reimert I., Middelkoop A., Kemp B., Bolhuis J. E. (2020b). Effects of Early and Current Environmental Enrichment on Behavior and Growth in Pigs. Front. Veterin. Sci. 7, 268. doi: 10.3389/fvets.2020.00268
Luo L., van der Zande L. E., van Marwijk M., Knol E. F., Rodenburg T. B., Bolhuis J. E., et al. (2022). Impact of Enrichment and Repeated Mixing on Resilience in Pigs. Under. Rev. Front. Veterin. Sci. Anim. Behav. Welfare vol. 9. doi: 10.3389/fvets.2022.829060
Maselyne J., Saeys W., De Ketelaere B., Briene P., Millet S., Tuyttens F., et al. “How do Fattening Pigs Spend Their Day?,” in WAFL 2014 (Clermont-Ferrand, France: Wageningen Academic Publishers), 157.
Mellor D. J. (2016). Updating Animal Welfare Thinking: Moving Beyond the “Five Freedoms” Towards “A Life Worth Living”. Animals 6 (3), 21. doi: 10.3390/ani6030021
Moya S. L., Boyle L., Lynch P., Arkins S. (2006). Pro-Inflammatory Cytokine and Acute Phase Protein Responses to Low-Dose Lipopolysaccharide (LPS) Challenge in Pigs. Anim. Sci. 82 (4), 527–534. doi: 10.1079/ASC200665
Moya S. L., Boyle L. A., Lynch P. B., Arkins S. (2008). Surgical Castration of Pigs Affects the Behavioural Response to a Low-Dose Lipopolysaccharide (LPS) Challenge After Weaning. Appl. Anim. Behav. Sci. 112 (1-2), 40–57. doi: 10.1016/j.applanim.2007.07.001
Munsterhjelm C., Nordgreen J., Aae F., Heinonen M., Valros A., Janczak A. M. (2019). Sick and Grumpy: Changes in Social Behaviour After a Controlled Immune Stimulation in Group-Housed Gilts. Physiol. Behav. 198, 76–83. doi: 10.1016/j.physbeh.2018.09.018
Nordgreen J., Munsterhjelm C., Aae F., Popova A., Boysen P., Ranheim B., et al. (2018). The Effect of Lipopolysaccharide (LPS) on Inflammatory Markers in Blood and Brain and on Behavior in Individually-Housed Pigs. Physiol. Behav. 195, 98–111. doi: 10.1016/j.physbeh.2018.07.013
Ohl F., van der Staay F. J. (2012). Animal Welfare: At the Interface Between Science and Society. Veterin. J. 192 (1), 13–19. doi: 10.1016/j.tvjl.2011.05.019
Parois S. P., van der Zande L. E., Knol E. F., Kemp B., Rodenburg T. B., Bolhuis J. E. (2022). A Multi-Suckling System Combined With an Enriched Housing Environment During the Growing Period Promotes Resilience to Various Challenges in Pigs. Sci. Rep. 12 (6804), 1–16. doi: 10.1038/s41598-022-10745-4
Psota E. T., Schmidt T., Mote B., Pérez L. C. (2020). Long-Term Tracking of Group-Housed Livestock Using Keypoint Detection and Map Estimation for Individual Animal Identification. Sensors 20 (13), 1–23. doi: 10.3390/s20133670
Redmon J., Farhadi A. (2018). Yolov3: An Incremental Improvement. ArXiv. Prep. arXiv:1804.02767. doi: 10.48550/arXiv.1804.02767
Reimert I., Bolhuis J. E., Kemp B., Rodenburg T. B. (2013). Indicators of Positive and Negative Emotions and Emotional Contagion in Pigs. Physiol. Behav. 109, 42–50. doi: 10.1016/j.physbeh.2012.11.002
Reimert I., Bolhuis J. E., Kemp B., Rodenburg T. B. (2015). Emotions on the Loose: Emotional Contagion and the Role of Oxytocin in Pigs. Anim. Cogn. 18 (2), 517–532. doi: 10.1007/s10071-014-0820-6
Reimert I., Fong S., Rodenburg T. B., Bolhuis J. E. (2017). Emotional States and Emotional Contagion in Pigs After Exposure to a Positive and Negative Treatment. Appl. Anim. Behav. Sci. 193, 37–42. doi: 10.1016/j.applanim.2017.03.009
Salak-Johnson J. L., Anderson D. L., McGlone J. J. (2004). Differential Dose Effects of Central CRF and Effects of CRF Astressin on Pig Behavior. Physiol. Behav. 83 (1), 143–150. doi: 10.1016/j.physbeh.2004.08.005
Sali V., Veit C., Valros A., Junnikkala S., Heinonen M., Nordgreen J. (2021). Dynamics of Salivary Adenosine Deaminase, Haptoglobin, and Cortisol in Lipopolysaccharide-Challenged Growing Pigs. Front. Veterin. Sci. 8. doi: 10.3389/fvets.2021.698628
Sekachev B., Zhavoronkov A., Manovich N. (2019). Computer Vision Annotation Tool: A Universal Approach to Data Annotation. Intel 1.
Ten Thij M., Bathina K., Rutter L. A., Lorenzo-Luaces L., van de Leemput I. A., Scheffer M., et al. (2020). Depression Alters the Circadian Pattern of Online Activity. Sci. Rep. 10 (1), 1–10. doi: 10.1038/s41598-020-74314-3
van der Zande L. E., Dunkelberger J. R., Rodenburg T. B., Bolhuis J. E., Mathur P. K., Cairns W. J., et al. (2020). Quantifying Individual Response to PRRSV Using Dynamic Indicators of Resilience Based on Activity. Front. Veterin. Sci. 7, 325. doi: 10.3389/fvets.2020.00325
van der Zande L., Guzhva O., Rodenburg T. B. (2021). Individual Detection and Tracking of Group Housed Pigs in Their Home Pen Using Computer Vision. Front. Anim. Sci. 2, 10. doi: 10.3389/fanim.2021.669312
van Dixhoorn I. D., Reimert I., Middelkoop J., Bolhuis J. E., Wisselink H. J., Groot Koerkamp P. W., et al. (2016). Enriched Housing Reduces Disease Susceptibility to Co-Infection With Porcine Reproductive and Respiratory Virus (PRRSV) and Actinobacillus Pleuropneumoniae (A. Pleuropneumoniae) in Young Pigs. PLoS One 11 (9), e0161832. doi: 10.1371/journal.pone.0161832
Van Nieuwamerongen S., Soede N., van der Peet-Schwering C., Kemp B., Bolhuis J. (2015). Development of Piglets Raised in a New Multi-Litter Housing System vs. Conventional Single-Litter Housing Until 9 Weeks of Age. J. Anim. Sci. 93 (11), 5442–5454. doi: 10.2527/jas.2015-9460
Veit C., Janczak A. M., Ranheim B., Vas J., Valros A., Sandercock D. A., et al. (2021). The Effect of LPS and Ketoprofen on Cytokines, Brain Monoamines, and Social Behavior in Group-Housed Pigs. Front. Veterin Sci. 7 1096 doi: 10.3389/fvets.2020.617634
Keywords: resilience, activity, computer vision, LPS, pig, lipopolysaccharide, behavior
Citation: van der Zande LE, Guzhva O, Parois S, van de Leemput IA, Bolhuis JE and Rodenburg TB (2022) Estimation of Resilience Parameters Following LPS Injection Based on Activity Measured With Computer Vision. Front. Anim. Sci. 3:883940. doi: 10.3389/fanim.2022.883940
Received: 25 February 2022; Accepted: 14 June 2022;
Published: 26 July 2022.
Edited by:
Claire Morgan-Davies, Scotland’s Rural College, United KingdomReviewed by:
Alistair B. Lawrence, Scotland’s Rural College, United KingdomCopyright © 2022 van der Zande, Guzhva, Parois, van de Leemput, Bolhuis and Rodenburg. This is an open-access article distributed under the terms of the Creative Commons Attribution License (CC BY). The use, distribution or reproduction in other forums is permitted, provided the original author(s) and the copyright owner(s) are credited and that the original publication in this journal is cited, in accordance with accepted academic practice. No use, distribution or reproduction is permitted which does not comply with these terms.
*Correspondence: Lisette E. van der Zande, bGlzZXR0ZS52YW4uZGVyLnphbmRlckB0b3BpZ25vcnN2aW4uY29t
Disclaimer: All claims expressed in this article are solely those of the authors and do not necessarily represent those of their affiliated organizations, or those of the publisher, the editors and the reviewers. Any product that may be evaluated in this article or claim that may be made by its manufacturer is not guaranteed or endorsed by the publisher.
Research integrity at Frontiers
Learn more about the work of our research integrity team to safeguard the quality of each article we publish.