
94% of researchers rate our articles as excellent or good
Learn more about the work of our research integrity team to safeguard the quality of each article we publish.
Find out more
ORIGINAL RESEARCH article
Front. Anim. Sci., 17 May 2022
Sec. Animal Nutrition
Volume 3 - 2022 | https://doi.org/10.3389/fanim.2022.848083
This article is part of the Research TopicNutrient Regulation of Feed Intake, Digestion, Metabolism, Behavior, and CognitionView all 10 articles
 John P. Underwood†
 James K. Drackley*
We determined the effects of prepartum dietary metabolizable protein (MP) supply on lipolytic and glucose response to epinephrine stimulus during the periparturient period. Twelve non-lactating cows in second or greater pregnancies were assigned to a low MP (LMP) diet formulated to provide ~900 g/day MP or a high MP (HMP) diet to provide ~1,100 g/day MP. Cows received prepartum diets from 28 days before expected parturition to day of parturition and then received a common lactation diet until 35 days postpartum. Blood was sampled weekly to day −7, daily to day 7, and weekly through day 35 relative to parturition for analysis of glucose, non-esterified fatty acids (NEFAs), 3-hydroxybutyrate (BHB), urea N, and total protein concentrations. Epinephrine challenges were conducted on day −10 before expected parturition and days 7 and 14 postpartum. Epinephrine [1.4 μg/kg body weight (BW)] was administered via jugular vein and blood was collected from the opposite jugular vein from −45 min to +120 min relative to epinephrine administration. Plasma was analyzed for glucose and NEFA concentrations. Prepartum dry matter intake (DMI) (14.7 and 12.6 ± 1.5 kg/day for LMP and HMP, respectively), postpartum DMI (21.4 and 19.4 ± 1.3 kg/day for LMP and HMP, respectively), and 4% fat-corrected milk (FCM) (37.0 and 36.8 ± 1.5 kg/day for LMP and HMP, respectively) did not differ significantly between diets. Cows fed HMP had higher plasma concentrations of urea N prepartum than cows fed LMP (14.0 vs. 7.9 ± 0.8 mg/dl). Cows fed HMP tended to have greater prepartum concentrations of total protein in plasma than those fed LMP (7.5 vs. 7.0 ± 0.2 g/dl). The area under the curve (AUC) for NEFA response to epinephrine did not differ between diets, but differed by day relative to parturition [8,284, 29,018, and 18,219 ± 2,302 min × (μeq/l) for days −10, 7, and 14, respectively]. Maximal response of NEFA concentration to epinephrine was greater for HMP than for LMP (744 vs. 438 ± 72 μeq/l). The glucose AUC did not differ between diets or among days. Lipolytic response, but not glucose response, to epinephrine was enhanced during the early postpartum period relative to the late dry period. However, those responses were not affected by prepartum MP supply.
The transition from late pregnancy to lactation in dairy cows is often compromised by health disorders. Many of the complications arise from the decreased dry matter intake (DMI) and increased nutrient demands for milk synthesis. When nutrient intake does not meet nutrient demands, cows mobilize body stores of adipose tissue triglycerides to provide non-esterified fatty acids (NEFAs) as energy for body tissues. In this process, NEFAs released from adipose tissue are carried by blood to the liver, where they are oxidized or resynthesized to triglycerides, some of which are packaged into very low-density lipoproteins (VLDLs) that are secreted from the liver. When the liver becomes infiltrated with triglycerides, there may be increased risks for metabolic disorders such as ketosis (Drackley et al., 2005; McFadden, 2020; White, 2020). Therefore, dairy cows should not mobilize more NEFA than the liver can oxidize and export, if disorders such as ketosis are to be kept under control.
Among the factors that seem to accelerate body fat mobilization is an increased supply of metabolizable protein (MP) (Ørskov et al., 1977). Oldham et al. (1978) postulated that high amounts of MP may stimulate growth hormone (GH) secretion, which would increase response of adipose tissue to adrenergic stimuli. Epinephrine challenges have been used to study the responsiveness of adipose tissue to adrenergic stimuli (McCutcheon and Bauman, 1986; Froehli and Blum, 1988; Boisclair et al., 1997). Supporting the concept that an increased GH secretion subsequently increased lipid mobilization, Sechen et al. (1990) determined that epinephrine challenges increased NEFA concentrations more in bovine somatotropin (bST)-administered cows than in control cows. Others also have substantiated this idea (McNamara, 1988; Houseknecht et al., 1995). Part of the increase in NEFA concentrations in early lactation may be due to the increased concentrations of GH after parturition (McNamara, 1988), which increase adipose tissue response to higher demands for energy in early lactation.
To determine the effects of different concentrations of rumen-undegradable protein (RUP) in diets on lipolytic responsiveness of adipose tissue, as measured by response to epinephrine challenge, Cadorniga and Lopez-Diaz (1995) fed diets containing 54.0 or 31.1% RUP [percent of crude protein (CP)] to early lactation cows and then administered epinephrine challenges at weeks 3 and 8 of lactation. Cows fed the higher RUP diet showed a significantly greater increase in NEFA at the week 8 challenge, indicating that high RUP tended to delay the decrease in tissue responsiveness to epinephrine as lactation proceeds. We recently reported that cows fed greater amounts of MP postpartum mobilized more body reserves as NEFA postpartum than cows fed less MP (Underwood et al., 2022). However, in this study, the cows fed the high MP diet tended to have slightly lower dry matter intake (DMI) with greater milk yield, which confounded the interpretation of MP effects on NEFA mobilization. To date, effects of varying dietary MP in the prepartum period on mobilization of lipids are not known. Effects could be either negative around parturition, if higher protein increases body fat mobilization and fat accumulation in the liver or positive during early lactation, if high MP optimizes the use of body fat as energy to support milk production.
The National Research Council (2001) guidelines for late gestation cows suggest an MP requirement of 810 g/day within 7 days of parturition, which could be met by dietary CP concentrations of 12.4%. Some have advocated feeding a dietary nutrient concentration intermediate to that of the dry cow diet and that of the lactating cow diet (Grummer, 1995), which for protein is generally recognized as being ~15% CP. Some researchers have recommended prepartum intakes of MP as high as 1,350 g/day on the basis of limited data showing improved health outcomes (Van Saun and Sniffen, 2014). However, because overall studies have not shown a production benefit to feeding higher CP diets in the transition period (Husnain and Santos, 2019), the general recommendations of feeding diets higher in CP concentration remain controversial. The objective of this study was to evaluate the effects of feeding a diet that would supply more MP than the current. National Research Council (2001) recommendations on response of cows to an epinephrine challenge. Our hypothesis was that cows fed a greater amount of MP prepartum would have increased lipolytic response to epinephrine challenge.
All the procedures were approved by the Institutional Animal Care and Use Committee of the University of Illinois Urbana-Champaign. Fourteen multiparous Holstein cows due to calve in October were utilized in a randomized complete block design. This number of cows was determined to have 80% power to detect differences in NEFA response of 15%. Cows were blocked according to expected parturition date, body condition score (BCS), and previous milk yield and then were assigned randomly to 1 of 2 experimental groups. The treatment groups were: (1) Low MP (LMP) [fed a diet containing 12% CP, formulated to supply ~900 g/day MP as predicted by the National Research Council (2001) model] and (2) High MP (HMP, (fed a diet containing 15% CP, formulated to supply ~1,100 g/day predicted MP). As formulated, treatments supplied ~100% of the MP requirement (LMP) or 120% of MP requirement (HMP). Upon parturition, cows were fed a common lactation diet.
Cows were dried off 60 days before expected parturition date and fed to meet the National Research Council (2001) recommendations. On day −28, cows were placed in tie-stall housing, switched to their respective dietary treatments, and fed those diets until parturition. Ingredient composition of the diets is shown in Table 1. Forages were alfalfa hay, alfalfa silage, and corn silage during the prepartum period and alfalfa silage and corn silage during the lactation period. Cows were individually fed the prepartum and postpartum diets twice daily (1,000 and 1,600 h) as a total mixed ration (TMR). Feed refusals were measured and recorded daily. Feed intakes were measured daily from days −28 to 35 postpartum. Feeds were sampled weekly, composited by month, and analyzed for concentrations of DM, ash, CP, acid detergent fiber (ADF), neutral detergent fiber (NDF), and minerals by Cumberland Valley Analytical Services (Hagerstown, Maryland, USA), using standard wet chemistry methodology (https://www.foragelab.com/Lab-Services/Forage-and-Feed/Lab-Procedures/).
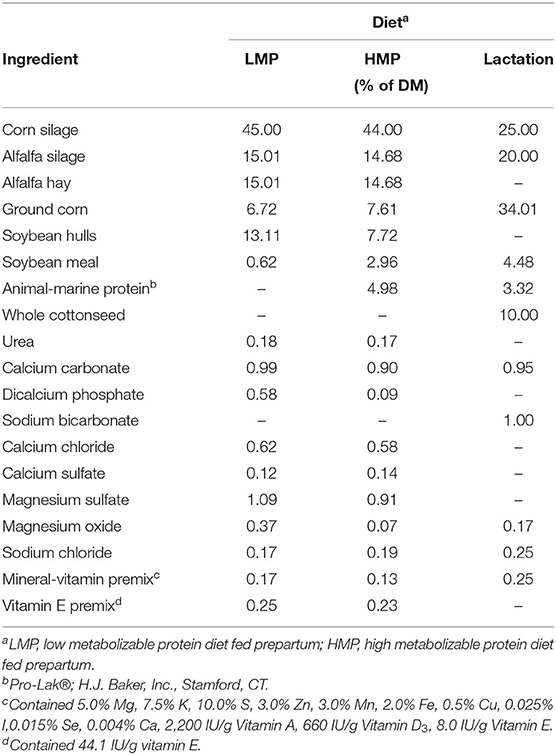
Table 1. Ingredient composition of diets.
Body weights (BWs) were recorded at weekly intervals and BCS was recorded at weekly intervals by 4 evaluators utilizing the system developed by Wildman et al. (1982), which includes observing the presence or absence of fat cover surrounding the pin bones, hips, thurls, thighs, back, and ribs. The scale used was 1 = thin to 5 = obese. Previous BCS on each cow was not known at time of evaluations. Scores were averaged for statistical analysis.
Cows were housed in a tie-stall barn and milked twice daily (0,400 and 1,500 h). Milk production was recorded electronically (BouMatic, Madison, Wisconsin, USA) and summed to give daily production. Milk samples were collected weekly at 2 consecutive milkings. Milk was analyzed for fat, total protein, somatic cell count (SCC), urea N, lactose, total solids, and true protein by Dairy Lab Services (Dubuque, Iowa, USA). Four percentage fat-corrected milk (FCM) was calculated using the following equation (Tyrrell and Reid, 1965):
The epinephrine challenges were administered on day −10 (relative to expected parturition) and days 7 and 14 (relative to parturition). Actual day of the prepartum challenge relative to parturition was −9.8 ± 5.3 days (mean ± SD), whereas all the postpartum challenges were conducted on days 7 and 14 relative to parturition. Blood was collected via jugular venipuncture. Although most previous studies utilized an indwelling jugular catheter for blood collection (McCutcheon and Bauman, 1986; Lukes et al., 1989; Sechen et al., 1990; Cadorniga and Lopez-Diaz, 1995; Houseknecht et al., 1995), this study utilized jugular venipuncture. Two cows were utilized before this study commenced to compare sampling by the two procedures. The NEFA concentrations followed a similar pattern after epinephrine injection in each procedure, indicating that the venipuncture technique was adequate for the timed collection.
Epinephrine challenges were administered at ~1,300 h, which were about 3 h postfeeding. The dosage of epinephrine given was 1.4 μg/kg BW based on study by Houseknecht et al. (1995). One ml of epinephrine solution (1 mg/ml; Vedco Incorporation, St. Joseph, Mosby, USA) was mixed in 4 ml sterile saline solution in a sterile bottle to make a 20% mixture of epinephrine in saline. The mixture was administered systemically to the cow via one jugular vein at time 0. Blood was collected from the opposite jugular vein using a 20-guage needle at times −45, −30, −20, −10, −5, 2.5, 5, 10, 15, 20, 30, 45, 60, 90, and 120 min relative to administration of the epinephrine. Samples were collected into heparinized tubes, placed on ice, and plasma was obtained by centrifugation (3,500 × g for 10 min). Plasma was stored frozen (−20°C) until analyzed for glucose and NEFA. Glucose was determined by the Trinder reaction (Kit #310; Sigma Chemical, St. Louis, Mosby, USA). Non-esterified fatty acids were quantified by procedures detailed by Johnson and Peters (1993) using a commercial kit (NEFA-C kit; Wako Chemicals, Richmond, Virginia, USA).
Blood samples were also obtained weekly until day −7, daily until day 7, and weekly after day 7 until day 35. Samples were obtained at ~0700 h, which were after milking and before the morning feeding. Blood samples were collected from the coccygeal vein and placed in serum and plasma (heparin) tubes. Plasma and serum were separated by centrifugation and subsequently stored frozen (−20°C) until analyzed. Plasma was analyzed for glucose and NEFA as described for the challenge samples. Urea N (Kit 535; Sigma Chemical Corporation), 3-hydroxybutyrate (BHB) (Kit 310; Sigma Chemical Corporation), and total protein (#1040901; Roche Laboratories, Indianapolis, Indiana, USA) were analyzed in serum by the University of Illinois Veterinary Diagnostic Laboratory.
Data were analyzed as a completely randomized design with repeated measures. Prepartum and postpartum datasets were analyzed separately, except for the epinephrine challenge data. Statistical calculations were performed using the MIXED procedure of the Statistical Analysis System (SAS) (1996). The statistical model included the fixed effects of diet, time, and the interaction of diet by time, with cow as a random effect. Initial BCS and actual day relative to calving were included as covariates where significant. Several covariance structures were considered for the repeated measurements and the one with the lowest Akaike information criterion (corrected) was used in the model. Concentrations of NEFA and glucose from the epinephrine challenge periods were plotted over time and total epinephrine response was determined by calculating the area under the response curve by trapezoid summation. The baseline was considered to be the average of the prechallenge values. Model residuals were examined for normality and homoscedasticity. Least squares means were calculated and are presented with SEs. Probability values of P < 0.05 were considered as significant, whereas values with P > 0.05 but P < 0.15 are discussed as trends.
Fourteen cows were assigned to treatments in the experiment. One cow from the LMP group developed toxic mastitis 1 day postpartum and died and one cow from the HMP group developed a displaced abomasum at day 21 postpartum and was eliminated from this study. For the 12 cows that remained in this study, there were no retained placentas, clinical cases of milk fever, or displaced abomasums. One cow produced twin calves, but did not suffer from any subsequent metabolic disorders.
Table 2 lists the chemical analysis of each diet. As calculated from means according to the National Research Council (2001), the LMP diet supplied an estimated 935 g/day of MP and the HMP diet supplied an estimated 1,150 g/day of MP. The treatment groups did not differ in prepartum DMI (14.7 vs. 12.6 ± 1.5 kg/day for LMP and HMP; P = 0.31), as shown in Table 3. The DMI as a percentage of BW (1.85 vs. 1.69 ± 0.17%) did not differ (P = 0.52). From weeks −3 to −1, BCS tended to increase for LMP cows and to decrease for HMP cows (diet × week interaction, P < 0.11; Figure 1). This difference may have been attributable to the non-significantly lower DMI (2.1 kg/day) for the HMP cows. Prepartum BW (776 vs. 759 ± 33 kg; P = 0.72) of cows did not differ between the LMP and HMP diets, respectively (Table 3).

Table 2. Chemical analysis of diets for cows fed low (L) or high (H) amounts of metabolizable protein (MP) prepartum.
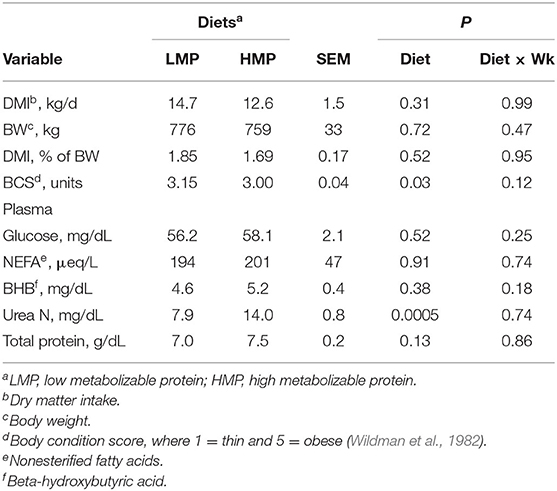
Table 3. Prepartum variables for cows consuming low (L) or high (H) amounts of metabolizable protein (MP) prepartum.
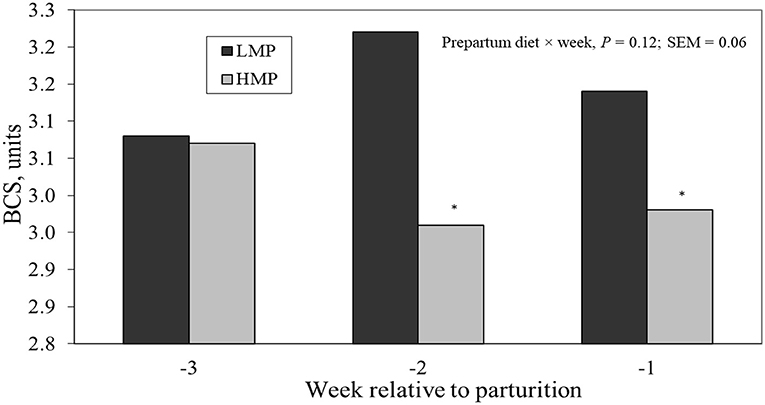
Figure 1. Mean body condition score (BCS) (1 = thin to 5 = obese) prepartum for cows fed diets with low metabolizable protein (LMP) or high metabolizable protein (HMP) during the prepartum period.
The plasma concentrations of NEFA, glucose, and BHB (Table 3) did not differ between diets (P = 0.91, P = 0.52, and P = 0.38, respectively). Cows fed HMP tended (P = 0.13) to have slightly greater concentrations of total protein (7.5 vs. 7.0 ± 0.13 mg/dl) than cows fed LMP, perhaps reflecting improved protein status. Cows fed HMP had a higher urea N concentration than did the LMP cows (14.0 vs. 7.9 mg/dl, respectively; P = 0.0005). This finding is in agreement with study by Putnam and Varga (1998) and Park et al. (2002), who found that urea N increased in blood as CP increased in prepartum diets. The increased urea N reflects an increased ruminal degradation of dietary protein and catabolism of amino acid (AA) to ammonia in the rumen, with subsequent absorption into the blood and conversion to urea by the liver.
Table 4 lists data for the postpartum variables measured. Although cows fed LMP had numerically higher DMI than those fed HMP (21.4 vs. 19.4 kg/day, respectively), the difference did not achieve statistical significance (P = 0.27). By week 5, DMI for both the groups reached ~25 kg/day. This amount of DMI was achieved earlier in lactation than observed by Kertz et al. (1991), who suggested that peak intake of 22 kg/day was achieved at week 10 of lactation. Both the treatment groups had DMI in excess of 22 kg/day by week 4. The higher DMI than observed by Kertz et al. (1991) may be due to the greater milk yield and absence of metabolic disorders for cows in this study. A number of researchers (Zamet et al., 1979; Ostergaard and Grohn, 2000) have demonstrated that metabolic disorders are associated with decreased DMI, indicating that cows that do not experience metabolic disorders may have higher DMI in early lactation. Postpartum BW (Table 4) did not differ between the groups (685 vs. 667 ± 30 kg; P = 0.67). The LMP group consumed 3.10% of their BW, while the HMP group consumed 2.94% of their BW (Table 4; P = 0.60). Postpartum BCS did not differ between the groups (Table 4; P = 0.19).
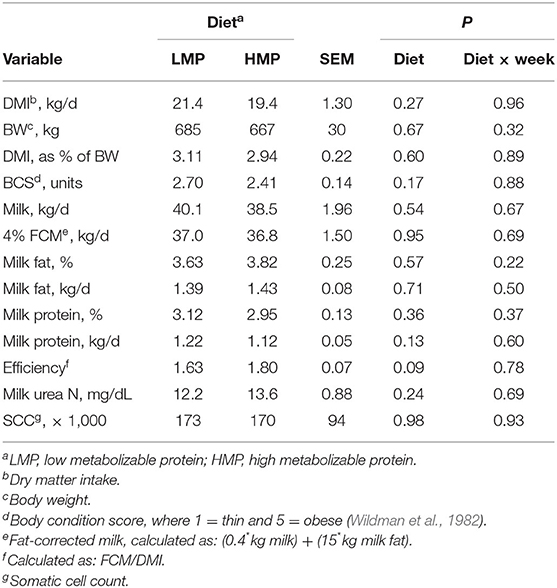
Table 4. Postpartum variables for cows fed low (L) or high (H) amounts of metabolizable protein (MP) prepartum.
Milk yield and composition are shown in Table 4. Both the groups produced similar amounts of milk (P = 0.75) and were near peak milk yield by week 5. Milk yield, 4% FCM yield, and milk component yields were similar between the groups. These results are consistent with other studies that has evaluated different amounts of prepartum dietary protein and postpartum performance. Doepel et al. (2002) fed diets containing 12.5 or 17.0% CP to prepartum cows and reported similar postpartum milk production between the groups. Huyler et al. (1999) fed prepartum cows different amounts of CP and RUP, ranging from 11.7 to 20.6% for CP and 3.1 to 10.6% for RUP; milk and component yields were similar. Santos et al. (2001) determined that prepartum feeding of higher RUP or CP to multiparous cows did not improve milk yield compared with cows fed diets with lower RUP and CP. Together, these results suggest that higher amounts of prepartum dietary CP or MP do not improve subsequent milk or milk component yields in multiparous cows. Husnain and Santos (2019) reported in a meta-analysis that increasing prepartum MP did not improve subsequent milk production in multiparous cows except in those producing > 36 kg/day of milk.
Efficiency of 4% FCM production (Table 4) tended to be higher (P = 0.09) for HMP cows than for LMP cows (1.80 vs. 1.63). Although DMI, milk yield, and milk fat concentration did not differ significantly between the groups, the numerically lower DMI for the HMP cows, combined with a numerically higher milk fat concentration, contributed to the trend for improved feed efficiency. Similar trends were observed by Underwood et al. (2022). Perhaps improved body protein status prepartum led to the ability to partition more nutrients toward milk production postpartum.
Postpartum concentrations of metabolites in blood are shown in Table 5. Concentrations of glucose (P = 0.97), BHB (P = 0.76), urea N (P = 0.57), and total protein (P = 0.17) did not differ between the groups. A treatment by week interaction (P = 0.03; Figure 2) was detected for NEFA, as the HMP group had lower NEFA at parturition, but higher NEFA at week 1 of lactation than the LMP group.
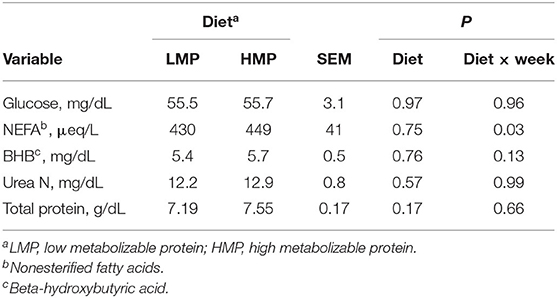
Table 5. Postpartum concentrations of compounds in plasma for cows fed low (L) or high (H) amounts of metabolizable protein (MP) prepartum.
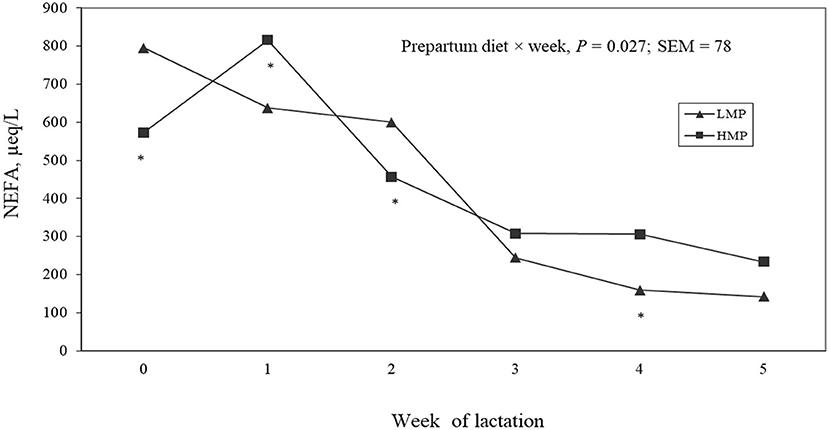
Figure 2. Least squares means for postpartum concentrations of non-esterified fatty acids (NEFAs) in plasma from cows fed diets with low metabolizable protein (LMP) or high metabolizable protein (HMP) during the prepartum period.
Table 6 lists the area under the curve (AUC) for NEFA responses in blood to epinephrine challenges at 10 days prepartum, 7 days postpartum, and 14 days postpartum. Responses did not differ between the treatment groups. Maximal responses of NEFA concentration to epinephrine tended to differ (P = 0.11) between the groups and the diet by day interaction was significant (Table 6). The AUC should more closely represent the true mobilization of body lipids rather than just the maximal change in concentration. These results contrast with study by Cadorniga and Lopez-Diaz (1995) who found that cows fed diets containing higher amounts of RUP had an increased lipolytic response to epinephrine as shown by elevated NEFA concentrations. The RUP differences, however, were in the lactation diet, not in the prepartum diet, and the challenges were administered during weeks 3 and 8 of lactation, rather than days 7 and 14, in this study. Oldham et al. (1978) suggested that high amounts of dietary protein may stimulate GH secretion, which would increase the response of adipose tissue to adrenergic stimuli. It is possible that the greater amount of MP supplied to the HMP cows prepartum was not adequate to stimulate GH secretion. Alternately, differences may have been too small to detect statistically or were diminished by early postpartum.
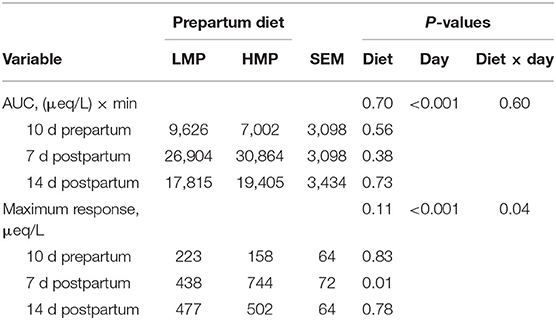
Table 6. Area under the curve (AUC) for NEFA and maximal NEFA response in plasma to epinephrine administration in dairy cows fed low (L) or high (H) amounts of metabolizable protein (MP) prepartum.
Time relative to parturition influenced lipolytic responses to epinephrine as measured by the AUC (P = 0.0002) and maximal response (Table 6). Figure 3 illustrates NEFA concentrations before and after the 3 epinephrine administrations and shows the differences in lipolytic response with physiological state. Cows administered epinephrine at 7 days postpartum had the greatest AUC response and the response at 14 days was greater than the response at −10 days. Maximal NEFA response was greater for challenges at days 7 and 14 than at day −10. The highest AUC for NEFA at day 7 corresponds with study by Houseknecht et al. (1995), who determined that cows administered GH had a higher response to epinephrine challenge at days 7 than that at −2, −1, 1, 2, 3, and 5 days relative to parturition. No comparisons were made after day 7 in their study. Other researchers have determined that GH increased lipolytic response of adipose tissue to adrenergic stimuli (McNamara, 1988; Sechen et al., 1990); however, the cows utilized in those studies were lactating and not periparturient. Figure 3 shows that NEFA concentrations were higher at day 7 than at day 14 and those at day 14 were numerically higher than at −10 days. Because NEFA concentrations were higher at days 7 and 14 than at −10 days, adipose tissue was more actively responding to hormones such as GH and catecholamines, so that epinephrine administration increased lipolytic response during those times as compared to the prepartum administration. Together, these data confirm that adipose tissue response to epinephrine is greater in early lactation than in late gestation.
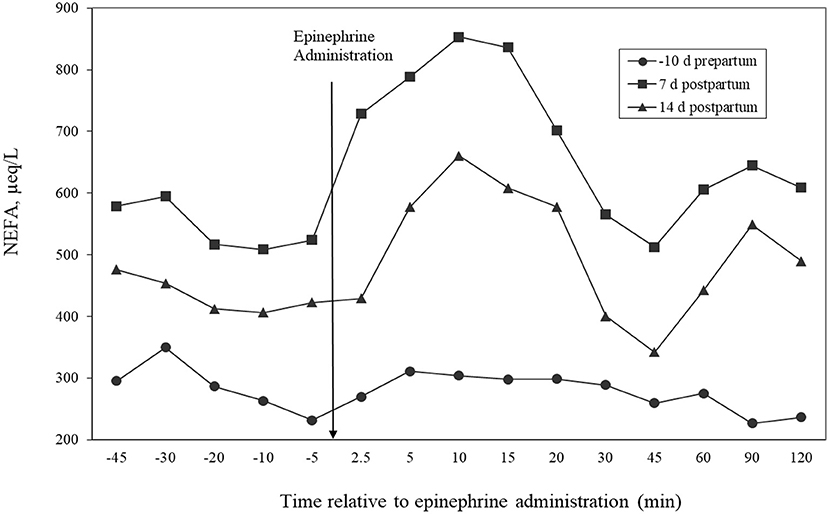
Figure 3. Temporal patterns of concentrations of non-esterified fatty acids (NEFAs) in plasma relative to administration of epinephrine for cows administered epinephrine challenges at days −10, 7, or 14 relative to calving. Effects of day (P ≤ 0.001) and time relative to epinephrine administration (P < 0.001).
The mechanism by which epinephrine administration causes elevated NEFA concentrations has been extensively documented and involves binding to β-adrenergic receptors that lead to increased cyclic AMP and increased hormone-sensitive lipase (HSL) activity. Mechanisms whereby dietary MP supply might alter these responses largely revolve around the stimulation of GH secretion by MP (Clark, 1975). In a review of the physiology of the somatotropic axis, Gluckman et al. (1987) stated that neurotransmitters act on the hypothalamus to cause the release of growth hormone-releasing factor, which then acts on the pituitary gland to cause the release of GH. In turn, GH promotes lipolysis both via inhibition of lipoprotein lipase, which stimulates uptake of triglycerides by adipose tissue and by increasing abundance of HSL, the rate-limiting step for catecholamine stimulated-release of stored triglyceride in adipose tissue (Carrel and Allen, 2000). These actions, thus, increase circulating concentrations of NEFA in response to adrenergic activation. Whether increased MP stimulates GH secretion remains controversial (Oldham et al., 1978, 1982; Cohick et al., 1986).
Table 7 shows the AUC for glucose response to epinephrine administrations. No difference between the dietary groups (P = 0.71), no effect of day (P = 0.46), and no diet by day interaction (P = 0.71) were detected. These results indicate that the higher supply of MP fed to the HMP group did not affect glucose response to epinephrine. Glucose maximal changes are shown in Table 7. The postpartum challenges resulted in higher response (P = 0.002) of glucose than the day −10 challenge. These results parallel the results for NEFA concentrations, in that glucose responded more to adrenergic stimuli during the postpartum period than prepartum period. Figure 4 illustrates the glucose changes over the challenge periods. Cows had marked responses to the epinephrine administration, with concentrations peaking the highest at 7 days postpartum. The response at 10 days prepartum did not peak as high, but remained elevated for a longer duration, thus resulting in the similar AUC as the days 7 and 14 challenges. The glucose response to epinephrine administration was similar to the studies by Erickson et al. (1990) and McCutcheon and Bauman (1986), who found that concentrations of glucose were elevated by administration of epinephrine. In another study, the glucose AUC in cows treated with GH was numerically greater, but not significant (Putnam et al., 1999). This finding agrees with our findings that the AUC did not differ between HMP and LMP cows. The response of cows to epinephrine administration may reflect an increase of glucose production by the liver (primarily through an increased glycogenolysis), reduction of glucose utilization by body tissues, or both. Because the glucose AUC was not different among the time periods, the homeostatic mechanisms to keep glucose at stable concentrations may not have been affected by the homeorhetic changes associated with the transition to lactation.
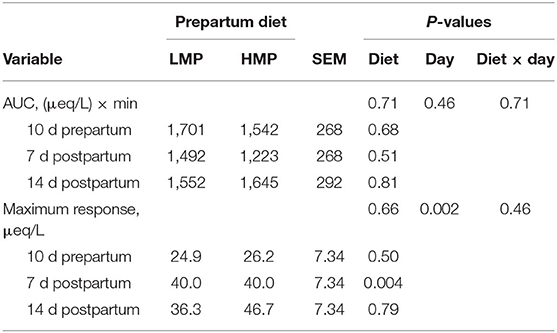
Table 7. Area under the curve (AUC) for glucose and maximal glucose response in plasma to epinephrine administration in dairy cows fed low (L) or high (H) amounts of metabolizable protein (MP) prepartum.
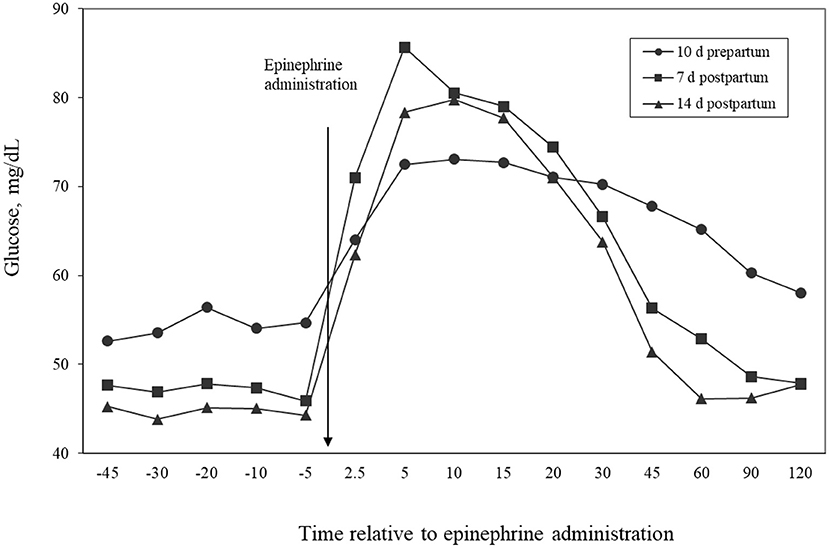
Figure 4. Temporal patterns of concentrations of glucose in plasma relative to administration of epinephrine for cows administered epinephrine challenges at days 10, 7, or 14 relative to calving. Effects of day (P = 0.07) and time relative to epinephrine administration (P < 0.001).
Results of this experiment indicate that greater amounts of MP in the prepartum diet did not affect prepartum or postpartum response to epinephrine challenges. The elevated lipolytic response to epinephrine in the early postpartum period with subsequent lipid mobilization and increase of NEFA in plasma indicates a higher risk for fat infiltration in the liver and development of fatty liver disease. Because cows release epinephrine in response to acute stressors, management practices that minimize stress in the early postpartum period are needed to decrease the risk of metabolic disorders related to fatty liver. Further studies should evaluate early lactation management practices that may cause cows to respond with an increased lipolysis. Feeding more MP than the National Research Council (2001) requirements prepartum resulted in an improved efficiency of FCM production.
The raw data supporting the conclusions of this article will be made available by the authors, without undue reservation.
The animal study was reviewed and approved by University of Illinois Institutional Animal Care and Use Committee.
JU and JD: conceptualization. JU: investigation and analysis, data curation, and writing—original draft preparation. JD: writing—reviewing and editing and funding acquisition. All the authors have read and approved the final version of the manuscript.
Funding for this study was provided by H. J. Baker & Bro and by state and federal funds appropriated to the Illinois Agricultural Experiment Station (Urbana).
The authors declare that the research was conducted in the absence of any commercial or financial relationships that could be construed as a potential conflict of interest.
All claims expressed in this article are solely those of the authors and do not necessarily represent those of their affiliated organizations, or those of the publisher, the editors and the reviewers. Any product that may be evaluated in this article, or claim that may be made by its manufacturer, is not guaranteed or endorsed by the publisher.
Boisclair, Y. R., Johnston, K. B., Bauman, D. E., Crooker, B. A., Dunshea, F. R., and Bell, A. W. (1997). Paradoxical increases of circulating non-esterified fatty acids in somatotropin treated cattle undergoing mild disturbances. Domest. Anim. Endocrinol. 14, 251–262. doi: 10.1016/S0739-7240(97)00021-0
Cadorniga, C., and Lopez-Diaz, M. C. (1995). Possible modulation of adipose tissue responsiveness to catecholamines by available dietary protein in dairy cows during early lactation. Reprod. Nutr. Dev. 35, 241–248. doi: 10.1051/rnd:19950301
Carrel, A. L., and Allen, D. B. (2000). Effects of growth hormone on adipose tissue. J. Pediatr. Endocrinol. Metab. 13, 1003–1009. doi: 10.1385/ENDO:12:2:163
Clark, J. H. (1975). Lactational responses to postruminal administration of proteins and amino acids. J. Dairy Sci. 58:1178–1197. doi: 10.3168/jds.S0022-0302(75)84696-0
Cohick, W. S., Vicini, J. L., Staples, C. R., Clark, J. H., McCutcheon, S. N., and Bauman, D. E. (1986). Effects of intake and postruminal casein infusion on performance and concentrations of hormones in plasma of lactating cows. J. Dairy Sci. 69, 3022–3031. doi: 10.3168/jds.S0022-0302(86)80765-2
Doepel, L., Lapierre, H., and Kennelly, J. J. (2002). Peripartum performance and metabolism of dairy cows in response to prepartum energy and protein intake. J. Dairy Sci. 85, 2315–2334. doi: 10.3168/jds.S0022-0302(02)74312-9
Drackley, J. K., Dann, H. M., Douglas, G. N., Janovick Guretzky, N. A., Litherland, N. B., Underwood, J. P., et al. (2005). Physiological and pathological adaptations in dairy cows that may increase susceptibility to periparturient diseases and disorders. Ital. J. Anim. Sci. 4, 323–344. doi: 10.4081/ijas.2005.323
Erickson, P. S., Trusk, A. M., and Murphy, M. R. (1990). Effects of niacin source on epinephrine stimulation of plasma non-esterified fatty acid and glucose concentrations, on diet digestibility and on rumen protozoal numbers in lactating dairy cows. J. Nutr. 120, 1648–1653. doi: 10.1093/jn/120.12.1648
Froehli, D. M., and Blum, J. W. (1988). Nonesterified fatty acids and glucose in lactating dairy cows: diurnal variations and changes in responsiveness during fasting to epinephrine and effects of beta-adrenergic blockade. J. Dairy Sci. 71, 1170–1177. doi: 10.3168/jds.S0022-0302(88)79671-X
Gluckman, P. D., Breier, B. H., and Davis, S. R. (1987). Physiology of the somatotropic axis with particular reference to the ruminant. J. Dairy Sci. 70, 442–466. doi: 10.3168/jds.S0022-0302(87)80028-0
Grummer, R. R. (1995). Impact of changes in organic nutrient metabolism on feeding the transition dairy cow. J. Dairy Sci. 73, 2820–2833. doi: 10.2527/1995.7392820x
Houseknecht, K. L., Dwyer, D. A., Lanna, D. P., and Bauman, D. E. (1995). Effect of somatotropin on adipose tissue metabolism: ontogeny of the enhanced response to adrenergic challenge in the lactating cow. Domest. Anim. Endocrinol. 12, 105–113. doi: 10.1016/0739-7240(94)00013-Q
Husnain, A., and Santos, J. E. P. (2019). Meta-analysis of the effects of prepartum dietary protein on performance of dairy cows. J. Dairy Sci. 102, 9791–9813. doi: 10.3168/jds.2018-16043
Huyler, M. T., Kincaid, R. L., and Dostal, D. F. (1999). Metabolic and yield responses of multiparous Holstein cows to prepartum rumen-undegradable protein. J. Dairy Sci. 82, 527–536. doi: 10.3168/jds.S0022-0302(99)75264-1
Johnson, M. M., and Peters, J. P. (1993). Technical Note: An improved method to quantify nonesterified fatty acids in bovine plasma. J. Anim. Sci. 71, 753–756. doi: 10.2527/1993.713753x
Kertz, A. F., Reutzel, L. F., and Thomson, G. M. (1991). Dry matter intake from parturition to midlactation. J. Dairy Sci. 74, 2290–2295. doi: 10.3168/jds.S0022-0302(91)78401-4
Lukes, A. J., Barnes, M. A., and Pearson, R. E. (1989). Response to selection for milk yield and metabolic challenges in primiparous dairy cows. Domest. Anim. Endocrinol. 6, 287–298. doi: 10.1016/0739-7240(89)90023-4
McCutcheon, S. N., and Bauman, D. E. (1986). Effect of chronic growth hormone treatment on responses to epinephrine and thyrotropin-releasing hormone in lactation cows. J. Dairy Sci. 69, 44–51. doi: 10.3168/jds.S0022-0302(86)80368-X
McFadden, J. W. (2020). Review: Lipid biology in the periparturient dairy cow: contemporary perspectives. Animal 14, s165–s175. doi: 10.1017/S1751731119003185
McNamara, J. P. (1988). Regulation of bovine adipose tissue metabolism during lactation. 4. Dose-responsiveness to epinephrine as altered by stage of lactation. J. Dairy Sci. 71, 643-649. doi: 10.3168/jds.S0022-0302(88)79602-2
National Research Council (2001). Nutrient Requirements of Dairy Cattle. 7th rev. ed. Washington, DC: Nat. Acad. Sci.
Oldham, J. D., Hart, I. C., and Bines, J. A. (1978). Effect of abomasal infusions of casein, arginine, methionine, or phenylalanine on growth hormone, insulin, prolactin, thyroxine, and some metabolites in blood from lactating goats. Proc. Nutr. Soc. 37, 9.
Oldham, J. D., Hart, I. C., and Bines, J. A. (1982). Formaldehyde-treated proteins for dairy cows - effects on blood hormone concentrations. Br. J. Nutr. 48, 543–547. doi: 10.1079/BJN19820139
Ørskov, E. R., Grubb, D. A., and Kay, R.N.B. (1977). Effect of postruminal glucose or protein supplementation on milk yield and composition in Friesian cows in early lactation and negative energy balance. Br. J. Nutr. 38, 397–405. doi: 10.1079/BJN19770104
Ostergaard, S., and Grohn, Y. T. (2000). Concentrate feeding, dry matter intake, and metabolic disorders in Danish dairy cows. Livestock Prod. Sci. 65, 107–118. doi: 10.1016/S0301-6226(99)00174-8
Park, A. F., Shirley, J. E., Titgemeyer, E. C., Meyer, M. J., Van Baale, M. J., and VandeHaar, M. J. (2002). Effect of protein level in prepartum diets on metabolism and performance of dairy cows. J. Dairy Sci. 85, 1815–1828. doi: 10.3168/jds.S0022-0302(02)74256-2
Putnam, D. E., and Varga, G. A. (1998). Protein density and its influence on metabolite concentration and nitrogen retention by Holstein cows in late gestation. J. Dairy Sci. 81, 1608–1618. doi: 10.3168/jds.S0022-0302(98)75727-3
Putnam, D. E., Varga, G. A., and Green, M. H. (1999). Glucose kinetic responses to protein supplementation and exogenous somatotropin in late gestation dairy cows. J. Dairy Sci. 82, 1274–1281. doi: 10.3168/jds.S0022-0302(99)75350-6
Santos, J. E., DePeters, E. J., Jardon, P. W., and Huber, J. T. (2001). Effect of prepartum dietary protein level on performance of primigravid and multiparous Holstein dairy cows. J. Dairy Sci. 84, 213–224. doi: 10.3168/jds.S0022-0302(01)74471-2
Sechen, S. J., Dunshea, F. R., and Bauman, D. E. (1990). Somatotropin in lactating cows: effect on response to epinephrine and insulin. Am. J. Physiol. 258, E582–E588. doi: 10.1152/ajpendo.1990.258.4.E582
Statistical Analysis System (SAS) (1996). SAS/STATR® Software. Changes and enhancements through release 6.11. 1996. SAS Inst., Inc., Cary, NC.
Tyrrell, H. F., and Reid, J. T. (1965). Prediction of the energy value of cow's milk. J. Dairy Sci. 48, 1215–1223. doi: 10.3168/jds.S0022-0302(65)88430-2
Underwood, J. P., Clark, J. H., Cardoso, F. C., Chandler, P. T., and Drackley, J. K. (2022). Production, metabolism, and follicular dynamics in multiparous dairy cows fed diets providing different amounts of metabolizable protein prepartum and postpartum. J. Dairy Sci. 105, 996. doi: 10.3168/jds.2021-20996
Van Saun, R. J., and Sniffen, C. J. (2014). Transition cow nutrition and feeding management for disease prevention. Vet. Clinic. North Am: Food Anim. Pract. 30, 689–719. doi: 10.1016/j.cvfa.2014.07.009
White, H. M. (2020). ADSA foundation scholar award: influencing hepatic metabolism: can nutrient partitioning be modulated to optimize metabolic health in the transition dairy cow? J. Dairy Sci. 103, 6741–6750. doi: 10.3168/jds.2019-18119
Wildman, E. E., Jones, G. M., Wagner, P. E., Boman, R. L., Troutt J.r., H. F., et al. (1982). A dairy cow body condition scoring system and its relationship to selected production characteristics. J. Dairy Sci. 65, 495–501. doi: 10.3168/jds.S0022-0302(82)82223-6
Zamet, C. N., Colenbrander, V. F., Callahan, C. J., Chew, B. P., Erb, R. E., and Moeller, N. J. (1979). Variables asociated with peripartum traits in dairy cows. I. Effect of dietary forages and disorders on voluntary intake of feed, body weight and milk yield. Theriogenology 11, 229–244. doi: 10.1016/0093-691X(79)90031-1
Keywords: epinephrine, metabolism, lipolysis, metabolizable protein, glucose
Citation: Underwood JP and Drackley JK (2022) Metabolic Responses to Epinephrine by Periparturient Dairy Cows Fed Prepartum Diets Differing in Predicted Metabolizable Protein Supply. Front. Anim. Sci. 3:848083. doi: 10.3389/fanim.2022.848083
Received: 03 January 2022; Accepted: 23 March 2022;
Published: 17 May 2022.
Edited by:
Kendall C. Swanson, North Dakota State University, United StatesReviewed by:
Masahito Oba, University of Alberta, CanadaCopyright © 2022 Underwood and Drackley. This is an open-access article distributed under the terms of the Creative Commons Attribution License (CC BY). The use, distribution or reproduction in other forums is permitted, provided the original author(s) and the copyright owner(s) are credited and that the original publication in this journal is cited, in accordance with accepted academic practice. No use, distribution or reproduction is permitted which does not comply with these terms.
*Correspondence: James K. Drackley, ZHJhY2tsZXlAaWxsaW5vaXMuZWR1
†Deceased
Disclaimer: All claims expressed in this article are solely those of the authors and do not necessarily represent those of their affiliated organizations, or those of the publisher, the editors and the reviewers. Any product that may be evaluated in this article or claim that may be made by its manufacturer is not guaranteed or endorsed by the publisher.
Research integrity at Frontiers
Learn more about the work of our research integrity team to safeguard the quality of each article we publish.