 Cori J. Siberski–Cooper
 Mary S. Mayes
 James E. Koltes
94% of researchers rate our articles as excellent or good
Learn more about the work of our research integrity team to safeguard the quality of each article we publish.
Find out more
ORIGINAL RESEARCH article
Front. Anim. Sci., 03 March 2022
Sec. Precision Livestock Farming
Volume 3 - 2022 | https://doi.org/10.3389/fanim.2022.841797
Feed efficiency is an important trait to dairy production because of its impact on sustainability and profitability. Measuring individual cow feed intake on commercial farms would be unfeasibly costly at present. Thus, developing cheap and portable indicators of feed intake would be highly beneficial for genetic selection and precision feeding management tools. Given the growing use of automated sensors on dairy farms, the objective of this study was to determine the relationship between measurements recorded from multiple wearable sensors and feed intake. A total of three different wearable sensors were evaluated for their association with dry mater intake (DMI). The sensors measured activity (sensors = 3), rumination (sensors = 1), ear temperature (sensors = 1), rumen pH (sensors = 1) and rumen temperature (sensors = 1). A range of 56–340 cows with assorted sensors from 24 to 313 days in milk (DIM) were modeled to evaluate associations with DIM, parity, and contemporary group (CG; comprised of pen and study cohort). Models extending upon these variables included known energy sinks (i.e., milk production, milk fat/protein and metabolic body weight), to characterize the association of sensors measures and DMI. Statistically significant (i.e., P < 0.05) regression coefficients for individual sensor measures with DMI ranged from 9.01E-07 to −3.45 kg DMI/day. When integrating all measures from a single sensor in a model, estimated regression coefficients ranged 8.83E-07 to −3.48 kg DMI/day. Significant associations were also identified for milk production traits, parity, DIM and CG. Associations tended to be highest for timepoints around the time of feeding and when multiple measurements within a sensor were integrated in a single model. The findings of this study indicate sensor measures are associated with feed intake and other energy sink traits and variables impacting feed efficiency. This information would be helpful to improve feed and feeding efficiency on commercial farms as proxy measurements for feed intake.
Feed expenses are the largest production cost on dairy farms (USDA–ERS, 2017), making feed consumption and efficiency economically important traits in the dairy industry. Moreover, feed efficiency has a substantial impact on the sustainability of the dairy industry (von Keyserlingk et al., 2013; Food Agriculture Organization of the United Nations (FAO), 2018). Feed efficiency has been meausred in many ways, with some of the most prominent measures including gross feed efficiency (GFE) and residual feed intake (RFI). The GFE measurement is the ratio of energy output to input, while RFI is the difference between actual and predicted feed intake. The RFI calculation has often been prefered over GFE, due to the fact it is theoretically uncorrelated with other important traits due to the nature of its calculation (Kennedy et al., 1993). In order to determine GFE and RFI, individual animal feed intake needs to be collected. Prediction of feed efficiency for genetic selection requires large scale collection of individual animal feed intake data or correlated trait data (e.g. body weight) collection to improve selection accuracy. Currently, collecting individual animal feed intake is prohibitive on commercial farms because of the cost of specialized equipment and additional labor. Given these complications, it would be beneficial to establish low cost, portable proxies for individual animal feed intake to develop prediction equations for feed consumption and efficiency.
Current prediction equations for feed efficiency estimate only a portion of variability in the true feed efficiency of an animal. Simple regression equations have been established that utilize body weight (BW), days in milk (DIM) and milk production traits (i.e., milk yield, fat, and protein) as predictors of dry matter intake (DMI) for commercial animals (Tempelman et al., 2015; Hardie et al., 2017; Dórea et al., 2018). However, if an animal mobilizes body energy reserves to meet production demands rather than increasing DMI, these models will result in poor prediction of DMI (Dórea et al., 2018). Additionally, a multitude of health and reproductive problems may occur due to rapid negative energy balance (Roche et al., 2009; Remppis et al., 2011; Contreras, 2019). Current prediction models are based on mid-lactation data; whereas metabolic energy demands differ substantially across DIM (Spurlock et al., 2012; Koltes, 2013). The ability to monitor and record behavioral measurements such as activity, rumination and body temperature with sensors may provide additional information about individual animal's health and metabolic status beyond what is captured in current models.
Limited research has been conducted to evaluate the relationship between wearable sensor data and feed intake, with varying results across technologies. Lam et al. (2017) reported that more efficient cows spent a larger proportion of the day in lower ruminal pH ranges determined by a rumen bolus. Rumen temperature corrected for drinking events varied less in more efficient lactating Holsteins (Fischer et al., 2018), but no difference in rumen temperature was found in beef steers (Lam et al., 2017). Different production systems also appear to impact associations with feed intake. Lawrence et al. (2012) reported activity did not differ between more and less feed efficient Simmental X Holstein–Friesian animals when they were housed indoors, but the same group of animals differed in lying time when on pasture. Even within the same type of measurement (i.e., activity), results have been variable. Hafla et al. (2013) reported that high and low RFI animals did not differ in activity measured via a pedometer; however, Connor et al. (2013) reported a positive correlation between pedometer activity and RFI. Recently, Martin et al. (2021) predicted DMI with models including activity and rumination data, which outperformed models including only traits related to lactation and body size in mid-lactation cows. Additionally, Olijhoek et al. (2020) reported that activity accounted for approximately 7 percent of DMI. Many questions remain regarding the use of different wearable sensor as proxies for variation in feed intake.
The objectives of this study were (1) to characterize the association of wearable sensors with production traits and lactation characteristics (i.e., DIM, parity, etc.); and (2) to determine if automated, wearable sensor measures were associated with feed intake in lactating Holstein cattle.
This study was approved by the Iowa State University (ISU) Institutional Animal Care and Use Committee (IACUC) under protocol 18–174. A total of 465 Holstein cows, ranging in parity from first to sixth and days in milk (DIM) from 24 to 278 days at the start of data collection, were selected for use. Animals were housed in a free stall barn and received the standard total mixed ration (TMR) fed at the ISU dairy farm. TMR fed consisted of corn silage, alfalfa hay, whole cottonseed, molasses, ground corn, soybean meal and hulls, dried distiller grains, and a mineral and protein mix. Animals were milked three times a day in CG one through three and two times a day in all others. The change in the number of milkings per day was due to management decisions on farm to better reflect industry standards. Animal health was monitored and attended to by ISU veterinary personnel.
The Calan Broadbent Feeding System (American Calan®, Northwood, NH) was utilized to measure individual feed intake on each cow. Data were collected in 10 CG, with data for each CG occurring within one season (i.e., Summer or Fall depending on the CG). Each CG included a one to three day Calan gate training period prior to the start of data collection, based on the animal's previous Calan gate experience. Contemporary groups (CG) encompassed pen and study cohort, and consisted of 12 to 48 cows (based on pen size) on trial for a total of 40 to 74 days. Cows were fed a weighed amount in the morning in cohort one, and morning and afternoon in all other cohorts, with prior feeding refusals removed just before a feeding. Feed weights for individual cows were regularly adjusted to prevent underfeeding, with a goal of 5 to 10% refusals to maximize intake. Feed delivery amount and refusals were weighed and recorded in order to determine daily feed intake for each animal. Feed samples were analyzed weekly for dry matter and monthly composite samples were evaluated for nutrient content (Dairyland Laboratories, Inc., Arcadia, WI). Nutrients measured included: crude protein, acid detergent fiber (ADF), neutral detergent fiber (NDF), lignin, starch, fat, and ash. These monthly samples were analyzed to ensure consistency in nutrient content throughout the study. Information obtained from these analyses were used to determine animals' dry matter intake for subsequent statistical analyses.
Milk weights were recorded daily for each milking (BouMatic LLC., Madison, WI). Milk samples were taken weekly from each milking within a single day for component analysis (Dairy Lab Services, Dubuque, IA; AgSource, Menomenie, WI). Components reported included percent of fat, protein, and lactose. Components from all milkings in a day were averaged in order to obtain the daily average fat, protein and lactose percentage. These percentages were used in combination with daily milk yields from the week samples were taken to determine daily kilograms of fat, protein, and lactose. All animals were weighed on a weekly or bi-weekly basis, and their body condition was scored utilizing the rubric from Elanco Animal Health five-point scale at the same time (Elanco Animal Health, 1997).
Summary statistics, including mean, standard deviation, minimum, first and third quartile, and maximum values, were evaluated for data recorded during the study. These include milk yield (kg/d), fat, protein and lactose yields from sampling days (kg/d), body weight (BW, kg), body condition score (BCS), DMI (kg/d) and residual feed intake (RFI). RFI was calculated using the model described in Hardie et al. (2017). Briefly, the model included the fixed effects of parity (primiparous or multiparous), energy corrected milk (sum of energy in fat, protein, and lactose in milk), change in body weight and metabolic BW (MBW = BW0.75) as energy sinks. The DIM was fit as a fifth order Legendre polynomial (Hardie et al., 2017).
A summary of all sensor measurement intervals and measurements within a sensor are provided in Table 1. Sensor types analyzed included two ear tag and one rumen bolus technologies. The first ear tag (CowSense from Quantified Ag® CS) utilized an accelerometer to measure activity and an infrared beam directed down the ear canal to measure inner-ear temperature (°C). The CS tags reported activity data hourly and temperature at 20-min intervals, and data was received as raw values. The second ear tag (Allflex Heatime® Pro+; SCR) used an accelerometer to record activity and rumination, and data were reported every 2 h. Lastly, the rumen bolus (SmaXtec Premium Bolus; RB) recorded activity via an accelerometer, temperature (°C), and pH every 10 mins. Each rumen bolus was calibrated per the manufacturer's instruction prior to being applied to a cow. Data from both CS and RB were preprocessed by the companies. Rectal temperatures were taken once monthly in contemporary groups one to three to compare with sensor measurements of temperature.
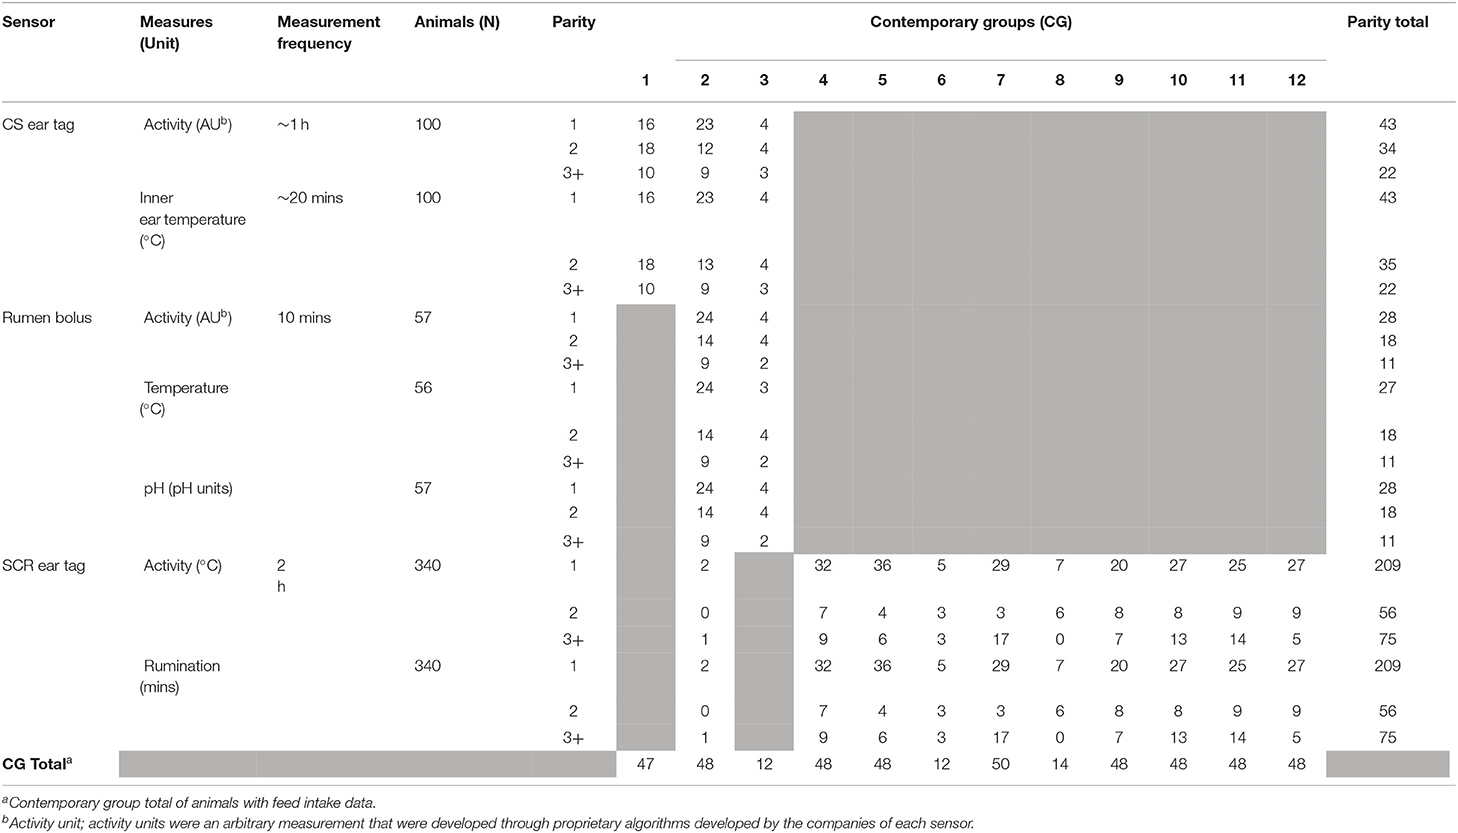
Table 1. Summary of sensor information after data filtering.
Daily average and daily total sensor measures were examined in order to identify and remove inaccurate readings from sensors suspected of failing to record accurate measurements. Edits to remove unreliable data were conducted based on the following rules. First, for all sensor measures, data were checked to ensure there were no missing observations within a day (i.e., a datapoint was recorded for each interval of measurement). Then, all reported readings of zero were removed, as daily average sensor measures of zero are biologically unrealistic. Next, a working range of each sensor measure was determined for each cohort, based on the mean and standard deviation of animals deemed healthy via veterinary records. Sensor failure was defined as an animal with a daily average sensor reading outside ± three standard deviations from the mean of the healthy cohort, including missing values, for more than five consecutive days. If such case occurred, data collected during the period of sensor failure was removed, starting three days prior to the determined onset of the sensor failure period. By doing so, measures from sensors that drifted (i.e., declined in measurement values over time) prior to failure were also removed. This was done to remove sensors that were potentially inaccurate near the failure period. If an animal had less than ten days of data for a sensor measure after data cleaning, all of the animal's data was omitted from statistical analyses to prevent inclusion of faulty data and limited information per cow.
Sensor-type specific edits were required for SCR ear tag data. The data cleaning procedures described above were applied; however, a complete concordance was found between measurements outside of three standard deviations and health events. Based on this observation, data filtering for SCR was altered so that only sensors with daily average measurements of zero or exhibited no variation in measurement (i.e., that were believed to have failed) were removed.
Daily averages of CowSense activity (CSACT) and temperature (CSTEMP), rumen bolus activity (RBACT), rumen pH (RBPH) and temperature (RBTEMP), and SCR activity (SCRACT) and rumination (SCRRUM) were calculated in RStudio (Rstudio Inc., Boston, MA) in order to determine their association with daily DMI values. Additionally, daily total activity for all sensors and daily total rumination were calculated by summing all measures recorded in a single day. Average sensor measurements were calculated as the average measurement for the interval a sensor reported data (e.g., if a sensor reported a measurement every 2 h, an average sensor measurement in this study would report the 2-h average for a day). All models discussed were fit using PROC GLIMMIX in SAS 9.4 (SAS Inst. Inc., Cary, NC).
To analyze the similarity of measures from different sensors (e.g., CSTEMP vs RBTEMP), Pearson and Spearman correlations of measures were calculated. For the temperature measurements, correlation with rectal temperature was also evaluated. Additionally, covariances of sensor measures with production and other energy sink traits were determined.
In order to determine if sensor measures were impacted by contemporary group or parity, the following model was utilized.
Within equation [1], SMi is one of the sensor measures; μ is the overall mean; Xi is either parity (1, 2, 3+), DIM or contemporary group (10); and εi is the random residual associated with the response variable. This model was applied 11 times for each x-value; one for each of the sensor measures (average and total daily sensor measures). The least squares means of sensor measures partitioned by parity and contemporary groups were also analyzed.
Sensor measures were adjusted for systematic effects of CG, parity, and days in milk (DIM) to make sensor values more fairly comparable for animal level variation without the impact of these known systematic effects. For each sensor measure, the following model was fit in order to determine the adjusted sensor measure (ASM).
Within equation [2], SMijk, is the daily average sensor measure; μ is the overall mean; CGi and Parj are the class effects of the ith contemporary group and jth parity and DIMk is the fixed effect of days in milk. The residual of the model, εijk, was considered to be the ASM.
Since feed intake is influenced by energy sink traits, the associations between sensor measures and milk yield, fat and protein yield, MBW and BCS were evaluated with model [3]. The adjusted sensor measures were utilized as the independent variable in model [3];
where Yi is either milk yield (kg), fat yield (kg), protein yield (kg), MBW or BCS; μ is the overall mean; ASMi is one of the adjusted sensor measures (i.e. for daily total or average activity, pH, rumination, or temperature for each appropriate sensor); and εi is the random residual associated with the response variable. A total of eleven models were fit for each response variable, one for each sensor measure evaluated.
In order to determine the association between the 11 traits measured by the sensors and DMI the following model was fit.
where DMIijkl is the response variable; μ is the overall mean; MYij, Fatij, Protij, Lacij, MBWij, BCSij, DIMij and ASMij are the fixed effects of the ith cow's milk, fat, protein and lactose yield, metabolic body weight, days in milk and adjusted sensor measure(s) from the jth day, respectively; Park and CGl are the class effects of the kth parity (1, 2, 3+) and lth contemporary group; and εijkl is the random residual associated with DMIijk. This model was evaluated seventeen times, with one model for each individual sensor measurement (11) and one for each wearable sensor type, including all measurements within sensor (6). Individual sensor measures were comprised of seven averages of measurements collected at specific time intervals and four summed daily totals (see Table 1). Models including all measures within a single wearable sensor type were fit twice for each sensor type (one with average value(s) and one with total).
To evaluate if sensor measures closer to feeding time were more important (i.e., more highly associated) with feed intake, sensor measures before, during and after feeding were analyzed. Feeding times were recorded for five of the eight contemporary groups with SCR measurements and only data from animals that were healthy for the entirety of the trial were utilized in this analysis (n = 139 healthy animals with SCR data). The SCR activity and rumination measurements reported from four time periods, including the 2-h period prior to feeding, the 2-h period including feeding time and the two, 2-h periods following feeding were associated with DMI using the following model.
Within equation [5], DMIijkl is the response variable; μ is the overall mean; ASM_Priori, ASM_Fedi, ASM_Post1i and ASM_Priori are the fixed effects of the ith cow's adjusted sensor measure (SCRRUM, SCRACT or both) from one of the 4 two-hour time periods (prior to feeding, during feeding, first post-feeding period and the second post-feeding period) on the jth day; Park (1, 2 or 3+) and CGl are the class effects of the kth parity (1, 2, 3+) and lth contemporary group; and εijk is the random residual associated with DMIijk. Moreover, the impact of the inclusion of energy sinks (i.e., milk weight, fat, protein, and lactose (kg), MBW (kg), BCS and DIM) in the model on sensor effect estimates was evaluated. These models were assessed separately for the AM and PM feedings, as there were differences in daily management practices (e.g., milking times) surround the two daily feedings. Lastly, the model was assessed including only a single period, rather than all four concurrently.
Supplementary Table 1 provides a summary of the descriptive statistics for the feed intake and lactation traits. Additionally, summary statistics for unadjusted and adjusted sensor measures can be found in Supplementary Tables 2, 3, respectively. These summary statistics are provided in order to show the variation within traits for the study population. The distribution of parity and initial DIM can be found in Supplementary Figures 1, 2. For a summary of sensor measurements recorded, including frequency of measurements, number of animals with records after data cleaning and contemporary groups for which sensor data is available, see Table 1. A summary of all of the statistically significant sensor associations is provide in Figure 1.
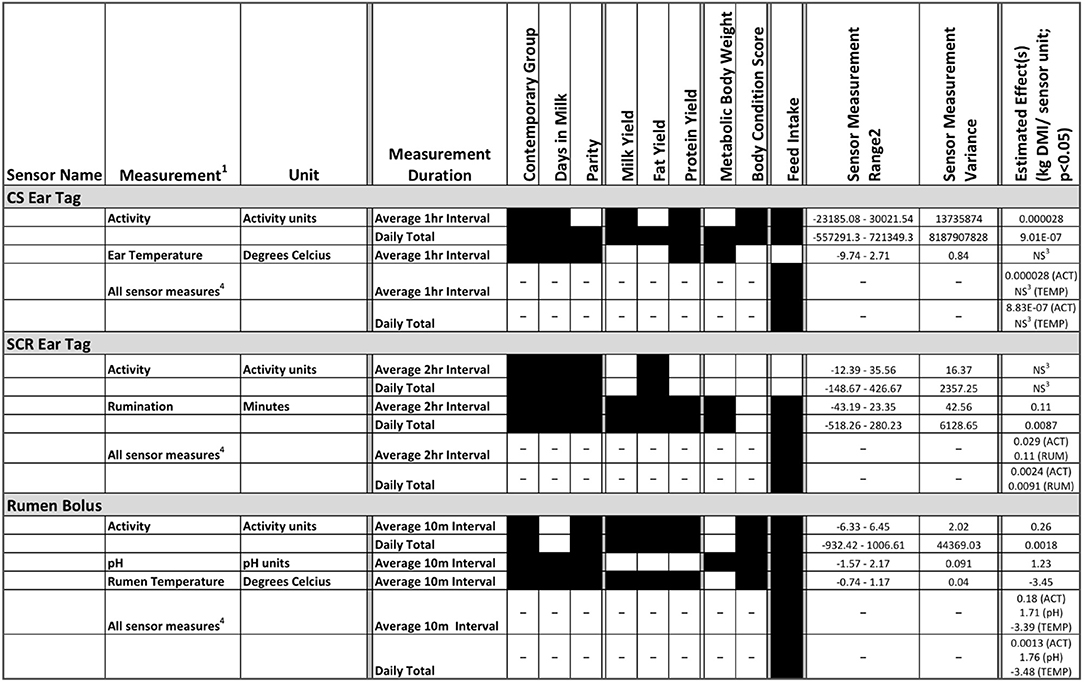
Figure 1. A graphical summary of all statistically significant sensor measure associations with management and physiological factors (contemporary group, days in milk, parity), production traits (milk, fat and protein yield), body weight and body condition score (BCS) and feed intake (dry mater intake; DMI) traits. Three wearable sensor types including: CowSense (CS) ear tag, SCR ear tag, and rumen bolus, were used to collect 2, 2, and 3 individual measurements, respectively. Black filled boxes indicate significant associations (p < 0.05) with the trait listed in the column for an individual sensor measurement type at one of two measurement intervals. The two measurement intervals per individual sensor measurement are: 1) the average for a sensor's predefined measurement interval across an entire day, and 2) the daily total sum across all measurement intervals. For each wearable sensor, all individual measurements within that wearable sensor were also combined into a single model to determine the statistical association with feed efficiency traits (labeled as all sensor measures). 1The number of records per sensor measurement are found in Table 1. 2Range of sensor measurements adjusted for parity, contemporary group, and days in milk. 3NS = Not significant (P > 0.05). 4Associations with traits other than feed intake not applicable for the all sensor measures models.
Pearson and Spearman correlations for total daily activity measures are presented in Supplementary Table 4 and daily average temperature measures from CS and RB are provided in Supplementary Table 5. Pearson correlations ranged from 0.15 to 0.69 for activity measures, with the highest correlation between the two ear tag activity measures. Spearman correlations were slightly lower for all activity correlations but followed the same pattern as the Pearson correlations. Temperature correlations ranged from 0.23 to 0.40 (Pearson) and 0.21 to 0.37 (Spearman). The highest Pearson correlation was between rumen bolus and rectal temperature, whereas the highest Spearman correlation was between CS and rumen bolus.
Covariances of unadjusted and adjusted sensor measures with energy sink variables (i.e., milk production, milk components, MBW and BCS) can be found in Supplementary Tables 6, 7, respectively. Covariances were generally larger in magnitude when analyzing unadjusted measures. However, the covariance of CSACT (average or total) and DMI was larger for the adjusted measures. A number of covariances switched signs when comparing the covariances of traits with unadjusted or adjusted sensor measures.
Least squares mean estimates of sensor measures by parity are presented in Supplementary Table 8 and by contemporary group in Supplementary Table 9. Bar plots of least squares means estimates by sensor measure can be found in Supplementary Figures 3, 4. Significant differences (P < 0.0001) were observed between at least one pair of parities and contemporary groups for all sensor measures except average CSACT. Of note, activity was higher in first parity than later parities in all cases except for the rumen bolus, where activity was lowest in first and highest in third parity. Supplementary Table 10 provides the differences in sensor measure by DIM. With the exception of rumen bolus activity, sensor measures differed across DIM (P < 0.0005).
Seven adjusted sensor measures were significantly associated (P < 0.05) with milk yield (Table 2). The magnitude of effect was largest for average RBTEMP (−3.57 ± 0.50 kg/°C) and smallest for total CSACT (5.25E-06 ± 0.00 kg/unit). Significant associations were identified between all adjusted sensor measures and fat yield, except for CSACT and CSTEMP, and average rumen bolus pH (Table 3). Estimated effects for fat yield ranged from −0.14 ± 0.021 kg/°C (average RBTEMP) to 0.0051 ± 0.00071 kg/unit (average SCRRUM). All sensor measures except average RBPH and average SCRACT were associated with milk protein yield (Table 3). Estimated effects for protein yield ranged from −0.13 ± 0.014 kg/°C (average RBTEMP) to 0.031 ± 0.0029 kg/unit (RBACT).
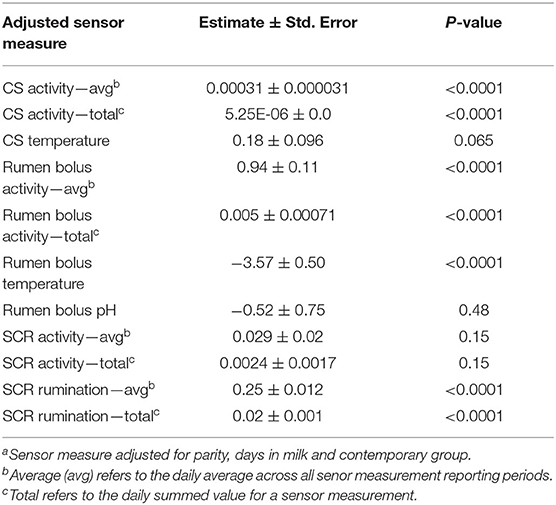
Table 2. The association of sensor measuresa with milk yield (kg).
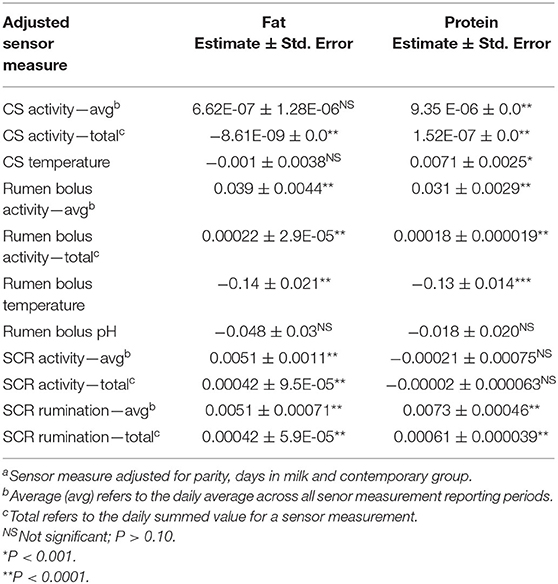
Table 3. The association of sensor measuresa with milk composition traits (kg).
The total CSACT and CSTEMP, RBPH, average and total SCRRUM were significantly associated with MBW (P < 0.005; Table 4). The absolute value of the estimated effect was smallest for total CSACT 5.23E-07 ± 0.000035 kg MBW/unit) and largest for RBPH (−6.53 ± 0.70 kg MBW/pH unit). For BCS, average and total CSACT, and all rumen bolus measures were significantly associated (P < 0.0005) (Table 4). Estimates ranged from −0.16 ± 0.027 unit BCS/ pH unit (RBPH) to 0.072 ± 0.02 unit BCS/°C (RBTEMP).
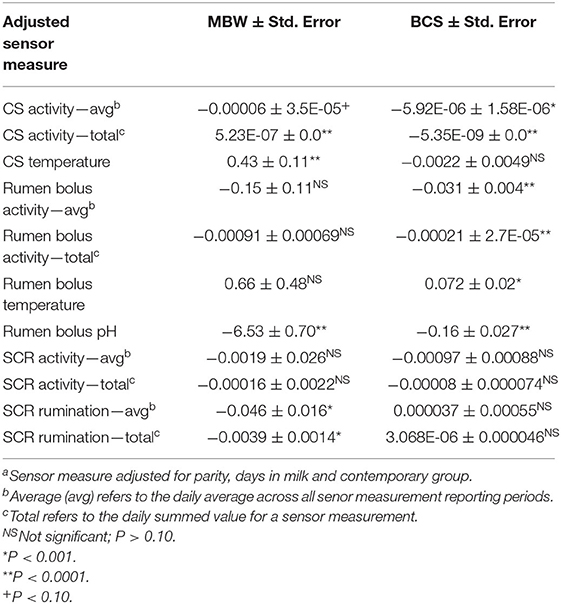
Table 4. The association of sensor measuresa with metabolic body weight (MBW = BW0.75) and body condition score (BCS).
Estimates of regression coefficients and the significance of each individual, single measurement type within a senor with feed intake are presented in Table 5.
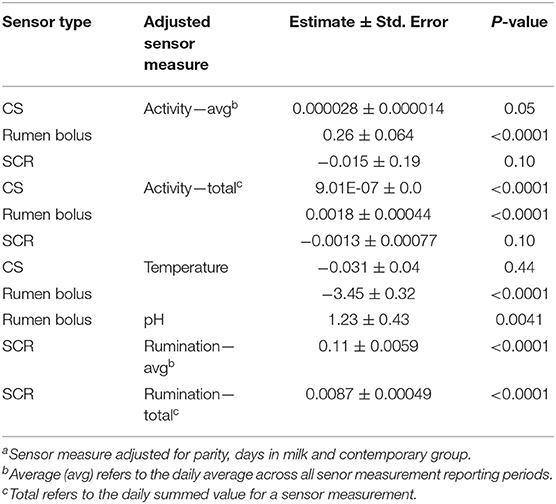
Table 5. Association of sensor measurementsa with dry mater intake from models including only one type of measurement from each sensor.
The average and total measures of CSACT and RBACT were each significantly associated with DMI (P < 0.05). Estimates for average measures ranged from −0.000028 ± 0.000014 (CS) to 0.26 ± 0.064 kg DMI/unit of activity (rumen bolus) for the average measures. Estimates for the total activity were smaller for both sensor types. The SCRACT was not associated with DMI whether it was analyzed as the daily average or total (P > 0.05).
The CSTEMP was not significantly associated with DMI (P > 0.40); however, RBTEMP had a strong association (P < 0.0001). The estimate of this effect on DMI was −3.45 ± 0.32 kg DMI/°C.
A significant association (P < 0.005) between RBPB and DMI was found. The effect estimate for RBPH was 1.23 ± 0.43 kg DMI/ pH unit.
The SCRRUM and feed intake were significantly associated (P < 0.0001) when analyzed as a daily average and total. The estimated effect of average SCRRUM was 0.11 ± 0.0059 kg DMI/min of rumination and 0.0087 ± 0.00049 kg DMI/min of rumination for the daily total.
Results for the association of sensor measures with feed intake when all measurements within a sensor (i.e., multiple measures from the same sensor) are included in a model are presented in Table 6. For the CS ear tag, inclusion of all sensor measurements (CSACT + CSTEMP) within a model, resulted in a significant association between activity and DMI (average or total, P < 0.05). As in the single sensor model, the estimated effect of total CSACT was smaller than for the average CSACT. The CSTEMP was not significant when including average or total CSACT (P > 0.35). Simultaneous inclusion of all three rumen bolus measures (RBACT + RBTEMP + RBPH) resulted in all sensor measures being significantly associated with DMI (P < 0.005). Effect estimates were 0.18 ± 0.062 kg DMI/unit of activity, −3.39 ± 0.33 kg DMI/°C and 1.71 ± 0.44 kg DMI/pH unit when including RBACT, RBTEMP and RBPH, respectively. When total RBACT was modeled, effect estimates were 0.0013 ± 0.00044 kg DMI/unit of activity, −3.48 ± 0.32 kg DMI/°C and 1.76 ± 0.43 kg DMI/ pH unit. Similarly, all SCR measures (SCRACT + SCRRUM) were significant (P < 0.005) when included in the same model regardless of utilizing averages or totals for each measurement. As observed with other sensors, estimated effects were smaller when measures were analyzed as the daily total.
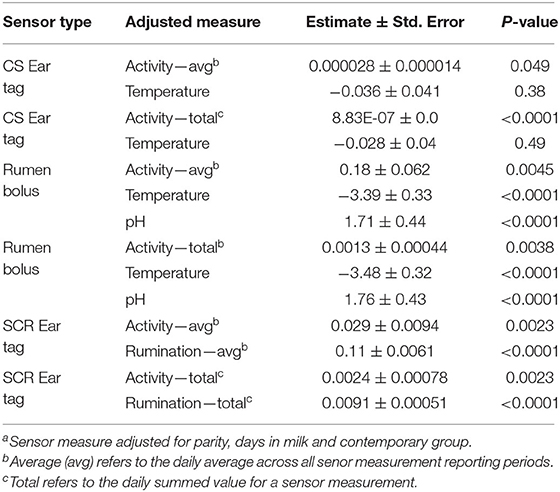
Table 6. Association of sensor measurementsa with dry mater intake from models integrating all types of measurements available for a single sensor type.
Estimated regression coefficients of SCR sensor measures with daily DMI varied across the time periods before, during and after feeding time (Figure 2). Larger effect estimates were typically observed when energy sink variables were not included in models (results including energy sink variables not shown). When sensor measures were included individually, SCRACT was significant in all periods (A.M. and P.M.) around feeding except in the A.M. Post1 (i.e., the period immediately following feeding); P > 0.15). The regression coefficient for SCRACT varied from −0.05 ± 0.008 kg DMI/unit for the period prior to the A.M. feeding (P < 0.0001) to 0.033 ± 0.01 kg DMI/unit for P.M. Post1 (i.e., the period directly after the P.M. feeding; P < 0.0001). The SCRRUM measure was significant for the A.M. Prior, Post1 and Post2 periods, and the P.M. Prior and Fed periods. The effect was smallest in the A.M. Prior period (i.e., period before feeding; 0.0081 ± 0.0019 kg DMI/unit; P < 0.005) and largest for the period during the P.M. feeding (0.019 ± 0.0029 kg DMI/unit; P < 0.0001).
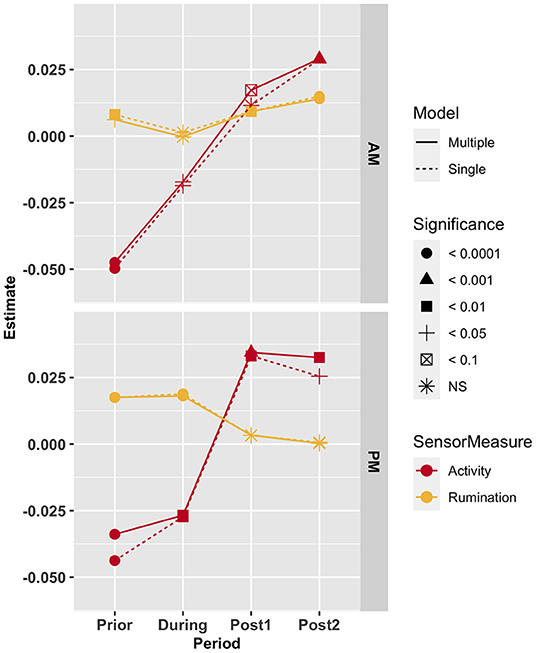
Figure 2. Estimated effects of adjusted activity (red) and rumination (yellow) in the period prior to feeding (Prior), the period during which feeding occurs (During) and the two consecutive periods following feeding (Post1 and Post2). Line type denotes whether single sensor measures (activity or rumination) or both sensor measures (activity and rumination) were included in the model. The shape of the points indicates the significance level of the estimate.
Associations at the time periods around feeding were also assessed for single sensor measurements, either 1) individually in a model (results not shown); or 2) integrated with all other periods simultaneously in a model. Significance and sign of regression coefficient estimates were the same regardless of modeling method, except for SCRACT from the A.M. Post1 and Post2 periods (i.e., 0–2 and 2–4 h after feeding period). When modeled individually, SCRACT in the Post1 period tended toward significance (P < 0.10) and was not significant (P > 0.10) in the Post2 period. However, when molded simultaneously with all four periods, SCRACT in Post1 was not significant (P > 0.20) and was significant in Post2 (P < 0.0001).
With the inclusion of both SCRACT and SCRRUM concurrently, all measurements from the A.M. periods, excluding SCRRUM during feeding (P > 0.90), were significant. For A.M. adjusted sensor measure models, the largest magnitude of effect was estimated for SCRACT in the period prior to feeding (−0.47 ± 0.0081 kg DMI/unit; P < 0.0001) and smallest for SCRRUM in the time period prior to feeding (0.0062 ± 0.0027 kg DMI/unit; P < 0.005). In the model including P.M. measures, with the exception of SCRRUM in both Post periods (P > 0.25), all sensor measures were significant (P <0.05). The SCRACT in Post 1 (i.e., the period after feeding) had the largest effect estimate (0.034 ± 0.01 kg DMI/unit; P < 0.001), whereas the smallest was for SCRRUM in the period during feeding (0.018 ± 0.0029 kg DMI/unit; P < 0.0001).
Significant associations were identified between multiple traits and variables impacting feed efficiency and automated sensor measurements (Figure 1). All sensor measures were significantly different between at least two parities and CG comparisons, and the majority had significant differences over DIM. This indicates that it is likely important to account for parity, CG and DIM differences anytime sensor data is analyzed. Additionally, significant associations were identified between sensor measures and production traits. With the exception of CSTEMP, all sensor measures were found to be associated with DMI; however, the association depended on whether other sensor measures were included within the same model.
The degree of data processing, and adjustment of sensor data for covariates impacts the strength of association with various traits. Thus, the information a sensor was designed to detect likely impacts the trait associations that can be identified. Importantly, some sensor measures (SCR and RB measures) used in this study were preprocessed by the manufacturer, while other measures (CS) represented raw data. The rumen bolus and SCR measures are preprocessed by proprietary algorithms. Therefore, the data from these technologies may have been optimized for the detection of specific events and, as such, adjusted for a variety of parameters that created noise in detecting these events. Possible optimization or adjustment could be for estrus detection, heat stress, or environmental or cow-specific factors. For example, activity data for the rumen bolus utilized in this study was processed in an attempt to factor out rumen motility, so that activity reflected cow movements rather than rumen movements. In addition to data preprocessing, some sensors utilize activity data from the accelerometer to classify a specific behavior. This is the case with the SCR ear tags, where accelerometer data is used to determine rumination time. Consideration should be given to how this may impact the independence of activity and rumination, and how best to model these data.
All sensor measures differed across CGs, parity and DIM. Differences in sensor measures across CG may relate to differences in weather and/or season, management practices (e.g., number of milkings per day), ration changes impacting dry mater or nutrient content, or other subtle management changes related to differences in personnel.
For both ear tag technologies, total activity of parity one cows was highest and parity two the lowest (Supplementary Figure 3). Conversely, total activity recorded by the rumen bolus was lowest in parity one and highest in parity 3+ (Supplementary Figure 3). Differences in activity across parities is supported by findings of previous studies. For example, Neave et al. (2017) found that lying times differed slightly between parities in the transition period. Additionally, Solano et al. (2016) found that lying behavior differed between primiparous and multiparous cows and DIM. Differences in activity across parity and DIM is logical due to changing energy demands, amounts of feed consumed, changes in physiology and aging of animals.
Few studies have identified differences in temperature, pH and rumination for parity, DIM or CG. Analyses in this study found that RBTEMP did not differ between parity one and two but was slightly lower in parity 3+ (Supplementary Figure 3). Rectal temperatures have previously been found to vary between parities and across DIM (Bewely et al., 2008; Wenz et al., 2011) and reticular temperature was significantly impacted by DIM (Bewely et al., 2008). The RBPH was not different between parity one and 3+ but was higher in parity two animals (Supplementary Figure 3). This may be due to a lack of animals in the parity 3+ category (N = 11), compared to the parity 1(N = 28) and 2 (N = 18) categories. Lastly, SCRRUM was highest in parity two animals and lowest in parity one (Supplementary Figure 3).
Activity from CS and RB were significantly and positively associated with milk yield. Jaeger et al. (2019) observed a similar relationship where dual-purpose cows with reduced activity had lower milk production. Jaeger et al. (2019) also identified a positive relationship between rumination and milk weight, corroborating the results of this study. The relationship between rumen temperature and milk yield has not been investigated previously. Interestingly, the findings of this study indicate a substantial, negative association between rumen bolus temperature and milk weight. This observation may be related to energy lost as heat of fermentation, in turn limiting the amount of energy toward milk production. Since rumen fermentation is associated with rumen temperature, one might speculate that the rumen microbiome may influence the observed rumen temperature (Johnson et al., 1963; Russell, 1986; Huus and Ley, 2021). Dikmen et al. (2012) did find significant phenotypic correlations of rectal temperature with 305-day milk fat and protein yield, but directionality of the estimates was opposite of those found in the present study for rumen bolus temperature. However, it is important to note that the sensor temperatures were measured at different locations and would be expected to differ from rectal temperature, despite a positive correlation. This likely indicates different physiological influences on the temperature observed at the ear, rumen, and rectum.
Limited information is available regarding the association of sensor measures with MBW and BCS. Jaeger et al. (2019) found that cows spending a smaller proportion of their day in high-activity states had increased BCS, and cows that were more active had lower BCS. This is consistent with the findings of this study, as significant and negative associations were found for CSACT and RBACT (average and total) with BCS. Body and skin temperatures of cows could be affected by body fat content of cows, potentially related to heat dissipation (Young, 1975). Lastly, the estimated association effect for RBPH indicates a negative relationship of rumen pH with MBW and BCS. This relationship may be driven by feeding behavior. For example, an animal with more frequent eating bouts or increased feed intake during eating bouts would have a lower average pH.
Regardless of whether sensor measures were included individually in a model or simultaneously with other sensor measures, the largest and smallest regression coefficients for the same sensor measures (i.e., CSACT had the smallest regression coefficient in both cases and RBTEMP the largest). Importantly, SCRACT (as either an average or total) is only significant when simultaneously accounting for SCRRUM. This could be due to the use of accelerometer data in predicting rumination and thus there is a direct connection between activity and the presented rumination measurement.
The following passages describe the relationships between single sensor measurements of activity, temperature, rumen pH and temperature with DMI.
Directionality of all activity association effects (average and total) indicate that animals with lower activity consume less feed, after accounting for differences in milk production traits and body weight. This finding is consistent with reports in the literature, which observe association effects of the same sign (Lawrence et al., 2012; Connor et al., 2013).
The estimated associations of both CS and RB temperature with DMI were negative. Due to the shunting of blood to the gut for digestion, a negative relationship between ear temperature and DMI may be reasonable. However, because rumen temperature increases with the fermentation of feedstuffs, the observed relationship between RBTEMP and DMI is surprising. The negative association may be driven by feeding behavior, such as frequency or size of meals. Consuming feed less frequently may cause less time spent at higher temperatures, or if an animal eats less feed the change in temperature may not be as drastic. Additional consideration should be given to the potential impact of water consumption since increased drinking bouts and volume of water consumed by an animal may reduce the daily average RBTEMP of a cow.
There have not been previous studies conducted to evaluate the relationship of rumen pH overtime with feed intake and efficiency in dairy cattle. Previous studies in feedlot cattle have had varying results regarding the relationship of rumen pH and feed efficiency. Fitzsimons et al. (2014) found that animals with lower RFI (i.e., more efficient animals) had higher pH, but Lam et al. (2017) found lower RFI animals spent more time in optimal and acidotic pH ranges. Moreover, McDonnell et al. (2016) did not identify a difference in pH between low and high efficiency animals. In this study, higher average RBPH was associated with increased feed intake, regardless of whether other rumen bolus measures were included in the model as well. This relationship could be caused by differences in feeding behaviors, like that seen with RBTEMP (i.e., less frequent meals could lead to fewer drops in pH) or differences in the buffering capacity of individual cows.
A positive relationship was found between SCRRUM and DMI, which is consistent with previous research (Clément et al., 2014). Due to the relationship between feed consumption and rumination, a positive estimate makes sense biologically. Despite the logical connection between rumination and intake, Byskov et al. (2017) concluded that there was no clear relationship between the two. This could in part be due to a larger number of records in the current study or a difference in the method of determining rumination (i.e., collar and microphone-based vs. ear tag and accelerometer-based).
Associations between sensor measurements and DMI were generally larger and more significant when averages for measurement intervals were modeled compared to daily total summed sensor measurements. Recent exploration into the relationship between automated sensor technologies and feed intake has largely utilized total measures (i.e., the sum in a period of time), either for an hour, a day or larger windows of time (Olijhoek et al., 2020; Martin et al., 2021). Much like total daily steps for a day are measured for humans, total activity measures may be indicative of energy expenditure of cows (Neilson et al., 2018). However, results from the current study indicate larger estimated effect sizes for DMI associations of average activity and rumination for the interval at which they were reported (i.e., average of either 10-min, hourly, or 2-h intervals in a day). Additionally, significance of sensor measure effects did not change between total and average measures. It is possible that specific points in the day influences the interval average, thus leading to larger estimates. Such points could relate to management factors, feeding behavior or the diurnal cycle cows tend to follow.
In order to assess if the times around feeding are important in estimating daily feed intake (i.e., DMI), the effect of the SCRACT and SCRRUM in the period prior to feeding, period in which feeding occurred and the two periods following feeding were assessed. Findings from these analyses indicate that some periods are not significantly associated with daily feed intake and that estimated effects differ in magnitude and sign by period (Figure 2). Inclusion of energy sink variables, including production and body composition traits, generally resulted in lower estimated effect sizes of sensor measures (results not shown). These results were not surprising since the energy sink traits are known to impact feed intake, but they imply that a portion of the variance in DMI explained by sensor measures is likely driven by the relationship of sensor measures and energy sinks. When a single sensor measure type was included at a time, the estimates ranged from −0.05 ± 0.008 kg DMI/unit (P < 0.0001; SCRACT prior to A.M. feeding) to 0.033 ± 0.01 kg DMI/unit (P < 0.005; SCRACT in period immediately following P.M. feeding). Given the range in these variables observed in the dataset (Supplementary Table 3), such estimates would result in a reduction of 4.35 kg DMI/day and an increase of 2.05 kg DMI/day between the animals with lowest and highest SCRACT prior to A.M. feeding and SCRACT in Post1 (i.e., period following P.M. feeding), respectively. Smallest and largest effect values were for the same sensor measures when SCRACT and SCRRUM measures were included simultaneously; however, the estimate for SCRACT prior to A.M. feeding was slightly smaller (−0.047 ± 0.0081 kg DIM/unit; P < 0.0005) and SCRACT in Post1 was somewhat higher (0.034 kg DIM/unit; P < 0.0005). These estimates equate to a reduction of approximately 1250 kg DMI and an increase of nearly 650 kg DMI in a 305-day lactation, assuming the association is consistent across DIM.
Interestingly, the estimated effects of SCRACT associations with DMI were consistently negative prior to and during the feeding period and positive in the two periods following feedings. Directionality of these estimates indicates that the more active prior to feeding an animal is, the less they eat in a day. Oppositely, more activity after feeding results in a higher daily feed intake. This is likely influenced by management practices but could indicate that feeding behaviors relative to the time of day are important in determining daily DMI. Estimated effects for adjusted rumination were positive, regardless of the period. This is logical, as one would expect the more an animal eats, the more they will ruminate.
Interpretation of sensor associations with DMI need to consider the overall variation of the specific sensor measurement and the covariation between sensor and phenotypic measures. For example, the estimated effect for CSACT on DMI appears small; however, this measurement exhibits the highest variation. Moreover, the expected difference in DMI between the highest and lowest average CSACT was 1.77 kg DMI/unit of activity per day (modeled independently or integrated with all CS measures; Tables 5, 6). Over the course of a 305-day lactation, this would equate to a difference in 540 kg of feed consumed (DMI) between these two animals, assuming the association does not change across different stages of lactation.
The size of the estimated association effect of RBTEMP makes it a particularly interesting potential indicator of feed intake. Limited variation was identified for RBTEMP; however, the range in rumen temperature was sufficient to observe variability in DMI. If the association between RBTEMP and DMI was consistent across lactation, the difference in the highest and lowest recorded adjusted RBTEMP would equate to nearly 4000 kg of DMI in a 305-day lactation (i.e., multiplying the range by the regression coefficient of −3.45; Table 5). The interpretation of this estimate indicates animals with higher daily average rumen temperature have decreased DMI, after adjusting for energy sinks. Typically, we would expect that animals who consume more feed would produce more heat through fermentation and therefore have a higher rumen temperature. One explanation for the observed relationship between RBTEMP and DMI could be due to differences in feeding behavior, eating less per meal but more frequently (Fischer et al., 2018). This type of consistent feeding behavior might lead to more consistency in rumen temperature since there is less fluctuation in rumen fill. Due to the potential relationship of RBTEMP and feeding behaviors, RBTEMP may be an indicator of feed efficiency.
Significant associations between adjusted sensor measures (activity, ear and rumen temperature, pH, and rumination) with DMI were observed when simultaneously accounting for production traits and systematic effects (i.e., CG, DIM, parity). This indicates that sensor measures detect variation in feed intake that is not explained by the typical energy sinks included in the calculation of feed efficiency measures (e.g. RFI) or by differences between contemporary groups. Sensor measures were also associated with all production traits and body weight, which are known to impact feed intake and efficiency. The implication of these results is that sensor measures may be beneficial in the estimation of feed intake or efficiency for animals without feed intake phenotypes. Not surprisingly, sensor measures differ by parity, DIM and CG which is important to consider as it may impact the interpretation of results. These differences in systematic effects also indicate an opportunity to use sensor measures to evaluate how physiology (DIM and CG) and management practices (within CG) impact feed intake. The broader implication of this study is that sensor measures have potential to be utilized as proxies for feed intake that may be helpful to improve the accuracy of genetic predictions. It is important to acknowledge a few limitations of this study. Differences in the number of animals, proprietary data preprocessing and data recording time interval across sensor types make it difficult to compare results across technology types.
Analytics used to monitor individual animal feed intake with automated sensor measurements would be useful to manage daily feed utilization, animal health, and genetic selection for feed efficiency on commercial dairies. Daily predictions of feed intake could allow producers to adjust ration quantities more precisely, reducing feed waste and associated expenses. Given the considerable variation observed in sensor measures, they may have application in estimating genetic merit of animals for feed efficiency as indicator traits for variability in feed intake, if heritable, or as monitors of environmental variability to reduce noise in estimates of genetic effects for feed intake. Each of these applications could help to improve overall sustainability of the dairy industry.
Multiple measurements from automated, wearable sensors, including CS and SCR ear tags and a rumen bolus were identified to be significantly associated with feed intake, milk production traits, parity, DIM, and contemporary groups. Associations of feed intake with individual or combined measurements within a sensor were significant with or without inclusion of energy sink traits across a range of DIM (24 to 313 at start of trial). The strongest association with feed intake was observed for RBTEMP (−3.48 ± 0.32 kg DMI/d) when including other RB measures as covariates. Differences in the sign of the association occurred around time of feeding, with stronger associations occurring in the 2 h prior to the A.M. feeding and the 2 h after the P.M. feeding when there were fewer cows moves and less human interactions. Average sensor measures for the time interval the sensor measure was reported appeared more useful than total daily summed measurement based on model significance and effect size estimates. This study indicates algorithms monitoring a portion of the variability in feed intake using sensors has application on commercial farms. Sensor-based measurements could be applied in precision feeding and genetic selection for improved feed efficiency with additional development in the future.
The raw data supporting the conclusions of this article will be made available by the authors, without undue reservation.
This study was approved by the Iowa State University (ISU) Institutional Animal Care and Use Committee (IACUC) under protocol 18-174.
JK was responsible for conception of the study and wrote sections of the manuscript. JK, CS-C, MH, and MM contributed to design of the study. CS-C wrote the initial draft of the manuscript. All authors were responsible for collection of data. All authors contributed to manuscript revision, read, and approved the submitted version of the manuscript.
Funding was provided by the Foundation for Food and Agricultural Research (FFAR) and the Council for Dairy Cattle Breeding (CDCB) under Project #CA18-SS-0000000236 Improving dairy feed efficiency, sustainability, and profitability by impacting farmers' breeding and culling decisions, the Iowa Agriculture and Home Economics Experiment Station, Ames, Iowa (Project No. NRSP-8), the Hatch Act and the State of Iowa. CS-C was also funded in part by a dairy graduate fellowship from Land O' Lakes.
The authors declare that the research was conducted in the absence of any commercial or financial relationships that could be construed as a potential conflict of interest.
All claims expressed in this article are solely those of the authors and do not necessarily represent those of their affiliated organizations, or those of the publisher, the editors and the reviewers. Any product that may be evaluated in this article, or claim that may be made by its manufacturer, is not guaranteed or endorsed by the publisher.
The Supplementary Material for this article can be found online at: https://www.frontiersin.org/articles/10.3389/fanim.2022.841797/full#supplementary-material
Bewely, J. M., Einstein, M. E., Grott, M. W., and Schutz, M. M. (2008). Comparison of reticular and rectal core body temepratures in lactating dairy cows. J. Dairy Sci. 91, 4661–4672. doi: 10.3168/jds.2007-0835
Byskov, M. V., Fogh, A., and Løvendahl, P. (2017). Genetic parameters of rumination time and feed efficiency traits in primiparous Holstein cows under research and commercial conditions. J. Dairy Sci. 100, 9635–9642. doi: 10.3168/jds.2016-12511
Clément, P., Guatteo, R., Delaby, L., Rouillé, B., Chanvallon, A., Philipot, J. M., et al. (2014). Short communication: Added value of rumination time for the prediction of dry matter intake in lactating dairy cows. J. Dairy Sci. 97, 6531–6535. doi: 10.3168/jds.2013-7860
Connor, E. E., Hutchison, J. L., Norman, H. D., Olson, K. M., Van Tassell, C. P., Leith, J. M., et al. (2013). Use of residual feed intake in Holsteins during early lactation shows potential to improve feed efficiency through genetic selection. J. Anim. Sci. 91, 3978–3988. doi: 10.2527/jas.2012-5977
Contreras, A.. (2019). Lipid Mobilization and Inflammation During the Transition Period. Available online at: https://pdfs.semanticscholar.org/5022/613e439c1d10caa2496b9380354ba2c86aef.pdf?ga=2.116803663.892617375.1577671400-1009975094.1577671400. (accessed October 15, 2019).
Dikmen, S., Cole, J. B., Null, D. J., and Hansen, P. J. (2012). Heritability of rectal temperature and genetic correlations with production and reproduction traits in dairy cattle. J. Dairy Sci. 95, 3401–3405. doi: 10.3168/jds.2011-4306
Dórea, J. R. R., Rosa, G. J. M., Weld, K. A., and Armentano, L. E. (2018). Mining data from milk infrared spectroscopy to improve feed intake predictions in lactating dairy cows. J. Dairy Sci. 101, 5878–5889. doi: 10.3168/jds.2017-13997
Elanco Animal Health. (1997). Appendix A: Body Condition Scoring in Dairy Cattle. Available online at: https://www.vet.cornell.edu/sites/default/files/1e_Elanco%20Cow%20Body_condition_scoring_V3.pdf (accessed September 10, 2018).
Fischer, A., Delagarde, R., and Faverdin, P. (2018). Identification of biological traits associated with differences in residual energy intake among lactating Holstein cows. J. Dairy Sci. 101, 4193–4211. doi: 10.3168/jds.2017-12636
Fitzsimons, C., Kenny, D. A., Fahey, A. G., and McGee, M. (2014). Feeding behavior, ruminal fermentation, and performance of pregnant beef cows differing in phenotypic residual feed intake offered grass silage. J. Anim. Sci. 92, 2170–2181. doi: 10.2527/jas.2013-7438
Food Agriculture Organization of the United Nations (FAO) (2018). World Food and Agriculture—Statistical Poscketbook; Food and Agriculture Organization of the United Nations (FAO): Rome, Italy, p.254. Available at https://www.fao.org/3/ca1796en/ca1796en.pdf
Hafla, A. N., Carstens, G. E., Forbes, T. D. A., Tedeschi, L. O., Bailey, J. C., Walter, J. T., et al. (2013). Relationships between postweaning residual feed intake in heifers and forage use, body composition, feeding behavior, physical activity, and heart rate of pregnant beef females. J. Anim. Sci. 91, 5353–5365. doi: 10.2527/jas.2013-6423
Hardie, L. C., VandeHaar, M. J., Tempelman, R. J., Weigel, K. A., Armentano, L. E., Wiggans, G. R., et al. (2017). The genetic and biological basis of feed efficiency in mid-lactation Holstein dairy cows. J. Dairy Sci. 100, 9061–9075. doi: 10.3168/jds.2017-12604
Huus, K. E., and Ley, R. E. (2021). Blowing hot and cold: body temperature and the microbiome. mSystems 6, e00707–e00721. doi: 10.1128/mSystems.00707-21
Jaeger, M., Brügemann, K., Brandt, H., and König, S. (2019). Associations between precision sensor data with productivity, health and welfare indicator traits in native black and white dual-purpose cattle under grazing conditions. Appl. Anim. Behav. Sci. 212, 9–18. doi: 10.1016/j.applanim.2019.01.008
Johnson, H. D., Ragsdale, A. C., Berry, I. L., and Shanklin, M. D. (1963). “Environmental physiology and shelter engineering with special reference to domestic animals,” in LXVI, Temperature-humidity effects including influence on acclimation in feed and water consumption of Holstein cattle: University of Missouri College of Agriculture Research Bulletin 846.
Kennedy, B. w, van der Werf, J. H., and Meuwissen, T. H. (1993). Genetic and statistical properties of residual feed intake. J. Anim. Sci. 71, 3239–3250. doi: 10.2527/1993.71123239x
Koltes, D.. (2013). Novel mechanisms involved with lipid metabolism in adipose tissue of dairy cows. [dissertation]. [Ames (IA)]: Iowa State Univiversity
Lam, S., Munro, J. C., Zhou, M., Guan, L. L., Schenkel, F. S., Steele, M. A., et al. (2017). Associations of rumen parameters with feed efficiency and sampling routine in beef cattle. Animal. 12, 1442–1450. doi: 10.1017/S1751731117002750
Lawrence, P., Kenny, D. A., Earley, B., and McGee, M. (2012). Grazed grass herbage intake and performance of beef heifers with predetermined phenotypic residual feed intake classification. Animal. 6, 1648–1661. doi: 10.1017/S1751731112000559
Martin, M. J., Dórea, J. R. R., Borchers, M. R., Wallace, R. L., Bertics, S. J., DeNise, S. K., et al. (2021). Comparison of methods to predict feed intake and residual feed intake using behavioral and metabolite data in addition to classical performance variables. J. Dairy Sci. 104, 8765–9782. doi: 10.3168/jds.2020-20051
McDonnell, R. P., Hart, K. J., Boland, T. M., Kelly, A. K., McGee, M., and Kenny, D. A. (2016). Effect of divergence in phenotypic residual feed intake on methane emissions, ruminal fermentation, and apparent whole-tract digestibility of beef heifers across three contrasting diets. J. Anim. Sci. 94, 1179–1193. doi: 10.2527/jas.2015-0080
Neave, H. W., Lomb, J., von Keyserlingk, M. A. G., Behnam-Shabahang, A., and Weary, D. M. (2017). Parity differences in the behavior of transition dairy cows. J. Dairy Sci. 100, 548–561. doi: 10.3168/jds.2016-10987
Neilson, H. K., Robson, P. J., Friedenreich, C. M., and Csizmadi, I. (2018). Estimating activity expenditure: how valid are phsycial activity questionnaires? Am. J. Clin. Nutrit. 87, 279–291. doi: 10.1093/ajcn/87.2.279
Olijhoek, D. W., Difford, G. F., Lund, P., and Løvendahl, P. (2020). Phenotypic modeling of residual feed intake using physical activity and methane production as energy sinks. J. Dairy Sci. 103, 6967–6981. doi: 10.3168/jds.2019-17489
Remppis, S., Steingass, H., Gruber, L., and Schenkel, H. (2011). Effects of energy intake on performance, mobilization and retention of body tissue, and metabolic parameters in dairy cows with special regard to effects of pre-partum nutrition on lactation-a review. Asian-Australas. J. Anim. Sci. 24, 540–572. doi: 10.5713/ajas.2011.10134
Roche, J. R., Friggens, N. C., Kay, J. K., Fisher, M. W., Stafford, K. J., and Berry, D. P. (2009). Body condition score and its association with dairy cow productivity, health, and welfare. J. Dairy Sci. 92, 5769–5801. doi: 10.3168/jds.2009-2431
Russell, J. B.. (1986). Heat production by ruminal bacteria in continuous culture and its relationship to maintenance energy. J. Bacteriol. 168, 694–701. doi: 10.1128/jb.168.2.694-701.1986
Solano, L., Barkema, H. W., Paior, E. A., Mason, S., LeBlanc, S. J., Nash, C. G. R., et al. (2016). Associations between lying behavior and lameness in Canadian Holstein-Friesian cows housed in freestall barns. J. Dairy Sci. 99, 2086–2101. doi: 10.3168/jds.2015-10336
Spurlock, D. M., Dekkers, J. C. M., Fernando, R., Koltes, D. A., and Wolc, A. (2012). Genetic parameters for energy balance, feed efficiency, and related traits in Holstein cattle. J. Dairy Sci. 95, 5393–5402. doi: 10.3168/jds.2012-5407
Tempelman, R. J., Spurlock, D. M., Coffey, M., Veerkamp, R. F., Armentano, L. E., Weigel, K. A., et al. (2015). Heterogeneity in genetic and nongenetic variation and energy sink relationships for residual feed intake across research stations and countries. J. Dairy Sci. 98, 2013–2026. doi: 10.3168/jds.2014.8510
USDA–ERS. (2017). Milk Cost of Production Estimates. Available online at: https://www.ers.usda.gov/data-products/milk-cost-of-production-estimates/milk-cost-of-production-estimates/#Recent%20Milk%20Cost%20of%20Production%20Estimates-2016%20Base (accessed February 2, 2018).
von Keyserlingk, M. A. G., Martin, N. P., Kebreab, E., Knowlton, K. F., Grant, R. J., Stephenson, M., et al. (2013). Invited review: sustainability of the US dairy industry. J. Dairy Sci. 96, 5405–5425. doi: 10.3168/jds.2012-6354
Wenz, J. R., Moore, D. A., and Kasimanickam, R. (2011). Factors associated with the rectal temperature of Holstein dairy cows during the first 10 days in milk. J. Dairy Sci. 94, 1864–1872. doi: 10.3168/jds.2010-3924
Keywords: dairy cattle, feed intake, feed efficiency, sensor data, precision technologies
Citation: Siberski–Cooper CJ, Mayes MS, Healey M, Goetz BM, Baumgard LH and Koltes JE (2022) Associations of Wearable Sensor Measures With Feed Intake, Production Traits, Lactation, and Environmental Parameters Impacting Feed Efficiency in Dairy Cattle. Front. Anim. Sci. 3:841797. doi: 10.3389/fanim.2022.841797
Received: 22 December 2021; Accepted: 19 January 2022;
Published: 03 March 2022.
Edited by:
Suresh Neethirajan, Wageningen University and Research, NetherlandsReviewed by:
Bradley Heins, University of Minnesota Twin Cities, United StatesCopyright © 2022 Siberski–Cooper, Mayes, Healey, Goetz, Baumgard and Koltes. This is an open-access article distributed under the terms of the Creative Commons Attribution License (CC BY). The use, distribution or reproduction in other forums is permitted, provided the original author(s) and the copyright owner(s) are credited and that the original publication in this journal is cited, in accordance with accepted academic practice. No use, distribution or reproduction is permitted which does not comply with these terms.
*Correspondence: James E. Koltes, amVrb2x0ZXNAaWFzdGF0ZS5lZHU=
Disclaimer: All claims expressed in this article are solely those of the authors and do not necessarily represent those of their affiliated organizations, or those of the publisher, the editors and the reviewers. Any product that may be evaluated in this article or claim that may be made by its manufacturer is not guaranteed or endorsed by the publisher.
Research integrity at Frontiers
Learn more about the work of our research integrity team to safeguard the quality of each article we publish.