 Patricia Fuchs
 Felix Adrion2
 Abu Z. M. Shafiullah
 Rupert M. Bruckmaier
 Christina Umstätter
- 1Agroscope, Research Division Animal Production Systems and Animal Health, Posieux, Switzerland
- 2Agroscope, Research, Division Sustainability Assessment and Agricultural Management, Ettenhausen, Switzerland
- 3Department of Statistics, University of Dhaka, Dhaka, Bangladesh
- 4Veterinary Physiology, Department of Clinical Research and Public Health, Vetsuisse Faculty, University of Bern, Bern, Switzerland
- 5Johann Heinrich von Thünen-Institute, Institute of Agricultural Technology, Braunschweig, Germany
Ultra- and circadian activity rhythms of animals can provide important insights into animal welfare. The consistency of behavioral patterns is characteristic of healthy organisms, while changes in the regularity of behavioral rhythms may indicate health and stress-related challenges. This pilot study aimed to examine whether dairy cows in free-stall barns with an automatic milking system (AMS) and free cow traffic can develop ultra- and circadian activity rhythms. On 4 dairy farms, pedometers recorded the activity of 10 cows each over 28 days. Based on time series calculation, the Degree of Functional Coupling (DFC) was used to determine the cows' activity rhythms. The DFC identified significant rhythmic patterns in sliding 7-day periods and indicated the percentage of activity (0–100%) that was synchronized with the 24-h day-night rhythm. As light is the main factor influencing the sleep-wake cycle of organisms, light intensity was recorded in the AMS, at the feed alley and in the barn of each farm. In addition, feeding and milking management were considered as part of the environmental context. Saliva samples of each cow were taken every 3 h for 1 day to determine the melatonin concentration. The DFC approach was successfully used to detect activity rhythms of dairy cows in commercial housing systems. However, large inter- and intra-individual variations were observed. Due to a high frequency of 0 and 100%, a median split was used to dichotomize into “low” (<72.34%) and “high” (≥72.34%) DFC. Forty percent of the sliding 7-day periods corresponded to a low DFC and 50% to a high DFC. No DFC could be calculated for 10% of the periods, as the cows' activity was not synchronized to 24 h. A generalized linear mixed-effects model revealed that the DFC levels were positively associated with a longer milking interval and a higher amount of daytime activity and negatively associated with higher number of lactations. The DFC is a novel approach to animal behavior monitoring. Due to its automation capability, it represents a promising tool in its further development for the purpose of longitudinal monitoring of animal welfare.
Introduction
Animal welfare is a complex and multi-layered concept based on different criteria. It implies an animal being physically healthy, in a positive affective state (Fraser, 2008) and capable of performing natural, species-specific behaviors that are pleasurable and supportive to biological function (Bracke and Hopster, 2006). A change in this state may indicate a reduction in well-being. In Precision Livestock Farming systems, sensors enable automated behavior recording and thus improve the detection of behavioral changes. These can be used alongside clinical and physiological indicators to assess animal welfare (Weary et al., 2006; Millman, 2013). Based on continuous activity recording, daily patterns and the rhythmic organization of activity can be obtained. The most obvious rhythm of activity is represented by the sleep-wake cycle. Mammals are endogenously adapted to a circadian rhythm with a periodicity of about 24 h (Xie et al., 2019). Organisms can be further divided into different chronotypes, such as unimodal (strictly nocturnal or diurnal), bimodal or multimodal. Cows exhibit multiple activity clusters over 24 h with great variability in timing of activity (Refinetti et al., 2016). Besides circadian rhythms, ultradian rhythms with a periodicity of <24 h can be observed in various cellular processes and physiological functions (e.g., heartbeat, respiration rate, hormone release, and sleep stages) as well as cyclic behavioral patterns (e.g., feed intake and resting). Accordingly, ultradian rhythms may show a great variety in period length (from ms to h) so they can repeat several times a day (Piccione and Caola, 2002; Vir Singh and Kumar, 2018).
Wavelet analysis has become established for the identification of rhythms and their periodicities in biological time series (Leise and Harrington, 2011; Bar-Joseph et al., 2012). Particularly for the investigation of behavioral time series, a specific approach was originally developed by Scheibe et al. (1999). Subsequently, Berger et al. (2003) further investigated this idea. In this method, the Degree of Functional Coupling (DFC) is calculated. The DFC is a metric used to describe the extent to which the measured activity is significantly cyclic to 24 h and thus harmonically synchronized with the periodicity of the environment.
The DFC approach has already been used to study activity rhythms of ruminants in extensive husbandry systems or wildlife habitats. It has been found that these individuals often keep constant rhythms for certain behaviors, such as rumination, in order to maintain physiological functions and ultimately ensure a healthy organism (Scheibe et al., 1999; Berger et al., 2003; Nunes Marsiglio Sarout et al., 2018). If these rhythms cannot be maintained due to internal (e.g., disease) or external (e.g., distress) disturbances, this has negative effects on rhythmicity (Wagner et al., 2021). In turn, circadian misalignments pose a risk for a number of short- and long-term health impairments (James et al., 2017; Bagheri Hosseinabadi et al., 2019). The internal biological clock is maintained endogenously under constant conditions, with the light-dark cycle being the most consistent and reliable factor for this. If the internal clock cannot be synchronized by photo-periodicity, other exogenous cues, such as temperature, exercise or food are required to induce entrainment (James et al., 2017). Depending on the time and intensity of their occurrence, exogenous cues are able to change the placement of rhythmic timing (Piccione and Caola, 2002). In some livestock production systems, humans have taken advantage of exogenous cues to deliberately control the daily rhythm of animals to increase production output (e.g., light regime for laying hens; see Xin et al., 2021). However, in other production systems characterized by a high level of automation, timing is not consciously controlled. With regard to the dairy industry, which is likewise undergoing a transformation towards digitalized and automated husbandry systems, the effects of increased technology use on the animals well-being have not yet been clarified (Werkheiser, 2020; Dawkins, 2021). Automatic Milking Systems (AMS) offer cows the opportunity to freely choose their milking times within the time intervals set by stock personnel. However, the synchrony of milking within the herd is likely to be compromised by concurrent milking times (Flury and Gygax, 2016). Since only one milking at a time and robot is feasible, AMS availability is not provided for all cows at all times and particularly not during their main activity peaks during the day. This can lead to waiting times, especially for low-ranking cows (Ketelaar-de Lauwere et al., 1996; Wiktorsson and Sørensen, 2004). Ultimately, delayed milking may result in higher nighttime activity and number of nighttime milkings for at least part of the herd. In addition, most AMS are illuminated at night. Light exposure at night suppresses melatonin synthesis (Steinhilber, 2007). Melatonin is the key hormone regulating the sleep-wake cycle in response to photoperiodicity (Amaral and Cipolla-Neto, 2018). Melatonin conforms to a circadian pattern with low concentrations during the day and high concentrations at night. The blood plasma concentrations of melatonin in dairy cows peaked at 1 a.m. and subsequently decreased until it reached the baseline at 7 a.m. (Castro et al., 2011). The average concentrations ranged from 5 to 16 pg/ml during the day (8 a.m. to 10 p.m.) and 25 to 90 pg/ml during the night (Burchard et al., 1998; Castro et al., 2011). Besides the timing of light exposure, the property of light also has an effect on melatonin inhibition und ultimately on circadian rhythmicity. As a dichromate, cows perceive mainly light of short and medium wavelengths, corresponding to the blue-green spectral range of light. In the long-wavelength, red light, cows showed a lower level of photosensitivity (Jacobs et al., 1998).
While activity rhythms of ruminants in extensive husbandry systems have already been studied, they have not yet been investigated under commercial conditions. This pilot study aimed to investigate whether dairy cows can develop ultra- and circadian activity rhythms in the specific environment of a free stall barn with AMS. For this purpose, the DFC according to Scheibe et al. (1999) was calculated. To determine a possible influence of light on the day-night rhythm of the cows, illuminances on each farm were measured and the melatonin concentration in the cows' saliva was examined. Other exogenous factors, such as feeding and milking management, that could influence the circadian rhythmicity of cows, were also considered in the farm-specific setting.
Materials and Methods
Ethics Statement
All experimental procedures were approved by the cantonal veterinary office Thurgau according to the Swiss animal protection and welfare law (Authorization No. TG02/19).
Farms
The experiment was conducted between the 25th of June and the 3rd of September 2019 on 4 Swiss dairy farms (A–D) operating a free stall barn, AMS, free cow traffic and zero grazing. Except Farm D, all farms had an outdoor area adjacent to the barn. External controllable factors that may have affected rhythmicity, such as lighting, feeding and management events were monitored on each farm (Table 1).
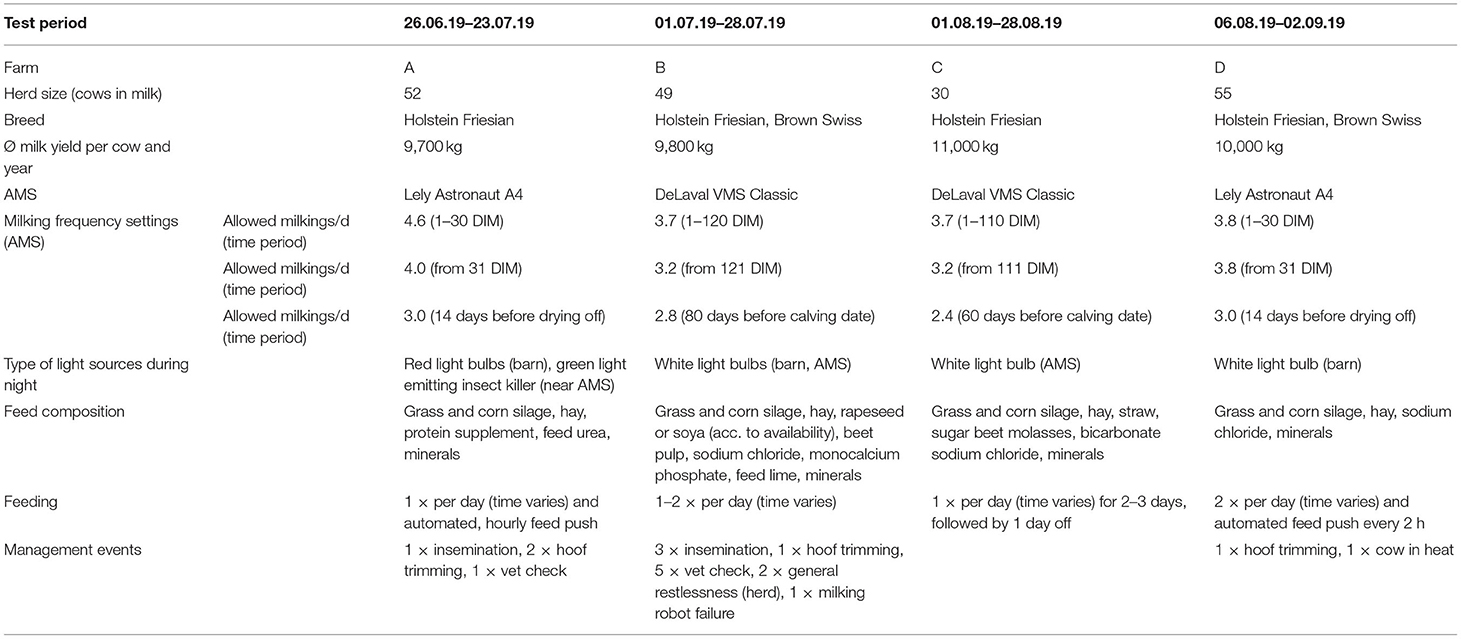
Table 1. Overview of the herd characteristics, milking frequency settings, type of light sources, and used feed components.
Red light bulbs were installed on Farm A throughout the barn and the waiting area of the AMS, which were used by the farmer during evening checks. In addition, an electric fly killer nearby the AMS emitted green light 24 h a day. White light bulbs illuminated the barns and AMS of Farms B, C, and D. On Farm B, the lighting in both sectors remained switched on all night (10 p.m. to 6 a.m.). On farm C, only the lighting in the AMS and on Farm D only the lighting in the barn was switched on during the night (10 p.m. to 6 a.m.).
Feeding was handled differently in all farms (Table 1). The frequency of feeding was 1–2 times per day, with no fixed feeding times in any of the farms. Two of the farms had automatic feed pushers that ran every hour (Farm A) or every 2 h (Farm B).
The average annual milk yield of the cows was comparable on the farms, ranging from 9,700 kg (Farm A) to 11,000 kg (Farm C). The milking entitlement of the cows by the AMS varied based on DIM, with each farm allowing more milkings per day at the beginning of lactation and less at the end of lactation (Table 1). However, the number of milkings per day remained constant for all cows as they each remained in their same DIM range during the experiment.
Animals
A total of 40 Holstein Friesian and Brown Swiss cows were included in the trial (n = 4 inseminated, n = 18 not inseminated; n = 18 pregnant), ranging from 38 to 218 DIM in their 1st to 7th lactation at the start of the trial. For each farm, 10 cows were selected of which 5 cows had a low milking frequency (2.1–2.9 milkings per day) and 5 cows had a high milking frequency (2.9–3.7 milkings per day). Thus, 2.9 milkings per day corresponded either to a low or high milking frequency. Two cows per farm were reserved as replacements in case of illness or injury of a trial cow. This occurred once on Farm A, where a cow had to be euthanized due to a deteriorating state of health. A replacement cow took its place for the remaining 14 days of the trial period. All cows were randomly selected from the herd and balanced within the two groups according to their lactation number and DIM. These two factors were considered to minimize their confounding effects. In addition, the experimenters were blinded to the identity of the groups at each stage of the study.
Experimental Procedures
The number of farms and cows were determined based on the scope of a pilot study. The experiment was divided into 2 trial periods of 29 days each. In both periods, data were collected on 2 farms simultaneously in order to consider the same time frame according to the daylight changes.
Activity Recordings
In the beginning of each trial period, pedometers (IceTag3D, IceRobotics Ltd., Edinburgh, Great Britain) were put on the left hind leg of the cows to record their activity during a period of 28 days. The Icetags were validated in their application to accurately record the behavior of dairy cows (McGowan et al., 2007). The pedometers measured the three-dimensional acceleration with 16 Hz and calculated a motion index (MI) with a granularity of 1 s. MI is defined as the overall activity of the animal calculated by the average acceleration on each of the 3 axes and producing a total value between 0 and 30 for each second (0 = no acceleration, 30 = strong acceleration) (IceRobotics Ltd., User Manual 2010).
The status of the sensors was checked once per week (battery level, active data recording and correct fit of the pedometer). Mild chafing with reddened skin caused by wearing the pedometer occurred in 6 cows. Thus, the sensor was changed from the left to the right hind leg within the trial, as the side of mounting does not influence the data (McGowan et al., 2007). After removing the sensors at the end of each trial period, data were downloaded wirelessly from the pedometers using the hardware “IceReader” (IceRobotics Ltd., Edinburgh, Great Britain). Icetags and hardware communicated via radio waves. MI values per minute were exported using the software “IceManager” (IceRobotics Ltd., Edinburgh, Great Britain) and processed for the output variables as described in Supplementary Table S1. Due to a technical failure of a single pedometer, there was a data loss of 6 days in activity records for the respective cow. However, its remaining 22 days of activity data were used for data analysis. All other 39 pedometers provided full activity records. For the pedometer of the euthanized cow, 14 days of activity records of its replacement were included in the analysis.
Milking Data
During the 28 days of data collection, the AMS of each farm recorded animal-related data on the milking characteristics of each cow, such as DIM, number of lactation, number of milkings, milking times (clock time) and milk yield (kg) per day. The milking data were used to calculate a milking interval (time difference between 2 milkings) and a Milking Index (day/night ratio of milkings), which were processed for further analysis as described in Supplementary Table S1.
Management Events
As the experiment was conducted on commercial farms, management events took place during the 28 days of activity recording. These included feeding as well as interventions where cows would usually be restrained in the feeding fence (Table 1). In order to determine which event occurred during the period of data collection, farmers were given a worksheet on which they could record the event, date, time, duration, and cow involved. Events included feeding, illness and injury, veterinary checks, insemination, cows in heat, hoof trimming, and any abnormalities they noticed, such as general animal restlessness or fatigue, milking robot failure and maintenance.
Saliva Sampling
On Day 29 of each farm's measuring period, saliva samples of each cow were taken every 3 h (12, 3, 6, and 9 p.m. and 12, 3, 6, and 9 a.m.) to analyze the melatonin concentration. On Farm C, one cow had to be excluded from saliva sampling due to strong avoidance behavior. Thus, a total of 312 saliva samples from 39 cows were examined for melatonin concentration. During sampling, the cows were selected in random order from the two homogeneous treatment groups with low and high milking frequency. Moreover, the measurements of each cow were done at random to minimize the order effect. Thus, samples were taken at the given time points by “first catch first serve basis”. For the period of saliva sampling, a halter was put on the cows to facilitate handling. During the nocturnal sampling, only headlamps with red light bulbs were used to exclude any influence on the melatonin release. The saliva samples were collected with Salivetten® (Sarstedt AG & Co KG, Nümbrecht, Germany). At each sampling time, the cotton swab of the Salivette® was held in the mouth of the cows for about 1–2 min until it was soaked with saliva. Directly after sampling, the Salivetten® were centrifuged at 402 × g (16 cm rotor radius, 1,500 RPM) to extract the saliva. Thereafter the samples were frozen at −20°C until laboratory analysis. An indirect immunoassay was performed using an ELISA kit (Salivary Melatonin Assay Kit, Salimetrics LLC., State College, PA 16803, USA) to determine the melatonin concentration of the saliva samples. If melatonin concentration exceeded the highest standard of assay range (50 pg/ml), the samples were diluted with assay buffer and retested.
Since melatonin is regulated by light, saliva samples were split into day (6 a.m. to 10 p.m.) and night (10 p.m. to 6 a.m.) due to the daylight conditions during the experiment. Thus, melatonin concentration consisted of 6 daytime samples (6 and 9 a.m. and 12, 3, 6, and 9 p.m.) and 2 nighttime samples (12 and 3 a.m.). This classification was made equally for all farms.
Illuminance Measurements
In order to determine the influence of light on melatonin concentration, immediately after each saliva sampling on day 29, illuminance was measured in the AMS, at the feed alley, and in the barn (walkway) using a luxmeter with a dynamic range between 10 and 100,000 lx (MavoSpec Base Spektrometer, Gossen Foto- und Lichtmesstechnik GmbH, Nürnberg, Germany). As the illuminance during the nocturnal measurements was partly below the lower limit of 10 lx of the luxmeter, no exact value could be recorded. In this case, a value of 5 lx was assumed because there was always light remaining due to a light source or moonlight.
Mean illuminances for day and night were calculated (Supplementary Table S1) for all 3 measurement areas (AMS, feed alley and barn) at 5 daytime hours (6 and 9 a.m. and 12, 3, and 6 p.m.) and 3 nighttime hours (9 p.m. and 12 and 3 a.m.). For consistency reasons, illuminance-measuring times were related to those of the saliva samplings, since they were always done subsequently to sampling. However, there was a time discrepancy of up to 1 h between the start of the saliva samplings and the corresponding illuminance measurements. This resulted in a natural daylight difference between these measured variables, particularly high at the measurement at 9 p.m. Thus, saliva sampling at 9 p.m. was considered as daytime, while the corresponding illuminance at 10 p.m. was counted as nighttime.
Data Processing
DFC Calculation
The analysis of DFC can be performed with different sampling intervals (e.g., min to h) and time series length (e.g., minimum 7–10 days), requiring uninterrupted activity recording for the duration of the time series (Scheibe et al., 1999; Berger, 2011). The granularity of the sampling interval can be chosen depending on the research objective. Thus, the smaller the time interval, the more accurate the information. For activity measurements, sampling intervals of less than an hour to a few minutes are advisable because the activity of an animal could change within a short time frame. Therefore, in this study, the DFC of each cow was calculated based on 15-min sums of its MI over a 7-day sliding window. Thus, 21 DFC values of each cow were generated from a 28 day activity record, except for a single cow on Farm A (only 7 DFC values) and another on Farm B (only 15 DFC values).
The DFC was determined by using an algorithm according to Berger et al. (2003), which included the following calculations. First, an autocorrelation was applied to filter out noise and to amplify rhythmic components of the activity, as biological time series usually exhibit strong variations in period length and are inherently noisy. This way, a Fourier transformation could be performed in the second step. The Fourier transformation broke down the periodic waveform of the time series into its coefficients in order to calculate the amplitudes of the Fourier frequencies (discrete periods) with best fit to the autocorrelation. As an example, Figure 1 shows the splitting of a common periodic signal (Figure 1G.1) into its individual components (Figures 1A.1–F.1) and the identification of the related Fourier frequencies (Figures 1A.2–G.2). In activity patterns, the periodic signal of the Fourier series is represented by a cosine wave in the fundamental and its integer multiples, the harmonics (Bloomfield, 2000). Ultradian rhythms are multiples of a circadian fundamental, as they have shorter period lengths and therefore repeat several times a day. So for example, the 2nd harmonic oscillation corresponds to 2 oscillations per day and thus to a period length of 12 h (Figure 1B.1), the 3rd harmonic oscillation corresponds to 3 oscillations per day and thus to a period length of 8 h (Figure 1C.1), and so on. In terms of a circadian rhythm, the harmonic periods were obtained by dividing 24 h by an integer, resulting in 24, 12, 8 h … etc., with shortest investigated harmonic period of 24/13 = 1.85 h. For comparability of different time series, the squared coefficients (power in %) of each Fourier frequency can be plotted against the period length in a Lomb–Scargle periodogram. Based on the power spectral density, these coefficients were ranked according to their relative proportion in the periodogram and further tested for significant periodicity by R.A. Fisher test (Berger et al., 2002).
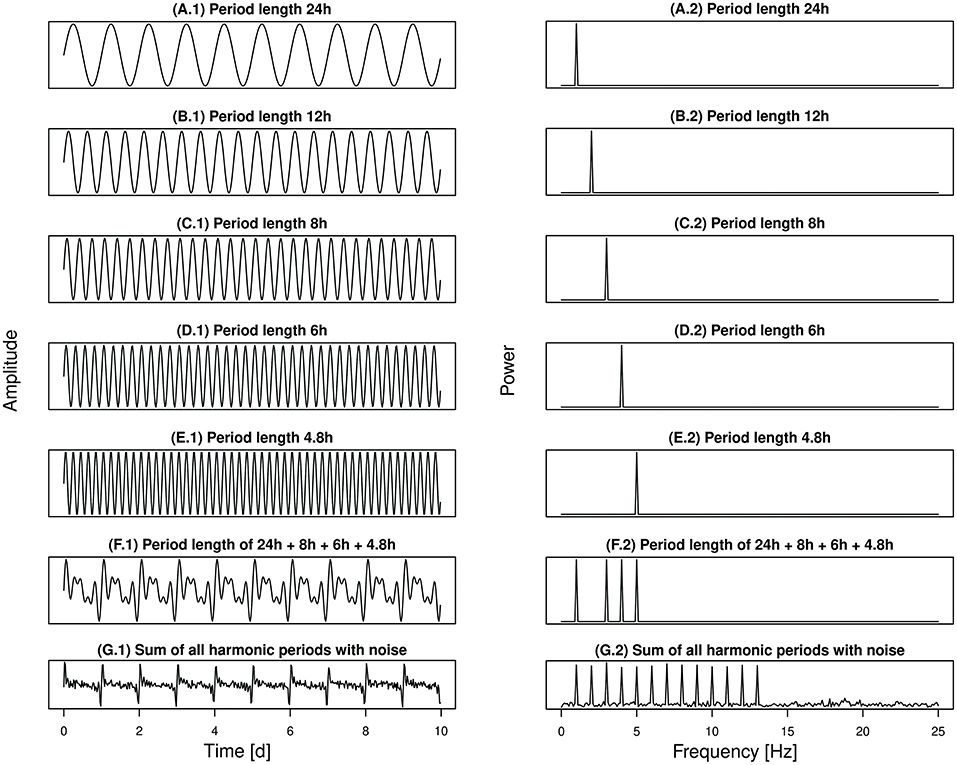
Figure 1. Spectral analysis can be used to decompose time series into their periodic components. As an example, (G.1) shows a noisy signal and several of its fragments with different period lengths (A.1–F.1). Following the Fourier transformation, the content of each frequency contained in the periodic signal can be determined (A.2–G.2).
Third, the DFC was calculated using the equation according to Scheibe et al. (1999) with ∑ (harm., sign.) representing the total intensity of all significant, harmonic periods and ∑ (total., sign.) being the sum of all significant periods (harmonic and non-harmonic) in the spectrum:
Hence, DFC ranges between 0 and 100%. The more the activity of an animal is synchronized to the periodicity of the environment, the higher the DFC. While a DFC of 100% indicates only significant, harmonic periods and thus a maximum adaption of the activity to the 24 h rhythm, a DFC of 0% implies only significant, non-harmonic time series (Berger et al., 2003). The lack of any significant periods within a 7-day period, both harmonic and non-harmonic, results in an incalculable activity rhythm (NC). For the calculation of a generalized linear mixed-effects model (GLMM), the NC levels were included with a value of 0% to strengthen the data base by providing a larger sample size.
In addition, periods of the Fourier frequency spectrum were analyzed descriptively. Hereby, the number of significant, harmonic periods were counted for each cow for all 21 7-day sliding intervals. Furthermore, to generate 2 equal sample groups for further analysis, all DFC values per cow were divided into 2 groups according to the median, i.e., “low” DFC (<72.34%) and “high” DFC (≥72.34%). This resulted in a binary dependent variable for statistical analysis of data using a GLMM, with each cow providing a high or low DFC that corresponded to the predictor values at different time points. The division of “low” and “high” DFC was retained in the later text and used as a synonym of proxy.
Calculation of Indices
To describe the day/-night ratio of activity and milkings of the cows, a Diurnality Index (DI) and a Milking Index (MILKI) was calculated according to Hoogenboom et al. (1984):
Cd and Cn represent the sum of the measured activity (Motion Index) or number of milkings during day Td (6 a.m. to 10 p.m.) and night Tn (10 p.m. to 6 a.m.). Thus, a day period of Td = 16 h and a night period of Tn = 8 h was used. An index of −1 indicates only nocturnal activity or number of milkings and +1 only daily activity or number of milkings. An index of 0 represents a balanced ratio of activity or number of milkings between day and night.
Statistical Analysis
The statistical analysis was performed using RStudio (R version 4.0.2). A generalized linear mixed-effects model (GLMM) was fitted by using the lme4 package (Bates et al., 2022). As DFC was divided into “low” and “high” levels by median split, a binary dependent variable with 0–1 coding, and logit link function was used for fitting the mixed effects model. The R package DHARMa (Hartig and Lohse, 2021) was used to diagnose the model assumptions using QQ-plot, Kolmogorov Smirnov test, Levene test and other simulation-based non-parametric procedures available in the package. The tests for over dispersion, outliers, autocorrelation, heteroscedasticity, expected distribution of residuals and zero inflation were performed. Prior to fitting the GLMM, side-by-side boxplots were created for the continuous predictor variables to demonstrate that its observed medians varied across the DFC categories, hence justifying the inclusion of the variables as predictors in the statistical model (Figure 2). Thereby, an increased activity of one cow on Farm D due to its heat was observed. This led to extreme outliers in the data set and a convergence problem, since GLMM is a subject-specific or conditional model, which can be computationally demanding and have convergence issues for binary responses. Thus, the cow was removed from the data set. Consequently, considering the 21 replicates per cow minus the data gaps for two individuals (pedometer failure, sick cow), the data set for calculating the model contained 21 ×39 – 6 – 14 = 799 values for each variable. The independent variables were measured using different scales. Therefore, the original data of the measured variables were standardized by using the dataPreparation package (Toulemonde, 2020).
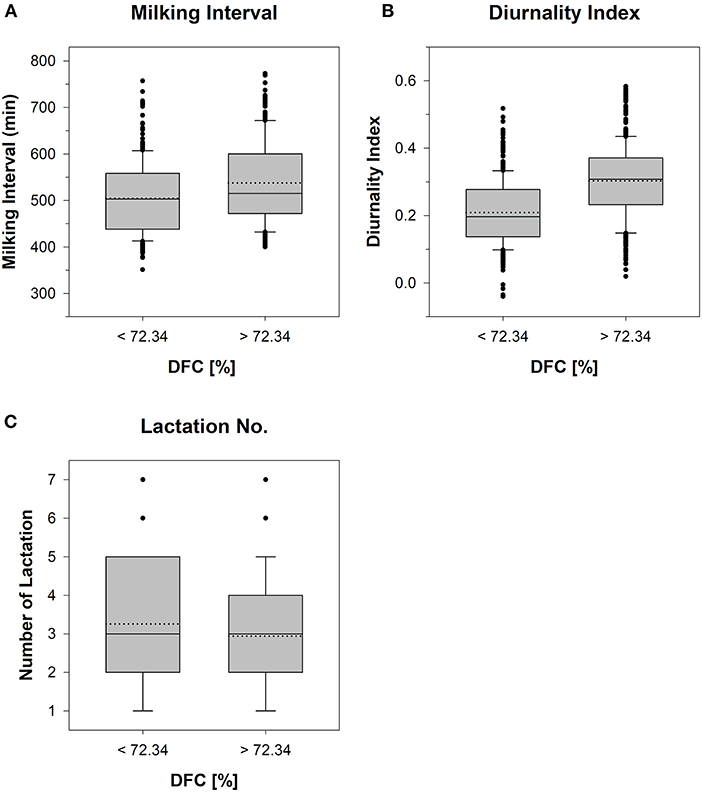
Figure 2. The side-by-side boxplots represent the results of a mean value comparison of the 7-day periods of cows (n = 37) with “low” (<72.34%) and “high” (≥72.34%) Degree of Functional Coupling (DFC) with respect to the measured variables (A) Milking Interval, (B) Diurnality Index, and (C) Lactation Number. NA calculated DFC levels were included in the low DFC group with a value of 0. Mean shown as solid line and median shown as dotted line.
In this study, we considered several alternative forms of GLMM, including the random intercept only model, the random intercept for cows nested in farms, and both the random and random slope models. Finally, based on statistical criteria, the random intercept for cows nested in farms was included in the model. The independent variables were selected using an exhaustive search algorithm. This approach assessed the information loss incurred by all possible subsets of independent variables in the GLM. The loss of information was measured by AICc for each subset. Finally, the algorithm selected the subset for which the AICc was minimum. The algorithm was implemented using the glmulti package in R (method = h), which revealed the model-averaged significance of the variables (Calcagno, 2020), as depicted in Figure 3. The remaining variables (DI, milking interval and lactation number) were found to have model-averaged significance in the predictor screening, and were therefore considered as fixed effects in each case. The models were compared based on the p-values of the likelihood ratio tests (LRT), AIC, BIC, intra-class correlation coefficient (ICC), and marginal and conditional R2. The ICC is used to indicate how much variance is explained by a random effect. It is calculated by dividing the variance of the random effects by the total random variance, i.e., sum of all random effects and error. Marginal R2 provides the variance explained only by fixed effects and conditional R2 provides the variance explained by the entire model, i.e., both fixed effects and random effects. The LRT was performed using the anova() function, while the R package sjPlot (Lüdecke, 2021) created a summary table that includes the odds ratios (OR), confidence intervals (CI) and p-values for the fixed effects coefficients along with the variance components of the random effects and model performance indicators. The selected GLMM comprised all the fixed effects and the variance components of the random effects for the random intercept of individual cows, and the random slope of the cows for DI.
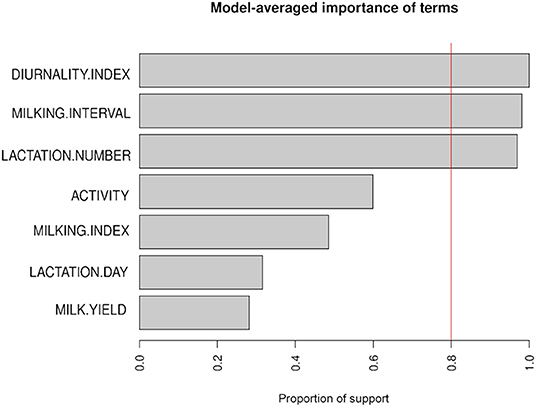
Figure 3. Predictors (y-axis) identified by model-averaged importance (x-axis). The model-averaged importance is defined as the proportion of all subset regression models in which a given term appears. The vertical line at x = 0.8 indicates 80% support. Thus, the terms with an importance index above 0.8 have good conditions to be included in the model.
Results
Milking Data
The milk yield of the cows increased with higher lactation number. During the experimental period, the average milk yield of cows with ≥3 lactations was higher by 7.8 kg on Farm A, 3.1 kg on Farm B, 6.5 kg on Farm C, and 6.3 kg on Farm D compared to cows with <3 lactations. Moreover, cows with a higher milk yield tended to have a higher number of milkings per day. This was observed on all farms. The ratio between day and night milkings was balanced on average for each experimental period on all farms, as indicated by the calculated MILKI of 0.02 on Farm A, 0.03 on Farm B, 0.2 on Farm C, and 0.03 on Farm D.
Ultra- and Circadian Activity Rhythms
The most frequent significant harmonic periodicities identified were 24, 12, 8, 6, 4.8, 4, and 3.4 h relative to the number of calculated 7-day periods (n = 799) of all cows (n = 39), as depicted in Figure 4. A circadian activity rhythm was evident in 90% of the cows. The most frequent ultradian rhythm with a periodicity of 12 h was present in 77% of the animals, followed by a rhythm with a periodicity of 8 h in 51%, 6 h in 56% and 4 h in 26%. An activity rhythm with a periodicity of 2 and 1.85 h was not observed in any cow. However, the frequencies of periodicities differed per farm, e.g., periodicities of 24, 12, 8, and 6 h were most frequent on Farms A, B, and D relative to the total number of calculated periods. On Farm C, periodicities of 12 h (n = 79), 24 h (n = 73), 4 h (n = 16), and 3.4 h (n = 13) were most common among the periods calculated. On Farm D, no 4-h periodicity occurred. Furthermore, significant non-harmonic periodicities were identified (Figure 4). Relative to the total number of calculated 7-day periods (n = 799) of all cows (n = 39), a periodicity of 21 h in 18% (n = 7) and 7.6 h in 23% (n = 9) of the cows were most frequent. These periodicities were mainly represented on Farms C and D, while 3.9 and 5.5 h were also common on Farms A and B, relative to the total number of periods calculated.
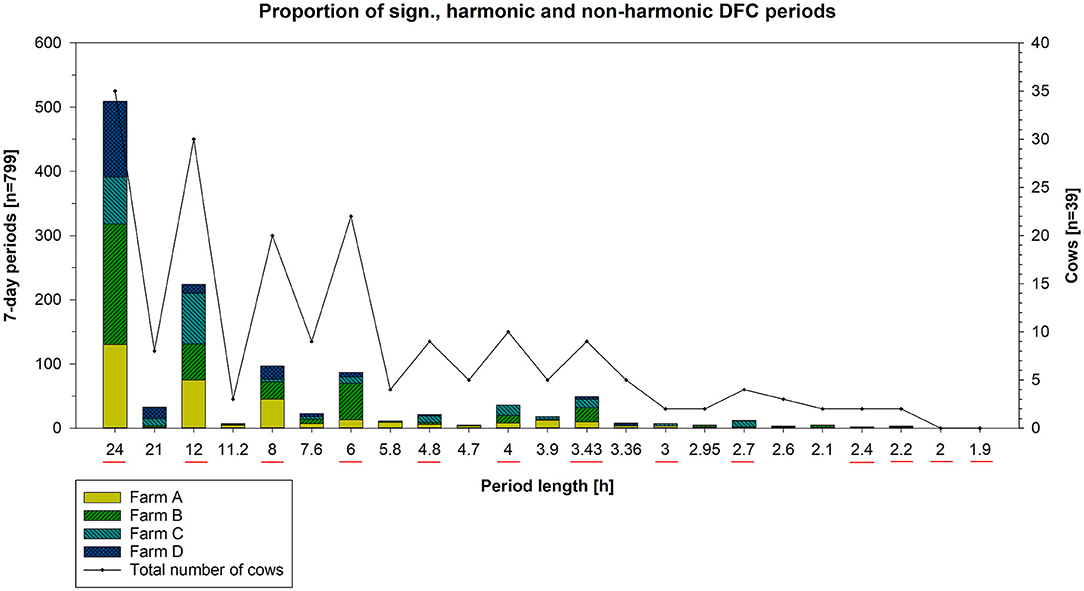
Figure 4. Number of all significant harmonic and non-harmonic DFC periods per farm (y-axis) depending on period length (x-axis) and total number of cows (z-axis). Harmonic periods are obtained by dividing 24 h by an integer (underlined red), i.e., periods of 24, 12, 8 h, … down to 1.85 h in length. All periodicities in between correspond to significant non-harmonic periods.
Each farm had cows with predominantly low and high DFC periods (Table 2). On average, 50% of all calculated DFC periods (n = 799) correspond to a DFC value ≥ 72.34 and 40% to a DFC value <72.34%. The proportion of DFC periods without cyclic component to 24 h amounted to 10%. The DFC of the cows was characterized by a high variability (SD of DFC = 40%). Therefore, only a few cows showed constant DFC values over longer periods. The maximum duration of 21 consecutive DFC periods with a high DFC was maintained by 2 cows. In contrast, a consistently low DFC was maintained for a maximum duration of 11 consecutive 7-day periods by 3 cows. In total, 8 consecutive 7-day periods of a single cow corresponded to the maximum duration in which no DFC could be calculated. Cows with a greater difference in day- and night activity had a higher DFC level. These animals were more likely to rest between 10 p.m. and 6 a.m., respectively, showing higher activity during the day. Cows with predominantly low or fluctuating DFC periods did not show a clear transition between rest and activity. They had more pronounced bimodal activity profiles and a generally lower activity level. Examples can be found in Figures 5, 6. Within each farm, the average DI of the cows throughout the experiment was 0.25 on Farm A (n = 10), 0.32 on Farm B (n = 10), 0.20 on Farm C (n = 10) and 0.27 on Farm D (n = 9). Accordingly, Farm C had the highest amount of nocturnal activity, while cows on Farm B were most active during day in comparison.
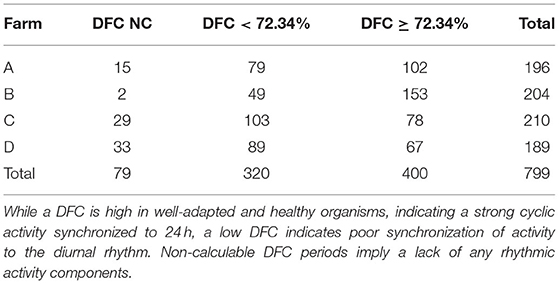
Table 2. Amount of 7-day periods with a low (<72.34%), high (≥72.34%), and non-calculable (NC) Degree of Functional Coupling (DFC) per cow and farm.
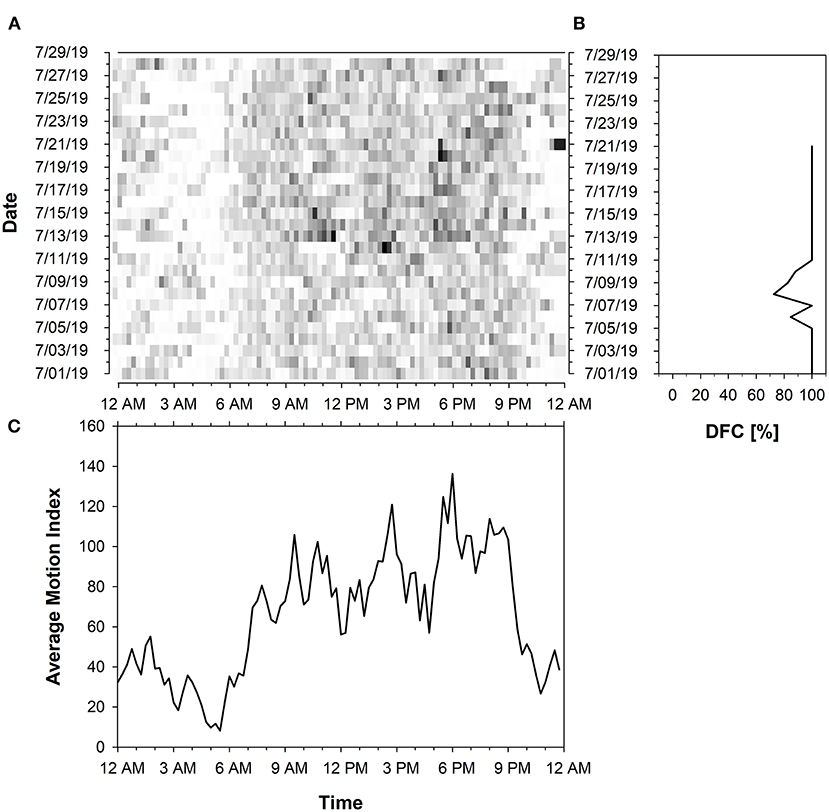
Figure 5. Activity data of a cow with predominantly high DFC periods represented in (A) Actogram of the activity level summed up to 15 min intervals based on Motion Index. The actogram shows the intensity of the activity proportionally to a color-coding from white to black (light: low activity; dark: high activity). The x-axis represents the time of day (24 h starting from 12 a.m.) and the y-axis the days of the trial period. (B) Diagram of the Degree of Functional Coupling (DFC) (x-axis). A total of 21 DFC values were calculated in a sliding 7-day interval for the test period (y-axis). The diagram of the activity pattern in (C) shows the activity level (y-axis) averaged over 15 min intervals over the entire experimental period (x-axis).
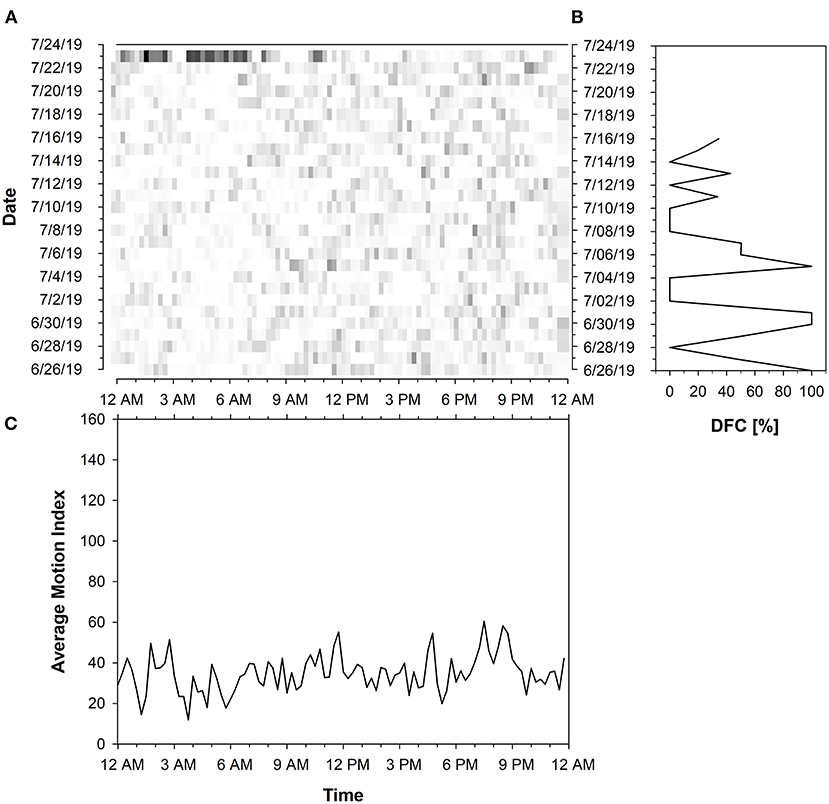
Figure 6. Activity data of a cow with fluctuating DFC periods represented in (A) Actogram of the activity level summed up to 15 min intervals based on Motion Index. The actogram shows the intensity of the activity proportionally to a color-coding from white to black (light: low activity; dark: high activity). The x-axis represents the time of day (24 h starting from 12 a.m.) and the y-axis the days of the trial period. (B) Diagram of the Degree of Functional Coupling (DFC) (x-axis). A total of 21 DFC values were calculated in a sliding 7-day interval for the test period (y-axis). The diagram of the activity pattern in (C) shows the activity level (y-axis) averaged over 15 min intervals over the entire experimental period (x-axis).
The results of the GLMM indicate significant associations between DFC levels and the standardized coefficients in Table 3. Here, the coefficients and odds ratios (ORs) of the DI (p <0.001) and milking interval (p < 0.004) were highly significant whereas the coefficient of lactation number (p <0.041) was statistically significant. The ORs for the fixed effects reveal that holding lactation number and milking interval at a fixed value, the odds of high DFC is expected to increase 284% for a one-unit (one standard deviation) increase in DI, respectively, the cow is more active during day than night. Moreover, we estimated a 58% increase in the odds of high DFC for a one-unit increase in milking interval, holding DI and lactation number at a fixed value. However, the odds of high DFC is expected to decrease by 32% [(1 – 0.68)*100] for a one-unit increase in lactation number, holding DI and milking interval at a fixed value. The summary outputs of the mixed model are depicted in the effects plot (Supplementary Figure S1).
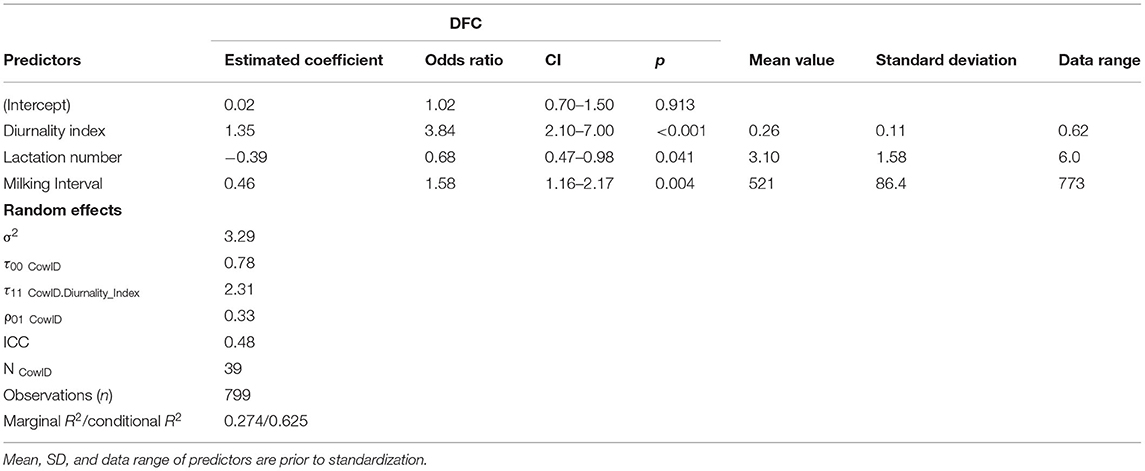
Table 3. Results from the fitted GLMM with the parameter estimates for the fixed effects and variance components for the random effects of the model.
The 95% confidence intervals of the odds ratios further indicate that the odds of a high DFC could be somewhere between 2.10 and 7 times greater with every unit increase of DI, somewhere between 1.16 and 2.17 times greater with every unit increase of milking interval, and somewhere between 2 and 53% lower with every unit increase of lactation number (Table 3). Regarding the Random Effects section of Table 3, the fitted model showed higher values for ICC (0.48), marginal R2 (0.27), and conditional R2 (0.625) than other candidates. Thus, the model explained 62.5% of the total variance in the probability of DFC values for individual cows.
Melatonin Concentration and Illuminance Levels
The mean melatonin concentrations of the cows on Farm A, C, and D corresponded to the daylight pattern with higher concentrations during night (29–76 pg/ml) and lower concentrations during day (23–54 pg/ml). However, the day-/night difference in mean melatonin concentration was very low on Farm A and D (6 pg/ml each). On Farm B, there was no difference in mean melatonin concentration (26 pg/ml during day and night). On Farm C, mean melatonin concentration was high both during the day and at night and the highest compared to the other farms. As 36% of the saliva samples on Farm C had greater melatonin concentrations than 50 pg/ml, they had to be diluted for laboratory analysis (cf. 4% for Farm A; 3% for Farms B and D). Furthermore, we measured the largest range of melatonin concentration during day and night on Farm C. Within animals, cows showed large variations in the melatonin curve. Most cows generally had higher melatonin concentrations at night, although in some cases melatonin peaks were also observed during the day. In addition, the peaks in melatonin concentration occurred both during day and night at different times for each cow.
The mean illuminances varied greatly between farms and within different barn sections. However, all farms were basically brighter during day than night. During the day, Farm C had the lowest illuminance levels compared to the other farms. At night, illuminance levels were low in all farms (<10–66 lx), with Farm A being the darkest in all barn sections.
Discussion
Time series analysis is commonly used to detect biological rhythms. The DFC approach of Scheibe et al. (1999) was developed specifically for the analysis of the activity rhythm of animals. The DFC calculation method exists for 22 years now, but is still less common. However, Berger et al. (2003) and Nunes Marsiglio Sarout et al. (2018) implemented the DFC to map the activity rhythms of free ranging ruminants, which allowed the indication of internal disorders caused by external disturbances. For our pilot study, we strategically chose the DFC because it has great potential to be automated, offering a novel approach to automated monitoring of animal welfare based on behavior. As no exact definition of “high” and “low” DFC has been established in previous studies, we selected the cutoff point at a DFC of 72.34% by median split. This value coincides well with the results of past studies that investigated activity rhythms of various free-ranged species. In alpacas, mouflons and red deer, the DFC normally ranged from 70 to 100%, whereas it decreased to <70% during parturition (mouflons) and social stress (red deer), to 46% in subdominant animals (red deer) and to 28% when suffering an injury (alpacas) (Scheibe et al., 1999). In addition, Nunes Marsiglio Sarout et al. (2018) observed a DFC of 70% in all “medium” and “high” consistency ewes.
Our results reveal that dairy cows can develop ultra- and circadian activity rhythms in AMS. However, the consistency of rhythmicity varied greatly between and within individuals over time. Possible explanations for this may be different environmental conditions and routines of each farm, e.g., milking, feeding, lighting and management, and animal-related factors, such as hierarchical order, milk yield, lactation number or the individual nature of the cow.
The milking interval was set individually on the AMS for each animal and farm, granting the cows a different number of milkings per day depending on their state of lactation. Accordingly, milking management could have had an influence on the activity rhythm of dairy cows, as the animals had to adapt to the milking management set by humans (Berger, 2011; Jacobs and Siegford, 2012). Even though an AMS with free cow traffic characterized the farms, the cows' number of milkings per day and the time to milk were restricted due to the settings and cleaning phases of the AMS. It is conceivable that structuring the daily routine according to these restrictions might have been challenging especially for cows with a high milking frequency. This assumption would fit with the result of the GLMM, indicating a higher likelihood that cows showed a DFC <72.34% in periods with shorter milking interval (respectively, higher milking frequency). Moreover, cows with a higher number of lactations were more likely to have a DFC < 72.34% which could also be related to milking management. Studies demonstrated that milk yield increases with the number of lactations and reaches its maximum at the fourth or fifth lactation (Mellado et al., 2011). A higher milk yield is in turn associated with more frequent milking, which implies a shorter milking interval (Lovendahl and Chagunda, 2011). These two relationships were also found in our study. Cows with a higher lactation number (≥3 lactations) were found to have a higher milk yield in comparison. Likewise, higher milk yield was associated with more milkings per day.
Feed was delivered once to twice a day, but always at different times on all farms. On only two farms, feed was additionally distributed evenly throughout the day by a robotic-pusher. Since feed, along with light, is an important exogenous cue for maintaining circadian rhythms, the irregular feeding times on the farms may have affected the rhythmicity of the cows, probably even more in those farms without regular feed pushing. However, this aspect could not be verified in our study.
All farms used nighttime lighting in different sections of the barn with illuminances ranging between <10 and 66 lx. Previous studies have shown that light intensities up to 10 lx did not affect the nocturnal plasma melatonin concentrations in cattle, whereas illuminances over 50 lx reduced melatonin levels by 50–70% during the scotoperiod (Lawson and Kennedy, 2001; Muthuramalingam et al., 2006). Light stimuli at night may have suppressed melatonin concentrations and caused a circadian disruption in the rhythmicity of the cows. This, however, could not be verified based on the present data, although the large intra-variability in the melatonin concentrations of the cows may be an indication. Melatonin concentrations on the farms conformed to a diurnal pattern only on average, however the range of melatonin levels measured was consistent with the usual concentrations in cattle with lower diurnal and higher nocturnal levels (Burchard et al., 1998; Auldist et al., 2007; Castro et al., 2011).
The GLMM revealed a higher likelihood that cows showed a DFC < 72.34% in periods of higher nocturnal activity; including all nighttime activities during which the cows were in motion, e.g., milking and feeding. A higher nocturnal activity can be conditioned by the hierarchical organization of a herd. In wildlife, alpha individuals more often maintain an undisturbed activity pattern and, consequently, higher DFC levels than animals of a lower rank (Scheibe et al., 1999). Thus, a cow's position in the social herd structure could also have an effect on the activity rhythms as it influences both the milking order and the time of feed intake. Studies have shown that especially high-ranked animals occupied the milking robot during the main activity period between 12 and 6 p.m., whereas the milking and feeding times of low-ranking cows increasingly shifted to the evening and night hours (Ketelaar-de Lauwere et al., 1996; Wiktorsson and Sørensen, 2004). In addition, an increased number of nighttime milkings led to reduced nocturnal melatonin concentrations in dairy cows that consequently spent more time in the illuminated waiting area of the AMS during night compared to cows with lower nighttime milking frequency (Helmreich et al., 2016). Consequently, increased nocturnal activity can lead to a timing shift in activity or rhythm abnormalities, which has been linked to a higher risk of diseases in human research (Wickwire et al., 2017). Similarly, Wagner et al. (2021) identified circadian abnormalities in cows associated with health problems, reproductive events (calving/estrus) and external stressors (e.g., relocation). In fact, hormonal changes (Shahriar et al., 2016) and health impairments such as lameness and mastitis (Weary et al., 2009) or metabolic diseases (Edwards and Tozer, 2004; Steensels et al., 2017) can usually be detected by altered activity and feeding behavior. Such stressful conditions could, in turn, imbalance the inner state, as the circadian framework appears to be sensitive to changes in physiological or pathological state (Veissier et al., 2017). In addition, estrus, illness or injury usually involves separation, veterinary monitoring or medication administration. These interventions, among other management events, present unfamiliar situations and thus generally cause stress in cattle (Boissy and Le Neindre, 1997; Hernandez et al., 2014). Some of these actions were also recorded in our study, for which the cows were restrained in the feeding fence. Consequently, the human interventions affected the time budget of the cows and induced stress for a certain duration and intensity, which may have had a negative effect on the rhythmicity of the cows.
The influencing factors mentioned cannot be considered as evidence for effect causality. However, based on a conditional model, the relationship between predictors and the likelihood of high rhythmic activity in individual dairy cows could be successfully investigated under practice conditions.
Conclusion
In this pilot study, calculating the Degree of Functional Coupling was used for the first time to assess the activity pattern of dairy cows in AMS. It has been demonstrated that dairy cows can express ultra- and circadian activity rhythms in such systems. However, the periodicities and constancy of these patterns varied greatly between and within individuals. It was further demonstrated that a higher ratio of daytime to nighttime activity, a longer milking interval and a lower number of lactation were associated with improved rhythmicity of the cows. In addition, cows did show a day-/night difference in mean melatonin concentration despite artificial lighting systems used during nighttime in barns. In a next step, the meaning of the activity rhythm for the animal welfare in dairy farming will be further investigated.
Data Availability Statement
The datasets presented in this article are not readily available because of data security reasons. Requests to access the datasets should be directed to PF, cGF0cmljaWEuZnVjaHNAYWdyb3Njb3BlLmFkbWluLmNo.
Ethics Statement
The animal study was reviewed and approved by the Thurgau Veterinary Office, Switzerland. Informed consent was obtained from the owners for the participation of their animals in this study.
Author Contributions
CU and FA conceived and designed the study. PF conducted the data collection and collaborated with FA in analyzing the data and drafted the manuscript. AS contributed to the statistical analysis and relevant text sections of the manuscript. RB took responsibility for the laboratory analysis of the data. All authors collaborated in revising the manuscript, read, and approved the submitted version.
Conflict of Interest
The authors declare that the research was conducted in the absence of any commercial or financial relationships that could be construed as a potential conflict of interest.
Publisher's Note
All claims expressed in this article are solely those of the authors and do not necessarily represent those of their affiliated organizations, or those of the publisher, the editors and the reviewers. Any product that may be evaluated in this article, or claim that may be made by its manufacturer, is not guaranteed or endorsed by the publisher.
Acknowledgments
The authors gratefully acknowledge the collaboration and hospitality of the four dairy farmers during the experiment. Furthermore, we thank Chantal Philipona for the laboratory analysis of the saliva samples. The assistance of Giulia Bozzolini during the weekly pedometer checks on the farms and the support of Gro Holst, Markus Keller, and Martin Schlatter during the 24-h sampling period are highly appreciated. Many thanks also to Roland Nasser who contributed to the creation of individual graphics.
Supplementary Material
The Supplementary Material for this article can be found online at: https://www.frontiersin.org/articles/10.3389/fanim.2022.839906/full#supplementary-material
References
Amaral, F. G. D., and Cipolla-Neto, J. (2018). A brief review about melatonin, a pineal hormone. Arch. Endocrinol. Metabol. 62, 472–479. doi: 10.20945/2359-3997000000066
Auldist, M. J., Turner, S. A., Mc Mahon, C. D., and Prosser, C. G. (2007). Effects of melatonin on the yield and composition of milk from grazing dairy cows in New Zealand. J. Dairy Res. 74, 52–57. doi: 10.1017/S0022029906002160
Bagheri Hosseinabadi, M., Ebrahimi, M. H., Khanjani, N., Biganeh, J., Mohammadi, S., and Abdolahfard, M. (2019). The effects of amplitude and stability of circadian rhythm and occupational stress on burnout syndrome and job dissatisfaction among irregular shift working nurses. J Clin Nurs. 28, 1868–1878. doi: 10.1111/jocn.14778
Bar-Joseph, Z., Gitter, A., and Simon, I. (2012). Studying and modelling dynamic biological processes using time-series gene expression data. Nat. Rev. Genet. 13, 552–564. doi: 10.1038/nrg3244
Bates, D., Maechler, M., Bolker, B., Walker, S., Christensen, R. H. B., Singmann, H., et al. (2022). Linear Mixed-Effects Models using ‘Eigen’ and S4. Available online at: https://github.com/lme4/lme4 (accessed March 1, 2022).
Berger, A. (2011). Activity patterns, chronobiology and the assessment of stress and welfare in zoo and wild animals. Int. Zoo Yearb. 45, 80–90. doi: 10.1111/j.1748-1090.2010.00121.x
Berger, A., Scheibe, K. M., Brelurut, A., Schober, F., and Streich, W. J. (2002). Seasonal variation of diurnal and ultradian rhythms in red deer. Biol. Rhythm Res. 33, 237–253. doi: 10.1076/brhm.33.3.237.8259
Berger, A., Scheibe, K. M., Michaelis, S., and Streich, W. J. (2003). Evaluation of living conditions of free-ranging animals by automated chronobiological analysis of behavior. Behav. Res. Methods Instrum. Comput. 35, 458–466. doi: 10.3758/BF03195524
Boissy, A., and Le Neindre, P. (1997). Behavioral, cardiac and cortisol responses to brief peer separation and reunion in cattle. Physiol. Behav. 61, 693–699. doi: 10.1016/S0031-9384(96)00521-5
Bracke, M. B. M., and Hopster, H. (2006). Assessing the importance of natural behavior for animal welfare. J. Agric. Environ. Ethics 19, 77–89. doi: 10.1007/s10806-005-4493-7
Burchard, J. F., Nguyen, D. H., and Block, E. (1998). Effects of electric and magnetic fields on nocturnal melatonin concentrations in dairy cows. J. Dairy Res. 81, 722–727. doi: 10.3168/jds.S0022-0302(98)75628-0
Calcagno, V. (2020). Model Selection and Multimodel Inference Made Easy. Available online at: https://cran.r-project.org/web/packages/glmulti (accessed September 30, 2021).
Castro, N., Spengler, M., Lollivier, V., Wellnitz, O., Meyer, H. H. D., and Bruckmaier, R. M. (2011). Diurnal pattern of melatonin in blood and milk of dairy cows. Milchwissenschaft 66, 352–353.
Dawkins, M. S. (2021). Does smart farming improve or damage animal welfare? technology and what animals want. Front Anim Sci. 2, e736536. doi: 10.3389/fanim.2021.736536
Edwards, J. L., and Tozer, P. R. (2004). Using activity and milk yield as predictors of fresh cow disorders. J. Dairy Sci. 87, 524–531. doi: 10.3168/jds.S0022-0302(04)73192-6
Flury, R., and Gygax, L. (2016). Daily patterns of synchrony in lying and feeding of cows: quasi-natural state and (anti-) synchrony factors. Behav. Processes 133, 56–61. doi: 10.1016/j.beproc.2016.11.004
Fraser, D. (2008). Understanding animal welfare. Acta. Vet. Scand. 50, 1–12. doi: 10.1186/1751-0147-50-S1-S1
Hartig, F., and Lohse, L. (2021). Residual Diagnostics for Hierarchical (Multi-Level/Mixed). Available online at: https://github.com/florianhartig/DHARMa (accessed September 30, 2021).
Helmreich, S., Wechsler, B., Hauser, R., and Gygax, L. (2016). Effects of milking frequency in automatic milking systems on salivary cortisol, immunoglobulin A, somatic cell count and melatonin. Schweiz. Arch. Tierheilkd. 158, 179–186. doi: 10.17236/sat00054
Hernandez, C. E., Thierfelder, T., Svennersten-Sjaunja, K., Berg, C., Orihuela, A., and Lidfors, L. (2014). Time lag between peak concentrations of plasma and salivary cortisol following a stressful procedure in dairy cattle. Acta. Vet. Scand. 56, 61. doi: 10.1186/s13028-014-0061-3
Hoogenboom, I., Daan, S., Dallinga, J. H., and Schoenmakers, M. (1984). Seasonal change in the daily timing of behaviour of the common vole, Microtus arvalis. Oecologia 61, 18–31. doi: 10.1007/BF00379084
Jacobs, G. H., Deegan, J. F., and Neitz, J. II (1998). Photopigment basis for dichromatic color vision in cows, goats, and sheep. Vis. Neurosci. 15, 581–584. doi: 10.1017/S0952523898153154
Jacobs, J. A., and Siegford, J. M. (2012). Invited review: the impact of automatic milking systems on dairy cow management, behavior, health, and welfare. J. Dairy Sci. 95, 2227–2247. doi: 10.3168/jds.2011-4943
James, S. M., Honn, K. A., Gaddameedhi, S., and Van Dongen, H. P. A. (2017). Shift work: disrupted circadian rhythms and sleep-implications for health and well-being. Curr. Sleep Med. Rep. 3, 104–112. doi: 10.1007/s40675-017-0071-6
Ketelaar-de Lauwere, C. C., Devir, S., and Metz, J. H. M. (1996). The influence of social hierarchy on the time budget of cows and their visits to an automatic milking system. Appl. Anim. Behav. Sci. 49, 199–211. doi: 10.1016/0168-1591(96)01030-1
Lawson, T. J., and Kennedy, A. D. (2001). Inhibition of nighttime melatonin secretion in cattle: threshold light intensity for dairy heifers. Can. J. Anim. Sci. 153–156. doi: 10.4141/A00-058
Leise, T. L., and Harrington, M. E. (2011). Wavelet-based time series analysis of circadian rhythms. J. Biol. Rhythms. 26, 454–463. doi: 10.1177/0748730411416330
Lovendahl, P., and Chagunda, M. G. (2011). Covariance among milking frequency, milk yield, and milk composition from automatically milked cows. J. Dairy. Sci. 94, 5381–5392. doi: 10.3168/jds.2010-3589
Lüdecke, D. (2021). Data Visualization for Statistics in Social Science. Available online at: https://github.com/strengejacke/sjPlot/ (accessed September 30, 2021).
McGowan, J. E., Burke, C. R., and Jago, J. G. (2007). Validation of a technology for objectively measuring behaviour in dairy cows and its application for oestrous detection. Proc. N. Z. Soc. Anim. Prod. 67, 136–142.
Mellado, M., Antonio-Chirino, E., Meza-Herrera, C., Veliz, F. G., Arevalo, J. R., Mellado, J., et al. (2011). Effect of lactation number, year, and season of initiation of lactation on milk yield of cows hormonally induced into lactation and treated with recombinant bovine somatotropin. J. Dairy Sci. 94, 4524–4530. doi: 10.3168/jds.2011-4152
Millman, S. T. (2013). Behavioral responses of cattle to pain and implications for diagnosis, management, and animal welfare. Vet. Clin. North Am. Food Anim. Pract. 29, 47–58. doi: 10.1016/j.cvfa.2012.11.007
Muthuramalingam, P., Kennedy, A. D., and Berry, R. J. (2006). Plasma melatonin and insulin-like growth factor-1 responses to dim light at night in dairy heifers. J. Pineal. Res. 40, 225–229. doi: 10.1111/j.1600-079X.2005.00303.x
Nunes Marsiglio Sarout, B., Waterhouse, A., Duthie, C.-A., Candal Poli, C. H. E., Haskell, M. J., Berger, A., et al. (2018). Assessment of circadian rhythm of activity combined with random regression model as a novel approach to monitoring sheep in an extensive system. Appl. Anim. Behav. Sci. 207, 26–38. doi: 10.1016/j.applanim.2018.06.007
Piccione, G., and Caola, G. (2002). Biological rhythm in livestock. J. Vet. Sci. 3, 145–157. doi: 10.4142/jvs.2002.3.3.145
Refinetti, R., Wassmer, T., Basu, P., Cherukalady, R., Pandey, V. K., Singaravel, M., et al. (2016). Variability of behavioral chronotypes of 16 mammalian species under controlled conditions. Physiol. Behav. 161, 53–59. doi: 10.1016/j.physbeh.2016.04.019
Scheibe, K. M., Berger, A., Langbein, J., Streich, W. J., and Eichhorn, K. (1999). Comparative analysis of ultradian and circadian behavioural rhythms for diagnosis of biorhythmic state of animals. Biol. Rhythm Res. 30, 216–233. doi: 10.1076/brhm.30.2.216.1420
Shahriar, M. S., Smith, D., Rahman, A., Freeman, M., Hills, J., Rawnsley, R., et al. (2016). Detecting heat events in dairy cows using accelerometers and unsupervised learning. Comput. Electron. Agric. 128, 20–26. doi: 10.1016/j.compag.2016.08.009
Steensels, M., Maltz, E., Bahr, C., Berckmans, D., Antler, A., and Halachmi, I. (2017). Towards practical application of sensors for monitoring animal health: the effect of post-calving health problems on rumination duration, activity and milk yield. J. Dairy Res. 84, 132–138. doi: 10.1017/S0022029917000176
Steinhilber, D. (2007). Melatonin, melatonin-rezeptor-agonisten und tryptophan als schlafmittel. Natürlicher Schlaf? Pharmazie unserer Zeit. 36, 213–217. doi: 10.1002/pauz.200600220
Toulemonde, E.-L. (2020). Automated Data Preparation. Available online at: https://github.com/ELToulemonde/dataPreparation/issues (accessed September 30, 2021).
Veissier, I., Mialon, M. M., and Sloth, K. H. (2017). Short communication: early modification of the circadian organization of cow activity in relation to disease or estrus. J. Dairy. Sci. 100, 3969–3974. doi: 10.3168/jds.2016-11853
Vir Singh, S., and Kumar, S. (2018). Circadian rhythm and their significance in relation to physiological functions of animals: a review. J. Entomol. Zool Stud. 6, 1861–1866.
Wagner, N., Mialon, M. M., Sloth, K. H., Lardy, R., Ledoux, D., Silberberg, M., et al. (2021). Detection of changes in the circadian rhythm of cattle in relation to disease, stress, and reproductive events. Methods 186, 14–21. doi: 10.1016/j.ymeth.2020.09.003
Weary, D. M., Huzzey, J. M., and von Keyserlingk, M. A. G. (2009). Board-invited review: using behavior to predict and identify ill health in animals. J. Anim. Sci. 87, 770–777. doi: 10.2527/jas.2008-1297
Weary, D. M., Niel, L., Flower, F. C., and Fraser, D. (2006). Identifying and preventing pain in animals. Appl. Anim. Behav. Sci. 100, 64–76. doi: 10.1016/j.applanim.2006.04.013
Werkheiser, I. (2020). Technology and responsibility: a discussion of underexamined risks and concerns in precision livestock farming. Anim. Front. 10, 51–57. doi: 10.1093/af/vfz056
Wickwire, E. M., Geiger-Brown, J., Scharf, S. M., and Drake, C. L. (2017). Shift work and shift work sleep disorder: clinical and organizational perspectives. Chest 151, 1156–1172. doi: 10.1016/j.chest.2016.12.007
Wiktorsson, H., and Sørensen, J. T. (2004). Implications of Automatic Milking on Animal Welfare. Wageningen: Wageningen Academic Publishers.
Xie, Y., Tang, Q., Chen, G., Xie, M., Yu, S., Zhao, J., et al. (2019). New insights into the circadian rhythm and its related diseases. Front Physiol 10, 682. doi: 10.3389/fphys.2019.00682
Keywords: chronobiology, time series analysis, activity behavior, dairy cows, AMS, free cow traffic, Degree of Functional Coupling (DFC)
Citation: Fuchs P, Adrion F, Shafiullah AZM, Bruckmaier RM and Umstätter C (2022) Detecting Ultra- and Circadian Activity Rhythms of Dairy Cows in Automatic Milking Systems Using the Degree of Functional Coupling—A Pilot Study. Front. Anim. Sci. 3:839906. doi: 10.3389/fanim.2022.839906
Received: 20 December 2021; Accepted: 21 February 2022;
Published: 17 March 2022.
Edited by:
Pol Llonch, Universitat Autònoma de Barcelona, SpainReviewed by:
Marie J. Haskell, Scotland's Rural College, United KingdomHayley Randle, Charles Sturt University, Australia
Copyright © 2022 Fuchs, Adrion, Shafiullah, Bruckmaier and Umstätter. This is an open-access article distributed under the terms of the Creative Commons Attribution License (CC BY). The use, distribution or reproduction in other forums is permitted, provided the original author(s) and the copyright owner(s) are credited and that the original publication in this journal is cited, in accordance with accepted academic practice. No use, distribution or reproduction is permitted which does not comply with these terms.
*Correspondence: Patricia Fuchs, cGF0cmljaWEuZnVjaHNAYWdyb3Njb3BlLmFkbWluLmNo