 Mathieu Bonneau
 Xavier Godard2
 Jean-Christophe Bambou
- 1Agroecology, Genetic and Tropical Livestock Farming System (ASSET), INRAE, Petit-Bourg, France
- 2UE PTEA Tropical Platform For Animal Experimentation, INRAE, Petit-Bourg, France
The recent advances in sensor technologies and data analysis could improve our capacity to acquire long-term and individual dataset on animal behavior. In livestock management, this is particularly interesting when behavioral data could be linked to production performances, physiological or genetical information, with the objective of improving animal health and welfare management. In this study, we proposed a framework, based on computer vision and deep learning, to automatically estimate animal location within pasture and discuss the relationship with the risk of gastrointestinal nematode (GIN) infection. We illustrated our framework for the monitoring of goats allowed to graze an experimental plot, where feces containing GIN infective larvae were previously dropped in delimited areas. Four animals were monitored, during two grazing weeks on the same pasture (week 1 from April 12 to 19, 2021 and week 2, from June 28 to July 5, 2021). Using the monitoring framework, different components of animal behavior were analyzed, and the relationship with the risk of GIN infection was explored. First, in average, 87.95% of the goats were detected, the detected individuals were identified with an average sensitivity of 94.9%, and an average precision of 94.8%. Second, the monitoring of the ability of the animal to avoid infected feces on pasture showed an important temporal and individual variability. Interestingly, the avoidance behavior of 3 animals increased during the second grazing week (Wilcoxon rank sum, p-value < 0.05), and the level of increase was correlated with the level of infection during week 1 (Pearson's correlation coefficient = 0.9). The relationship between the time spent on GIN-infested areas and the level of infection was also studied, but no clear relationship was found. In conclusion, due to the low number of studied animals, biological results should be interpreted with caution; nevertheless, the framework provided here is a new relevant tool to explore the relationship between ruminant behavior and GIN parasitism in experimental studies.
Introduction
Goats are an important resource mainly for meat and milk production. In 2019, the number of farmed animals was estimated at more than 870 million (http://www.fao.org/faostat), with approximately 94% of the animals located in Asia and Africa. Infection with gastrointestinal nematode (GIN) parasites is one of the main health constraints, responsible for reduced performances production and increased mortality, especially in young animals and adult females, during the periparturient period. One of the most pathogenic GIN is Haemonchus contortus, known as the barber pole worm, for the red color of the digestive tract due to its blood-feeding activity, against the white reproductive tract of the female. The ecological niche of adult H. contortus is the abomasum, where female worms can release up to 10,000 eggs daily, which then arrive on the pasture through the feces. In the past, GIN management successfully relied on systematic anthelmintic (AH) treatment. Unfortunately, resistant GIN populations to AH were gradually selected (Kaplan and Vidyashankar, 2012). Thus, it is now widely admitted that relying only on AH is not a sustainable strategy (Charlier et al., 2018).
Several alternatives to manage GIN infection in small ruminant production have been investigated, most of them relying on prevention, for example, genetic selection of resistant animals or optimal pasture management. The objective of the latter is to reduce the parasite burden on the pasture and therefore the risk of infection during grazing, by taking into account the life cycle of the parasites. Modeling is an important tool to understand the interactions between the different management alternatives and could be used to design sustainable strategies, adapted to the farming system. This requires both a good understanding of the GIN population dynamic and the impact of the different management strategies on the GIN population. Models of GIN population dynamic on pasture (Rose et al., 2015) or within the host (Louie et al., 2005; Saccareau et al., 2016) are available in the literature, but the dynamic of GIN ingestion, that is, timing and quantity of ingested GIN, is not well described. However, accounting for the dynamic of GIN ingestion and for individual variability can have an important impact on the entire GIN population dynamic (Cornell et al., 2004; Fox et al., 2013; Bonneau et al., 2018). Modeling ingestion is a complex task, mainly because of the difficulty to estimate the spatial distribution of GIN on pasture and the number of GIN ingested in each bite. The recent developments in precision livestock farming tools offer new opportunities, especially to characterize animal behavior, and to study the relationship with GIN infection.
Most of the studies that consider the relationship between animal behavior and GIN infection focused on the capacity of the animal to avoid feces. To our knowledge, all the studies relied on visual observations, either directly or from video recording, and most of them were performed in sheep. In particular, several studies showed that sheep were able to avoid feces during grazing (Hutchings et al., 2006), and avoidance was greater for the infected animals (Hutchings et al., 1999; Cooper et al., 2000) and decreased with the age of feces (Hutchings et al., 1998). For goats, the only study conducted (Brambilla et al., 2013), underlined the fecal avoidance capacity of wild Alpine Ibex. However, no relationship between avoidance and infection level was found. Moreover, social behavior can influence the animal diet, with the dominant animals having the opportunity to be more selective (Barroso et al., 2000), and thus potentially avoid more easily the infested areas. One study investigated this relationship between social behavior and GIN infection in goat (Ungerfeld and Correa, 2007). It has been shown that the degree of infection, measured through the fecal egg count (FEC, number of GIN eggs per gram of feces), of the most dominant goats was significantly lower.
Here, we proposed an experimental framework to study the relationship between animal behavior and GIN infection. We designed a pasture where the quantity and location of infected feces were known. Our first objective was to study the ability of the goats to avoid feces, and the second was to study the relationship between the time spent on infected areas and the level of infection. The experimental framework was based on automatic monitoring of the animals using image analysis (Li et al., 2021). Convolutional neural networks (CNNs) are generally the most adapted image analysis tool and has been used successfully, mostly for pigs (e.g., Yang et al., 2019; Zhang et al., 2019; Marsot et al., 2020; Zheng et al., 2020; Gan et al., 2021), but also for goats (e.g., Wang et al., 2018; Bonneau et al., 2020; Min et al., 2020; Su et al., 2021). Several methods for cattle monitoring also successfully identified animals using CNN and other deep-learning technics (William et al., 2017; Qiao et al., 2019; Achour et al., 2020). The main advantage of using CNN is that powerful models, trained on millions of images and designed by research teams with relevant engineering skills, are available free of charge. Then, new users can almost directly use these CNNs, just by retraining some parameters to be able to detect and classify their objects of interest. In this article, we proposed to use YOLO (Redmon and Farhadi, 2017) associated with resNet-50 (He et al., 2016) to detect and identify the animals.
Materials and Methods
All animal care handling techniques and procedures were approved by the French Ethics Committee n°069 (Comité d'Ethique en Matière d'Expérimentation Animale des Antilles et de la Guyane, CEMEAAG) authorized by the French Ministry of Higher Education, Research and Innovation. The experiment was performed at the INRA Experimental Facilities PTEA (Plateforme Tropicale d'Expérimentation sur l'Animal) according to the certificate number A 971-18-02 of authorization to experiment on living animals issued by the French Ministry of Agriculture.
Experimental Setup
The experiment was organized in three stages. The first stage was a controlled environment stage, with low or no risk of infection, the second stage was the grazing stage, where the animals were exposed to GIN during grazing, and the third stage was a controlled environment stage, again with low or no risk of infection, where the GIN level of infection due to GIN ingestion during the second stage was monitored.
The experiment was first conducted during week 1, from April 12 to 19, 2021, and repeated during week 2, from June 28 to July 5, 2021. The same pasture and animals were used for the 2 weeks.
Illustrations and schematic representation of the experiment are available in Figure 1.
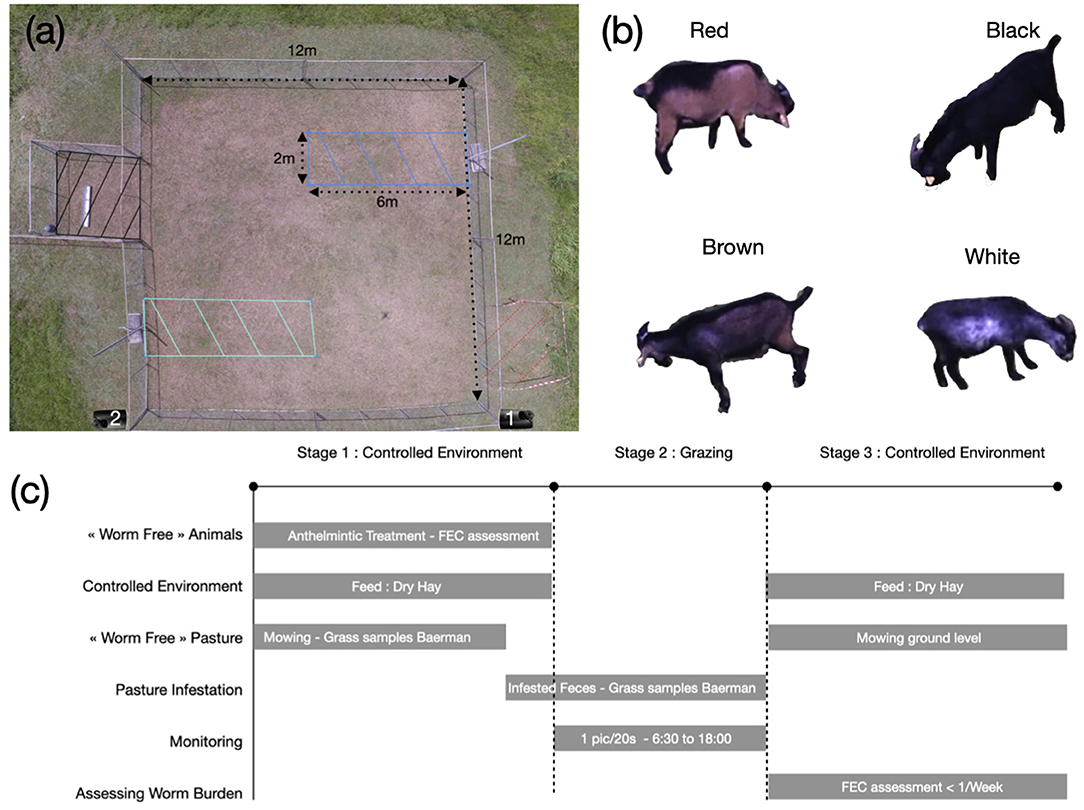
Figure 1. (a) Pasture setup. The green and blue dashed zones are the infested areas A and B. The black dashed square is the resting area. During experiment, we placed a sheet of metal inside the area to produce shade. The red area is the control area, to estimate the number of infected larvae on pasture. During week 2, the control area was located on the opposite side of pasture (not displayed here). On week 1, we used the camera located on the bottom right corner of the pasture and on the bottom left on week 2. (b) Picture example of the four Creole goats used during the experiment. (c) Schematic representation of the experiment.
Animals
Four male Creole goats were selected to maximize color differences between individuals. The first goat, referred as white, had a black coat with white color patches on the belly, weighed 34.13 kg and was 16 months old at the beginning of the experiment. The second goat, referred as brown, has a brown coat with a black strip on the back, weighed 33.93 kg and was 12 months and 17 days old at the beginning of the experiment. The third goat, referred as black, had a homogeneous black coat, weighed 31.62 kg and was 12 months and 17 days old at the beginning of the experiment. The last goat, referred as red, had a reddish brown coat with a black strip on the back, weighed 39.92 kg and was 12 months and 11 days old at the beginning of the experiment.
The animals from different sire origins were raised at pasture and exposed to natural GIN infection, until the first stage of the experiment. No parasitological measure was performed during the period at pasture. Before the experiment, all animals were drenched. One drenches at 6 weeks old, 10 weeks old, and then for weaning, at 12–14 weeks old. Animals were finally drenched at 5 months old and then every 2 months.
Stages 1 and 3: Controlled Environment
The animals were drenched with moxidectine (Cydectine® 0.1%, Fort Dodge Veterinaria S.A., Tours, France, 300 μg/kg of liveweight) at the beginning of stage 1 of week 1, and with levamisole (Biaminthic 5%, Laboratoire Biard, Arques, France, 7.5 mg/kg of liveweight) for week 2. The efficacy of the AH treatments was controlled by measuring the fecal egg count (FEC) 1 week before grazing. To assess the individual FEC, approximately 5 g of feces was collected from the rectum and directly transported to the laboratory using plastic tubes to avoid contamination. The feces samples were analyzed individually using a modified McMaster technic. The FEC was expressed as the number of GIN eggs per gram of feces (EPG, Aumont et al., 1997). For week 2, the animals were drenched a second time, after the FEC analysis revealed the presence of eggs at a low level. Thereafter, the individual FEC was reassessed on the first grazing day, to confirm that no eggs can be found in the feces. In any case, the AH treatments were performed considering their persistence to avoid any bias. Before and after grazing (stages 1 and 3), the animals were maintained together in a stall and were fed with dry hay to avoid parasite ingestion outside of the grazing week. After grazing, FEC was assessed at least every week, starting 8 days after grazing.
Stage 2: Grazing
We designed a square pasture of 144 m2, with a semiclosed adjacent area of 9 m2, equipped with fresh tap water. This area was used by the animals to rest and to be protected from the rain and sun. To define the infested areas, we delimited two rectangles of 2 m ×6 m=12 m2 each (infested areas A and B). The areas were delimited with metallic bars sinked into the ground, with only 20 cm of the bar above the ground, to avoid disrupting animal behavior. The pasture was flat, to limit GIN movement on pasture due to water flow.
The pasture was worm-free (never grazed) before the experiment and was mowed 1 month before the beginning of grazing on week 1. Grass height was measured with an herbometer on n spots. When grazing started, grass was in average 7.32 cm (n = 22) in the non-infested areas, 8 cm (n = 8) in the infested area A and 8.3 cm (n = 9) in the infested area B. At the end of grazing on week 1, grass was mowed at ground level to limit the persistence of parasites on the infested areas. However, the mowed grass was not removed from the pasture. Thereafter, 20 days before grazing on week 2, grass and ground samples were collected in the infested and non-infested areas to guarantee that parasites were not present on pasture. We used a Baerman technic to extract parasites from the samples, and no GIN infective larvae were observed. When grazing started on week 2, the grass was in average 10.7 cm (n = 23) in the non-infested area, 10.8 cm (n = 11) in infested area A, and 9.3 cm (n = 12) in infested area B.
A total of 900 g of infected feces were dropped homogeneously within each infested area. Feces were dropped manually 13 days before grazing on week 1 and 10 days before grazing on week 2, to maximize the number of infective larvae on pasture during grazing. On week 1, feces were obtained from 10 naturally infected animals. Although other GIN species could be present, animals are generally mostly infected by H. contortus. The feces were mixed homogeneously and FEC was estimated from 10 different samples (mean FEC = 576 eggs/g, std = 265 eggs/g). On week 2, feces were obtained from 16 experimentally infected animals with H. contortus (Cériac et al., 2019). FEC was assessed for each animal (mean FEC = 4431 eggs/g, std = 43.8 eggs/g), and feces were mixed together homogeneously.
To estimate the number of infective larvae on the infested areas, 6 control feces samples of 80 g each were dropped in 30 cm square quadrats, outside of the pasture. Two grass samples were then collected from two quadrats, on the 1st, 3rd, and 6th grazing days for week 1 and on the 1st, 3rd, and last grazing days for week 2. The number of infective larvae was then measured after isolation with the Baerman technique. The number of larvae found from the two control samples was averaged to interpolate the number of larvae in the infested areas, from the 900 g of feces:
where is the estimated number of infective larvae inside an infested area, and are the number of infected larvae found in the first and second control samples.
Recording With Time-Lapse Cameras
We used a construction time-lapse camera (Brinno TLC2000 pro 2018), equipped with waterproof plastic protection. The camera records at 1.3 Mpx with a resolution of 1,208 ×720 using jpeg compression. It was set up to take one picture every 20 s from 6:30 am to 6 pm. The analysis of the images acquired during week 1 showed that the camera was facing the sun during sunrise, which decreases the quality of the images. As a consequence, the location of the camera was adapted accordingly for week 2 (see Figure 1).
Animal Monitoring
An algorithm was developed to analyze each image of the time-lapse camera independently. The algorithm was decomposed into two steps: (i) to detect the animals on the picture and (ii) to identify the detected animals, that is, white, brown, black, or red.
Animal Detection
To detect animals, a common approach was used, based on the CNN YOLO v2 (Redmon and Farhadi, 2017), known to run fast, with high accuracy and high learning capacities.
YOLO divides the image into grid cells of various sizes and predicts what objects are present into each cell. Then, a combination of different techniques allowed to find the exact bounding boxes around the detected objects, by reasoning on the global image. For image feature extraction, YOLO can be used with classical CNNs for image classification. For our purpose, we trained one version of YOLO based on inception v3 (Szegedy et al., 2016) and another version based on resNet-50 (He et al., 2016). Each network was trained on the same set of 3,820 images, where the goats were manually labeled. We performed an empirical evaluation of the two networks and found that the architecture based on resNet-50 provided better results.
In very few cases, YOLO returned more than 4 detections, mostly when multiple bounding boxes were associated with the same animal. When more than four bounding boxes were found, a non-max suppression method was used to remove the overlapping bounding boxes, and the four bounding boxes with the highest probability were selected.
To compute the different animal behavior variables, only the detection inside the pasture was considered, whereas the detections inside the resting area were not considered. In this area, it was particularly difficult to differentiate the animals, due to the shadow and occlusion.
Individual Identification
The results of the YOLO detection stage were a set of bounding boxes, (xa, ya, wa, ha)a = 1…n, around the detected animals, where xa and ya were the column and row numbers of the top left corner of the bounding box number a. wa and ha were the width and height of the bounding box, and n was the number of bounding boxes or detected animals. We then moved to the next step: identifying the animals inside each bounding box.
This second step is an image classification problem, with 4 different classes, white goat, brown goat, black goat, and red goat. There are several CNNs that are available free of charge and trained on more than one million images to perform image classification. Even though these CNNs are generally trained to recognize common objects such as dogs, stop signs, or humans, their architecture and most of their layers can be directly used to recognize new classes, which is known as transfer learning. Two different CNNs were also tested, resNet-50, and inceptionV3. In each case, only the parameters of the last 10 layers were retrained. When labeling the training images for YOLO, the color of the animals was also labeled. Thus, the 3,200 training images labeled for YOLO were used, to extract 12,236 images with color labels. In total, approximately 3,400 images were available for the white goat and 2,900 images for the other goats. A total of 70% of the dataset were used to retrain the CNNs and 30% to evaluate their performance. resNet-50 provided higher sensitivity and precision values and was used for the analysis.
Compared to other image classification problem, an extra information was available: two detections cannot be in the same class. Instead of using the prediction of the CNN directly, we used it to compute the probability of each bounding box being from an animal of the four different colors. For each bounding box number a (xa, ya, wa, ha), the CNN associated a set of probabilities . A score was then calculated for each possible color configuration of the bounding boxes. If ca is the color of the bounding box number a, the score of a configuration (c1, …, cn) is simply the sum of the probabilities of the bounding boxes to be in that colors:
Finally, the color configuration with the highest score was chosen.
Evaluation
To evaluate the capacity of the method to detect and identify animals, a MATLAB application was designed to select randomly an image on the data bank and displayed the detected animals with their estimated color. For each color (i.e., white, brown, black, and red), the user first selected if the animal was detected, non-detected, or absent (i.e., inside the resting area). When the animal was detected, the user also had to select the estimated color. A second script was designed to manually record the location of the missed detection.
We ran the application to control more than 600 images for each week. To assess the capacity of the method to detect the animals, we computed the percentage of detected animals. For each color, the percentage of detection is equal to . Where nbD is the number of images where the animal is detected and nbND is the number of images where the animal was not detected.
To assess the capacity of the method to identify the animals, we compared the estimated and true color of each detection. Then, we evaluated the sensitivity and precision for each color class.
Animal's Behavior
Avoidance Capacity
To characterize the capacity of the animals to avoid infested areas, the number of times each animal was detected on the infested and non-infested areas was computed. To compare the two quantities, the number of detections was normalized by the surface area of each zone, which provided a number of detections per m2. Finally, the avoidance index was defined as the ratio of the number of detections per m2 inside the non-infested and the infested areas:
Where dnia is the number of detection inside the non-infested area and dia is the number of detection inside the two infested areas A and B. We recall that the non-infested area is 120 m2 and the infested areas is 2 m×12 m = 24 m2.
An avoidance index >1 means that the number of detections per m2 was strictly higher for the non-infested area. The greater was the avoidance index, the greater was fecal avoidance.
Note that with our framework, grazing and non-grazing animals could not be distinguished, which biases the computation of the avoidance index. In future works, the avoidance index should be computed only with the detection corresponding to grazing animals.
Larval Exposure and FEC
The relationship between the time spent on infested areas A and B, the number of larvae on pasture, and the animal's FEC after grazing was explored.
To quantify the individual grazing time inside the infested areas, we first calculated the proportion of time each animal spent in these areas, which was easily obtained from the animal monitoring framework. It is defined as the ratio between the number of time the animal was detected inside the infested areas and the number of pictures available per day. Then, the amount of time, in minutes, on the entire day, from sunrise to sunset was simply interpolated.
To quantify the daily quantity of larvae inside the pasture, we first computed a linear interpolation of the number of larvae inside the two infested areas during the 7 grazing days. The linear interpolation consisted in connecting two observations with a straight line.
To summarize these two data, we defined the exposure index, as the sum of the daily products between the grazing time inside the infested areas and the number of larvae. For an animal, the exposure index is thus as follows:
where is the proportion of time spent inside infested areas A and B during day t. tDaylight is the daylight duration, in minutes. is the interpolated amount of time spent inside infested areas during day t. In addition, nlt is the number of estimated larvae, inside the two infested areas, on day t.
The exposure index quantify is used to quantify the animal exposure to larvae, and it is monotonically increasing with the quantity of larvae available on pasture and the time spent on infested areas.
Finally, the logarithm of the area under the FEC curve (LAF) of each animal was used to estimate the level of infection. The LAF allowed the characterization of the infection dynamic over the entire measurement period. The logarithm was used for a better clarity of the graphical representation.
Statistical Analyses
All the statistical analyses were performed using MATLAB R2021a.
The correlation between the individual LAF obtained on week 1, denoted LAFi for animal i = 1, …, 4, and the increase in the weekly avoidance on week 2, denoted AVi, was studied using the Pearson's correlation coefficient. It is equal to:
where μLAF and σLAF are the mean and standard deviation of the individual LAF obtained on week 1. In addition, μAV and σAV are the mean and standard deviation of the increase in the weekly avoidance on week 2.
We also compared the avoidance index of each animal between weeks 1 and 2, to detect changes in the avoidance capacity using a Wilcoxon rank test, with 5% significance level. More precisely, if , is the vector of the daily avoidance index for animal i during week w, we performed a Wilcoxon rank test between samples , to test the null hypothesis that the two samples had equal mean.
Results
Sward Height
The sward height at the start and at the end of the grazing week is available in Table 1. For both week, grass intake was relatively similar inside infested area A and the non-infested area. Grass intake was lower inside infested area B, which is explained by a small patch of non-grazed sedges, belonging to the family of the cyperaceae.
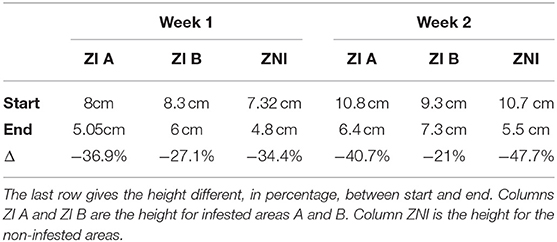
Table 1. Sward height when grazing started and ended, for the first and second experimental week.
Number of Haemonchus contortus-Infective Larvae in the Infested Areas
The estimated number of H. contortus -infective larvae per infested area is available in Figure 2. When grazing started, there were more than 14,000 larvae available on the grass of each infested area. Surprisingly, in week 2, where the feces were much more infected than in week 1, the number of available larvae was approximately the same at the beginning. However, the population was relatively constant on day 3 in week 2. On the contrary, the population was 44.8% lower on day 3 in week 1.
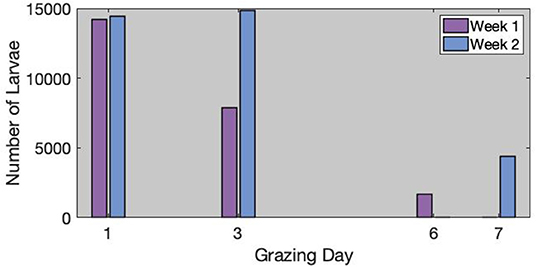
Figure 2. Estimated number of larvae inside each infected areas for week 1 (left) and week 2 (right). We used square mark when the number of larvae was estimated from the control samples, and star marks when it was interpolated from the observations.
Post Grazing Worm Burden
The individual FEC for the first and second weeks is available in Figure 3. The FEC remained relatively low (<4, 000 EPG) after week 1. The brown goat had the highest FEC value (mean FEC = 2653 eggs/g). On the last FEC measurement, the black and white goats had relatively similar FEC values, close to 2,000, although the white goat had lower FEC at the beginning (mean FEC = 934 eggs/g for the white and 1,467 eggs/g for the black). The FEC of the red goat did not exceed 700 eggs/g, which could be considered as a low level of infection.
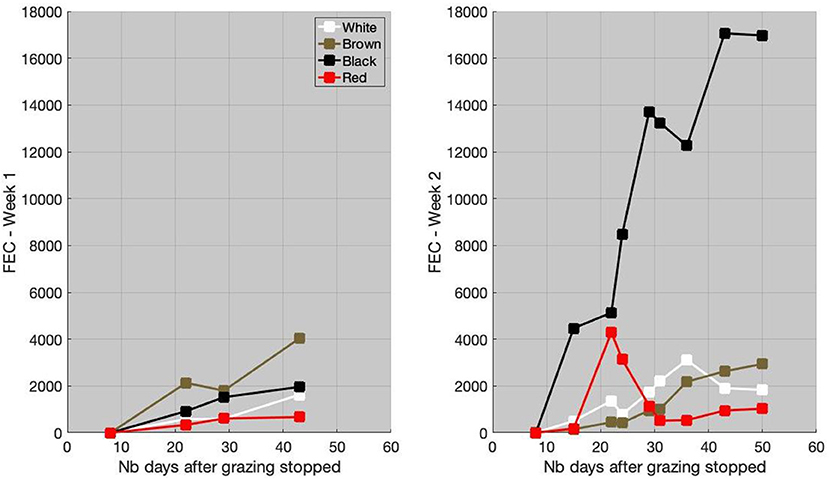
Figure 3. Individual fecal egg count (FEC), in eggs/g of feces, for week 1 (left) and week 2 (right), as a function of the number (Nb) of days after grazing stopped.
After week 2, the level of infection of the black goat was high with FEC value close to 17,000 eggs/g (mean FEC = 11,415 eggs/g). The FEC of white and brown goats was similar, with a maximal value close to 3,000 eggs/g (mean FEC = 1,679 eggs/g for white and 1,342 eggs/g for brown). A peak of FEC (4,290 eggs/g) for the red goat was observed 21 days after the grazing period. Thereafter, the FEC decreased to reach levels similar to the white and brown goats (mean FEC = 1,473 eggs/g).
Animal Detection and Identification
The percentage of animal detected is available in Table 2. The average detection rate was estimated at 86% during week 1 and 89.9% during week 2. The white goat had the highest detection rate (95%). The white coat patches on the belly of this goat was highly discriminant and certainly helped the detection and identification by the algorithms. The red and black goats had similar detection rates (89.45 and 87.9% respectively), whereas the brown goat was the one with the lowest detection rate (79.4%). As shown in Figure 4, most of the missed detections were located on the part of the pasture farthest from the camera. It has also been noted that missed detection could occurred when the goats were close from each other. In this case, only one goat was detected.
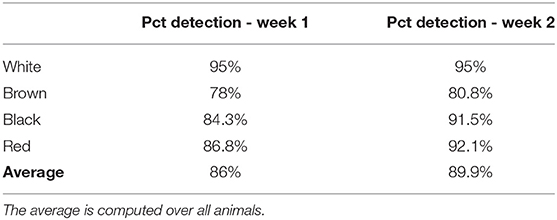
Table 2. Percentage of detection of the animal detection method.
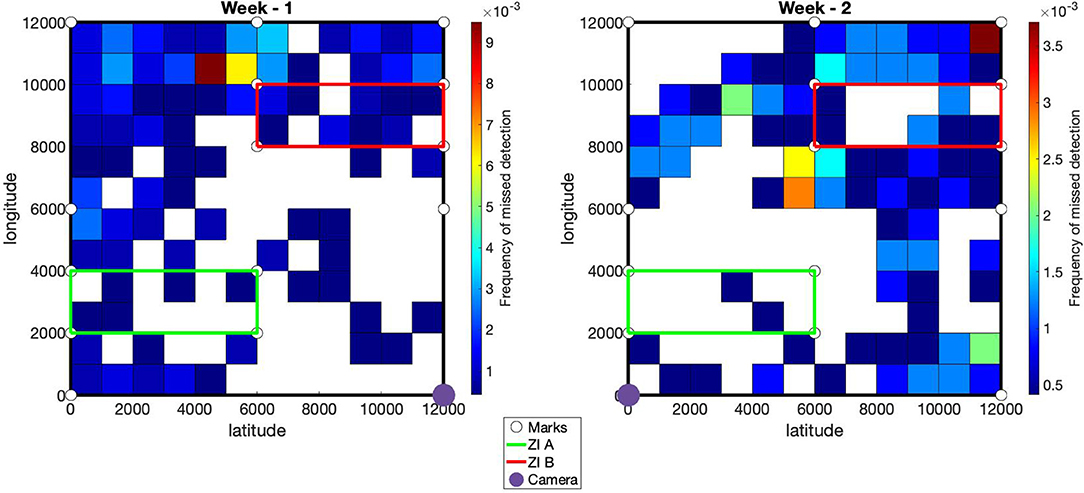
Figure 4. Spatial frequency of missed detections. The pasture is delimited by the black lines. The green and red lines define infected areas A and B. The white disks provide the locations of the marks used to fit the geometric transformation from pixels to spatial coordinates. For each week, the location of the camera is defined by the purple disk.
The sensitivity and precision of the animal identification method are available in Table 3. The average sensitivity was close to 95% for each week. We observed confusion between the brown and red goats, which had similar shade. There was also some confusion between black and white goats, which had most of the coat of black color. When the white coat patches on the belly was not visible, the identification method recognized the white goat as the black one. As for the detection method, a better sensitivity and precision during week 2 were observed. During week 2, the camera was never facing the sun, which increased the image quality and as a consequence, the quality of the detection and identification methods. The number of missed detections was highest between 6 am to 8 am for week 1.
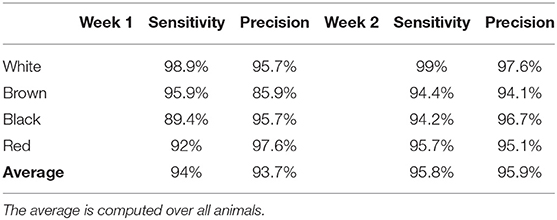
Table 3. Sensitivity and precision of the animal identification method.
Avoidance Capacity
The daily avoidance index for weeks 1 and 2 are available in Figure 5. During week 1, the white and black goats preferentially grazed the non-infested area during the first 3 grazing days. From grazing day 4, these goats started to graze the infested areas more than non-infested one. The daily avoidance index of the red goat was lower than one only on days 4 and 7. The brown goat grazed preferentially the infested areas during the entire grazing week.
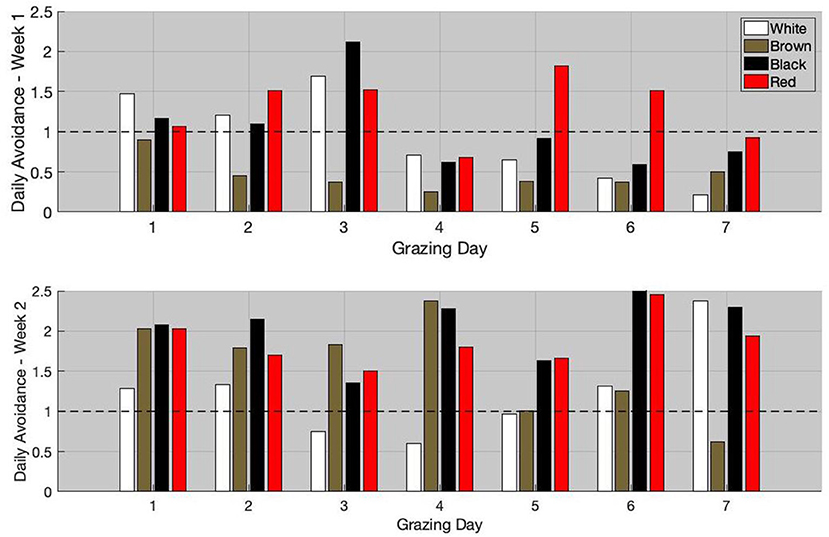
Figure 5. Individual daily avoidance for week 1 (top) and week 2 (bottom).
For week 2, the black and red goats had a daily avoidance index >1 during the entire grazing week. Unlike during week 1, the brown goat had an avoidance index ≥1 during the first 6 grazing days and only preferentially grazed the infested areas during the last grazing day. During the first 4 days, the daily avoidance index of the brown goat was in average equal to 2. Thereafter, the daily avoidance index started to decrease and was in average equal to 0.96 during the last 3 days. The white goat generally had the lowest avoidance index (daily index <1 during days 3, 4, and 5).
When comparing the avoidance index over the 2 weeks using the Wilcoxon rank sum test, all animals, but the white goat, significantly increased their avoidance (p-value <0.05). The average daily avoidance index increased by 36, 237, 99, and 44% for the white, brown, black, and red goats, respectively. Interestingly, the greater LAF value was observed during week 1 and the greater weekly avoidance index was observed during week 2. The Pearson's correlation coefficient between the LAF on week 1 and the increase in the average avoidance index on week 2 was 0.9.
Larval Exposure and Level of Infection
No simple relationship between the LAF and the exposure coefficient was found. The LAF is between 10.5 and 11.2 for most of the exposure coefficient. It is important to note that similar exposure coefficient can have different LAFs. For example, no significant difference was observed between the exposure coefficients of the red goat during week 1 and the black goat during week 2 (8,417 and 8,417, respectively). However, the LAFs of these two animals were respectively the minimal and maximal observed values.
Discussion
In this study, we provided a conceptual framework to study goats' behavior at pasture and tested it to study the interaction between grazing behavior and parasitism. This framework is based on automatic animal monitoring using image analysis, to detect and identify the animals on the images, which allows to record the spatial coordinates of the animals over time. We were able to derive several interesting indicators, such as the avoidance index or the exposure coefficient. The relationships between these indicators and the level of infection of the animals were studied.
We showed that animals had heterogeneous avoidance capacity, which changed over time. We observed that avoidance capacity increases during week 2, for all animals but one. Interestingly, we observed that the more the animals were infected after week 1, and the more their avoidance capacity increased during week 2. Inline with this result, for sheep, it has been shown that the avoidance capacity increased with the level of infection (Hutchings et al., 1999; Cooper et al., 2000). Some animals had an avoidance capacity >1 during the first grazing days and then became <1 for the rest of the week. Several hypotheses can be proposed, such as the age of feces, which can decrease the avoidance capacity (Hutchings et al., 1998). Moreover, animals naturally dropped feces inside the pasture, increasing gradually the quantity of feces within the non-infested area. To overcome this limitation, future studies should use feces bag to avoid the contamination of the non-infested area, as suggested by Hutchings et al. (2001). Finally, the history of parasite infections should be measured to estimate the relationship with the avoidance capacity. A clear relationship was not observed either between the larval exposure and the level of infection, or between the avoidance index and the level of infection. This suggest that larval intake is a random process and is not directly proportional to time spent on infested areas. The non-linear relationship between FEC and adult parasite established within the abomasum, and consequently, larval ingestion could also explain our results (Cériac et al., 2019). Whatever, the biological interpretation resulting from our analysis should be interpreted with caution, due to the low number of monitored animals.
However, our work provided insights to develop experimental studies that characterize the behavior of ruminant at pasture and can be improved in different ways. First, our work could benefit from a daily estimation of the number of larvae inside the infested areas, to improve the estimation of the exposure coefficient. For week 2, the larval population was possibly increased after the third grazing day. However, we were not able to observe this dynamic, as we only had an observation on the last grazing day. Second, the performance of the animal detection and identification could also be improved. We used time-lapse construction camera with a resolution of 1,208 ×720 and 1.3 Mpx, which was convenient because it ran on batteries and stored the images on a SD card for the entire grazing week. This is particularly adapted to outdoor conditions, where the pasture can be located far from any facilities. However, using a camera with higher definition can improve the details in the image, especially when the objects are located far from the camera, and thus potentially increase detection rate. Animal identification can be improved using video recording instead of images generated from time-lapse camera. With videos, animal identification can benefit from object-tracking techniques (Li et al., 2021; Van der Zande et al., 2021). It would also be possible to estimate the speed and acceleration of the animals and to classify their activities. This would be particularly useful, as far as in this study, we were not able to distinguish between grazing and non-grazing animals, which bias the computation of the avoidance index. Social distance during grazing could also be used to determine dominance status of the animals. Color marks on the animals can be an interesting solution to increase both the detection and identification methods. These color marks should be visible from the camera, no matter the animal posture and its angle from the camera. Finally, as it is shown in this article, it is important to consider the sun trajectory when deciding the camera location.
Overall, image analysis could be a useful tool to monitor animal behavior on pasture. The main advantages are being the low cost of the cameras and no handling of the animals. With more developments, it could be expected that a variety of variables, such as locations, activities, or animal interactions, could be computed from only one sensor, the camera. However, using image analysis remains technical, as it needs to train specific deep neural network, which could be complicated for non-specialist. In this work, we showed that animal identification was possible, thanks to the various colors of the individuals. This might not be possible for generic studies and automatic identification remains a major constraint for grazing goats. By now, GPS combined with accelerometers probably remains the easiest solution to get continuous individual data. With this study, we illustrated the use of image analysis and how it could be used to study the relationships between animal behavior and health. It demonstrated that image analysis is a potential alternative, and future improvements could open new perspectives for monitoring animal behavior.
Most studies on small ruminants' behavior rely on human observation. This is particularly time-consuming, and in general, observations are limited in time and frequency. Automatic monitoring will allow to acquire long-term individual data, necessary to study the relationships between behavior and several aspects of animal health and welfare. However, visual observation enables to compute useful information, such that the number of bites (Hutchings et al., 1998), and to identify when animal grazed. Future development could focus on tracking the animal head and possibly detect when the animal grazed.
Data Availability Statement
The raw data supporting the conclusions of this article will be made available by the authors, without undue reservation.
Ethics Statement
The animal study was reviewed and approved by Comité d'Ethique en Matière d'Expérimentation Animale des Antilles et de la Guyane, CEMEAAG.
Author Contributions
MB designed the experiment and the monitoring method, analyzed the data, and wrote the article. XG was in charge of the experimentation. J-CB helped to analyze the data and wrote the article. All authors provided important insights to design the experiment, analyze the results, and reviewed the final version of the article. All authors contributed to the article and approved the submitted version.
Funding
The cameras were funded by the project suiRAvi, supported by the animal genetics division of INRAE. The study was supported by Région Guadeloupe and the European Union Fund (FEDER) in the framework of the AgroEcoDiv project.
Conflict of Interest
The authors declare that the research was conducted in the absence of any commercial or financial relationships that could be construed as a potential conflict of interest.
Publisher's Note
All claims expressed in this article are solely those of the authors and do not necessarily represent those of their affiliated organizations, or those of the publisher, the editors and the reviewers. Any product that may be evaluated in this article, or claim that may be made by its manufacturer, is not guaranteed or endorsed by the publisher.
Acknowledgments
We would like to thank Yoann Felicite and Dalila Feuillet for providing their technical support and performing the laboratory analysis.
References
Achour, B., Belkadi, M., Filali, I., Laghrouche, M., and Lahdir, M. (2020). Image analysis for individual identification and feeding behaviour monitoring of dairy cows based on convolutional neural networks (Cnn). Biosyst. Eng. 198, 31–49. doi: 10.1016/j.biosystemseng.2020.07.019
Aumont, G., Pouillot, R., and Mandonnet, N. (1997). Le dénombrement Des éléments Parasitaires: un Outil Pour L'étude de La Résistance Génétique Aux Endo-Parasites Chez Les Petits Ruminants. In: Workshop Final de L'AT Cirad-Mipa Vol. 72, p. 94.
Barroso, F. G., Alados, C. L., and Boza, J. (2000). Social hierarchy in the domestic goat: effect on food habits and production. Appl. Animal Behav. Sci. 69, 35–53. doi: 10.1016/S0168-1591(00)00113-1
Bonneau, M., Bambou, J. C., Mandonnet, N., Arquet, R., and Mahieu, M. (2018). Goats worm burden variability also results from non-homogeneous larval intake. Sci. Rep. 8, 15987. doi: 10.1038/s41598-018-34338-2
Bonneau, M., Vayssade, J-A., Troupe, W., and Arquet, R. (2020). Outdoor animal tracking combining neural network and time-lapse cameras. Comput. Electr Agric. 168, 105150. doi: 10.1016/j.compag.2019.105150
Brambilla, A., von Hardenberg, A., Kristo, O., Bassano, B., and Bogliani, G. (2013). Don't spit in the soup: faecal avoidance in foraging wild alpine ibex, capra ibex. Animal Behav. 86, 153–158. doi: 10.1016/j.anbehav.2013.05.006
Cériac, S., Durbant, P., Godard, X., Barbier, C., Feuillet, D., Félicité, Y., et al. (2019). Effect of the nutritional status of Creole goats on the density-dependent prolificacy of Haemonchus contortus. Veter. Parasitol. 276, 108973. doi: 10.1016/j.vetpar.2019.108973
Charlier, J., Thamsborg, S. M., Bartley, D. J., Skuce, P. J., Kenyon, F., Geurden, T., et al. (2018). Mind the gaps in research on the control of gastrointestinal nematodes of farmed ruminants and pigs. Transbo. Emerg. Dis. 65, 217–234. doi: 10.1111/tbed.12707
Cooper, J., Gordon, I. J., and Pike, A. W. (2000). Strategies for the avoidance of faeces by grazing sheep. Appl. Animal Behav. Sci. 69, 15–33. doi: 10.1016/S0168-1591(00)00116-7
Cornell, S. J., Isham, V. S., and Grenfell, B. (2004). Stochastic and spatial dynamics of nematode parasites in farmed ruminants. In: Proceedings of the Royal Society of London. Series B: Biological Sciences. vol. 271, p. 1243–1250. doi: 10.1098/rspb.2004.2744
Fox, N. J., Marion, G., Davidson, R. S., White, P. C., and Hutchings, M. R. (2013). Modelling parasite transmission in a grazing system: the importance of host behaviour and immunity. PLoS ONE. 8:e77996. doi: 10.1371/journal.pone.0077996
Gan, H., Ou, M., Zhao, F., Xu, C., Li, S., Chen, C., et al. (2021). Automated piglet tracking using a single convolutional neural network. Biosyst. Eng. 205, 48–63. doi: 10.1016/j.biosystemseng.2021.02.010
He, K., Zhang, X., Ren, S., and Sun, J. (2016). Deep Residual Learning for Image Recognition. In: Proceedings of the Ieee Conference on Computer Vision and Pattern Recognition (Cvpr). doi: 10.1109/CVPR.2016.90
Hutchings, M. R., Gordon, I. J., Kyriazakis, I., and Jackson, F. (2001). Sheep avoidance of faeces-infested patches leads to a trade-off between intake rate of forage and parasitism in subsequent foraging decisions. Animal Behav. 62, 955–964. doi: 10.1006/anbe.2001.1837
Hutchings, M. R., Judge, J., Gordon, I. J., Athanasiadou, S., and Kyriazakis, I. (2006). Use of trade-off theory to advance understanding of herbivore–parasite interactions. Mammal Rev. 36, 1–16. doi: 10.1111/j.1365-2907.2006.00080.x
Hutchings, M. R., Kyriazakis, I., Anderson, D. H., Gordon, I. J., and Coop, R. L. (1998). Behavioural strategies used by parasitized and non-parasitized sheep to avoid ingestion of gastro-intestinal nematodes associated with faeces. Animal Sci. 67, 97–106. doi: 10.1017/S1357729800009838
Hutchings, M. R., Kyriazakis, I., Gordon, I. J., and Jackson, F. (1999). Trade-offs between nutrient intake and faecal avoidance in herbivore foraging decisions: the effect of animal parasitic status, level of feeding motivation and sward nitrogen content. J Animal Ecol. 68, 310–323. doi: 10.1046/j.1365-2656.1999.00287.x
Kaplan, R. M., and Vidyashankar, A. N. (2012). An inconvenient truth: global worming and anthelmintic resistance. Veter. Parasitol. 186, 70–78. doi: 10.1016/j.vetpar.2011.11.048
Li, G., Huang, Y., Chen, Z., Chesser, G. D., Purswell, J. L., Linhoss, J., et al. (2021). Practices and applications of convolutional neural network-based computer vision systems in animal farming: a review. Sensors. 21, 1492. doi: 10.3390/s21041492
Louie, K., Vlassoff, A., and Mackay, A. (2005). Nematode parasites of sheep: extension of a simple model to include host variability. Parasitology. 130, 437–446. doi: 10.1017/S003118200400678X
Marsot, M., Mei, J., Shan, X., Ye, L., Feng, P., Yan, X., et al. (2020). An adaptive pig face recognition approach using convolutional neural networks. Comput. Electr. Agric. 173, 105386. doi: 10.1016/j.compag.2020.105386
Min, J., Rao, Y., Zhang, J., and Shen, Y. (2020). Automatic behavior recognition of group-housed goats using deep learning. Comput. Electr. Agric. 177, 105706. doi: 10.1016/j.compag.2020.105706
Qiao, Y., Su, D., Kong, H., Sukkarieh, S., Lomax, S., and Clark, C. (2019). Individual cattle identification using a deep learning based framework. IFAC-PapersOnLine 52, 318–323. doi: 10.1016/j.ifacol.2019.12.558
Redmon, J., and Farhadi, A. (2017). YOLO9000: better, faster, stronger. In: Proceedings of the Ieee Conference on Computer Vision and Pattern Recognition. p. 7263–71. doi: 10.1109/CVPR.2017.690
Rose, H., Wang, T., van Dijk, J., and Morgan, E. R. (2015). GLOWORM-Fl: a simulation model of the effects of climate and climate change on the free-living stages of gastro-intestinal nematode parasites of ruminants. Ecol. Model. 297, 232–245. doi: 10.1016/j.ecolmodel.2014.11.033
Saccareau, M., Moreno, C., Kyriazakis, I., Faivre, R., and Bishop, S. C. (2016). Modelling gastrointestinal parasitism infection in a sheep flock over two reproductive seasons: in silico exploration and sensitivity analysis. Parasitology. 143, 1509–1531. doi: 10.1017/S0031182016000871
Su, Q., Tang, J., Zhai, J., Sun, Y., and He, D. (2021). Automatic tracking of the dairy goat in the surveillance video. Comput. Electr. Agric. 187, 106254. doi: 10.1016/j.compag.2021.106254
Szegedy, C., Vanhoucke, V., Ioffe, S., Shlens, J., and Wojna, Z. (2016). Rethinking the inception architecture for computer vision. In: Proceedings of the Ieee Conference on Computer Vision and Pattern Recognition (Cvpr). doi: 10.1109/CVPR.2016.308
Ungerfeld, R., and Correa, O. (2007). Social dominance of female dairy goats influences the dynamics of gastrointestinal parasite eggs. Appl. Animal Behav. Sci. 105, 249–253. doi: 10.1016/j.applanim.2006.05.008
Van der Zande, L., Guzhva, O., and Rodenburg, T. B. (2021). Individual detection and tracking of group housed pigs in their home pen using computer vision. Front. Animal Sci. 2, 10. doi: 10.3389/fanim.2021.669312
Wang, D., Tang, J., Zhu, W., Li, H., Xin, J., and He, D. (2018). Dairy goat detection based on faster r-cnn from surveillance video. Comput. Electr. Agric. 154, 443–449. doi: 10.1016/j.compag.2018.09.030
William, A., Greatwood, C., and Burghardt, T. (2017). Visual localisation and individual identification of holstein friesian cattle via deep learning. In: Proceedings of the Ieee International Conference on Computer Vision (Iccv) Workshops.
Yang, A., Huang, H., Yang, X., Li, S., Chen, C., Gan, H., et al. (2019). Automated video analysis of sow nursing behavior based on fully convolutional network and oriented optical flow. Comput. Electr. Agric. 167, 105048. doi: 10.1016/j.compag.2019.105048
Zhang, Y., Cai, J., Xiao, D., Li, Z., and Xiong, B. (2019). Real-time sow behavior detection based on deep learning. Comput. Electr. Agric. 163, 104884. doi: 10.1016/j.compag.2019.104884
Keywords: image analysis, gastro-intestinal nematodes, animal behavior, fecal avoidance, Creole goats
Citation: Bonneau M, Godard X and Bambou J-C (2022) Assessing Goats' Fecal Avoidance Using Image Analysis-Based Monitoring. Front. Anim. Sci. 3:835516. doi: 10.3389/fanim.2022.835516
Received: 14 December 2021; Accepted: 03 February 2022;
Published: 10 March 2022.
Edited by:
Suresh Neethirajan, Wageningen University and Research, NetherlandsReviewed by:
Gota Morota, Virginia Tech, United StatesAnna Hessle, Swedish University of Agricultural Sciences, Sweden
Copyright © 2022 Bonneau, Godard and Bambou. This is an open-access article distributed under the terms of the Creative Commons Attribution License (CC BY). The use, distribution or reproduction in other forums is permitted, provided the original author(s) and the copyright owner(s) are credited and that the original publication in this journal is cited, in accordance with accepted academic practice. No use, distribution or reproduction is permitted which does not comply with these terms.
*Correspondence: Mathieu Bonneau, bWF0aGlldS5ib25uZWF1QGlucmFlLmZy