 Stephen F. Woodford1,2*
 Laurence Weinberg1,2
 Lachlan F. Miles1,2Ruth C. Marshall2
 Bernhard Riedel1,3
 Philip J. Peyton1,2
- 1Department of Critical Care, University of Melbourne, Parkville, VIC, Australia
- 2Department of Anaesthesia, Austin Health, Heidelberg, VIC, Australia
- 3Department of Anaesthetics, Perioperative Medicine, and Pain Medicine, Peter MacCallum Cancer Centre, Melbourne, VIC, Australia
Introduction: Ensuring hemodynamic stability with adequate perfusion to vital organs is critical to the safe conduct of anesthesia. Recent advances in hemodynamic monitoring technologies allow pressure, flow, and resistance to be measured continuously; however, there is limited evidence to suggest that these technologies alter clinical management or improve patient outcomes significantly. This may be because the fundamental hemodynamic model, established by Starling and Guyton, fails to offer the granular level of insight needed to guide clinical management.
Methods: We collected hemodynamic data from 950 patients who underwent major surgery with advanced hemodynamic monitoring (AHM) that provided continuously derived cardiac output and vascular resistance measurements. These measurements were based on the hemodynamic model of Starling and Guyton. Additionally, investigational monitoring software was developed to visualize a different hemodynamic model, termed the “pressure field” model. This model expresses the pulsatile, beat-to-beat relationship between ventricular performance (measured by stroke volume) and vascular tone (indicated by systemic elastance).
Results: Within this dataset were several patients who experienced major hemorrhage. Case studies of these patients demonstrate that abnormal pressure and flow regulation patterns are observed through the lens of the pressure field model, but these patterns are typically not visible through the lens of the traditional Starling and Guyton model (cardiac output and systemic vascular resistance, which involve averaging hemodynamic performance over successive cardiac cycles). Furthermore, “before and after” case studies using our investigational pressure field monitoring software suggest that the traditional Starling and Guyton hemodynamic model has limited utility in managing hemorrhage.
Discussion: We propose that the pressure field model may allow hemorrhage to be managed more effectively via improved monitoring granularity [the beat-by-beat visualization of the stroke volume-systemic elastance relationship, rather than the use of the composite metrics of cardiac output (heart rate × stroke volume) and systemic vascular resistance]. Further research into the utility of the pressure field model is warranted.
1 Introduction
Ensuring hemodynamic stability with adequate perfusion to vital organs is critical to the safe conduct of anesthesia. Blood pressure is used commonly as the key surrogate for perfusion. However, low blood pressure alone does not indicate the cause of dysregulated perfusion. This limitation of pressure measurement, coupled with breakthroughs in advanced hemodynamic monitoring (AHM), has led to goal-directed therapy (GDT) strategies. Clinical trials have evaluated a range of GDT strategies including targeting supranormal cardiac output values (1), augmented oxygen delivery, normalized cardiac output values (2), stroke volume maximization (3), and intravascular volume optimization (4), yet evidence supporting improved patient outcomes when using GDT strategies (vs. pressure-based management) is still limited. Importantly, despite these efforts postoperative complications related to dysregulated end-organ perfusion such as acute kidney injury, tissue edema, and surgical site infections remain common (5).
AHM and GDT are inextricably linked with the hemodynamic model established by Starling and refined by Guyton (6–8). In Starling and Guyton's pressure equation, cardiac output (CO) is the load transferred by the heart to create blood pressure, and systemic vascular resistance (SVR) represents the resistive force (the afterload) provided by the vasculature. This is an adaptation of Poiseuille's Law (9), which describes the continuous laminar flow of water through rigid glass tubes, whereas blood flow in the intact circulation is characterized by pulsatile non-laminar flow occurring through a distensible vascular network. CO is measured over successive cardiac cycles and expressed in liters per minute. Clinicians recognize that CO is a composite measure that can be broken down into stroke volume (SV) and heart rate (HR). However, we often focus therapy on overall (net) flow rather than the distinct components of SV and HR. SVR is also averaged over successive cardiac cycles and remains the most cited measure of afterload (10, 11) even though the main site of resistance in the intact circulation is the arterioles (12, 13), which receive and act on pulsatile flow. These limits of Starling and Guyton's equation are acknowledged (14, 15); nevertheless, it remains the standard model for understanding perfusion.
We hypothesize that revising the standard Starling and Guyton blood pressure equation to a more granular beat-by-beat relationship between pulsatile flow (stroke volume) and pulsatile afterload (systemic elastance) and visualizing this revised equation (the pressure field equation) in real-time at the point of care using an AHM platform provides deeper hemodynamic insights (16–18). Further, we hypothesize that a clinical algorithm based on this concept could be developed to define and defend hemodynamic stability and perioperative end-organ perfusion more precisely. To illustrate these hypotheses, we utilized a clinical dataset of patients monitored perioperatively with AHM and identified a subset of patients suffering major hemorrhage. Herein, we report these case studies and compare the hemodynamic status of patients using the Starling and Guyton model, and the pressure field model.
2 Methods
This observational study was conducted across four hospitals and received approval from both the Macquarie University Human Ethics Committee (Ethics Ref 5201200007) and the Austin Health Human Research Ethics Committee (HREC/94367/Austin-2023). Data collection occurred both retrospectively and prospectively from May 2012 until December 2023. Informed consent was secured for the use of re-identifiable patient data.
2.1 Derivation of the pressure field equation
Starling and Guyton's equation correlates blood pressure with an average flow (CO as the product of HR and SV) and an average resistance (SVR) over a period of one minute (19). To enhance its clinical applicability, we derived an equation that is relevant to each cardiac cycle (that is, each arterial pressure wave, or on a beat-by-beat basis), as follows:
where i indicates an individual beat, MAP = mean arterial pressure (mmHg), CVP = central venous pressure (mmHg), CO = cardiac output (L/min), SVR = systemic vascular resistance (mmHg/L/min), SV = stroke volume (mL/beat), t = cardiac cycle time (seconds), and Esys = systemic elastance (mmHg/L).
We termed Equation 2 the “pressure field equation” (16). The pressure field equation separates HR from the Starling and Guyton equation and treats it as an independent hemodynamic variable. According to this derivation, SVR (in mmHg/L/min) can be expressed in terms of Esys (mmHg/L) and HR such that:
By deduction, it is important to recognize that sequential measurements of SVR and Esys will only trend in the same direction by the same proportion if HR remains constant. At all other times the magnitude of movements in SVR and Esys will differ, and the direction of movement (indicating vasoconstriction or vasodilation) may differ. The 13 possible permutations of movements in SVR and Esys from a reference point are outlined in Supplementary Material S1; these demonstrate that SVR may decrease even though Esys has increased, simply because HR has increased. Likewise, SVR may increase even though Esys has decreased where HR has also decreased.
The pressure field equation can also be derived from Sunagawa's effective arterial elastance equation (Supplementary Material S2) (16, 20).
2.2 Collection of clinical data
2.2.1 Patient population
The study included patients who underwent major surgery where minimally invasive hemodynamic monitoring was clinically indicated and performed.
2.2.2 Advanced hemodynamic monitoring and data collection
Adult participants in the study were monitored using the EV1000 hemodynamic monitoring platform and FloTrac pressure transducer system (Edwards Lifesciences, Irvine, CA, USA). Each patient had a radial arterial line and a three-lumen central venous line inserted. The radial arterial line was connected to the EV1000 monitoring platform through a FloTrac transducer (FloTrac systems 3.0 and 4.0, Edwards Lifesciences, CA, USA), while the distal lumen of the central venous line was connected to the EV1000 platform via a TruWave transducer (Edwards Lifesciences, CA, USA). Both transducers were zeroed at the phlebostatic axis. The quality of the arterial waveform was monitored continuously for damping, with a fast flush test conducted where indicated. The distal lumen of the central venous line was used solely for pressure measurement. Lines were inserted and monitoring initiated on awake, un-premedicated patients prior to anesthesia being induced. Monitoring ceased at the end of surgery, or postoperatively at the discretion of the surgical intensive care unit (ICU) staff.
Key hemodynamic parameters (MAP, CVP, CO, SV, HR, and SVR) were recorded, typically at 20-second intervals. Hemodynamic data were downloaded into Excel spreadsheets (Microsoft Corporation, Redwood, Washington, USA) via a USB-A port after surgery or daily in the ICU. Significant physiological events (e.g., hemorrhage, acute atrial fibrillation, sepsis, myocardial infarction, or tamponade) and corresponding medications given during these episodes were documented, along with demographic, medical, procedural, and biometric data from medical and anesthesia records.
2.2.3 Patient care for the AHM group
For patients managed before December 2013, care followed the attending anesthesiologist's clinical judgment and was in accordance with institutional protocols.
2.2.4 Additional monitoring and patient care for the pressure field (AHM + PF) group
The pressure field monitoring software was developed to visualize the pressure field equation in real time. In the top left graph shown in Figure 1, SV is displayed on the y-axis and Esys on the x-axis, with the mean perfusion pressure (MPP; MPP = MAP–CVP) being the intersection of these two coordinates. Additionally, the software also displays a “cardiac output field” (top right graph, Figure 1) in real-time; in this graph, SV is displayed on the y-axis, HR on the x-axis, and CO at the intersection of these two coordinates. A time-based graph with arterial and venous pressures (grey) and MPP (color) is also displayed (Figure 1, bottom).
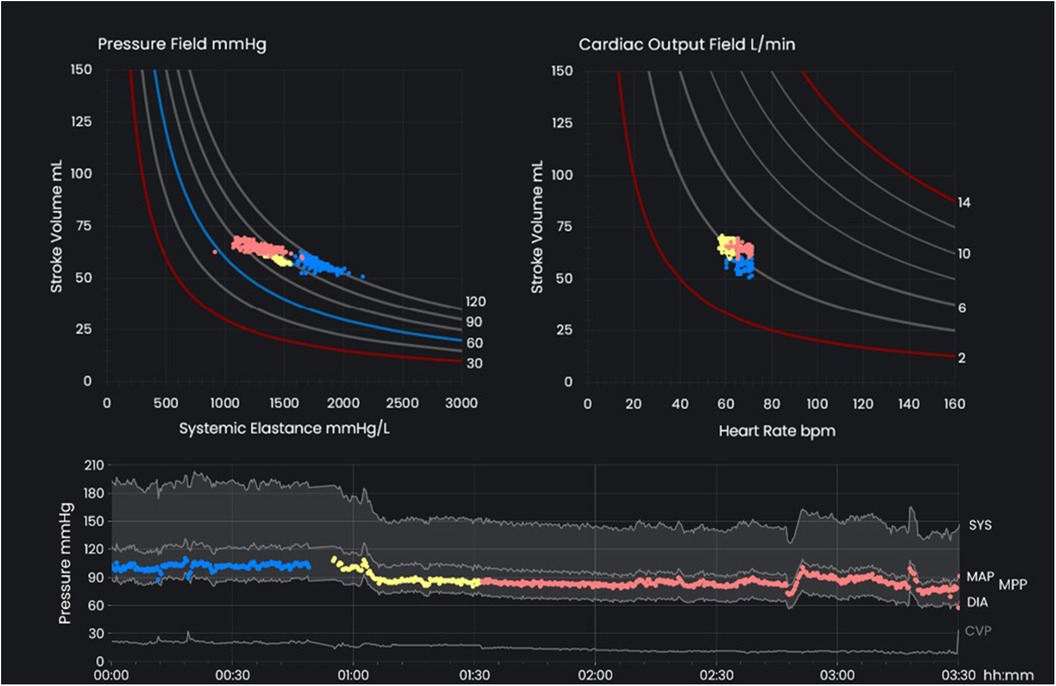
Figure 1 The key interface of the pressure field monitoring software. The pressure field (top left) displays stroke volume on the y-axis with systemic elastance on the x-axis and mean perfusion pressure (MPP; MPP = MAP - CVP) at the intersection of these two coordinates. The cardiac output field (top right) displays stroke volume on the y-axis and heart rate on the x-axis with cardiac output at the intersection of these two coordinates. The time-based pressure graph (bottom) displays arterial and venous pressure in grey and MPP in color. Colors are used to distinguish different stages of perioperative care. MAP, mean arterial pressure; CVP, central venous pressure; MPP, mean perfusion pressure.
From December 2013 onwards, the software was used to assist in managing perfusion for all high-acuity patients, and any patients undergoing major surgery. MAP, CVP, SV, and HR were transmitted continuously from the EV1000 monitoring platform to the laptop running the pressure field monitoring software via a serial port-to-USB cable. The pressure field was calculated and displayed in synchrony with the data from the FloTrac (arterial) and TruWave (central venous) transducers.
Concurrent with the development of the pressure field monitoring software, the “pressure field management algorithm” was devised and implemented from December 2013. This algorithm was tailored to align interventions with the physiological perturbations observed through the lens of the pressure field model: vasoactive drugs were used to treat perturbations of vascular tone, inotropes for cardiac contractility, and fluid and/or blood products for loss of blood volume from the circulation. Details of this algorithm are described in the Results section.
2.3 Data analysis
As both SVR and Esys can exhibit significant variation in direction and magnitude during physiological disturbances such as hemorrhage (where HR is typically high and variable), we directed our analysis accordingly. All major hemorrhage incidents (defined as loss of more than 50% of estimated blood volume) were identified and categorized based on management approach: (1) managed with advanced hemodynamic monitoring alone (AHM group); or (2) managed with AHM and the pressure field monitoring software (AHM + PF group).
For each patient with major hemorrhage in both groups, we graphed the trends in hemodynamic data according to both the pressure field equation (the “pressure field” graph) and the Guyton pressure equation (the “Guyton field” graph). These hemodynamic trends were then correlated with the relevant clinical interventions and patient outcomes to evaluate the explanatory power of the various hemodynamic parameters and the effect of both AHM and pressure field management strategies.
3 Results
Data was gathered and collated for 950 surgical patients, within which eight instances of major perioperative hemorrhage were identified. Of these, six cases in the AHM group experienced postoperative hemorrhage (and were managed without the aid of the pressure field monitoring software). The remaining two cases (in the AHM + PF group) developed hemorrhage intraoperatively and were managed using the real-time pressure field monitoring software. Detailed descriptions are provided for one case each from the AHM group (Case 1) and AHM + PF group (Case 7), accompanied by a summarized account for the other six cases.
3.1 Case 1: AHM only management—elective open abdominal aortic aneurysm repair
A 72-year-old man, weighing 95 kg and with a history of smoking-related chronic airways disease, left ventricular dysfunction (left ventricular ejection fraction 40%) with limited exercise capacity, and an infrarenal aortic aneurysm, was admitted to hospital for elective open aneurysm repair. Postoperatively, he experienced a significant hemorrhage, estimated at 8 L.
AHM monitoring using the EV1000 platform was initiated prior to anesthetic induction with management according to clinical judgment of the attending anesthesiologist. Pre-induction measurements showed a MAP of 111 mmHg, CVP of 12 mmHg, SV of 92 ml, HR of 55 bpm, and CO of 5.1 L/min. The surgery presented technical challenges and was accompanied by notable hemodynamic instability. After the completion of surgery, the patient remained sedated and ventilated, with improved stability and continuation of AHM in the ICU. On the day following in the ICU, while still ventilated, the patient developed delayed hemorrhage. Figure 2 displays the phases of the initial surgery (blue), postoperative admission to ICU (yellow), and the delayed hemorrhage (red), as depicted through both the Starling and Guyton pressure equation (right graph), and the pressure field equation (left graph). Corresponding sequential arterial blood gas results during this period are displayed below.
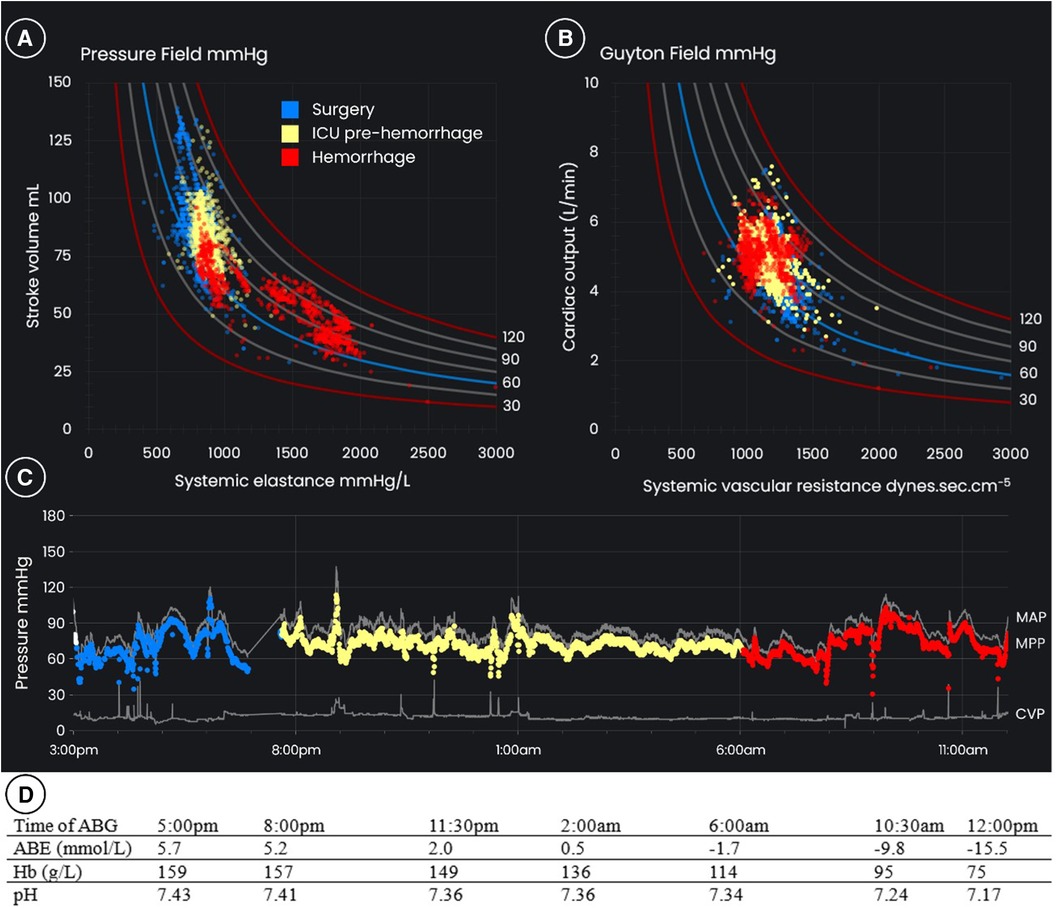
Figure 2 (A) The pressure field, (B) the “Guyton field”, and (C) blood pressures over time for a 72-year-old 95 kg male patient having open aortic aneurysm repair with major post-operative hemorrhage. The blue dots are the period of surgery, the yellow dots are post-operative ICU care prior to hemorrhage, and the red dots are the period of hemorrhage up to the time of surgical review. The results of (D) arterial blood gases are displayed below. Note that while the “Guyton field” shows relative stability of cardiac output and systemic vascular resistance, there is significant instability of stroke volume and systemic elastance apparent in the pressure field. This instability is also reflected in the worsening acidemia, likely reflecting critical hypoperfusion at the level of the microcirculation. ABG, arterial blood gas; ABE, actual base excess; CVP, central venous pressure; Hb, hemoglobin; ICU, intensive care unit; MAP, mean arterial pressure; MPP, mean perfusion pressure.
Following admission to the ICU, the patient exhibited a mild decline in hemoglobin levels, which accelerated 10 h after ICU admission. From around 6:00 am there was a decrease in arterial pressure and hemoglobin, accompanied by anuria, worsening acidemia (evidenced by the arterial blood gas results in Figure 2), and sinus tachycardia. Renal replacement therapy was initiated to manage the acidemia and anuria. To maintain MAP and hemoglobin levels above 80 g/L, 4 L of crystalloid, 2 L of colloid, and 6 units of packed red blood cells were administered over the next 6 h. A norepinephrine infusion was given at doses up to 40 µg/min to support blood pressure. During this period, CO and SVR remained relatively stable. MAP dropped below 65 mmHg for 15 min of this 6-h period, and mean perfusion pressure below 60 mmHg for an hour.
Consultation with the vascular surgical team began at 6:00 am. At a formal surgical review at 12:30 pm, six and a half hours after active hemorrhage was suspected, the surgical team noted that blood pressure, CO, and SVR were well maintained, albeit with tachycardia (as high as 142 bpm). They concluded that while hemorrhage was evident, it was likely to cease and there was no urgent need for reoperation. The stability in pressure, CO and SVR (Figure 2), was a key factor in deciding against immediate reoperation. The patient received a further 7 L of fluids, consisting of 5.5 L of crystalloid and colloid and 6 units of packed red blood cells, in the subsequent 12 h. Hemodynamic trends indicated that the initial hemorrhage ceased but recurred later the same day.
Given the ongoing hemodynamic instability, reoperation was performed 32 h after hemorrhage was first suspected, at 2:00 pm on postoperative day 2. The surgery resolved ongoing slow bleeding, but the abdomen was left open due to concerns about bowel viability. The patient subsequently developed diffuse necrosis of the gut and disintegration of the colon on postoperative day 4, and succumbed despite a further exploratory laparotomy. The diffuse necrosis was attributed to intense vasoconstriction from the high-dose norepinephrine administered during active hemorrhage.
3.1.1 Post-hoc analysis of monitoring and management
For the period of hemorrhage, the trends in the pressure field visualization are different to those in the Guyton field visualization (red dots in Figure 2). By way of explanation, the rise in HR compensated for the fall in SV, so that CO remained “constant” despite life-threatening hemorrhage. Similarly, as blood pressure was maintained by vasopressor and CO was preserved by a tachycardia, SVR was “constant” despite intense vasoconstriction. In summary, the Guyton field CO and SVR values remained steady despite hemorrhage and profound vasoconstriction.
In the pressure field, which visualizes the change in ventricular-vascular interaction for individual cardiac cycles, there is a marked change observed on commencement of hemorrhage: MPP is maintained by SV decreasing and Esys increasing, indicating an underfilled heart coupled with marked vasoconstriction. The graph on the left of Figure 3 illustrates that it is the increase in HR from ∼60 to ∼140 bpm which maintains CO. The graph on the right of Figure 3 shows the relationship between SVR and Esys and demonstrates the divergence in trends during hemorrhage due to the variability in HR. The Esys trend suggested severe vasoconstriction, whereas the stable SVR values suggested normal vascular tone. Review of the absolute and trended changes in pressure field values would have strengthened the argument for hypovolemia and an earlier return to the operating room.
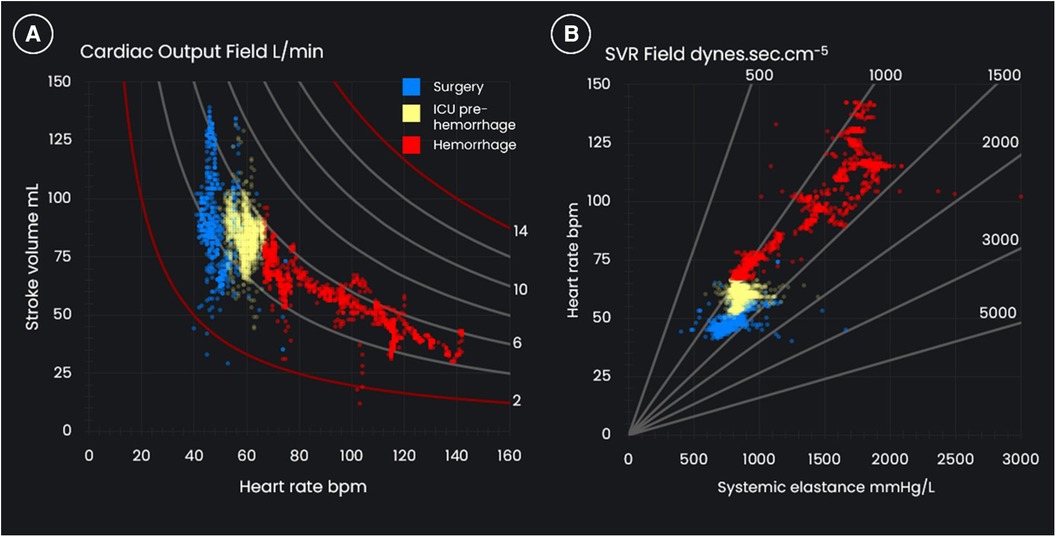
Figure 3 (A) The cardiac output field and (B) the systemic vascular resistance (SVR) field for a 72-year-old, 95 kg male who underwent an open aortic aneurysm repair and who suffered post-operative hemorrhage.
Supplementary Video S1 provides a summary of this case.
3.2 Case 2: AHM with pressure field management—distal aortic replacement
A 57-year-old man, weighing 86 kg, with a mycotic aneurysm of his distal aorta underwent distal aortic replacement with an aorto-bi-iliac homograft. During the operation, he sustained a measured blood loss of 5.5 L. Figure 4 displays the pressure field, cardiac output field, and time-based blood pressure chart which were used to manage perfusion, with accompanying blood gases below.
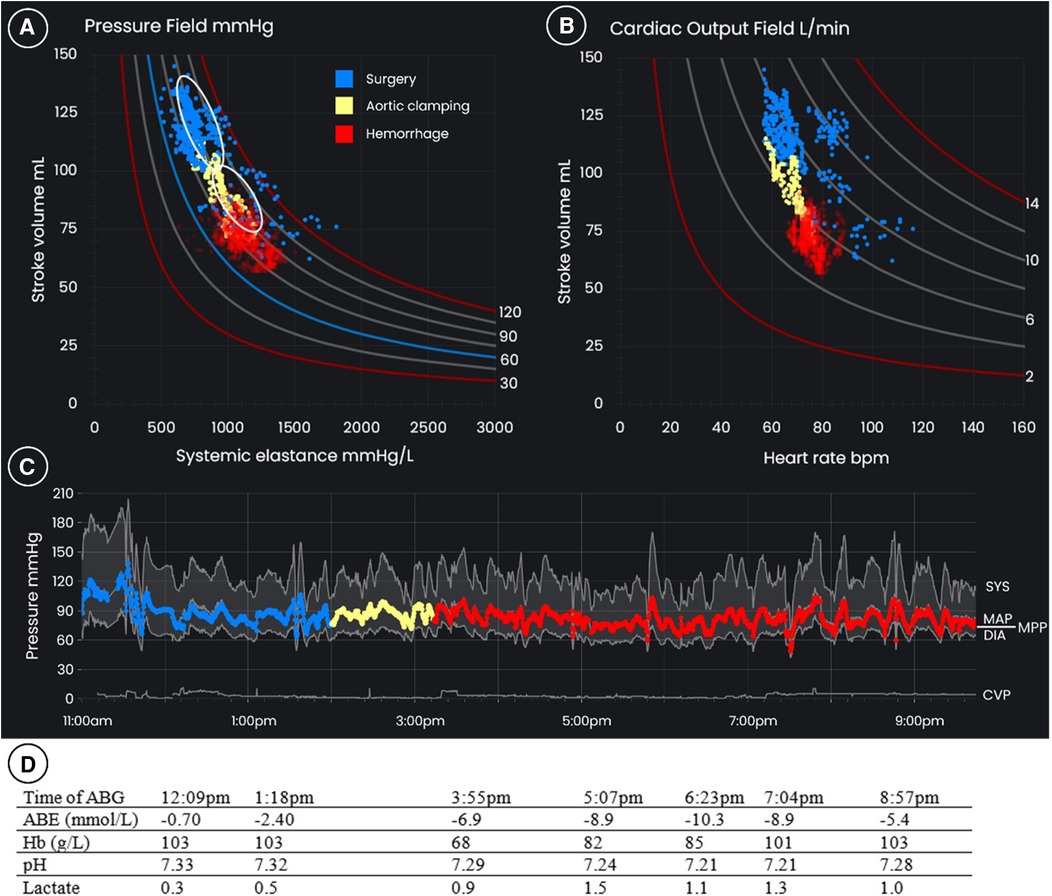
Figure 4 (B) The pressure field, (B) the cardiac output field, and (C) blood pressures over time for a 57-year-old 86 kg male who underwent distal aortic replacement with intraoperative hemorrhage of 5.5 L. The blue dots represent the pre-induction period and initial period of surgery, the yellow dots are the period during and immediately after aortic clamping. The red dots are the period of hemorrhage on excision of the distal aorta and common iliac arteries and grafting. The upper white oval in the pressure field is the target zone for management during the initial stages of surgery, and the lower white oval is the target zone following aortic clamping. (D) arterial blood gas results are displayed below. ABG, arterial blood gas; ABE, actual base excess; CVP, central venous pressure; Hb, hemoglobin; ICU, intensive care unit; MAP, mean arterial pressure; MPP, mean perfusion pressure.
The patient had a history of intravenous drug use and insulin-dependent diabetes complicated by peripheral vascular disease and had received a right common iliac artery stent for claudication. Two years later, he presented with fever and a streptococcal bacteremia. An infected common iliac artery stent, a mycotic aneurysm of the infrarenal aorta, and osteomyelitis of the coccyx with epidural inflammation were diagnosed. After a six-week trial of antibiotic therapy the patient was scheduled for excision of the infrarenal aorta and common iliac arteries and replacement with an aorto-bi-iliac homograft. Preoperative imaging also showed an abscess cavity around the mycotic aneurysm that involved the right ureter and the appendix.
The protocol for AHM + PF monitoring was implemented prior to anesthesia being induced. The patient's pre-induction mean perfusion pressure was 93 mmHg, SV was 120 ml/beat, and Esys was 779 mmHg/L. SV was relatively high and Esys low, likely due to chronic infection. The goal of management was to defend a pre-induction hemodynamic zone defined by 15% of these pre-induction values (see the upper white oval in the pressure field graph in Figure 4). The pressure field management goals were to be modified where there was deliberate vascular occlusion from aortic clamping or impeded venous return due to caval compression, that is, mechanical circumstances that would be reversed relatively quickly as the surgery progressed.
A low thoracic epidural was inserted, and a norepinephrine infusion via the central line was commenced at 4 µg/min to counteract the expected decrease in blood pressure on induction. On induction of general anesthesia, SV decreased to 62 ml/beat. This was assumed to reflect the redistribution of blood volume (rather than the loss of blood volume from the circulation, i.e., relative hypovolemia) due to changes in venous tone and therefore capacitance. Norepinephrine was increased to 10 µg/min with the goal of redistributing the volume. This restored the patient's pressure field to its pre-induction zone: Esys initially increased as the vasculature constricted, and SV then recovered with Esys decreasing commensurately (see the blue dots in Figure 4).
Ureteric stents were inserted and an appendicectomy performed during which the patient's pressure field remained steady and near the pre-induction hemodynamic zone (see the blue dots in Figure 4); norepinephrine was titrated between 4 and 10 µg/min to maintain Esys and no intravenous fluid apart from that delivered with medication (∼1 ml/kg/h) was administered in the first three hours of surgery.
The distal aorta was then clamped: in response there was a sudden decrease in SV and an increase in Esys with the pressure field moving down and to the right (see the yellow dots in Figure 4); this was assumed to reflect an expected decrease in circulating blood volume due to clamping and was accepted as the new target hemodynamic zone. Fluid was not administered.
Major blood loss then occurred during excision of the distal aorta and common iliac arteries, and subsequent replacement with a cadaver homograft supplemented by a left common iliac-to-femoral artery graft and right external iliac patch. During this 6.5-h period measured blood loss was 5.5 L. Fluid was administered rapidly during the period of hemorrhage to maintain the pressure field in the new target zone, with the volume of fluid being dictated by changes in the pressure field rather than by the estimated blood loss. In total, 10 units of allogeneic red blood cells, ten 500 ml bottles of 4% albumin, and 1.1 L of fresh frozen plasma, cryoprecipitate and platelets were administered. Due to active infection, cell salvage and reinfusion was only used late in surgery. An increase in the infusion rate of norepinephrine to 15–30 µg/min was required to support vascular tone (that is, to maintain Esys) and maintain the new target hemodynamic zone. The cardiac output field was also regularly monitored to observe changes in HR and CO.
The duration of surgery was 10.5 h, and at completion, the abdomen was packed and sealed with a negative pressure dressing due to the potential for bleeding and need for urgent reoperation. Urine output throughout surgery was approximately 0.5 ml/kg/h. The patient was transferred to ICU sedated and ventilated.
On arrival in ICU, Hb was 106 g/L, actual base excess on arterial gases was −5.9 mmol/L, lactate was 1.0 mmol/L, blood glucose was 7.7 mmol/L, and creatinine was 88 µmol/L (80 µmol/L pre-operatively). In the ICU, where treatment was titrated to a MAP over 65 mmHg, the serum creatinine level increased over the next 4 days to a peak of 294 µmol/L, however dialysis was not required, and renal function subsequently recovered. On postoperative day 2, a Hartmann's procedure was performed for sigmoid ischemia and the abdomen was closed. The patient was weaned from mechanical ventilation and his trachea was extubated and epidural catheter removed on postoperative day 5. Management of infectious complications prolonged the ICU admission to 22 days. The patient was discharged home on day 39. Twelve months after colostomy formation, he underwent uneventful elective closure of the stoma.
The algorithm used to manage perfusion for this case (and the additional AHM + PF cases) is summarized in Supplementary Material S3.
3.2.1 Post-hoc analysis of monitoring and management
During hemorrhage the patient's pressure field was maintained near the new target zone (after cross-clamping of the abdominal aorta), and the patient did not develop tachycardia. Volume loading was matched to losses of SV, so that the circulation was never “empty”. Relatively similar patterns were observed between the pressure field and Guyton field due to the stability in HR (see Figure 5).
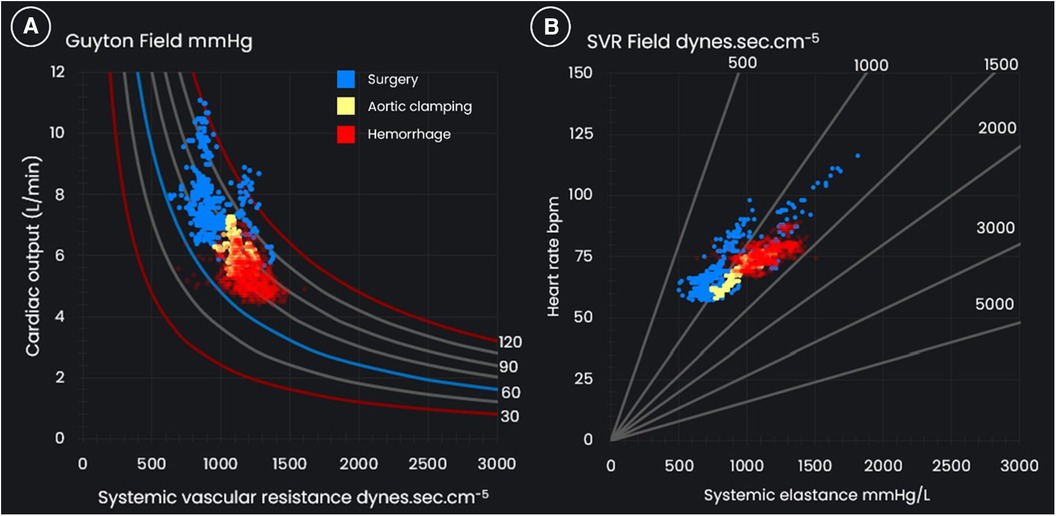
Figure 5 (A) The Guyton field and (B) the systemic vascular resistance (SVR) field for a 57-year-old 86 kg male who underwent distal aortic replacement with operative hemorrhage of 5.5 L.
3.3 Summaries of additional case studies
There were five additional episodes of postoperative hemorrhage in the AHM group (Cases 3–7) and one additional episode of operative hemorrhage in the AHM + PF group (Case 8); see Table 1. In the AHM cases, estimated blood losses varied between 3 and 7 L, and the estimated time from onset of hemorrhage to operative intervention varied from 5 to 15 h. In the AHM + PF case, estimated intraoperative blood loss was 5 L.
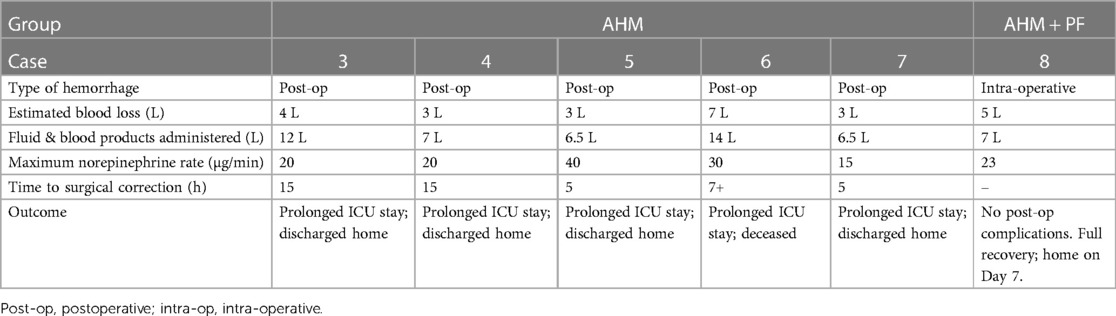
Table 1 Characteristics of additional cases of hemorrhage.
The typical patterns of hemodynamic change in the AHM group are summarized in Figure 6 in an indicative diagram. For all cases, the trends in the pressure field showed “right and downward displacement”, that is a decrease in SV and increase in Esys indicating a decrease in preload and vasoconstriction to maintain blood pressure. Trends in the Guyton field for most patients (Cases 3,4,5,6) reflected a stable or increased CO, with SVR either preserved or decreased; this suggested “normal” or “low” vascular tone (while in contrast the pressure field indicated vasoconstriction) and was accompanied by pronounced tachycardia.
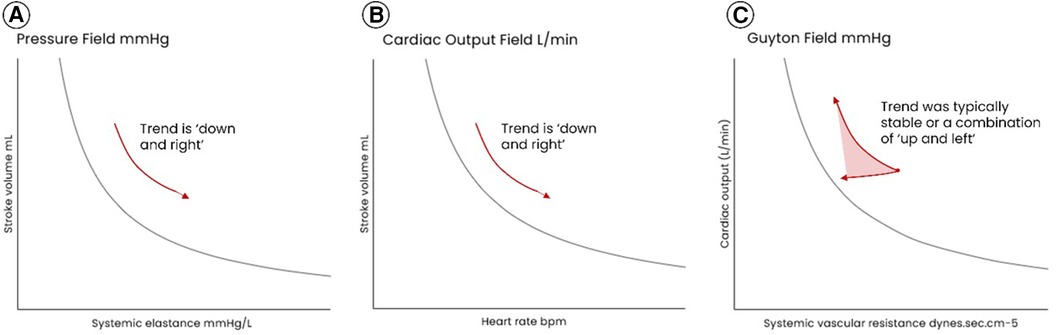
Figure 6 Representative patterns of hemodynamic movement during hemorrhage in the AHM group (the group managed without the pressure field monitoring and management algorithm). In (A) the pressure field, the trend in dots was always “down and right”, that is a decrease in SV and increase in Esys which indicates a decrease in preload and vasoconstriction to maintain blood pressure. In (B) the cardiac output field, the trend is “down and right”, that is a decrease in SV and attendant increase in HR to maintain blood flow. (C) the Guyton field typically reflected a stable or increased CO, with SVR either preserved or decreased; this suggested “normal” or “low” vascular tone.
For Case 7 in the AHM group and the additional AHM + PF case (Case 8), the trends in the Guyton field more closely mirrored the trends in the pressure field as in both cases tachycardia was largely avoided. For Case 7, the pressure and Guyton fields both showed a decrease in volume/flow and afterload, although these trends were less pronounced in the Guyton field. For the additional AHM + PF case (Case 8), the lack of tachycardia was likely due to early and aggressive management of volume loss, however the rapid rate of hemorrhage (most of the 5L blood loss occurred over 45 min) resulted in a decrease in afterload (as well as preload/flow) which was not fully corrected with fluids and vasopressors.
Case summaries for these additional patients are provided in Supplementary Material S4.
4 Discussion
4.1 Summary of hemorrhage cases
In five of the six AHM cases, systemic pressure and flow were typically preserved during the period of hemorrhage. Despite this, in Case 1 there was generalized acidemia accompanied by acute renal failure, gut ischemia, and ultimately death. Similarly, anastomotic failure, acute renal failure, and infection—all consequences of sustained vasoconstriction and end-organ hypoperfusion—were observed in the additional cases. We hypothesize that in these cases, the Starling and Guyton pressure equation concealed rather than assisted in revealing the presence of vasoconstriction and tissue hypoperfusion. In contrast, the pressure fields for these cases showed trends of decreasing SV, increasing Esys, and increasing HR, indicating volume loss from the circulation with constriction of the vasculature to maintain blood pressure and tachycardia to maintain net flow. We hypothesize that the body activates homeostatic responses to maintain both pressure and flow, but that a normal SVR in the presence of an elevated elastance masks vasoconstriction and the gradual shut down of microcirculatory flow in vital tissues. Early recognition of such changes is key to early diagnosis and definitive intervention.
In the AHM + PF cases, tachycardia was largely avoided during the period of hemorrhage (as it also was in AHM Case 7), so that the trends between the pressure and Guyton fields were relatively similar. The second AHM + PF case (Case 8) involved exsanguinating hemorrhage which occurred very rapidly with Esys as well as SV decreasing; we hypothesize that unlike the other cases presented here, there was insufficient time (during brisk hemorrhage) for the peripheral circulation to vasoconstrict.
In the AHM + PF cases, patients were managed using the pressure field management algorithm, where the goal was to replicate a patient's pre-induction pressure field zone. Outside of the periods of hemorrhage, low doses of norepinephrine and no fluid were administered. During hemorrhage, fluid and blood products were administered and the norepinephrine dose promptly increased. In Case 2, the target zone was in fact largely achieved (taking into account the unavoidable change in target zone due to aortic clamping). In Case 8 (where hemorrhage was rapid), there was significant displacement of the pressure field from the target zone however the management algorithm assisted with the rapid selection and titration of fluid, blood products and vasopressor. In both cases, tachycardia was largely avoided; we hypothesise that the “real time volume replacement” method meant that hypovolemia was minimized and the baroreflex response not materially activated. There were no complications attributable to major hemorrhage or the high doses of norepinephrine in these two cases.
4.2 Basis of the pressure field model
The pressure field is a different hemodynamic model which treats HR as an independent variable and which proposes that blood pressure is better understood as the result of a specific ventricular-vascular interaction. Perfusion pressure is the product of a specific stroke volume transferred by the heart to the aorta, and the afterload provided by the vasculature to this specific stroke volume. The pressure field equation was originally derived from Starling and Guyton's pressure equation. However, it can also be considered an extension of Kenji Sunagawa's work (20), which itself built on Otto Frank's 19th century investigation of pressure-volume loops in the isolated frog heart (21). Sunagawa argued using an isolated canine ventricle model that ventricular afterload is more accurately represented as an elastance than as Guyton's SVR such that:
where Ea = effective arterial elastance, LVESP = left ventricular end systolic pressure, Pd = downstream pressure, SV = stroke volume, and MAP = mean arterial pressure. The pressure field equation is derived by rearrangement and by assuming that Pd is equal to CVP (see Supplementary Material S2). Sunagawa himself left undefined how to measure Pd in the intact circulation but stated that it was higher than and moved in the same direction as CVP. There is now a body of clinical evidence which has assumed that the downstream pressure can be ignored in estimating Ea in the intact circulation (22–24). There will rarely be different directional trends between Ea and Esys in a patient, however CVP is included in the pressure field equation, and this aligns with Sunagawa's original proposal that (pulsatile) flow is the result of the pressure gradient across the circulation and so inclusion of CVP reduces absolute error in the estimation of afterload.
The pressure field equation reflects the fact that the primary source of afterload in the circulation is the arterioles (12, 13). The arteries function as a low-resistance pathway with minimal attenuation of pressure between the ascending aorta and the small arteries. The arterioles receive high-pressure pulsatile flow and are muscular and well innervated by sympathetic nerves (25, 26) with varicosities which release norepinephrine (26); the arterioles convert the high-pressure pulsatile flow to low-pressure near-constant flow which continues to the non-muscular, non-innervated capillaries. It is the arterioles, under the control of the autonomic nervous system and subject to vasopressor infusions, which predominantly provide afterload, and these arterioles receive pulsatile flow. A pulsatile measure of afterload better reflects the vascular tone of these arterioles. The utility of elastance as a measure of vascular tone merits prospective evaluation in animal studies using high-fidelity measurements of pressure and flow during the induction of shock states including hemorrhage and septic shock, and during induction of acute atrial fibrillation.
The pressure field visualization (see Figure 1) displays SV on the y-axis and Esys on the x-axis with mean perfusion pressure at the intersection of these two values. The visualization provides an instantaneous view of how SV and Esys relate to a particular mean perfusion pressure, and sequential plotting of this interaction enables the detection of small directional changes in the beat-to-beat ventricular and vascular contributions to blood pressure. It is the trends in values, in addition to the absolute values, which inform management. In an application of Wicken's human factors compatibility principle (27), the visualization “takes on” some of the cognitive load of integrating three parameters over time. The value of representing hemodynamic change visually was grasped in the 19th century by Otto Frank, who said “a mathematical formula…would be of use, but much more worthwhile is the geometric representation of the values obtained within a coordinate-system” (21). Humans are better at interpreting pictures than numbers. Significantly, it is the inclusion of CVP in the calculation of Esys that enables the visual display of mean perfusion pressure, SV, and elastance in the one graph, and this is of practical use.
Our experience has been that merely viewing the Guyton field is of some assistance in interpreting hemodynamics (given that this too integrates three hemodynamic parameters into a picture), but that the pressure field is of materially more assistance given the “beat-to-beat” nature of SV and Esys. Significantly dysregulated perfusion including hemorrhage will eventually be apparent to the least observant clinician, but its early detection can be enhanced by continuously graphing small changes.
In summary, we hypothesize that the time window within which intervention needs to occur to address dysregulated perfusion and prevent major complications may be brief, possibly minutes rather than hours. The assumption that maintenance of an adequate pressure and CO ensures microcirculatory perfusion appears to be contradicted by the pressure field. Further, if AHM based on the Starling and Guyton model detects dysregulated perfusion before diagnosis based on pressure measurement alone but is too late to prevent end-organ ischemia, it may not usefully impact perioperative management and clinical outcome. We hypothesize that pressure field monitoring enables earlier detection of physiological perturbations and more precise diagnosis, and that more precisely targeted interventions may improve perioperative outcomes.
4.3 Potential for further development and validation of the AHM + PF management algorithm
In this study, pressure field monitoring was matched with a management algorithm. The goal of the AHM + PF management algorithm was to replicate a patient-specific normal cardiovascular state. That is, a patient-specific “normalization” of physiology (rather than maximization of flow, for example) was the therapeutic goal.
By commencing hemodynamic monitoring prior to induction, a patient's unique “resting (baseline) pressure field” was determined and typically became the target zone for management with a tolerance of −15%, although intraoperative events such as major vascular occlusion resulted in unavoidable displacement of normal hemodynamics and shifted this target zone. A tolerance of −15% is similar to the difference between mean ambulatory and nighttime blood pressures, and it is plausible that sleep represents a comparable physiological state to general anesthesia (28).
When there was movement away from the pre-operative hemodynamic reference zone, the AHM + PF management algorithm provided a simple protocol for differentiating issues of vascular tone, cardiac contractility, and preload—and thus a physiological basis for the titration of vasoactive drugs, cardioactive drugs, and fluid. The management algorithm resulted in the early administration of vasopressor to counteract the known impacts of anesthesia on vascular tone and contractility (29), and in the administration of minimal fluid outside of hemorrhage. This approach recognizes that fluid, as well as vasopressors and inotropes, should be viewed as a drug and used selectively to correct abnormal hemodynamics. Conversely, where hemorrhage occurred, the pressure field visualization assisted with rapid assessment of severity and titration of fluid and blood products. During active hemorrhage, the pressure field is always displaced downwards and our current experience is that it cannot be completely normalized, whereas the compensatory rise in heart rate may result in a normal cardiac output. Diagnosis within this paradigm remains an empiric process of trial and error but in our view with fewer and smaller errors.
There have traditionally been concerns regarding administration of vasopressors and particularly norepinephrine, the primary vasopressor in the AHM + PF management algorithm. Norepinephrine is the sympathetic nervous system's own neurotransmitter and results in arteriolar constriction and a positive inotropic effect on the myocardium with little to no chronotropic effect (as well as improving lymphatic return) (30, 31) and is thus a sound choice of vasopressor. Further, the precise titration of norepinephrine to restore a patient's “normal” hemodynamics (proxied by a patient's pre-induction hemodynamics) is enabled by the sensitivity of the pressure field (and Esys in particular) to interventions, enabling safe and effective use even at high doses. The pressure field is highly sensitive to fluid, and in the absence of hemorrhage a fluid bolus of 1 ml/kg typically generates an observable increase in SV. This is consistent with Messina's meta-analysis advocating for mini fluid challenges of 50–100 ml (32).
Strictly speaking, pressure field monitoring requires the measurement or estimation of CVP. In recent years, CVP has become less regularly measured in some institutions, however its measurement is important to understanding mean perfusion pressure where the clinical context indicates that CVP may be or become high or variable; for example, in patients with heart failure and during major abdominal surgery. Where CVP can be expected to be low and constant, pressure field monitoring can be conducted by manually entering a CVP value (typically 7 mmHg) in a hemodynamic monitor [with this functionality available on the EV1000 and Hemosphere monitoring platforms (Edwards Lifesciences, Irvine, California, USA)], or else assuming a value of 0 mmHg. For all patients in this study, CVP was measured continuously via a central line.
The AHM + PF management algorithm represents a form of “personalized hemodynamics”, for which there is emerging evidence of a clinical benefit (33–36). Personalized hemodynamics is based on the recognition that population-wide reference ranges do not reflect the diversity of physiology seen in perioperative medicine. The AHM + PF management algorithm assumes that the regulation of microcirculatory perfusion is unique to each circulation, and that reference to a patient's “normal” or “chronically abnormal” pressure field provides a better basis for managing and restoring perfusion during anesthesia than population-based targets. We hypothesize that there may be an outcome benefit associated with using AHM + PF monitoring in conjunction with the AHM + PF management algorithm. This hypothesis must be prospectively tested and we are planning a stepped wedge cluster randomized trial in elective major abdominal surgery.
4.4 Strengths and limitations
This study meticulously documented dense hemodynamic data and episodes of physiological derangement including hemorrhage. Retention and analysis of all hemodynamic data in 950 surgical cases throughout the study period provided the opportunity to analyze and better understand the pathophysiology of shock including during hemorrhage. Additionally, the analysis benefited from the inclusion of patient data from both the operating theatre and the ICU setting, and for all patients undergoing surgery data collection commenced prior to induction of anesthesia.
The values of Esys in this study were derived from synchronized blood pressure and SV measurements. Measurement of blood flow and volume (and thus afterload/vascular tone) in the intact circulation presents challenges. In this study, SV estimation relied on the FloTrac version 3.0 and 4.0 algorithms. The FloTrac technology uses pulse contour analysis to estimate SV and averages all heart beats within a short window (37). Any process of averaging necessarily involves a loss of data, however a meta-analysis concluded that the accuracy and trending of the FloTrac algorithm is sufficient under normal and hypodynamic conditions (38). Similarly, rapid changes in vascular tone induced by vasopressors may make SV estimations less reliable (39). However, our observations indicated that Esys consistently increased in response to norepinephrine administration.
Cases in the AHM group were of post-operative “concealed” hemorrhage and the cases in the AHM + PF group were of operative “revealed” hemorrhage; and a delay in publishing resulted from COVID-related resource constraints. However, this does not impact the core proposals of Esys as a measure of afterload and the pressure field as a paradigm for managing perfusion, or the relevance of the clinical data. Further research on the pressure field will provide valuable insights into the utility of Esys as a measure of ventricular afterload and elucidate the potential role of the pressure field in GDT.
The AHM + PF management algorithm was centered on maintaining a patient's own “normal” pressure field, which is approximated by the pre-induction pressure field. A patient's pre-induction pressure field may be affected by pain, anxiety and intercurrent disease, requiring adjustment of a patient's target zone using clinical judgement. Where a patient's normal resting pressure field cannot be established (for example, due to illness or premedication), SV and Esys targets can be estimated based on data from patients with similar physiological characteristics. Our group intends to publish further guidance on this point.
4.5 Conclusion
The pressure field model visualizes the dynamic interaction between ventricular (SV) and vascular (Esys) function independent of changes in heart rate. We hypothesize that this enables earlier detection of physiological perturbations and more precise diagnosis of these, particularly in relation to vascular tone. Identification of small changes in ventricular-vascular interaction at the highest frequency of measurement assists in nuanced adjustments of vasopressors, inotropes, and fluid. In this study, pressure field monitoring was accompanied by the AHM + PF management algorithm, which involved interrogating each patient's resting circulation to create a picture of their own “normal zone” with this normal zone then defended. We hypothesize that the AHM + PF management algorithm enables a patient's own physiology to be more precisely replicated. This novel approach was used to apparent benefit in managing our intraoperative hemorrhage cases, and we have found it useful in maintaining hemodynamic stability in a wide range of surgery types and in the management of severe sepsis. Prospective study of the pressure field model and of the AHM + PF management algorithm is warranted.
Data availability statement
The raw data supporting the conclusions of this article will be made available by the authors, without undue reservation. Requests to access these datasets should be directed toc3RldmUud29vZGZvcmRAYXVzdGluLm9yZy5hdQ==.
Ethics statement
The studies involving humans were approved by Macquarie University Human Ethics Committee (Ethics Ref 5201200007) and the Austin Health Human Research Ethics Committee (HREC/94367/Austin-2023). The studies were conducted in accordance with the local legislation and institutional requirements. The participants provided their written informed consent to participate in this study. Written informed consent was obtained from the individual(s) for the publication of any potentially identifiable images or data included in this article.
Author contributions
SW: Conceptualization, Data curation, Formal Analysis, Investigation, Methodology, Software, Writing – original draft, Writing – review & editing. LW: Writing – review & editing. LM: Writing – review & editing. RM: Data curation, Project administration, Visualization, Writing – review & editing. BR: Writing – review & editing, Supervision. PP: Writing – review & editing, Conceptualization.
Funding
The author(s) declare that no financial support was received for the research, authorship, and/or publication of this article.
Conflict of interest
SW, BR, LW, and LM have received honoraria from Edwards Lifesciences. SW and RM have ownership interests in PerfusionMap, which has developed software to display the pressure field visualization.
The remaining author declares that the research was conducted in the absence of any commercial or financial relationships that could be construed as a potential conflict of interest.
The handling editor RGH declared a past co-authorship with the author LW.
Publisher's note
All claims expressed in this article are solely those of the authors and do not necessarily represent those of their affiliated organizations, or those of the publisher, the editors and the reviewers. Any product that may be evaluated in this article, or claim that may be made by its manufacturer, is not guaranteed or endorsed by the publisher.
Supplementary material
The Supplementary Material for this article can be found online at: https://www.frontiersin.org/articles/10.3389/fanes.2024.1400929/full#supplementary-material
References
1. Shoemaker WC, Appel PL, Kram HB, Waxman K, Lee TS. Prospective trial of supranormal values of survivors as therapeutic goals in high-risk surgical patients. Chest. (1988) 94(6):1176–86. doi: 10.1378/chest.94.6.1176
2. Zatlouka J, Benes J. Hemodynamic monitoring and optimization in noncardiac surgery. In: Saugel B, Kirov MY, Kuzkov VV, editors. Advanced Hemodynamic Monitoring: Basics and new Horizons. Switzerland: Springer International Publishing (2021). p. 41–50.
3. Pearse RM, Harrison DA, MacDonald N, Gillies MA, Blunt M, Ackland G, et al. Effect of a perioperative, cardiac output-guided hemodynamic therapy algorithm on outcomes following major gastrointestinal surgery: a randomized clinical trial and systematic review. JAMA. (2014) 311(21):2181–90. Erratum in: JAMA. 2014 312(14):1473. doi: 10.1001/jama.2014.5305
4. Calvo-Vecino JM, Ripollés-Melchor J, Mythen MG, Casans-Francés R, Balik A, Artacho JP, et al. Effect of goal-directed haemodynamic therapy on postoperative complications in low-moderate risk surgical patients: a multicentre randomised controlled trial (FEDORA trial). Br J Anaesth. (2018) 120(4):734–44. doi: 10.1016/j.bja.2017.12.018
5. Ludbrook GL. The hidden pandemic: the cost of postoperative complications. Curr Anesthesiol Rep. (2022) 12(1):1–9. doi: 10.1007/s40140-021-00493-y
6. Starling EH. Principles of Human Physiology. Philadelphia and New York: Lea & Febiger (1912) p. 990.
7. Starling EH. The law of the heart. Lancet. (1921) 198(5108):212–4. doi: 10.1016/S0140-6736(01)32101-3
8. Guyton AC. Regulation of cardiac output. N Engl J Med. (1967) 277(15):805–12. doi: 10.1056/NEJM196710122771509
9. Sutera SP, Skalak R. The history of Poiseuille’s law. Annu Rev Fluid Mech. (1993) 25:1–19. doi: 10.1146/annurev.fl.25.010193.000245
10. Jessen MK, Vallentin MF, Holmberg MJ, Bolther M, Hansen FB, Holst JM, et al. Goal-directed haemodynamic therapy during general anaesthesia for noncardiac surgery: a systematic review and meta-analysis. Br J Anaesth. (2022) 128(3):416–33. doi: 10.1016/j.bja.2021.10.046
11. Zhao X, Tian L, Brackett A, Dai F, Xu J, Meng L. Classification and differential effectiveness of goal-directed hemodynamic therapies in surgical patients: a network meta-analysis of randomized controlled trials. J Crit Care. (2021) 61:152–61. doi: 10.1016/j.jcrc.2020.10.031
12. Johnson PC, Hanson KM. Effect of arterial pressure on arterial and venous resistance of intestine. J Appl Physiol. (1962) 17:503–8. doi: 10.1152/jappl.1962.17.3.503
13. Renkin EM. Control of microcirculation and blood-tissue exchange. In: Renkin EM, Michel CC, Geiger SR, editors. Handbook of Physiology, Section 2: The Cardiovascular System. 4th ed. Bethesda, MD: American Physiological Society (1984). p. 627–87.
14. Rodgers M. Systemic vascular resistance should be banned. Chest. (2014) 146(4):e143. doi: 10.1378/chest.14-1408
15. Bartlett RH. Alice in intensiveland. Being an essay on nonsense and common sense in the ICU, after the manner of lewis carroll. Chest. (1995) 108(4):1129–39. doi: 10.1378/chest.108.4.1129
16. Woodford SF. The pressure field defined by stroke volume and elastance as a novel paradigm for perfusion management of the circulatory system. [dissertation on the internet]. Sydney (AU): Macquarie University (2021). [cited 2024 Feb 17]. Available online at: https://figshare.mq.edu.au/articles/thesis/The_pressure_field_defined_by_stroke_volume_and_systemic_elastance_as_a_novel_paradigm_for_perfusion_management_of_the_circulatory_system/23909577/1 doi: 10.25949/23909577.v1
17. Woodford SF, Butlin M, Wei B, Chao W, Avolio A. The pressure field as a methodology for fluid management and red cell preservation during cardiac surgery. J Cardiothorac Surg. (2023) 18(1):36. doi: 10.1186/s13019-023-02134-3
18. Woodford SF, Miles LF, Lee DK, Weinberg L. A software-guided approach to hemodynamic management in a renal transplant recipient: a case report. A A Pract. (2022) 16(9):e01622. doi: 10.1213/XAA.0000000000001622
19. Guyton AC. Regulation of cardiac output. Anesthesiology. (1968) 29(2):314–26. doi: 10.1097/00000542-196803000-00016
20. Sunagawa K, Sagawa K, Maughan WL. Ventricular interaction with the loading system. Ann Biomed Eng. (1984) 12(2):163–89. doi: 10.1007/BF02584229
21. Kuhtz-Buschbeck JP, Drake-Holland A, Noble MIM, Lohff B, Schaefer J. Rediscovery of Otto Frank’s contribution to science. J Mol Cell Cardiol. (2018) 119:96–103. Erratum in: J Mol Cell Cardiol. 2018 123:58. doi: 10.1016/j.yjmcc.2018.04.017
22. Monge Garcia MI, Jian Z, Settels JJ, Hatib F, Cecconi M, Pinsky MR. Reliability of effective arterial elastance using peripheral arterial pressure as surrogate for left ventricular end-systolic pressure. J Clin Monit Comput. (2019) 33(5):803–13. doi: 10.1007/s10877-018-0236-y
23. Chemla D, Teboul JL, Jozwiak M. As simple as possible, but not simpler: estimating the effective arterial elastance at bedside. J Clin Monit Comput. (2019) 33(5):933–5. doi: 10.1007/s10877-019-00278-z
24. Chemla D, Antony I, Lecarpentier Y, Nitenberg A. Contribution of systemic vascular resistance and total arterial compliance to effective arterial elastance in humans. Am J Physiol Heart Circ Physiol. (2003) 285(2):H614–20. doi: 10.1152/ajpheart.00823.2002
25. Haggerty A, Nirmalan M. Capillary dynamics, interstitial fluid and the lymphatic system. Anaesth Int Care Med. (2019) 20(3):182–9. doi: 10.1016/j.mpaic.2019.01.009
26. Watts SW, Kanagy NL, Lombard JH. Receptor mediated events in the microcirculation. In: Tiuma RF, Duran WN, Ley K, editors. Handbook of Physiology: Microcirculation. 2nd ed. London: Academic Press (2008). p. 285–348.
27. Wickens CD, Carswell CM. The proximity compatibility principle: its psychological foundation and relevance to display design. Hum Factors. (1995) 37(3):473–94. doi: 10.1518/001872095779049408
28. Saugel B, Reese PC, Sessler DI, Burfeindt C, Nicklas JY, Pinnschmidt HO, et al. Automated ambulatory blood pressure measurements and intraoperative hypotension in patients having noncardiac surgery with general anesthesia: a prospective observational study. Anesthesiology. (2019) 131(1):74–83. doi: 10.1097/ALN.0000000000002703
29. Saugel B, Bebert EJ, Briesenick L, Hoppe P, Greiwe G, Yang D, et al. Mechanisms contributing to hypotension after anesthetic induction with sufentanil, propofol, and rocuronium: a prospective observational study. J Clin Monit Comput. (2022) 36(2):341–7. doi: 10.1007/s10877-021-00653-9
31. Leandoer L, Lewis DH. The effect of L-norepinephrine on lymph flow in man. Ann Surg. (1970) 171(2):257–60. doi: 10.1097/00000658-197002000-00014
32. Messina A, Dell'Anna A, Baggiani M, Torrini F, Maresca GM, Bennett V, et al. Functional hemodynamic tests: a systematic review and a metanalysis on the reliability of the end-expiratory occlusion test and of the mini-fluid challenge in predicting fluid responsiveness. Crit Care. (2019) 23(1):264. doi: 10.1186/s13054-019-2545-z
33. Futier E, Lefrant JY, Guinot PG, Godet T, Lorne E, Cuvillon P, et al. Effect of individualized vs standard blood pressure management strategies on postoperative organ dysfunction among high-risk patients undergoing major surgery: a randomized clinical trial. JAMA. (2017) 318(14):1346–57. doi: 10.1001/jama.2017.14172
34. Nicklas JY, Diener O, Leistenschneider M, Sellhorn C, Schön G, Winkler M, et al. Personalised haemodynamic management targeting baseline cardiac index in high-risk patients undergoing major abdominal surgery: a randomised single-centre clinical trial. Br J Anaesth. (2020) 125(2):122–32. doi: 10.1016/j.bja.2020.04.094
35. Kouz K, Bergholz A, Diener O, Leistenschneider M, Thompson C, Pichotka F, et al. Effect of intraoperative personalized goal-directed hemodynamic management on acute myocardial injury in high-risk patients having major abdominal surgery: a post-hoc secondary analysis of a randomized clinical trial. J Clin Monit Comput. (2022) 36(6):1775–83. doi: 10.1007/s10877-022-00826-0
36. Saugel B, Vincent JL, Wagner JY. Personalized hemodynamic management. Curr Opin Crit Care. (2017) 23(4):334–41. doi: 10.1097/MCC.0000000000000422
37. Pouska J, Benes J. Pulse wave analysis. In: Saugel B, Kirov MY, Kuzkov VV, editors. Advanced Hemodynamic Monitoring: Basics and new Horizons. Switzerland: Springer International Publishing (2021). p. 69–78.
38. Saugel B, Thiele RH, Hapfelmeier A, Cannesson M. Technological assessment and objective evaluation of minimally invasive and noninvasive cardiac output monitoring systems. Anesthesiology. (2020) 133(4):921–8. doi: 10.1097/ALN.0000000000003483
Keywords: pressure field, elastance, hemorrhage, vasoconstriction, personalized hemodynamics
Citation: Woodford SF, Weinberg L, Miles LF, Marshall RC, Riedel B and Peyton PJ (2024) The pressure field model: a challenge to the conventional Starling and Guyton model of hemodynamic management. Front. Anesthesiol. 3: 1400929. doi: 10.3389/fanes.2024.1400929
Received: 14 March 2024; Accepted: 4 July 2024;
Published: 16 July 2024.
Edited by:
Robert G. Hahn, Karolinska Institutet (KI), SwedenReviewed by:
Philippe Gaudard, Centre Hospitalier Universitaire de Montpellier, FranceNora Di Tomasso, IRCCS Ca 'Granda Foundation Maggiore Policlinico Hospital, Italy
© 2024 Woodford, Weinberg, Miles, Marshall, Riedel and Peyton. This is an open-access article distributed under the terms of the Creative Commons Attribution License (CC BY). The use, distribution or reproduction in other forums is permitted, provided the original author(s) and the copyright owner(s) are credited and that the original publication in this journal is cited, in accordance with accepted academic practice. No use, distribution or reproduction is permitted which does not comply with these terms.
*Correspondence: Stephen F. Woodford, c3RldmUud29vZGZvcmRAYXVzdGluLm9yZy5hdQ==