 D. R. Baer
 P. M. A. Sherwood
94% of researchers rate our articles as excellent or good
Learn more about the work of our research integrity team to safeguard the quality of each article we publish.
Find out more
REVIEW article
Front. Anal. Sci., 22 January 2025
Sec. Surface Analysis
Volume 4 - 2024 | https://doi.org/10.3389/frans.2024.1509438
As of 2024, the use of X-photoelectron spectroscopy (XPS), initially called Electron Spectroscopy for Chemical Analysis (ESCA), has grown to become the most widely used surface analysis method. In this paper we offer a perspective of the early development of XPS and describe some of the advances and pioneers who made them that provided the foundation for it to grow into the technique we know today. Included is information about the early development of photoelectron spectroscopy, the seminal work of Kai Siegbahn, influential conferences that helped spread excitement and provide a fundamental understanding of the method, early development of commercial instruments, and identification of the need for systematic metrology. Because hundreds of researchers have contributed to advancing the method, we note that this is our perspective, with likely a different emphasis than others may have chosen. To limit the scope somewhat, we have chosen to focus on authors whose contributions started before 1980.
Starting in the middle 1960s a revolution took place that fundamentally changed the nature of surface science and enabled the remarkable development of multiple technologies that we take for granted today. In a 1983 perspective paper, Charles Duke (Duke, 1984) observed that “The recognition of the consequences of inelastic collisions of fast electrons played a key role in initiating the modern era in surface science. The resulting explosive development of surface characterization spectroscopies [….] led to a fundamental alteration in our perception of a surface or interface. Whereas in the mid-1960s an interface was regarded merely as the boundary between two bulk media, today it is seen as an independent entity: a state of matter determined by its history and exhibiting its own unique composition, structure, and electronic properties.” The tools leading to this revolution in understanding included Auger electron spectroscopy (AES) and X-ray Photoelectron Spectroscopy (XPS or ESCA, electron spectroscopy for chemical analysis) along with other methods such as Secondary Ion Mass Spectrometry (SIMS), Low-Energy Ion Scattering (LEIS), and Low-Energy Electron Diffraction (LEED).
In this paper we describe some of the developments and people that enabled XPS to grow to have the use and impact that it has today. Although significant developments by Kai Siegbahn had started in the 1950s, the effective start of XPS/ESCA as a technique and recognition of its potential importance occurred with the publication of the ESCA: Atomic, Molecular and Solid State Structure Studied by means of Electron Spectroscopy (Siegbahn et al., 1967) in 1967. Starting in the 1990s the use of XPS grew exponentially to become the most widely used tool for surface analysis (Powell, 2016; Baer et al., 2021). Several publications provide a variety of perspectives and first person views on the development of XPS including Siegbahn’s Nobel Lecture, (Siegbahn, 1981) a delightful interview of Siegbahn by David Briggs, (Briggs, 1982) a history of Uppsala and Berkeley photoelectron spectroscopy collaborations, (Martensson et al., 2022) a paper by and oral interview of Michael Kelly on the Development of Commercial ESCA Instrumentation, (Kelly et al., 2002; Kelly, 2004) and a summary of the development of photoelectron spectroscopy from 1900 to 1960 (Jenkin et al., 1977).
This paper follows some related but distinct pathways that led to the current widespread use of XPS. These include initial developments, instrument commercialization, growth in fundamental understanding, and analysis approaches facilitating the practical reliable and almost routine applications of XPS. Because the progression of XPS was enabled by many energetic and creative researchers, the story of XPS is incomplete without highlighting some of those who made contributions. Unfortunately, as hundreds of researchers have become involved with XPS, the telling of that story and identification of people involved will be to some degree dependent of personal knowledge and therefore, unfortunately but necessarily, incomplete. Consequently, the stories that follow reflect the personal perspectives of the current authors who were involved in using XPS and other surface analysis methods in different ways and at slightly different times. DRB came to use surface analysis methods starting in 1976 with an initial focus on quantitative Auger electron spectroscopy (AES) measurements as a way to study effects of grain boundary composition on intergranular stress corrosion cracking (Baer, 2022). Thus, there was a focus on quantitation, measurement consistency and reliability which extended from AES to XPS as the research evolved. PMAS started work on surface science using XPS in the Inorganic Chemistry Department at Newcastle University in 1972. His research focus has shown that basic surface chemistry can be applied to analyze and understand important practical problems, many of which have a direct relevance to industry.
The history of photoelectron spectroscopy is a fascinating story of the development of instrumentation that could measure the photoelectron spectrum, the application of the experiment to the different phases of matter, especially the surfaces of solids, and the development of theoretical models that could correctly interpret the results and data analytical approaches to extract accurate information from the experiments.
The photoelectric effect was discovered in 1887 by Hertz (1887) who found that the discharge from a spark gap gave an enhanced discharge when illuminated with ultraviolet light. Thus, UV photoelectron spectroscopy was born. The experiment was explained by Einstein (Arons and Peppard, 1965; Einstein, 1905) in 1905 using quantum theory:
In the early twentieth century photoelectron experiments were conducted using X-rays by several researchers (Jenkin et al., 1977) including Robinson in papers published in 1914, 1923 and 1925 (Robinson and Rawlinson, 1914; Robinson, 1923; Robinson, 1925). Other studies in this time period were conducted including those by Whiddington (Whiddington, 1922), Kang-Fuh Ho (Hu, 1918) and de Broglie (Broglie, 1921). These experiments consisted of a vacuum system with an attached X-ray gun, a sample placed in a magnetic field and a detection system consisting of a photographic plate. Different photoelectron energies gave rise to different radii for the electrons that led to a series of lines on the photographic plate. In Robinson’s 1925 paper (Robinson, 1925) he published photometer scans of the photographic plate, showing scans for two different composition plates for identical experiments, one of these scans shows more detail (but more noise which Robinson attributes to granulations in the photographic emulsion) and will be discussed further. Robinson discussed the challenge of publishing the photographic plate image caused by the degradation of the quality of the photographic plate picture when reproduced for a journal. A photometer scan conducted on the original plate gives rise to a plot more suitable for publication that shows the intensity in terms of rH where r is the radius of the electron in the magnetic field H. Figure 1 shows what we believe to be the first X-ray photoelectron spectrum which we obtained by digitizing the photometer scan in Robinson’s paper generating 800 equally spaced points and then calculating the binding energy of each of these points from the rH values in the photometer scan using the CuKα1 X-ray energy.

Figure 1. The first published X-ray photoelectron spectrum. This figure of photoelectrons from a gold target, was produced by digitizing the photometer trace of Plate V, Figure 2 - center from “Henry R. Robinson, Philos. Mag. 50, 241–250, 1925”. Each of the 800 points of the digitized data were converted from the plot of intensity versus rH into a plot of intensity versus binding energy with the high binding energies on the left. The photon energy was taken as the CuKα1 X-ray energy (8047.78 eV). The locations of 4s, 4p, 4d and 4f, 3s, 3p, and 3d photoelectron peaks have been identified at the binding energies where they would appear on a modern instrument, showing that the early instruments and X-ray sources did not have the resolution to observe these individual photoelectron peaks. The text for the 4p and 4d spin orbit split peaks is in small print to fit in the limited space on the figure.
The same apparatus used to generate an X-ray photoelectron spectrum was also used to study β-ray energies (e.g., (Rutherford et al., 1914)) and this was an active study area for many years.
The data in Figure 1 show the position of gold atomic energy levels using CuKα1 X-ray energy, but the resolution is very poor (each division of the binding energy scale represents 80 eV. While gold metal would not be expected to show any chemical shifts (though gold oxide shows a chemical shift from the metal of about 2eV (22)) it is clear that this type and generation of instrument would be unable to detect any chemical shifts for systems where chemical shifts, as we know them today, are normally less than 10 eV, and usually much less than this. Another challenge is that Figure 1 shows a spectrum produced with CuKα X-rays (Kα1 Energy = 8047.78 eV) which gives rise to much higher kinetic energy (and thus are less surface sensitive) photoelectrons than most X-ray sources used in current XPS instruments. In addition, CuKα X-rays have a much greater line width than the achromic X-ray sources in modern XPS instruments consisting of a doublet separated by 50.9 eV with each doublet having a FWHM (full width at half maximum) of Kα1 = 2.40 eV and Kα2 = 2.98 eV.
While these early experiments were pioneering, the low X-ray intensity, wide X-ray lines, poor resolution, and limits of photographic detection would mean that it would be another 30 years before the advances in instrumentation allowed X-ray photoelectron spectroscopy to be able to realize its true potential and another 10 years before this powerful spectroscopy was appreciated by the wider scientific community.
One of us (PMAS) remembers his first chemistry lecture at high school in January 1959 when the focus was on the periodic table and he was told about core electrons and valence electrons, specifically pointing out that only valence electrons were of interest as core electrons took no part in chemical bonding and all had the same energy for a given core energy level in different compounds. Thus, the core level BE shifts we measure today were unexpected by many.
Key instrumental developments were made by Kai Siegbahn in the 1950s who built an iron-free double-focusing magnetic spectrometer that was initially used for measuring β-ray energies. The ϐ-ray studies relied on an unstable cyclotron, and he ultimately decided to simulate radioactive radiation using a foil and X-ray tube approach like the one he used to study the gamma decays. He decided to study the conversion from X-rays to electrons following up on work done by Robinson in England and Maurice de Broglie in France. To change from photographic detection to electronic detection using Geiger-Muller counting, he had to alter spectrometer capabilities to detect electrons at much lower energy, around 1 keV. He started building the instrument in Stockholm and continued the work in Upsala where he moved in 1954.
Box 1 Instrument development.
Instrument development was critical to the development of ESCA and involved many considerations and technology innovations, some of which were described in the interview of Siegbahn with David Briggs (Briggs, 1982).
Early on, Siegbahn realized that high energy resolution and adequate signal would be critical elements of the spectrometer design. He needed an estimate of the number of electrons that would be available for detection, recognizing that electrons would not travel far through solids. In estimating the number of electrons to expect, he had to estimate what today we would call an electron mean free path. He commented to Briggs that, “I made a guess that it was probably more than a single atom layer and that it must be smaller than a light wave, perhaps 100 Å or so, without losing energy. That was not a bad guess when you consider what happened later on.”
The first X-ray photoelectron spectrum that could provide accurate atomic binding energies was published in 1957 (Nordling et al., 1957) using an X-ray tube rather than a radioactive source. Figure 2 shows a redrawing of this first spectrum. MoKα X-rays (Kα1 Energy = 17479.34 eV, Kα2 Energy = 17374.30 eV) consisting of a doublet separated by 105.3 eV with each doublet having a FWHM of Kα1 = 6.48 eV and Kα2 = 6.66 eV, were used. In Figure 2 one peak is seen for the Cu1s core level of an evaporated copper metal sample with the 1:2 intensity ratio expected for the photoelectron peaks excited by the Kα1and Kα2 X-radiation. Each of the Cu1s peaks show a satellite at lower binding energy. In 1958 (Sokolowski et al., 1958) the first report of a chemical shift was made by Siegbahn and colleagues reporting a shift between metallic copper and CuO. The shifts and satellite features in copper and its oxides are complex and we have learned that oxidized copper can decompose in the spectrometer (Thomas et al., 1989).
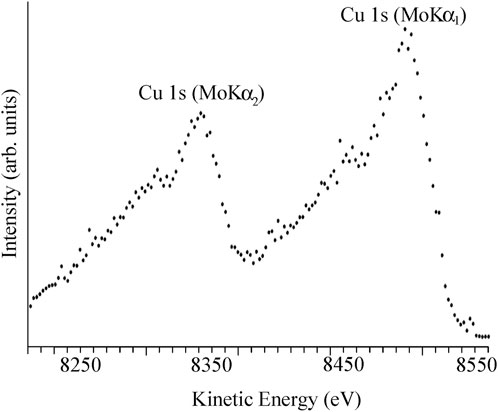
Figure 2. The first modern high resolution X-ray photoelectron spectrum. This figure was produced by digitizing and plotting the experimental data points from Carl Nordling, Evelyn Sokolowski and Kai Siegbahn, Phys. Rev., 105, 1676–1677, 1957.
One of us (PMAS) heard a lecture given by Professor Siegbahn at the University of Pittsburgh in 1982 when he described how in the 1950s two new graduate students (Carl Nordling and Evelyn Sokolowski) were starting research and Professor Siegbahn had initially wanted them to use the new instrument for measuring β-ray energies but the radioactive source was delayed, so a molybdenum X-ray tube was attached to the instrument generating the first X-ray photoelectron spectrum using the accurate instrument. Copper was initially chosen as it was readily available in the laboratory, but the metal was of course oxidized and the Cu1s spectrum showed a shoulder due to CuO. Figure 2 was obtained with evaporated copper metal (Nordling et al., 1957) and then the chemical shift for the oxide was reported in the second paper (Sokolowski et al., 1958).
Comparison of Figures 1, 2 clearly shows the limitations of the early spectrometers. Thus Figure 1 does not show separate features for the photoelectron peaks excited by the Kα1and Kα2 X-radiation so clearly seen in Figure 2.
Kai Siegbahn, who received the 1981 Nobel Prize in Physics, refers to Robinson’s work and his spectrum (Figure 1) in his Nobel Prize lecture (Siegbahn, 1981). He describes the dramatic improvement in instrument performance that he was able to achieve in his laboratory.
In the 10 years that followed the initial observation, chemical shifts were found for many compounds, the potential for surface chemistry was demonstrated and the use of X-ray photoelectron spectroscopy demonstrated for the solid, gaseous and liquid phases. The ability of X-ray photoelectron spectroscopy, now using soft magnesium and aluminum X-rays of much narrower line width, to give chemical shifts for the same atom in different chemical environments led Siegbahn to describe the technique as ESCA = Electron Spectroscopy for Chemical Analysis.
Box 2 Chemical Shifts and 24-Hour Instrument Operation.
In the interview with Dave Briggs, Siegbahn provides several interesting insights. The discovery of chemical shifts in binding energies (BEs) was an unexpected and initially disturbing observation. They were carefully studying binding energies as a function of atomic number. When they used non-metallic materials, they observed unexplained jumps from the straight lines expected. Eventually, years later, they looked at sodium thiosulphate and got two discrete lines from the same molecule. Following up with additional measurements of other sulfur compounds allowed the discovery of the impact of valence state on the measured core level BEs. At that point they knew they had found something interesting and Electron Spectroscopy for Chemical Analysis was started.
Siegbahn acknowledged the contributions of many colleagues and students. These included Kay Edvarson who came to Upsala with him, got a spectrometer working and went back to Stockholm. Students Evelyn Sokolowski and Carl Nordling were co-authors on the first paper on a chemical shift in BE in 1958, and later close associates. He observed that then came “lots of good students, one after the other, because it was a fine field to do a doctor’s thesis in–there was so much to measure and write papers on. We ran a shift system with a four-hour shift for each member of the team, day and night, Saturday and Sunday–we never stopped.”
Two books were published that had a major impact in the awareness of the potential for ESCA, the 1967 book (Siegbahn et al., 1967) focused on solids and the 1969 book (Siegbahn et al., 1969) concerned with gas phase ESCA. In his oral history discussion Mike Kelly, (Kelly et al., 2002), more about him later, observed that “It [the Siegbahn book] came out in 1967 so most of the work was work in it [had been] done previously. The scientific community was fairly aware of it, but that book was phenomenal as a marketing tool. It really was. You read it and you just had to have one. It was quite a tour de force.” In the Briggs interview, Siegbahn noted that until the book came out their work was “not read by many people, so we really had a pleasant time. We could get on with our work without being bothered by people who had read about it in the literature.” However, after the book came out “there was a lot of interest–many people were surprised to get a whole new spectroscopy in one book like that.” (Briggs, 1982).
In describing the role of an Uppsala and Berkeley collaboration on the development of modern photoelectron spectroscopy, Martensson et al. (Martensson et al., 2022) make the interesting observation “[…] that modern photoelectron spectroscopy was practically impossible before 1955. The photoelectric effect was identified already by Heinrich Hertz, (Thomas et al., 1989), but it turned out that it was very difficult to observe dispersed spectra from the emitted electrons. The theoretical description was made already in 1905 by Albert Einstein (Arons and Peppard, 1965; Einstein, 1905). However, a general interpretation of an electron spectrum could be made only after the “golden years of quantum mechanics” 1925–1930. There were some early efforts to experimentally study an electron spectrum; the best known is Robinson’s paper from 192. (Robinson, 1925). In this study, a gold sample was illuminated by radiation from an x-ray tube and the outgoing electrons were dispersed using a homogeneous magnetic field. Only the x-ray edges of gold were observed. The main obstacles for progress were that the vacuum technology was poor, the focusing of the photoelectrons was poor, and last, but not least, the necessary detectors were not developed.”
By 1970 interest in photoelectron spectroscopy was growing worldwide not only because of Kai Siegbahn’s work in the X-ray region, but also because of D.W. Turner’s work on UV photoelectron spectroscopy. Turner and his colleagues published a book in 1970 which contained a collection of UV photoelectron spectra (using He(I) radiation – 21.22 eV) of gas phase molecules from simple molecules to complex organic and inorganic molecules (Turner et al., 1970). Instrument manufacturers began to offer both X-ray and UV photoelectron spectrometers, the latter being simpler and much less expensive than the former.
The interest in X-ray photoelectron spectroscopy was intense especially because chemical shifts that could be found on almost every element except for hydrogen and helium. This was very exciting for chemists because it was a time when NMR was only being used to study hydrogen and fluorine chemical shifts. ESCA could be likened to an “all element NMR instrument”. Initially, the spectra seemed easy to analyze, firstly because every element had a characteristic set of core energy levels and the chemical shifts appeared easy to understand. The best example was the so called “ESCA molecule” – ethyl trifluoroacetate CF3-CO-O-CH3 - which had four carbon atoms in a different chemical environment giving rise to four separated peaks in the C1s region where the binding energy increased with the electronegativity of the groups attached to the carbon atoms. The spectrum was first published in Siegbahn’s 1967 book using achromatic X-radiation (Siegbahn et al., 1967) and later with monochromatic AlKα X-radiation (Gelius et al., 1973) giving the spectrum in Figure 3. A recent paper provides new data using 340eV synchrotron radiation and a full analysis of this gas phase spectrum showing that the new spectrum is more complicated than the 1:1:1:1 intensity ratio shown in Figure 3 (Travnikova et al., 2012).
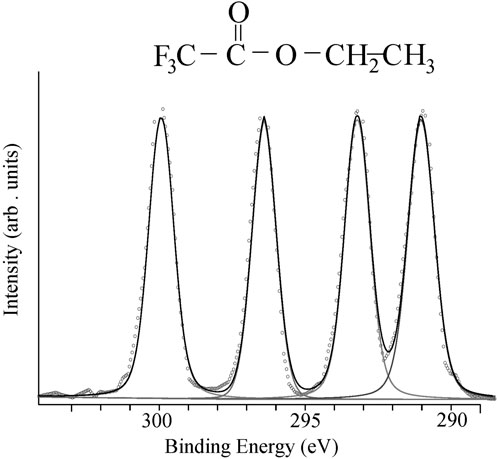
Figure 3. Gas phase X-ray photoelectron spectrum of the “ESCA molecule” – ethyl trifluoroacetate CF3-CO-O-CH3 obtained using monochromatic AlKα X-radiation. The figure was produced by digitizing the experimental data points from U. Gelius, E. Basilier, S. Svensson, T. Bergmark and K. Siegbahn, J. Electron. Spec. Rel. Phen., 2, 405–434, 1973. The data points were then adjusted so that they were equally spaced and doubled to give 329 data points. The spectrum was fitted with four Voigt functions with an approximate intensity ratio of 1:1:1:1.
The apparent dependence of the chemical shift on the charge on the atom led to models being developed in the 1970s which used a point charge model which in the most effective form took into account the charge on the atom, the charges on the surrounding atoms and the differences in extra atomic relaxation. For example, good agreement was obtained for transition metal compounds (Sherwood, 1976). Attempts were made to find a linear relationship between X-ray photoelectron chemical shifts and chemical shifts in NMR, NQR and Mossbauer spectroscopies. While linear relationships were found for some substances, in general agreement was not found as would/should be expected because of the different physics of these spectroscopies (Sherwood, 1976).
The distinction between X-ray photoelectron spectroscopy and UV photoelectron spectroscopy soon became blurred as the increasing availability of synchrotron radiation, especially dedicated storge rings, enabled a wide range of photon energies to be used. By the mid-1970s photoelectron spectra generated by synchrotron radiation became a very active area. David Shirley was a pioneer in this area. Shirley was one of the key early pioneers in instrument development and the development of a detailed understanding of photoelectron spectroscopy (Shirley et al., 1978). Shirley began his interest in photoelectron spectroscopy in 1965 and detailed his early involvement in the field in a paper published in 2004 (Shirley and Fadley, 2004). A recent paper (Martensson et al., 2022) describes the pioneering work of Siegbahn (who spent a sabbatical year in 1961 in Shirley’s laboratory) and Shirley. A useful overview of the early synchrotron studies has been published by Kunz (Kunz et al., 1979).
Many of the early pioneers took part in meetings that were significant in advancing the spectroscopy. The first conference on photoelectron spectroscopy (International Conference on Electron Spectroscopy) was organized by David Shirley and held in Asilomar Conference Grounds in Pacific Grove, California on September 7–10, 1971. The first Gordon Conference on electron spectroscopy was organized by David Hercules in 1974 and was held every 2 years until 1998.
A very influential meeting in Namur, Belgium on April 16–19, 1974, had all the key players present. It was the second major conference following the Asilomar Conference of 1971. The conference entitled “Electron spectroscopy: progress in research and applications” with the proceedings published in Volume 5 of the Journal of Electron Spectroscopy and Related Phenomena (established 1972). The attendance list (List of participants, 1974) shows that nearly all those involved in XPS were present, and Tom Carlson’s overview (Carlson, 1974) showed the optimism and progress that had been made in what was then a new field. Among the 61 papers published from the Namur meeting were important papers from Dick Brundle, Tom Carlson, Paul Citrin, Chuck Fadley, David Hercules, Wayne Rabalais, Kai Siegbahn, and Nick Winograd (Caudano and Verbist, 1974).
The Namur meeting involved and recognized the important applications of XPS to practical problems and problems that were important to industry. There were initiatives to bring together academic researchers and industrial researchers on a regular basis. An example of this approach was the formation of the “UK ESCA Users Group”. John C. Rivière had the idea of starting this group that brought together people working in the field from industry and academic life, with a membership fee for the industrial participants that would cover the expenses of the academic members. The first annual meeting was in 1980 and later meetings were held in various locations. John was the Chairman of the Group, Louise Davis of the Welding Institute was Secretary, David Keast of Gillette Industries was Treasurer and the committee had three members, Jim Castle, Martin Seah and Peter Swift. Other industrial and government participants in the users group included Shell Research, International Paint PLC, Alcan International, Imperial Chemical Industries (ICI),BP Research, ARE Harwell, Central Electricity Research Laboratories, and the UK Atomic Energy Authority. The group continues in the UK under its new name “The UK Surface Analysis Forum”. The European Conference on Surface and Interface Analysis (ECASIA which has been held every 2 years since 1985) was initiated in 1982 when the Dutch SCADEG group and the UKESCA Users Group recognized the need for a European forum for the applied surface scientist.
Researchers moved from industry to university and vice versa. Jim Castle was an early pioneer who moved from the Central Electricity Research Laboratories to start a surface science group at the University of Surrey in the UK. David Briggs had a long career at ICI and made major contributions to XPS and was the first editor of Surface and Interface Analysis (established in 1979). Walter Haas at the U.S. Air Force Materials Laboratory, which hosted Siegbahn as a visitor, joined by John Grant conducted pioneering work in materials research for the Air Force. The US Air Force was one of Siegbahn’s early sponsors. Chuck Wagner at Shell Development Company conducted important catalysis studies and made significant contributions to XPS including the development of empirical sensitivity factors, (Wagner et al., 1981), the foundations for the Auger parameter (Wagner, 1975) and led the establishment of the NIST XPS database (Lee et al., 2002; NIST X, 2022).
Early studies in our own work provide an example of the wide range of applications involving XPS (and AES) including work on corrosion and oxidation (Hoar et al., 1972; Baer et al., 1982), stress corrosion cracking (Jones et al., 1982), bacterial cell walls, (Baddiley et al., 1973), differential sample charging, (Dickinson et al., 1973; Edgell et al., 1986), electrode surfaces, (Dickinson et al., 1975), carbon fibers, (Proctor and Sherwood, 1982a), and data analysis (Proctor and Sherwood, 1982b).
The excitement about ESCA/XPS, especially stimulated by the publication of the ESCA books in 1967 and 1969, including the growing scientific community, the promise of chemical state identification, and the growing number of application areas, encouraged several vendors to develop XPS instruments. As noted by Kelly, the development of commercial instruments started a transition from most researchers building their own instruments to increased use of commercially developed instrumentation (Kelly et al., 2002).
In a paper on the early commercial development and in his oral history (Kelly, 2004), Kelly noted that because there was hope that ESCA would be for solids what NMR was for liquids, many vendors worked to developed appropriate instrumentation. He noted that there were several early in and early out vendors who had taken a variety of approaches to develop appropriate instrumentation. He briefly described the approaches taken by the initial vendors which in the early 1970s including Varian Associates, Hewlett Packard, Du Pont, AEI, McPherson, and Vacuum Generators.
As described earlier, the development of XPS required a good deal of creative instrumentation development. The various vendors needed to address in cost-effective user-friendly ways, vacuum requirements, X-ray sources development, sample handling, and sensitivity concerns (Kelly, 2004). Each of the initial instruments had various degrees of success and limitations. However, the anticipated market growth did not meet reality and some companies and investors lost interest, even if they had good instruments. Instrument costs, the cost of supporting qualified analysts, the need for sample size flexibility, and often the need for use of multiple techniques limited the growth of XPS. Some of these issues remain today, especially the relatively high costs of modern instruments and limited support for XPS skilled analysts, inhibit access to the method for some research groups.
It is interesting to note that in spite of the rapid entry and departure of some vendors, several of the current vendors have roots in these early efforts. The Du Pont instrument was obtained by Shimadzu which owns Kratos. AEI was renamed Kratos and the initial AEI design influenced some Kratos instrumentation (Kelly, 2004). Vacuum Generators is now part of the Thermo-Fisher collection of advanced instrumentation. The Hewlett Packard instrument, for which Mike Kelly led development of a prototype instrument, had a second life as the spectrometer sold by Surface Science Instruments (SSI). Although not one of the initial companies from the 1970s, Scienta grew from the XPS instrument expertise at Uppsala. Phi (Physical Electronics) started with an Auger focus but added XPS capability initially with a variant of their cylindrical mirror analyzer used for AES. Kratos and PHI both celebrated 50th anniversaries of their surface instrumentation in 2019.
Laboratory XPS instrumentation has continually developed since the initial instruments. However, the near exponential growth in XPS related publications in the literature starting in 1990 (4, 50) occurred at the time several vendors introduced new generations of instruments that included development of monochromatic X-ray sources with higher intensities, in some cases with focused beams, and significant detector improvements, both of which decreased the time needed to collect high-quality spectra.
As noted by Zafeiratos and Zafeiratos (2023), in parallel with the development of “general” laboratory instrumental capabilities was the development of synchrotron radiation, initially designed for physics studies, which were found useful for XPS measurements (Cramer, 2020). A 1974 publication of the Au 4f doublet was described as “the first X-ray photoemission spectroscopy (XPS) experiments performed at Stanford Synchrotron Radiation Project, using synchrotron radiation from the Stanford Positron Electron Accelerator Ring (SPEAR) facility” (Lindau et al., 1974). As observed firsthand by PMAS when he was on sabbatical at Berkeley in 1976, early synchrotron XPS measurements were secondary to the primary efforts of the facilities often involving “off hours” operation and transporting spectrometers to available beam lines. Martensson et al. (2022) describe the differing roles of Shirley and Siegbahn on the development of synchrotron photoemission research including the construction of synchrotrons optimized for photoemission studies and spectrometers that worked well as part of beam lines. Advantages of synchrotrons as X-ray sources over laboratory based XPS systems include source intensity and variable energy. Chuck Fadley’s paper “X-ray photoelectron spectroscopy: Progress and perspectives” (Fadley, 2010) discusses uses and capabilities of both laboratory and synchrotron X-ray sources throughout the paper.
Synchrotron based photoelectron research has played a significant role in the development of standard laboratory XPS capabilities, including development of near ambient pressure XPS (NAP-XPS) and sources for laboratory Hard X-ray Photoelectron Spectroscopy (HAXPES). The motivation for development of easy-to-use monochromatic X-ray sources of higher energy than available from the now common Al Kα sources was the successful use of higher energy measurements at synchrotron beam lines. The first NAP-XPS measurements took advantage of the higher X-ray intensities at synchrotrons before laboratory NAP-XPS capabilities were developed (Salmeron and Schlögl, 2008).
As the use of surface spectroscopies grew, XPS, AES and other surface sensitive analysis methods were increasingly used to address applied problems and there were needs to quantify surface compositions, to understand the surface sensitivity of the methods, and to assess the consistency and reliability measurements at different times and with different instruments. The prominent leaders in this area were Martin Seah of the National Physical Laboratory in the UK and Cedric Powell of the United States of America National Institute of Science and Technology (NIST–the United States of America National Bureau of Standards [NBS] became NIST in 1988). As described below, they interacted and complemented each other in multiple ways. 1979, Seah set up the Quantitative Surface Analysis (QSA) conference series in the UK which was a focal point for those struggling with undertaking quantitative analysis using surface analysis methods (Watts, 2022). Similarly, Powell started a series of QSA conferences in 1986 in the United States of America that continue today (Powell and Holloway, 2007).
Martin Seah was initially involved in AES studies of grain boundary compositions (Lea, 2022; Powell, 2022). As described by an early colleague Colin Lea, after these studies, “[Seah’s] work at the National Physical Laboratory moved these analytical tools from observational toys to quantitative solution providers. With characteristic foresight, in the 1980s, Martin made a strategic change in his work, away from the use of surface analysis for problem solving, to focus on measurement and calibration issues, more in line with the metrological role of the National Physical Laboratory.” (Lea, 2022) Powell summarizes the impact “Martin was the major force in developing improved procedures to enable users of AES, XPS, and SIMS to make reliable measurements.” (Watts, 2022) This effort had many components including the development of standards through ASTM E42 Committee of Surface Analysis and ISO TC201 Surface Chemical Analysis, many papers addressing critical topics, and other types of leadership described in a memorial issue of Surface and Interface Analysis dedicated to Seah’s career and major contributions (Watts, 2022).
The contributions of Cedric Powell have been of similar high impact. (Powell and Holloway, 2007). He was a pioneer developing understanding of multiple aspects of electron spectroscopy, the most known likely being the development of improved understanding and predictable inelastic mean free paths and related quantities as they applied to XPS. (Powell, 2020). In addition to many papers related to aspects of electron spectroscopy, he has also been a highly effective organizer and leader in multiple areas including the development of data bases provided by NIST, (Powell, 2016; Powell, 1991; Surface Data), the development of a spectral modeling program (SESSA which incorporates much surface data), (Smekal et al., 2005), guiding the development (including writing of many standards) while serving as chair of ASTM E-2 and the founding chair of ISO TC201 (Powell, 2016).
As quantification increased in importance, relative sensitivity factors were developed to assist quantification. There were two approaches to their establishment as recently summarized by Brundle and Crist (2020), Wagner et al. (1981) took an empirical approach while a more theoretical approach utilized cross sections calculated by Scofield (1976). Chuck Wagner also proposed the combination of energies associated with binding energies of photoelectron peaks and kinetic energies of X-ray initiated Auger peaks to determine the Auger parameter to provide chemical state information. He found that changes in the Auger parameter could be “attributable solely to changes in the polarizability of the solid compounds” (Wagner, 1975).
Two interlaboratory comparison studies reported in the late 1970s fully verified the need for improved instrument and analysis understanding and the need for procedure development (Madey et al., 1977; Powell et al., 1979). In a 2007 AVS interview (Powell and Holloway, 2007), Cedric Powell described the development of these studies and their impacts. “ASTM formed Committee E-42 on Surface Analysis in 1976 because people had been using the new surface analysis techniques and applying them to practical problems, and they realized that the techniques were more complicated than they had initially appreciated and that they needed guidance through the use of procedures which would help enable them to get more reliable results. About this time, around 1975-76, a separate ASTM committee, D-32 on Catalysts, was formed and one of their first activities was to conduct a round robin involving Auger and XPS measurements on catalysts. This round robin was led by my NBS colleague Ted Madey and involved other leaders in the field at the time, Charles Wagner and a Dr. A. Joshi. They found alarming spreads in reported energies and relative intensities from these catalyst materials, in both Auger and XPS. It was thought that these spreads were at least partly due to charging. Another round robin was organized with metal samples, and I led it with my NBS colleagues Nils Erickson and Ted Madey under the auspices of the new ASTM E-42 Committee. At that time, I was the chair of the Auger subcommittee of E-42. The new round robin also showed considerable spreads in the energies and relative intensities of Auger and XPS peaks, but without the charging complications of the catalysts. These spreads showed that, although the precision of the measurements [for specific instruments] was excellent, the accuracy was poor. The round robin results formed the basis for my later activities at NBS/NIST. They also formed the basis for parallel activities of my colleague, Martin Seah, of the UK National Physical Laboratory (NPL).”
The second round robin study on metals found large inconsistencies of photoelectron peak amplitudes (x10 variation) and energies (±2 eV) (Powell et al., 1979). The information obtained helped provide a roadmap for efforts of instrument manufacturers, analysts and standards committees regarding instrument development, operational guidance and multiple standards. For several years the E42 committee organized topical symposia at the Pittsburgh Conference on Analytical Chemistry and the American Vacuum Society International Symposia. A symposium on Applied Surface Analysis was held at the 39th Pittsburgh Conference in Analytical Chemistry and Applied Spectroscopy. The conference proceedings were published in 1980 as an ASTM monograph included as authors many pioneers and significant contributors in applications of XPS and AES including Terry Barr, Jesse Lumsden, Jim Castle, Chuck Wagner, Paul Holloway and Yale Strausser (Barr and Davis, 1980).
As the use of XPS, AES and other surface analysis methods developed and grew, an infrastructure supporting the community also evolved. Here we note a few of these and the dates they were established. Many of these were initiated or changed form as new technologies were established and surface analysis evolved.
• The American Vacuum Society (AVS), initially called the Committee on Vacuum Techniques, was started in 1954 to address issues associated with high vacuum technology and became the AVS in 1957. As noted by Duke, in the 1960s the new technologies made surface science as we know it today possible and a Surface Science Division was formed in 1968. Some of the activities and meetings associated with the ASTM E42 committee that started in 1976 were included in the AVS annual symposia and led to the formation of the Applied Surface Science Division in 1985.
• The AVS Journal of Vacuum Science and Technology (JVST) was started in 1965 and grew from publications of earlier symposia proceedings. In 1985 the journal split into two separate journals, JVSTA and JVSTB with JVSTA focusing on Vacuum, Surfaces and Films and JVSTB on Microelectronics (later adding nanotechnology).
• The Elsevier Journal of electron Spectroscopy and Related Phenomena, which played an important role in XPS development, was first published in 1972.
• ASTM International Committee E42 on Surface Analysis was established in 1976.
• The Wiley journal Surface and Interface Analysis was initiated in 1979 and focuses on the development, and application of techniques for the characterization of surfaces, interfaces, and thin films.
• UK ESCA Users Group/UK Surface Analysis Forum was started in 1980.
• European Conference on Surface and Interface Analysis (ECASIA) was initiated in 1982 with meetings started in 1985.
• ISO Committee TC201 on Surface Chemical Analysis was established in 1991.
• The Surface Analysis Society of Japan (SASJ) was founded in 1995 to promote the standardization of surface analysis techniques. It has published the Journal of Surface Analysis since 1995. It holds annual Practical Surface Analysis (PSA) meetings and in cooperation with the Korean Society for Surface Analysis, and a triennial International Symposium on Practical Surface Analysis.
We have focused in this paper on the early pioneers with mentions being restricted to those who started publishing in the 1970s or earlier. Many pioneers have been acknowledged, both specifically in the text and in the reference to the participants in the early conferences. Many others played significant roles in the development of XPS. In the period after 1980 many new contributors, pioneers in many ways, of both genders started in the field and major contribution were made.
The use of XPS has grown exponentially, especially in the past 30 years, and new developments such a HAXPES and NAP-XPS facilitate the collection of wider ranges of information from XPS (Grant, 2023). The data reporting growth of XPS use based on publications does not include the unpublished uses in industry that involve many types of applications including product development, failure analysis, contamination detection, and product reliability. Industrial use of XPS (XPS in academia and industry, 2022) includes advanced materials, semiconductors, catalysis (Zafeiratos and Zafeiratos, 2023), wear and corrosion, contamination and adhesion. A 2024-2030 market analysis for XPS (X-ray Photoelectron Spectroscopy Market Size, 2024) reported that the greatest area of growth for XPS in 2023 was in healthcare in hospitals and healthcare institutes. Medial applications suggested include drug discovery, contamination detection, and cancer detection (Sancho-Albero et al., 2023). With new XPS instrumentation there are increasing opportunities for industrial applications including process monitoring in real time.
However, as the community of XPS users expands, increasingly non-experts are using the method, too often with erroneous data analysis or incomplete parameter reporting. Consequently, along with major strides forward and great instrumental reliability, some of the challenges of reproducibility explored and solved in the 1970s and 1980s are reappearing (Baer et al., 2021; Major et al., 2023a; Major et al., 2023b; Pinder et al., 2024; Herrera-Gomez et al., 2024). Relative to the most common applications of XPS for quantitative analysis, it is appropriate to call attention to the complexities of sensitivity factors as discussed by Brundle and coworkers, (Brundle and Crist, 2020; Brundle et al., 2021), difficulties observed in the use of peak fitting (Major et al., 2023a; Major et al., 2023b; Pinder et al., 2024), and an important simple way to verify instrument operation so that the precision available in modern instruments can be maintained and verified (Wolstenholme, 2020).
It seems relevant to end with an insight from Martin Seah in an email to DRB in 2021 “The problem with XPS is that it is [seems?] actually very simple and straightforward–but it is also very flexible and informative in a very multidimensional way with both chemical and physical data. So, it is vastly more informative than many 1 or 2 dimensional methods–although simple in each of the applications. It is a very data rich method. Most young scientists will have come through one of the disciplines and need help grappling with the concepts from the other disciplines (which are often difficult–physicists like physics and chemists like chemistry!).” The richness and multidimensional nature of XPS data continues to have multiple avenues for exploration and offers a variety of opportunities for additional understanding and avenues of application as it has done for the past 70 years.
DB: Conceptualization, Writing–original draft, Writing–review and editing. PS: Conceptualization, Writing–original draft, Writing–review and editing.
The author(s) declare that no financial support was received for the research, authorship, and/or publication of this article.
Thank you to Lazlo Kovar for information about the Dave Briggs interview of Kai Siegbahn, to John F Watts for tracking down a copy of the interview and to Caroline Hroncich at Spectroscopyonline.com for making the interview accessible online. The suggestions and thoughts from Cedric Powell, Jim Castle, and John Grant are much appreciated.
The authors declare that the research was conducted in the absence of any commercial or financial relationships that could be construed as a potential conflict of interest.
The author(s) declare that no Generative AI was used in the creation of this manuscript.
All claims expressed in this article are solely those of the authors and do not necessarily represent those of their affiliated organizations, or those of the publisher, the editors and the reviewers. Any product that may be evaluated in this article, or claim that may be made by its manufacturer, is not guaranteed or endorsed by the publisher.
Arons, A. B., and Peppard, M. B. (1965). Einstein's Proposal of the Photon Concept—a Translation of the Annalen der Physik Paper of 1905. Am. J. Phys. 33 (5), 367–374. doi:10.1119/1.1971542
Baddiley, J., Hancock, I. C., and Sherwood, P. M. A. (1973). X-Ray photoelectron studies of magnesium ions bound to the cell walls of gram-positive bacteria. Nature 243 (5401), 43–45. doi:10.1038/243043a0
Baer, D. R. (2022). Four vignettes on interactions with Martin Seah: the impact of his work. Surf. Interface Anal. 54 (4), 308–313. doi:10.1002/sia.7019
Baer, D. R., McGuire, G. E., Artyushkova, K., Easton, C. D., Engelhard, M. H., and Shard, A. G. (2021). Introduction to topical collection: reproducibility challenges and solutions with a focus on guides to XPS analysis. J. Vac. Sci. Technol. A 39 (2), 021601. doi:10.1116/6.0000873
Baer, D. R., and Thomas, M. T. (1982). “Use of surface analytical techniques to examine metal corrosion problems,” in Industrial applications of surface analysis. ACS symposium series. Editors L. A. Casper, and C. J. Powell (American Chemical Society), 199, 251–282. doi:10.1021/bk-1982-0199.ch011
T. L. Barr, and L. E. Davis (1980). Proceedings of applied surface analysis held at the 39th Pittsburgh conference in analytical chemistry and applied spectroscopy 1978 (Cleveland Ohio: ASTM International). STP699-EB. doi:10.1520/STP699-EB
Briggs, D. (1982). The story of ESCA: interview of Kai SIegbahn by David Briggs. Eur. Spectrosc. News 25. Available at: https://www.spectroscopyonline.com/view/the-story-of-esca-an-interview-with-nobel-prize-winner-kai-siegbahn.
Broglie, Md (1921). Les phénoménes photo-électriques pour les rayons X et les spectres corpusculaires des éléments. J. Phys. Radium 2, 265–287. doi:10.1051/jphysrad:0192100209026500
Brundle, C. R., and Crist, B. V. (2020). X-ray photoelectron spectroscopy: a perspective on quantitation accuracy for composition analysis of homogeneous materials. J. Vac. Sci. Technol. A 38 (4), 041001. doi:10.1116/1.5143897
Brundle, C. R., Crist, B. V., and Bagus, P. S. (2021). Accuracy limitations for composition analysis by XPS using relative peak intensities: LiF as an example. J. Vac. Sci. Technol. A 39 (1), 013202. doi:10.1116/6.0000674
Carlson, T. (1974). Summary talk. J. Electron Spectrosc. Relat. Phenom. 5 (1), xvii–xxi. doi:10.1016/0368-2048(74)85004-8
Caudano, R., and Verbist, J. (1974). foreword. J. Electron Spectrosc. Relat. Phenom. 5 (1). vii-viii. doi:10.1016/0368-2048(74)85001-2
Cramer, S. P. (2020). X-ray spectroscopy with synchrotron radiation: fundamentals and applications. 1st ed. Switzerland: Springer Cham: Springer Nature.
Dickinson, T., Povey, A. F., and Sherwood, P. M. A. (1973). Differential sample charging in ESCA. J. Electron Spectrosc. Relat. Phenom. 2 (5), 441–447. doi:10.1016/0368-2048(73)80058-1
Dickinson, T., Povey, A. F., and Sherwood, P. M. A. (1975). X-ray photoelectron spectroscopic studies of oxide films on platinum and gold electrodes. J. Chem. Soc. Faraday Trans. 71 (0), 298–311. doi:10.1039/f19757100298
Duke, C. B. (1984). Atoms and electrons at surfaces: a modern scientific revolution. J. Vac. Sci. Technol. A 2 (2), 139–143. doi:10.1116/1.572710
Edgell, M. J., Baer, D. R., and Castle, J. E. (1986). Biased referencing experiments for the XPS analysis of non-conducting materials. Appl. Surf. Sci. Adv. 26, 129–149. doi:10.1016/0169-4332(86)90001-2
Fadley, C. S. (2010). X-ray photoelectron spectroscopy: progress and perspectives. J. Electron Spectrosc. Relat. Phenom. 178-179, 2–32. doi:10.1016/j.elspec.2010.01.006
Gelius, U., Basilier, E., Svensson, S., Bergmark, T., and Siegbahn, K. (1973). A high resolution ESCA instrument with X-ray monochromator for gases and solids. J. Electron Spectrosc. Relat. Phenom. 2 (4), 405–434. doi:10.1016/0368-2048(73)80056-8
Grant, J. T. (2023). Challenges in surface analysis. Front. Anal. Sci. 3. doi:10.3389/frans.2023.1234943
Herrera-Gomez, A., Cant, D. J. H., Conard, T., Renault, O., Linford, M. R., Pinder, J. W., Fenton, J., and Baer, D. R. (2024). New challenges associated with hard X-ray photoelectron spectroscopy (report on the 2023 ASTM E42-ASSD AVS workshop). Surf. Interface Anal. 56 (10), 730–736. doi:10.1002/sia.7340
Hertz, H. (1887). Ueber einen Einfluss des ultravioletten Lichtes auf die electrische Entladung. Ann. Phys. Lpz 267, 983–1000. doi:10.1002/andp.18872670827
Hoar, T. P., Talerman, M., and Sherwood, P. M. A. (1972). Electron spectra of oxide films on pure iron and an iron-aluminium alloy. Nat. Phys. Sci. 240 (101), 116–117. doi:10.1038/physci240116b0
Hu, K. F. (1918). Some preliminary results in a determination of the maximum emission velocity of the photoelectrons from metals at X-Ray frequencies. Phys. Rev. 11, 505.
Jenkin, J. G., Leckey, R. C. G., and Liesengang, J. (1977). The development of X-ray photoelectron spectroscopy 1900-1960. J. Electron Spectrosc. Relat. Phenom. 12, 1–35. doi:10.1016/0368-2048(77)85065-2
Jones, R. H., Bruemmer, S. M., Thomas, M. T., and Baer, D. R. (1982). The effects of sulfur and antimony on the intergranular fracture of iron at cathodic potentials. Met. Trans. A 13A, 241. doi:10.1007/BF02643314
Kelly, M. A. (2002). Michael kelly interview by David C. Brock and arthur daemmrich at the Pittsburgh conference on analytical chemistry and applied spectroscopy, New Orleans, Louisiana. In: editors. D. C. Brock, and A. Daemmrich, Chemical Heritage Foundation. Available online at: https://digital.sciencehistory.org/works/y86pb4q
Kelly, M. A. (2004). The development of commercial ESCA instrumentation: a personal perspective. J. Chem. Educ. 81 (12), 1726. doi:10.1021/ed081p1726
Kunz, C. (1979). “Synchrotron radiation: overview,” in Photoemission in solids II: case studies. Editors L. Ley, and M. Cardona (Berlin, Heidelberg: Springer Berlin Heidelberg), 299–348.
Lea, C. (2022). Martin seah—reminiscences of a friend. Surf. Interface Anal. 54, 306–307. doi:10.1002/sia.7041
Lee, A. Y., Blakeslee, D. M., Powell, C. J., and Rumble, J. R. (2002). Development of the web-based nist x-ray photoelectron spectroscopy (xps) database. Data Sci. J. 1, 1–12. doi:10.2481/dsj.1.1
Lindau, I., Pianetta, P., Doniach, S., and Spicer, W. E. (1974). X-ray photoemission spectroscopy. Nature 250 (5463), 214–215. doi:10.1038/250214a0
List of participants (1974). J. Electron Spectrosc. Relat. Phenom. 5 (1), x–xvi. doi:10.1016/0368-2048(74)85003-6
Madey, T. E., Wagner, C. D., and Joshi, A. (1977). Surface characterization of catalysts using electron spectroscopies: results of a round-robin sponsored by ASTM committee D-32 on catalysts. J. Electron Spectrosc. Relat. Phenom. 10 (4), 359–388. doi:10.1016/0368-2048(77)85033-0
Major, G. H., Clark, B. M., Cayabyab, K., Engel, N., Easton, C. D., Čechal, J., Baer, D. R., Terry, J., and Linford, M. R. (2023a). Insufficient reporting of x-ray photoelectron spectroscopy instrumental and peak fitting parameters (metadata) in the scientific literature. J. Vac. Sci. Technol. A 41 (4), 043201. doi:10.1116/6.0002714
Major, G. H., Pinder, J. W., Austin, D. E., Baer, D. R., Castle, S. L., Čechal, J., Clark, B. M., Cohen, H., Counsell, J., Herrera-Gomez, A., Govindan, P., Kim, S. H., Morgan, D. J., Opila, R. L., Powell, C. J., Průša, S., Roberts, A., Rocca, M., Shirahata, N., Šikola, T., Smith, E. F., So, R. C., Stovall, J. E., Strunk, J., Teplyakov, A., Terry, J., Weber, S. G., and Linford, M. R. (2023b). Perspective on improving the quality of surface and material data analysis in the scientific literature with a focus on x-ray photoelectron spectroscopy (XPS). J. Vac. Sci. Technol. A 41 (3). doi:10.1116/6.0002437
Martensson, N., Föhlisch, A., and Svensson, S. (2022). Uppsala and Berkeley: two essential laboratories in the development of modern photoelectron spectroscopy. J. Vac. Sci. Technol. A 40 (4). doi:10.1116/6.0001879
NIST X-ray photoelectron spectroscopy database (SRD 20), version 5.0 Gaithersburg: National Institute of Standards and Technology; 2022 Available at: https://srdata.nist,gov/xps/.
Nordling, C., Sokolowski, E., and Siegbahn, K. (1957). Precision method for obtaining absolute values of atomic binding energies. Phys. Rev. 105 (5), 1676–1677. doi:10.1103/physrev.105.1676
Pinder, J. W., Major, G. H., Baer, D. R., Terry, J., Whitten, J. E., Čechal, J., Crossman, J. D., Lizarbe, A. J., Jafari, S., Easton, C. D., Baltrusaitis,, J., van Spronsen, M. A., and Linford, M. R. (2024). Avoiding common errors in X-ray photoelectron spectroscopy data collection and analysis, and properly reporting instrument parameters. Appl. Surf. Sci. Adv. 19, 100534. doi:10.1016/j.apsadv.2023.100534
Powell, C. (2007). “Interview: cedric Powell - 2007,” in American vacuum society history archives. Editor P. Holloway (New York: American Vacuum Society). Available online at: https://avs.org/about-avs/history/historical-interviews/cedric-powell-2007/
Powell, C. J. (1991). Formal databases for surface analysis: the current situation and future trends. Surf. Interface Anal. 17 (6), 308–314. doi:10.1002/sia.740170603
Powell, C. J. (2016). Growth of surface analysis and the development of databases and modeling software for auger-electron spectroscopy and X-ray photoelectron spectroscopy. Microsc. Today 24 (2), 16–23. doi:10.1017/s1551929516000080
Powell, C. J. (2020). Practical guide for inelastic mean free paths, effective attenuation lengths, mean escape depths, and information depths in x-ray photoelectron spectroscopy. J. Vac. Sci. Technol. A 38, 023209. doi:10.1116/1.5141079
Powell, C. J. (2022). Martin Seah: an extraordinary scientist and metrologist. Surf. Interface Anal. 54, 285–293. doi:10.1002/sia.7018
Powell, C. J., Erickson, N. E., and Madey, T. E. (1979). Results of a joint auger/ESCA round robin sponsored by astm commitree E-42 on surface analysis: Part I. Esca results. J. Electron Spectrosc. Relat. Phenom. 17, 361–403. doi:10.1016/0368-2048(79)80001-8
Proctor, A., and Sherwood, P. M. A. (1982a). X-ray photoelectron spectroscopic studies of carbon fibre surfaces. I. carbon fibre spectra and the effects of heat treatment. J. Electron Spectrosc. Relat. Phenom. 27 (1), 39–56. doi:10.1016/0368-2048(82)85051-2
Proctor, A., and Sherwood, P. M. A. (1982b). Data analysis techniques in x-ray photoelectron spectroscopy. Anal. Chem. 54 (1), 13–19. doi:10.1021/ac00238a008
Robinson, H. W. (1923). “The secondary corpuscular rays produced by homogeneous x-rays,” in Proceedings of the Royal Society of London. Series A 104 (727), 455–479. doi:10.1098/rspa.1923.0121
Robinson, H. R., and Rawlinson, W. F. (1914). XXXIII. The magnetic spectrum of the β rays excited in metals by soft X rays. Philos. Mag. 28, 277–281. doi:10.1080/14786440808635209
Robinson, H. R. X. X. V. (1925). XXV. X-ray terms and intensities. Philos. Mag. 50, 241–250. doi:10.1080/14786442508634736
Rutherford, E., Robinson, H. R., and Rawlinson, W. R. (1914). XXXIV. Spectrum of the β rays excited by γ rays. Philos. Mag. 28, 281–286. doi:10.1080/14786440808635210
Salmeron, M., and Schlögl, R. (2008). Ambient pressure photoelectron spectroscopy: a new tool for surface science and nanotechnology. Surf. Sci. Rep. 63 (4), 169–199. doi:10.1016/j.surfrep.2008.01.001
Sancho-Albero, M., Martín-Pardillos, A., Irusta, S., Sebastián, V., Cebolla, V. L., Pazo-Cid, R., Martin-Duque, P., Santamaria, J., et al. (2023). X-Ray photoelectron spectroscopy (XPS) analysis of nitrogen environment in small extracellular vesicle membranes: a potential novel technique with application for cancer screening. Cancers 15 (9), 2479. doi:10.3390/cancers15092479
Scofield, J. H. (1976). Hartree-Slater subshell photoionization cross-sections at 1254 and 1487 eV. J. Electron Spectrosc. Relat. Phenom. 8 (2), 129–137. doi:10.1016/0368-2048(76)80015-1
Sherwood, P. M. A. (1976). Analysis of the X-ray photoelectron spectra of transition metal compounds using approximate molecular orbital theories. J. Chem. Soc. Faraday Trans. 72 (0), 1791–1804. doi:10.1039/f29767201791
Sherwood, P. M. A. (1976). “Photoelectron spectroscopy,”. Spectroscopy. Editors B. Straughan, and S. Walker (Chapman & Hall), Volume Three, 240–296. doi:10.1007/978-94-009-5741-1_7
Shirley, D. A. (1978). “Many-electron and final-state effects: beyond the one-electron picture,” in Photoemission in solids I: general principles. Editors M. Cardona, and L. Ley (Berlin, Heidelberg: Springer Berlin Heidelberg), 165–195.
Shirley, D. A., and Fadley, C. S. (2004). X-ray photoelectron spectroscopy in North America—the early years. J. Electron Spectrosc. Relat. Phenom. 137-140, 43–58. doi:10.1016/j.elspec.2004.02.018
Siegbahn, K., Nordling, C., Fahlman, A., Nordberg, R., Hamrin, K., Hedman, J., Johansson, G., Bergmark, T., Karlsson, S. E., Lindgren, I., and Lindberg, B. (1967). ESCA: atomic, molecular and solid state structure studied by means of electron spectroscopy. Uppsala: Almqvist & Wiksells.
Siegbahn, K., Nordling, C., Johansson, G., Herman, R. J., Heden, F., Hamrin, K., Johansson, G., Bergmark, T., Karlsson, S. E., Lindgren, I., and Lindberg, B. (1969). ESCA applied to free molecules. Amsterdam and London: North Holland.
Siegbahn, K. M. (1981). Electron spectroscopy of atoms, molecules and condensed Matter. Editors E. Gösta (Sweden: University of Stockholm. Available at: https://www.nobelprize.org/uploads/2018/06/siegbahn-lecture-1.pdf. doi:10.1142/1456
Smekal, W., Werner, W. S. M., and Powell, C. J. (2005). Simulation of electron spectra for surface analysis (SESSA): a novel software tool for quantitative Auger-electron spectroscopy and X-ray photoelectron spectroscopy. Surf. Interface Anal. 37 (11), 1059–1067. doi:10.1002/sia.2097
Sokolowski, E., Nordling, C., and Siegbahn, K. (1958). Chemical shift effect in inner electronic levels of Cu due to oxidation. Phys. Rev. 110, 776. doi:10.1103/physrev.110.776
Surface data - standard reference data Gaithersburg: NIST; Available at: https://www.nist.gov/srd/surface-data.
Thomas, S., Sherwood, P. M. A., Singh, N., Al-Sharif, A., and O’Shea, M. J. (1989). Superconductivity and electronic structure of Bi-based compounds. Phys. Rev. B 39 (10), 6640–6651. doi:10.1103/physrevb.39.6640
Travnikova, O., Børve, K. J., Patanen, M., Söderström, J., Miron, C., Sæthre, L. J., Martensson, N., and Svensson, S. (2012). The ESCA molecule—historical remarks and new results. J. Electron Spectrosc. Relat. Phenom. 185 (8), 191–197. doi:10.1016/j.elspec.2012.05.009
Turner, D. W., Baker, C., Baker, A. D., and Brundle, C. R. (1970). Molecular photoelectron spectroscopy – a handbook of He 584 Å spectra. London: Wiley Interscience.
Wagner, C. D. (1975). Chemical shifts of Auger lines, and the Auger parameter. Faraday Discuss. 60 (0), 291–300. doi:10.1039/dc9756000291
Wagner, C. D., Davis, L. E., Zeller, M. V., Taylor, J. A., Raymond, R. H., and Gale, L. H. (1981). Empirical atomic sensitivity factors for quantitative analysis by electron spectroscopy for chemical analysis. Surf. Interface Anal. 3 (5), 211–225. doi:10.1002/sia.740030506
Watts, J. F. (2022). Special issue of surface and interface analysis Martin P. Seah MBE: shining a light on surface chemical analysis. Surf. Interface Anal. 54 (4), 281. doi:10.1002/sia.7069
Whiddington, R.CXVIII. (1922). CXVIII. X-ray electrons. Philos. Mag. 43, 1116–1126. doi:10.1080/14786442208633967
Wolstenholme, J. (2020). Procedure which allows the performance and calibration of an XPS instrument to be checked rapidly and frequently. J. Vac. Sci. Technol. A 38 (4), 043206. doi:10.1116/6.0000224
XPS in academia and industry: AZO materials; 2022 Available at: https://www.azom.com/article.aspx?ArticleID=21845.
X-ray Photoelectron Spectroscopy Market Size, Share & trends analysis report by usage (by element detection, contamination detection), by application (healthcare), by region, and segment forecasts, 2024 - 2030. Grand view research; 2024. Contract No.: 978-1-68038-415-4. Available online at: https://www.maximizemarketresearch.com/market-report/x-ray-photoelectron-spectroscopy-market/266704/#:∼:text=The%20X-ray%20Photoelectron%20Spectroscopy,USD%20895%20Million%20by%202030
Zafeiratos, S. (2023). “X-Ray photoelectron spectroscopy in catalysis: impact and historical background,”. Applications of X-ray photoelectron spectroscopy to catalytic studies. Editor S. Zafeiratos (World Scientific, Singapore: Catalytic Science Series), 21, 1–11. Chapter 1. doi:10.1142/9781800613294_0001
Keywords: XPS, ESCA, PES, Kai Siegbahn, photoemission history
Citation: Baer DR and Sherwood PMA (2025) Perspective on the development of XPS and the pioneers who made it possible. Front. Anal. Sci. 4:1509438. doi: 10.3389/frans.2024.1509438
Received: 10 October 2024; Accepted: 19 December 2024;
Published: 22 January 2025.
Edited by:
Sefik Suzer, Bilkent University, TürkiyeReviewed by:
Sabine Hirth, BASF, GermanyCopyright © 2025 Baer and Sherwood. This is an open-access article distributed under the terms of the Creative Commons Attribution License (CC BY). The use, distribution or reproduction in other forums is permitted, provided the original author(s) and the copyright owner(s) are credited and that the original publication in this journal is cited, in accordance with accepted academic practice. No use, distribution or reproduction is permitted which does not comply with these terms.
*Correspondence: D. R. Baer, ZG9uLmJhZXJAcG5ubC5nb3Y=; P. M. A. Sherwood, cGV0ZXJtYS5zaGVyd29vZEBnbWFpbC5jb20=
Disclaimer: All claims expressed in this article are solely those of the authors and do not necessarily represent those of their affiliated organizations, or those of the publisher, the editors and the reviewers. Any product that may be evaluated in this article or claim that may be made by its manufacturer is not guaranteed or endorsed by the publisher.
Research integrity at Frontiers
Learn more about the work of our research integrity team to safeguard the quality of each article we publish.