- 1Department of Forensic Science, Punjabi University, Patiala, India
- 2School of Forensic Science, LNJN National Institute of Criminology and Forensic Science, National Forensic Science University, Delhi Campus, Ministry of Home Affairs, Government of India, Delhi, India
- 3Department of Botany, Punjabi University Patiala, Patiala, India
- 4Department of Forensic Science, Punjabi University, Patiala, India
Identifying an unascertained timber species is essential to stop illegal logging of the protected species. Timber forensics involves the identification of an unknown timber species to link to its source or to authenticate the timber and its products. This paper anticipates a quick, robust, non-destructive, and environment-friendly proof-of-concept study using ATR-FTIR spectroscopy and chemometric interpretation to identify and discriminate economically important and legitimately protected timber species. The chemometric methods used included partial least square discriminant analysis (PLS-DA), principal component analysis (PCA), and linear discriminant analysis (LDA). The mid-IR spectral bands indicated the presence of timber constituents such as cellulose, lignin, and hemicellulose. PLS-DA successfully discriminated between hardwoods and softwoods with 100% accuracy. PCA-LDA analysis of softwoods and hardwoods was done separately. LDA for softwoods resulted in a training and validation accuracy of 87.5%. Similarly, LDA analysis of hardwoods showed 82.22% training and 80% validation accuracies. The results of the blind test showed that all the blind samples could be correctly identified using this approach with 100% accuracy. All these approaches delivered significant findings to identify and discriminate timber samples. It is believed that this study will offer great opportunities to withstand illegal logging quickly and non-destructively.
Highlights
• Discriminated selective timber species including legally protective species.
• A quick, and cost-effective approach to identify and discriminate timber species.
• Chemometric tools proved to be effective in the classification of timber species.
1 Introduction
Forensic botany involves the usage of plants and their materials in forensic investigations that may act as noteworthy corroborative evidence to relate the suspect and an item to the crime scene, determine the travel history of an item, and may be used to prove or disprove the alibis (Hamalton, 2017). Timber forensics is a growing field in forensic botany that involves the identification of timber to link the timber products to their original trees, either as part of supply chain verification systems or to identify theft. It is also useful for authenticating the timber sample and its products.
Illegal logging of timbers is one of the serious threats and major concerns contributing to the rate of deforestation, accounting for approximately 15%–30% of the global timber supply chain (Ravindran et al., 2020). To combat these problems certain laws have been imposed by organizations such as the convention on international trade in endangered species of wild fauna and flora (CITES), which lists the species in different appendices (appendix I to III) depending on the gradation of protection required for each species. In addition to this, various consumer countries have some laws and regulations that restrict the importation of certain timber species as per the laws regulated by the country of origin, such as the US Legacy Act, amended in 2008, EU Timber Regulation, 2010, and the Australian Illegal Logging Prohibition Act, 2012 (Dormontt et al., 2015).
Identifying timber products is challenging for law enforcement, as they do not possess diagnostic features such as leaves, pollens, and flowers, which is a prerequisite for plant identification (Yadav et al., 2024). Hence definitive identification is an arduous job and is exceedingly challenging. Moreover, traditional methods used for timber identification, such as dendrochronology and anatomical features of wood, are ineffective in creating a confident and objective match of timber evidence with the illegally felled trees’ remains (Dormontt et al., 2020).
Different researchers have done considerable work to identify timber species by using various approaches including near-infrared spectroscopy (Adedipe et al., 2008; Braga et al., 2011; Lang et al., 2015; Ma et al., 2019), mass spectroscopy (Cody et al., 2012; Kite et al., 2010; McClure et al., 2015), radiocarbon dating, and stable isotope ratio analysis (Capo et al., 1998). Moreover, genetic marker-based approaches such as DNA profiling, DNA barcoding, metabolome profiling, and karyotyping have also been used for timber analysis (Tsuchikawa et al., 2003; Pastore et al., 2011; Hamalton, 2017; Ramalho et al., 2018; Fatima et al., 2019; Kim et al., 2024).
Different methods adopt different approaches for timber identification, such as the microscopic and macroscopic examinations to identify a species up to the genus level (Gasson, 2011). However, in a few cases, such as teak, identification up to the species level is possible based on macroscopic and microscopic examination (Hamalton, 2017). Nowadays, the choice of technique has led attention towards the required level of identification, time taken during analysis, cost per sample, availability of instrument, rapid, non-destructive, and reproducibility of the results. Additionally, on-field analysis is also a prerequisite for the analysis of timber. In this aspect, ATR FTIR spectroscopy is highly amenable to the forensic fraternity as this is a rapid, sensitive, non-destructive, and environment-friendly (no harmful chemicals are required during analysis) technique and possesses all the aforementioned features required for the analysis of trace forensic evidence. Moreover, law enforcement officials for the rapid field identification system can use it, as its portable devices are also available (Tsuchikawa et al., 2023). Few studies have been published on the use of FTIR spectroscopy for the analysis of wood species (Colom et al., 2003; Chen et al., 2010; Traoré et al., 2018; Sharma et al., 2020).
In this work, selective timber samples which are either economically valuable due to their notable properties or are legally protected by various organizations were analyzed to identify the plant from which the timber originated and to differentiate it from other timber species. Economically important timbers pertain to those high-grade timber species that are expensive in the local market due to their unique and magnificent properties such as durability, high density, tensile strength, insulation, gunshot resistance, and chatoyancy. These timber species are comparatively highly-priced in the market. Similarly, due to high demand in the market, some of the timber species are logged at an unstoppable rate, resulting in the species’ decline. Hence, the government has to take action to prevent their extinction. Therefore, these timber species have been protected at national and global levels.
Out of all the procured timber species, ten species are legally protected by various global organizations which includes Cupressus cashmeriana and Swietenia mahogonii listed as near threatened by IUCN. Similarly, Cinnamomum camphora is listed in Category I by Florida Exotic Pest Plant Council, and Podocarpus neriifolius is listed in Appendix III by CITES. Similarly, IUCN has listed Sweitenia macrophylla and Dipterocarpus turbinatus as vulnerable. The species Taxus wallichiana, Phoebe hainesiana, Pterocarpus santilanus, and Tectona grandis (Gua et al., 2022) have been listed in an endangered category by IUCN. Other species procured for the present study are also economically valuable and have unique characteristics. This study involves the application of ATR-FTIR spectroscopy along with chemometric interpretation for the identification and discrimination of selective timber species, which may aid the investigating agencies in combating timber-related crimes.
2 Materials and method
2.1 Sample collection and sample preparation
Twenty-three (n = 23) selective timber species including 15 hardwoods and 8 softwoods were collected from different parts of India. The hardwood and softwood species were identified based on morphological characteristics. Each species was collected from three different trees, which resulted in 69 timber samples. The timber samples were obtained by drilling the trunk of the tree at breast height with a Helfinch Cheston 10 mm powerful drill machine (350-W, 2,600 rpm) to obtain a fine powder (2–5 g) that was collected in a zip-lock bag with proper labeling with the name and provenance. The samples were oven–dried at 30°C for 2 weeks to evaporate the moisture.
The selection of timber species was based on their unique characteristics, economic value, and legitimate protection status, which resulted in the collection of eleven timber species that are being protected by various organizations at the global level, and other timber species were selected based on their commercial value (Table 1). The intra-species variability of the samples was assessed by analyzing three different samples of timber species procured from three different trees under a similar set of experimental conditions. Similarly, the repeatability of the samples was checked by analyzing a sample thrice under the same set of parameters. A reproducibility test was conducted by analyzing a single timber sample at distinct points for 3 successive days under the same set of experimental conditions.
2.2 Instrumentation and sample analysis
All collected timber samples were analyzed using Bruker Alpha ATR-FTIR spectrophotometer containing an ATR accessory with zinc selenide crystal, and DTGS as a detector. The selected spectral range was 4,000–600 cm−1 over 4 cm−1 resolution. The final acquired spectrum was the average of the accumulated 16 scans. All measurement scans were carried out at room temperature (25°C ± 5°C). Homogenous pressure was applied to the selected samples by using an ATR knob and anvil. The ATR zinc selenide crystal was cleaned using spectroscopic-grade acetone before and after the analysis of each sample.
The discriminatory power (DP) was calculated by Smalldon and Moffat’s (Smalldon and Moffat, 1973) formula by dividing the total discriminated sample pairs by the possible number of sample pairs multiplied by a hundred.
Where “n” can be calculated as,
where n = total number of samples.
2.3 Chemometrics
Total Chemometrics include the application of various statistical tools for the objective interpretation of the dataset based on the similarities in the structural makeup of the samples. In this work, chemometric models such as PLS-DA (Partial least square discriminant analysis), PCA (principal component analysis), and LDA (linear discriminant analysis) have been used for the differentiation of the studied timber species. The spectra obtained were pre-processed before subjecting to chemometric analysis by using different pre-processing methods to enhance the information contained in the spectral data and to condense the noise ratio. Pre-treatment methods such as Savitzky-Golay smoothing, normalization, and baseline correction were used before performing PLS-DA, PCA, and LDA. In addition to this, deresolve transformation (for noise reduction) and orthogonal signal correction transformation were also used for PLS-DA using Unscrambler®X (64-bit) version 10.5.1, by Camo, Norway.
2.3.1 Partial least square discriminant analysis (PLS-DA)
PLS-DA was carried out to differentiate hardwood and softwood samples. The values of parameters such as R-square for PLS-DA indicate the robustness of the built model which must lie in-between 0.82–0.90 for an acceptable model. Moreover, an R-square value of more than 0.90 indicates that the results are highly significant (Naes et al., 2002; Cozzolino et al., 2011). This approach correlates the dependent (Y) and independent variables (X). The X variables were the spectral matrix. However, the Y variables were the classes of selected timber samples. For the evaluation of PLS-DA, R-square value and root means square error (RMSE) were calculated which quantifies the effectiveness of the calibration model to predict the property of interest in various samples of unknown class (Kumar and Sharma, 2018). To differentiate the hardwood and softwood, the two classes were defined that is hardwood species (assigned to class “H”), and softwood (assigned to class “S”). The dataset was typically divided into a training set and a test set. The training set was used to train the model, while the test set was used to evaluate the performance of the model. The cross-validation approach was adopted to assess the reliability and robustness of the model. Once the model was trained, it was tested on the test (blind) data. The performance of the model was evaluated by using the confusion matrix.
2.3.2 Principal component analysis (PCA) and linear discriminant analysis (LDA)
PCA is a dimensionality reduction tool for high-dimensional datasets that spots the sample’s spectral-spatial distribution (Sauzier et al., 2021). It executed by reducing the linear combination of variables into a few principal components. The obtained results with the initial three PCs (PC1, PC2, and PC3) were assessed. Nonetheless, the first two PCs (PC1, and PC2) were considered the most representative of the analyzed data. Linear discriminant analysis is a method used to create a mathematical function to increase the separation rate between known sample classes. It condenses the dimensionality of the original data set by reducing the higher number of original variables to some new canonical function with or without minimum loss of original dataset information (Kumar and Sharma, 2018).
2.4 Blind test
A blind study was a prerequisite in this study to check the efficacy of the present approach to identify a given unknown timber species. The blind test was performed by randomly selecting seven timber species (three softwoods and four hardwoods) from the list of procured timber species for this study. Additional samples were collected to conduct the blind study and were labeled as X1, X2, X3, X4, X5, X6, and X7. The analyst was unaware of the identity of the timber species. All the samples were analyzed in the same manner as the pristine sample analysis method. The IR spectra obtained from the blind samples were first projected into the already-built PLS-DA model to identify whether the timber samples belonged to softwood or hardwood. After identifying the type of wood, the samples were projected into the respective PCA model to identify the timber species.
3 Results and discussion
The results of repeatability (Supplementary Figure S1), and intra-species variability suggested no significant differences in the spectra obtained for the same timber species.
3.1 Visual interpretation of the spectra
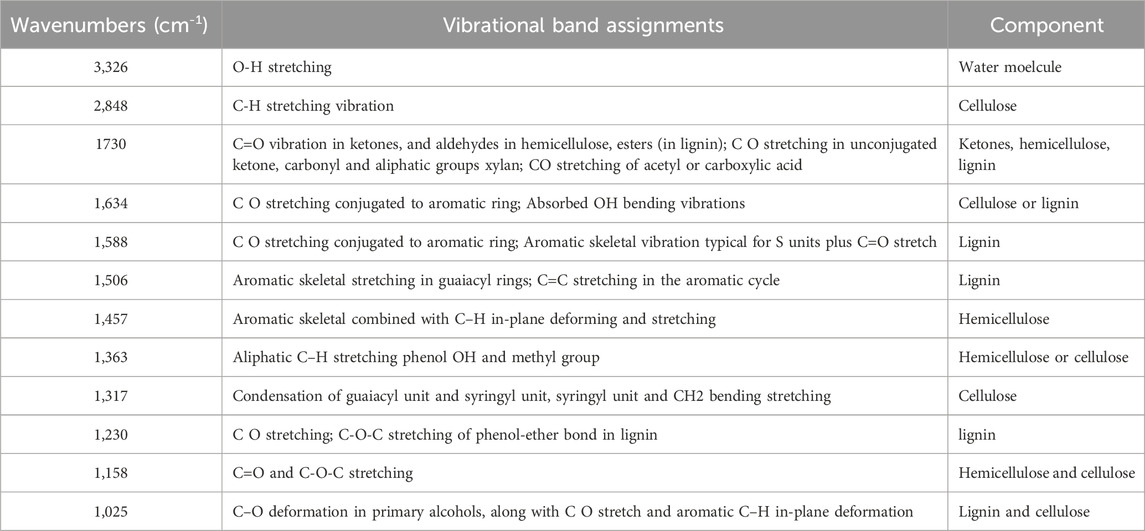
All the spectra obtained by ATR-FTIR analysis were visually examined for specific peaks at different wavenumbers. Visual comparison of the spectra was done regarding the presence or absence of specific peaks in the IR spectra at different wavenumbers. However, the comparison did not consider characteristics such as sharpness, broadness, peak height, and intensity. The representative spectra of all the timber samples are shown in Figure 1. It was observed that most of the spectra have specific peaks corresponding to timber components such as cellulose, hemicellulose, and lignin. The details of the peak, IR vibrations, and possible components are given in Table 2. The IR spectra of timber samples showed the presence of cellulose which is indicated by the bands present at 2,848, 1,634, 1,363, 1,317, 1,158, and 1,025 cm−1 which may be attributed to C-H stretching, C-O stretching, or O-H bending, C-H stretching, CH2 bending stretching, C=O and C-O-C stretching, and C-O deformation respectively (Sharma et al., 2020). Similarly, the presence of hemicellulose was indicated by the presence of peaks in the IR spectra at 1730, 1,457, 1,363, and 1,158 cm−1 which may indicate the occurrence of C=O vibration, C-H deformation stretching, C-H stretching, and C=O stretching respectively (Chen et al., 2010; Sharma et al., 2020). In the same manner, the presence of lignin in the timber samples was indicated by the presence of specific bands at 1730, 1,634, 1,588, 1,506, 1,230, and 1,025 cm−1 which may indicate C=O vibration, C-O stretching, C=O stretching, C=C stretching, C-O-C stretching, and C-H deformation respectively (Chen et al., 2010; Sharma et al., 2020).
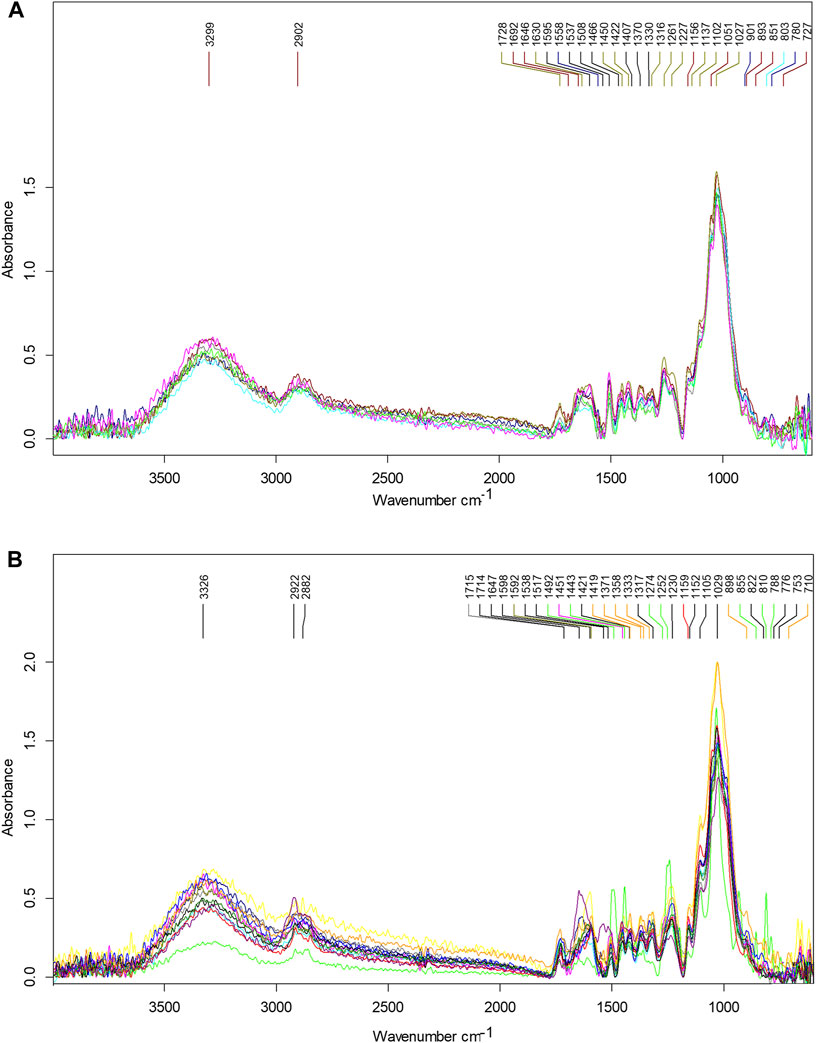
Figure 1. (A) Representative mid-IR spectra of softwoods (B) Representative mid-IR spectra of hardwoods.
3.2 Chemometric interpretation
3.2.1 Discrimination of softwood and hardwood using the PLS-DA model
All samples were used to build the PLS-DA model by selecting the entire mid-IR range (4,000–600 cm−1). The results of the PLS-DA showed that softwoods can be differentiated from hardwoods with 100% accuracy (Figure 2). In this study, high R-square calibration and validation values of 0.99 and 0.97 were obtained respectively. The value of the root-mean-square error should be less than 3.1. In this study, a low RMSE, and offset value of 0.034, and 0.0086 were obtained for the calibration dataset respectively. The results showed that the built model is robust enough to differentiate hardwoods and softwoods. The predicted and reference variables for PLS-DA can be evaluated from Supplementary Figure S2.
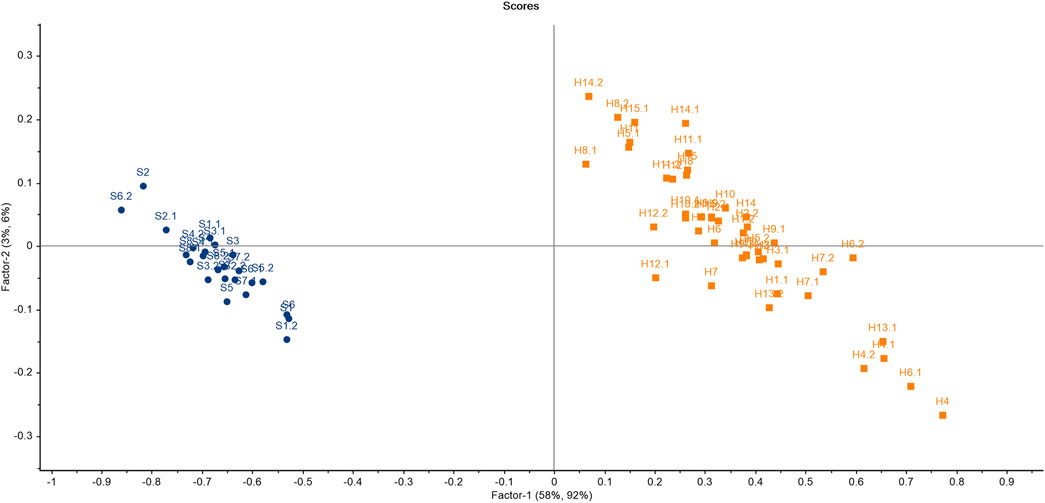
Figure 2. PLS-DA model to differentiate softwoods and hardwoods where “H” indicates hardwood and “S” indicates softwoods.
3.2.2 Principal component analysis (PCA) and linear discriminant analysis (LDA)
To visualize the trend in the softwoods and hardwoods separately, two separate PCA models were built. The PCA score plots for softwoods and hardwoods were built by selecting only the fingerprint region (1,600–400 cm−1) of the mid-IR spectra as all of the samples showed no significant variations in the functional group region of the spectra as shown in the representative figures of the timber samples.
3.2.2.1 PCA of softwoods
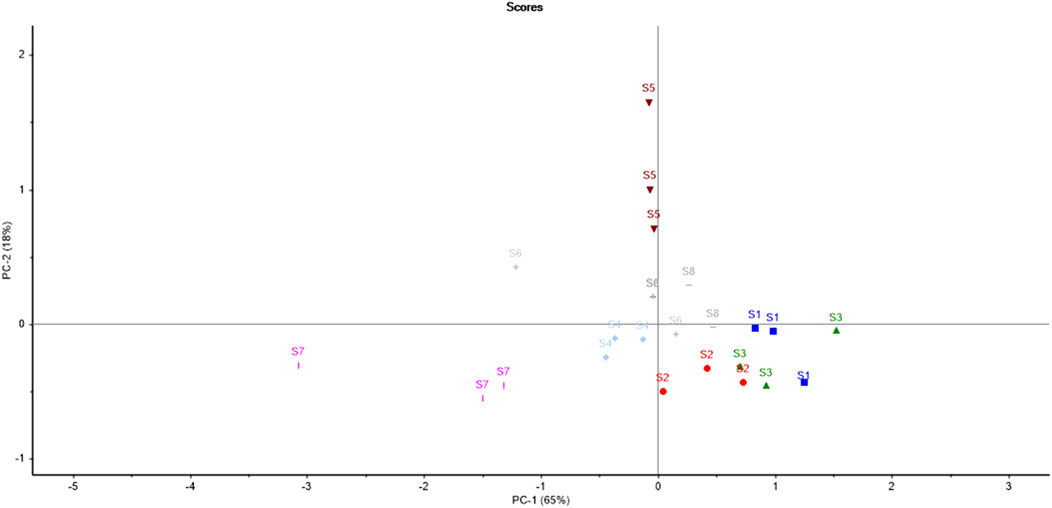
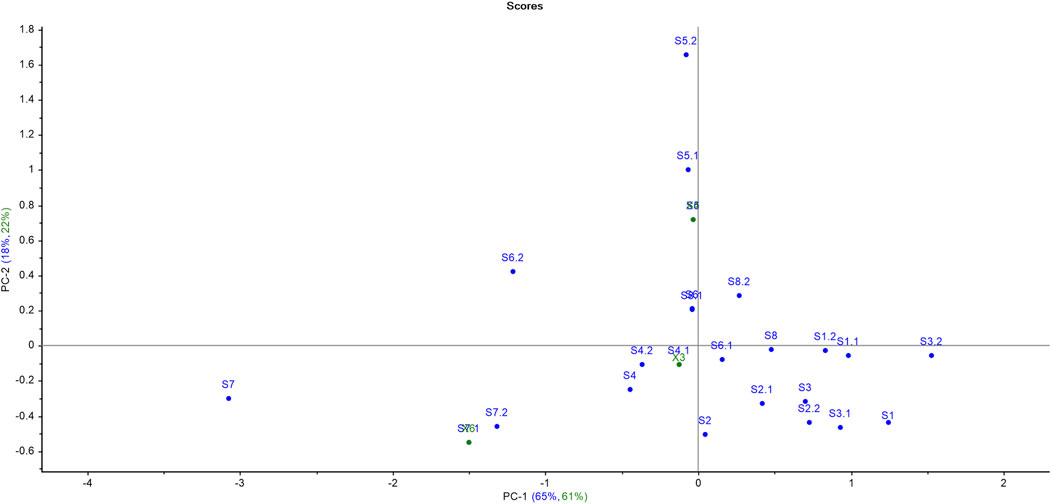
The results of PCA for softwoods as depicted in Figure 3 suggested that all the samples were scattered throughout the PCA score plot, indicating the differences in the chemical makeup of the timber species. It is clear from the score plot of PCA that only one sample pair (S6 and S8) is overlapping. Therefore, only one sample pair was similar out of all 28 pairs of timber samples which resulted in a significant DP of 96.42% using PCA. The variance proportions explicated by the first seven principal components (PCs) were PC1-65%, PC2-18%, PC3-7%, PC4-5%, PC5-1%, PC6-1%, and PC7-1% which accounted for a total of 98% variance. The maximum variance proportions contributed by the first two PCs were 83% (PC1 illustrated 65% and PC2 showed 18%) of the given dataset.
A linear distance was used to construct the LDA model with the first three principal components. Here, the prediction classes of timber samples were concurrently compared with reference class samples. The acquired results from the PCA-LDA model proposed a desirable accuracy rate (87.5%) for the classification and discrimination of timber samples (Supplementary Figure S3). A total of 3 samples (out of 24) were misclassified. The results can be interpreted from Table 3. The sample S1.a was misclassified as S3. Similarly, S3.c was misclassified as S1. The sample S6.a was misclassified as S8. A total of 8 spectra (other than the training set) from all the softwood timber species were considered for PCA LDA validation to test the reliability of the built model. The results showed that one sample (out of 8) was misclassified owing to 87.5% of validation accuracy.
3.2.2.2 PCA of hardwoods
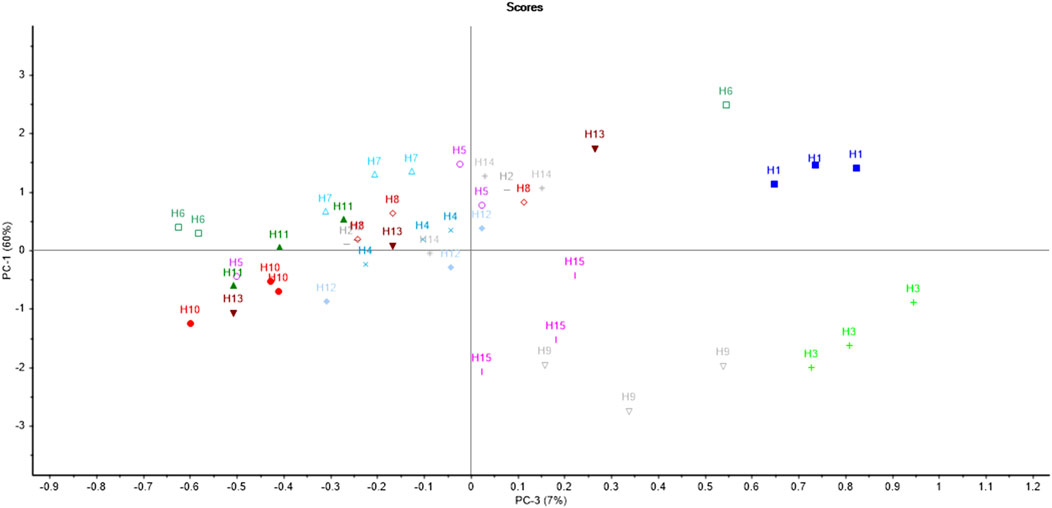
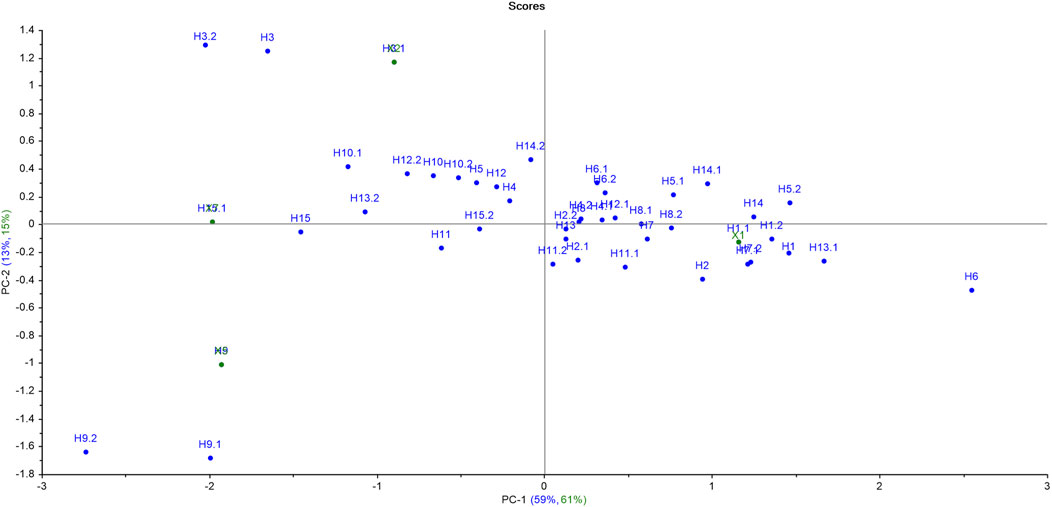
The PCA score plot for hardwoods (Figure 4) suggests that most of the samples were scattered throughout the PCA plot indicating the diversity in the phytochemicals of the timber species. Moreover, the samples H2, H4, H5, H7, H8, and H14 were scattered nearby as compared to other samples. Only one sample pair (H2 and H8) was overlapping, depicting the similarity of only one sample pair (out of all 120 pairs) of timber samples, which resulted in a significant DP of 99.16% using PCA. The first seven principal components (PC1-59%, PC2-13%, PC3-8%, PC4-5%, PC5-4%, PC6-3%, and PC-2%) accounted for a total of 94% variance by PCA. The first two PCs contributed the maximum variance of 72% (PC1 illustrated 59% and PC2 showed 13%) of the given dataset.
The results of the LDA showed that hardwood samples can be discriminated with 82.22% accuracy (Supplementary Figure S4). The confusion matrix of LDA for hardwoods is given in Table 4. A total of 8 samples (out of 45) were misclassified. Sample H2.c was misclassified as H13. The timber samples H5.a and H5.b were misclassified as H10 and H11 respectively. The sample H6.a was misclassified as H8. Similarly, H8.c and H12.b were misclassified as H4. The sample H13.b was misclassified as H8. The sample H14.a was misclassified as H5. A total of 15 spectra (other than the training set) from all the hardwood species were considered for PCA LDA validation to test the reliability of the built model. The results showed that three samples (out of 15) were misclassified owing to 80% of validation accuracy.
3.3 The blind test
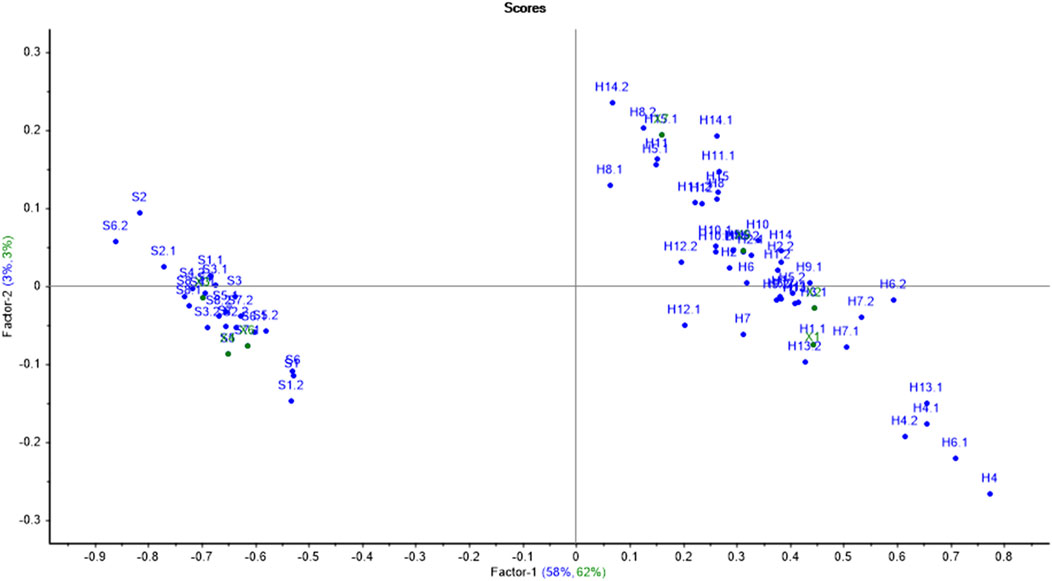
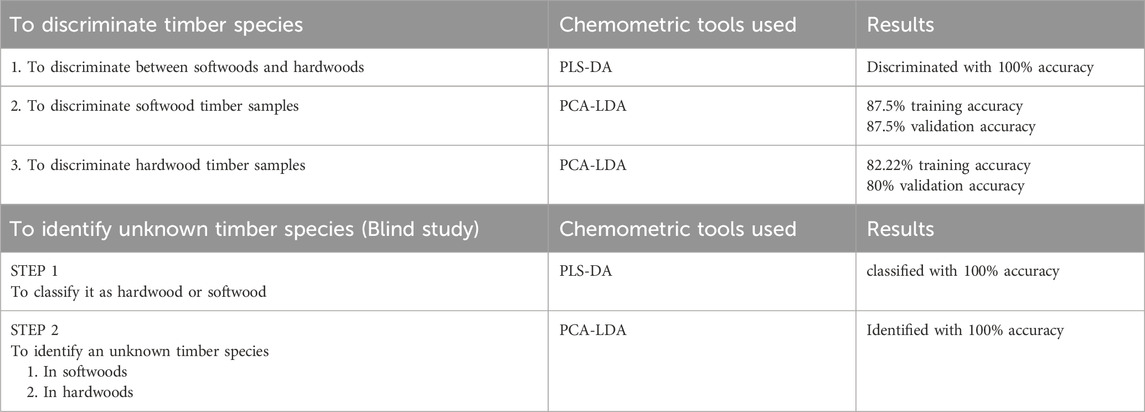
The IR spectra obtained from the blind samples were projected into the already-built PLS-DA model. The results showed that the softwoods and hardwoods were correctly classified with 100% accuracy (Figure 5). Therefore, with the present approach, it is possible to group hardwoods and softwoods into their respective classes with 100% accuracy.
The softwood blind samples were then projected in the already-built PCA model for softwoods. Similarly, the hardwood blind samples were projected into the already-built PCA model for hardwoods. The results showed that all the softwood blind samples were projected with 100% accuracy (Figure 6). Sample X3 was correctly predicted to be sample S4. Similarly, the samples X4 and X6 were predicted S5 and S7. Similarly, all four blind samples of hardwoods were correctly predicted with 100% accuracy (Figure 7). The sample X1 was predicted as H1. The samples X2 and X5 were predicted as samples H3 and H9 respectively. Similarly, the sample X7 was predicted as H15. A comparison of the results of all the chemometric methods used in this study has been listed in Table 5.
3.5 Comparision of this study with previously published studies for timber species identification
The proposed work supports the work done by Sharma et al. (2020) as the authors differentiated softwood and hardwood using ATR-FTIR spectroscopy and various chemometric tools such as Hierarchical Clustering Analysis (HCA), ANOVA (Analysis of Variance Test), PCA, and LDA. A total of twenty-four timber species were procured from Brno, Czech Republic followed by the identification and the classification of the samples. Similarly, Popescu et al. (2009) differentiated hardwood and softwood using FTIR spectroscopy and X-ray diffraction (XRD). However, no chemometric tools were used for the analysis of timber samples. The present research work involved the identification and differentiation of twenty-three selective timber species from India in which ten timber species are legally protected by various organizations at the global level. The identification and differentiation of these precious timber species is important to combat timber-related crimes. This approach will aid in the identification of the unknown timber species and the linking of an unknown timber sample with a known source. Moreover, the chemometric tools used for the present study included PLS-DA, PCA, and LDA, which delivered significant findings. The application of chemometrics tools to the IR spectra helped in providing objectivity to the results. The results of the blind study demonstrate the applicability of this approach in real-case scenarios in timber forensics.
4 Conclusion
In this study, ATR FTIR spectroscopy and chemometrics were used to identify and differentiate 23 selective timber species that are either legally protected, economically valuable, or trade-restricted. The IR spectra were obtained by ATR-FTIR spectrometer followed by the visual interpretation of the spectra. The spectral bands indicated the presence of cellulose, hemicellulose, and lignin in the timber samples. The chemometric tools used included PLS-DA for the discrimination of softwoods and hardwoods. The results showed 100% accuracy of discrimination. High R-square values of calibration (0.99), and validation (0.97) were obtained. Similarly, desirable low values RMSE (0.034) and offset (0.0086) were observed. Two different PCA models were built for softwoods and hardwoods separately. The results of PCA for softwoods showed a DP of 96.42%. The total variance obtained by all the PCs resulted in 98% variance with which the first two PCs contributed the maximum variance (83%). The results of LDA showed 87.5% of training and validation accuracy. Similarly, the results for the analysis of hardwoods showed a DP of 99.16%. The total variance obtained from all PCs resulted in a 94% variance. The maximum variance was obtained from the first two PCs (72%). The results of LDA showed 82.22% of training accuracy. To test the reliability of the built model, a validation test was also done which showed 80% accuracy of correct classification. The reliability of the built chemometric models was checked by performing a blind test which showed 100% accuracy in identifying an unknown timber species.
This proof-of-concept study using ATR FTIR spectroscopy along with multivariate data analysis can be used for the identification of timber samples (protected/scheduled plant) up to the species level, making it useful for rapid, non-destructive, and on-field analysis. We further advocate future wide-ranging studies on identifying and discriminating timber species with more samples and assessing different geographical locations. Moreover, this approach must be validated for finished and processed timber products before subjecting them to forensic casework investigation as samples may be sent for analysis in any condition. More work can be done in the future using this approach covering chemically treated wood, processed timber, and mixed products in various forms.
Data availability statement
The raw data supporting the conclusions of this article will be made available by the authors, without undue reservation.
Author contributions
AY: Data curation, Formal Analysis, Funding acquisition, Investigation, Methodology, Validation, Writing–original draft, Writing–review and editing. SS: Conceptualization, Data curation, Formal Analysis, Investigation, Methodology, Visualization, Writing–original draft. VS: Data curation, Formal Analysis, Investigation, Methodology, Resources, Writing–review and editing. MK: Resources, Supervision, Validation, Writing–review and editing. RS: Conceptualization, Investigation, Methodology, Project administration, Software, Supervision, Writing–review and editing.
Funding
The author(s) declare that financial support was received for the research, authorship, and/or publication of this article. University Grants Commission (UGC), Ministry of Human Resource Development, Government of India (UGC Ref. No. 200510156051).
Acknowledgments
The authors would like to express their sincere gratitude to the University Grants Commission (UGC), Ministry of Human Resource Development, Government of India for providing financial assistance.
Conflict of interest
The authors declare that the research was conducted in the absence of any commercial or financial relationships that could be construed as a potential conflict of interest.
Generative AI statement
The author(s) declare that no Generative AI was used in the creation of this manuscript.
Publisher’s note
All claims expressed in this article are solely those of the authors and do not necessarily represent those of their affiliated organizations, or those of the publisher, the editors and the reviewers. Any product that may be evaluated in this article, or claim that may be made by its manufacturer, is not guaranteed or endorsed by the publisher.
Supplementary material
The Supplementary Material for this article can be found online at: https://www.frontiersin.org/articles/10.3389/frans.2024.1508509/full#supplementary-material
References
Adedipe, O. E., Dawson-Andoh, B., Slahor, J., and Osborn, L. (2008). Classification of red oak (Quercus rubra) and white oak (Quercus alba) wood using a near infrared spectrometer and soft independent modelling of class analogies. J. Near Infrared Spectrosc. 16 (1), 49–57. doi:10.1255/jnirs.760
Braga, J. W. B., Pastore, T. C. M., Coradin, V. T. R., Camargos, J. A. A., and da Silva, A. R. (2011). The use of near infrared spectroscopy to identify solid wood specimens of swietenia macrophylla0 (Cites Appendix II). IAWA J. 32 (2), 285–296. doi:10.1163/22941932-90000058
Capo, R. C., Stewart, B. W., and Chadwick, O. A. (1998). Strontium isotopes as tracers of ecosystem processes: theory and methods. Geoderma 82 (1-3), 197–225. doi:10.1016/s0016-7061(97)00102-x
Chen, H., Ferrari, C., Angiuli, M., Yao, J., Raspi, C., and Bramanti, E. (2010). Qualitative and quantitative analysis of wood samples by Fourier transform infrared spectroscopy and multivariate analysis. Carbohydr. Polym. 82 (3), 772–778. doi:10.1016/j.carbpol.2010.05.052
Cody, R. B., Dane, A. J., Dawson-Andoh, B., Adedipe, E. O., and Nkansah, K. (2012). Rapid classification of White Oak (Quercus alba) and Northern Red Oak (Quercus rubra) by using pyrolysis direct analysis in real time (DART™) and time-of-flight mass spectrometry. J. Anal. Appl. Pyrolysis 95, 134–137. doi:10.1016/j.jaap.2012.01.018
Colom, X., Carrillo, F., Nogués, F., and Garriga, P. (2003). Structural analysis of photodegraded wood by means of FTIR spectroscopy. Polym. Degrad. Stab., 80(3), 543–549. doi:10.1016/S0141-3910(03)00051-X
Cozzolino, D., Cynkar, W. U., Shah, N., and Smith, P. (2011). Multivariate data analysis applied to spectroscopy: potential application to juice and fruit quality. Food Res. Int. 44 (7), 1888–1896. doi:10.1016/j.foodres.2011.01.041
Dormontt, E. E., Boner, M., Braun, B., Breulmann, G., Degen, B., Espinoza, E., et al. (2015). Forensic timber identification: it's time to integrate disciplines to combat illegal logging. Biol. Conserv. 191, 790–798. doi:10.1016/j.biocon.2015.06.038
Dormontt, E. E., Jardine, D. I., van Dijk, K. J., Dunker, B. F., Dixon, R. R. M., Hipkins, V. D., et al. (2020). Forensic validation of a SNP and INDEL panel for individualisation of timber from bigleaf maple (Acer macrophyllum Pursch). Forensic Sci. Int. Genet. 46, 102252. doi:10.1016/j.fsigen.2020.102252
Fatima, T., Srivastava, A., Somashekar, P. V., Hanur, V. S., and Rao, M. S. (2019). Development of DNA-based species identification and barcoding of three important timbers. Bull. Natl. Res. Cent. 43, 76–17. doi:10.1186/s42269-019-0116-8
Gasson, P. (2011). How precise can wood identification be? Wood anatomy’s role in support of the legal timber trade, especially CITES. IAWA J. 32 (2), 137–154. doi:10.1163/22941932-90000049
Gua, B., Pedersen, A., and Barstow, M. (2022). Tectona grandis, the IUCN red list of threatened species. doi:10.2305/IUCN.UK.2022-2
Hamalton, T. (2017) Timber forensics, van sangyan, 4. Jabalpur, MP, India: Tropical Forest Research Institute, 11–13.
Kim, M., Im, S., and Kim, T. J. (2024). DNA barcodes for wood identification of anatomically similar species of genus chamaecyparis. Forests 15 (7), 1106. doi:10.3390/f15071106
Kite, G. C., Green, P. W., Veitch, N. C., Groves, M. C., Gasson, P. E., and Simmonds, M. S. (2010). Dalnigrin, a neoflavonoid marker for the identification of Brazilian rosewood (Dalbergia nigra) in CITES enforcement. Phytochemistry 71 (10), 1122–1131. doi:10.1016/j.phytochem.2010.04.011
Kumar, R., and Sharma, V. (2018). Chemometrics in forensic science. Trends Anal. Chem. 105, 191–201. doi:10.1016/j.trac.2018.05.010
Lang, C., Costa, F. R. C., Camargo, J. L. C., Durgante, F. M., and Vicentini, A. (2015). Near infrared spectroscopy facilitates rapid identification of both young and mature Amazonian tree species. PLOS ONE 10 (8), 0134521. doi:10.1371/journal.pone.0134521
Ma, T., Inagaki, T., Ban, M., and Tsuchikawa, S. (2019). Rapid identification of wood species by near-infrared spatially resolved spectroscopy (NIR-SRS) based on hyperspectral imaging (HSI). Holzforschung 73 (4), 323–330. doi:10.1515/hf-2018-0128
McClure, P. J., Chavarria, G. D., and Espinoza, E. (2015). Metabolic chemotypes of CITES protected dalbergia timbers from africa, Madagascar, and asia. Rapid Commun. Mass Spectrom. 29 (9), 783–788. doi:10.1002/rcm.7163
Naes, T., Isaksson, T., Fearn, T., and Davies, T. (2002). A user friendly guide to multivariate calibration and classification. Chichester: NIR publications. doi:10.1255/978-1-906715-25-0
Pastore, T. C. M., Braga, J. W. B., Coradin, V. T. R., Magalhães, W. L. E., Okino, E. Y. A., Camargos, J. A. A., et al. (2011). Near-infrared spectroscopy (NIRS) as a potential tool for monitoring trade of similar woods: discrimination of true mahogany, cedar, andiroba, and curupixá. Holzforschung, 65 (1) 73–80. doi:10.1515/hf.2011.010
Popescu, C. M., Singurel, G., Popescu, M. C., Vasile, C., Argyropoulos, D. S., and Willför, S. (2009). Vibrational spectroscopy and X-ray diffraction methods to establish the differences between hardwood and softwood. Carbohydr. Polym. 77 (4), 851–857. doi:10.1016/j.carbpol.2009.03.011
Ramalho, F. M., Andrade, J. M., and Hein, P. R. (2018). Rapid discrimination of wood species from native forest and plantations using near infrared spectroscopy. For. Syst. 27 (2), e008. doi:10.5424/fs/2018272-12075
Ravindran, P., Thompson, B. J., Soares, R. K., and Wiedenhoeft, A. C. (2020). The XyloTron: flexible, open-source, image-based macroscopic field identification of wood products. Front. Plant Sci. 11, 1015. doi:10.3389/fpls.2020.01015
Sauzier, G., van Bronswijk, W., and Lewis, S. W. (2021). Chemometrics in forensic science: approaches and applications. Anlst 146 (8), 2415–2448. doi:10.1039/D1AN00082A
Sharma, V., Yadav, J., Kumar, R., Tesarova, D., Ekielski, A., and Mishra, P. K. (2020). On the rapid and non-destructive approach for wood identification using ATR-FTIR spectroscopy and chemometric methods. Vib. Spectrosc., 110, 103097. doi:10.1016/j.vibspec.2020.103097
Smalldon, K. W., and Moffat, A. C. (1973). The calculation of discriminating power for a series of correlated attributes. J. Forens. Sci. Soc. 13 (4), 291–295. doi:10.1016/S0015-7368(73)70828-8
Traoré, M., Kaal, J., and Martínez Cortizas, A. (2018). Differentiation between pine woods according to species and growing location using FTIR-ATR. Wood Sci. Technol. 52, 487–504. doi:10.1007/s00226-017-0967-9
Tsuchikawa, S., Inagaki, T., and Ma, T. (2023). Application of near-infrared spectroscopy to forest and wood products. Curr. For. Rep. 9 (6), 401–412. doi:10.1007/s40725-023-00203-3
Tsuchikawa, S., Inoue, K., Noma, J., and Hayashi, K. (2003). Application of near-infrared spectroscopy to wood discrimination. J. Wood Sci. 49, 0029–0035. doi:10.1007/s100860300005
Keywords: timber, illegal logging, discrimination, classification, chemometrics, identification
Citation: Yadav A, Sharma S, Singh V, Kapoor M and Singh R (2024) Forensic identification and differentiation of some protected timber species using ATR-FTIR spectroscopy and chemometrics. Front. Anal. Sci. 4:1508509. doi: 10.3389/frans.2024.1508509
Received: 09 October 2024; Accepted: 08 November 2024;
Published: 19 November 2024.
Edited by:
Ritesh Kumar Shukla, Ahmedabad University, IndiaReviewed by:
R. Aparna, Jain University, IndiaRajeev Jain, Central Forensic Science Laboratory, Chandigarh, India
Copyright © 2024 Yadav, Sharma, Singh, Kapoor and Singh. This is an open-access article distributed under the terms of the Creative Commons Attribution License (CC BY). The use, distribution or reproduction in other forums is permitted, provided the original author(s) and the copyright owner(s) are credited and that the original publication in this journal is cited, in accordance with accepted academic practice. No use, distribution or reproduction is permitted which does not comply with these terms.
*Correspondence: Rajinder Singh, cmFqaW5kZXJfZm9yZW5zaWNAcGJpLmFjLmlu
†ORCID: Arti Yadav, orcid.org/0000-0001-5146-4428; Sweety Sharma, orcid.org/0000-0002-7886-4672; Manish Kapoor, orcid.org/0000-0002-8349-8910; Rajinder Singh, orcid.org/0000-0002-6174-4973
 Arti Yadav1†
 Manish Kapoor
 Rajinder Singh
