
95% of researchers rate our articles as excellent or good
Learn more about the work of our research integrity team to safeguard the quality of each article we publish.
Find out more
ORIGINAL RESEARCH article
Front. Anal. Sci. , 30 July 2024
Sec. Pharmaceutical analysis
Volume 4 - 2024 | https://doi.org/10.3389/frans.2024.1399843
This article is part of the Research Topic Thought Leaders in Analytical Science Research View all 12 articles
 Yehualashet Teshome Wondmkun1*
 Haile Kassahun Desta2
 Yimer Seid Ali2
 Abate Wondesen Tsige3
 Kassahun Dires Ayenew4Bedilu Linger Endalifer3
 Samuel Berihun Dagnew5
Background: This study aimed to comparatively evaluate the quality and physicochemical bioequivalence of commercially available brands of hydrochlorothiazide (HCT) tablets in community pharmacies in Dessie town, Northeast Ethiopia.
Methods: Experimental cross-sectional study design was applied using pharmacopeia and non-pharmacopeia methods. The difference (f1) and similarity (f2) factors were calculated to assess the in vitro bioequivalence of generic products with the comparator.
Result: The study results revealed that all investigated brands contained the required active pharmaceutical ingredients (APIs). The friability test results were concordant with the United States Pharmacopeia (USP) (<1%) for eight brands; however, brand NF3 (1.36%) failed to pass the specification limit. The hardness levels of the brands NF3 (24.20 ± 7.32 N), NF5 (32.19 ± 4.78 N), and NF9 (35.02 ± 3.12 N) were below the specification limit (39.23 N, USP 2019). The weight variation results of all generic products complied with the USP specification requirement. In the quantitative assay results, the minimum and maximum API contents were 97.4 ± 0.02 (NF6) and 105.8 ± 0.02 (NF8), respectively, which are within the limit specified by the USP (90%–110%). Similarly, all samples met the disintegration time limit (i.e., ≤30 min) and drug-releasing tolerance limit (API released more than 60% within 60 min) requirements. The f2 values were >50, and the f1 values were <15 for all sampled brands.
Conclusion: The majority of the sampled brands of HCT tablets met the quality requirements as per USP official test specifications. From the similarity and difference factor values, all studied brands were shown to be equivalent.
Patients often require pharmacological and non-pharmacological treatments for sustained blood pressure reduction. With the development of many antihypertensive drugs, effective management of hypertension has become a reality with minimum side effects. In general, there are five classes of antihypertensive drugs that are used nowadays to decrease blood pressure by minimizing cardiac output or total peripheral vascular resistance. These include beta blockers, diuretics, angiotensin-converting-enzyme inhibitors, angiotensin receptor blockers, and calcium channel blockers (Karmoker et al., 2017).
Hydrochlorothiazide (HCT) is the most prescribed thiazide diuretic with or without other antihypertensive medications to control elevated blood pressure. More than 97% of all HCT prescriptions are based on doses of 12.5–25 mg per day (Pareek et al., 2016). HCT is also an adjuvant medication for treating edematous patients secondary to congestive heart failure, hepatic cirrhosis, as well as corticosteroid and estrogen therapies. It is a white, odorless, and crystalline powder having a slightly bitter taste and a molecular weight of 297.74 g/mol, and its chemical structure is as illustrated in Figure 1 (Pires et al., 2011). The primary target organs of diuretics are the kidneys, and they exert significant activities in the distal convoluted tubules. This produces remarkable diuresis of sodium and chloride ions in equivalent amounts (Pareek et al., 2016). Therefore, the quality of marketed antihypertensive medications should be addressed and assured before reaching the patients. This is one of the reasons for the prevalence of death due to uncontrolled blood pressure, which is increasing every day. For example, studies have shown that 16.5% of the global deaths and 7.0% of global disability-adjusted life years are due to poor control of blood pressure (Lim et al., 2012). A WHO report showed that 31.1% of adults (1.39 billion) worldwide had hypertension (Mills et al., 2020) and that 13% of the global death counts were due to elevated blood pressure (Dreisbach and Batuman, 2013). Ineffective control of blood pressure may be attributed to poor quality of medications used by the patients. For example, approximately 24.3% (202/830) of the generic and 3.5% (11/310) of the branded products for five common antihypertensive medicines (captopril, amlodipine, atenolol, HCT, and furosemide) were found to be substandard in about ten African countries (World Health Organization, 2017).
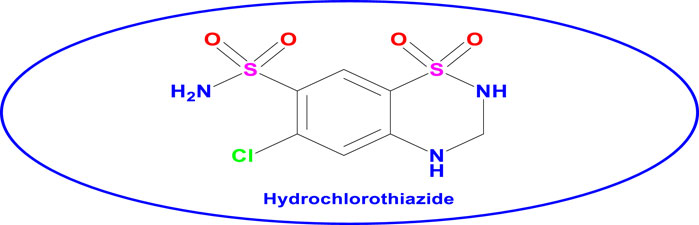
Figure 1. hemical structure of hydrochlorothiazide.
For effective blood pressure reduction, the medications must be safe and contain therapeutically active formulations with consistent and predictable effects (Noor et al., 2017). Different brands of the same products must have the same quality, strength, purity, and dissolution patterns, or they must be biopharmaceutically and chemically comparable in clinical use (Afifi and Ahmadeen, 2012). Hence, providing high product quality to the community is a sustainable requirement in healthcare systems. However, there are inadequate pharmaceutical industries and quality monitoring policies to deliver sufficient and qualified medicine to the communities across Africa. The quality of pharmaceutical products is assured by the acceptance limits of the active pharmaceutical ingredients (APIs) in the pharmaceutical products. Formulations having APIs above or below the specified levels are considered to be of poor quality. As a result, the two main types of poor-quality medicines are substandard and falsified products (Karmoker et al., 2017).
Substandard manufacturing of legitimate drugs is attributable to a lack of proper quality management procedures during manufacturing (Ozawa et al., 2018). Falsified drugs are a type of poor-quality medicines with hazardous quality or wrong ingredients that are disguised intentionally as genuine medications (Bassat et al., 2016a). Substandard and falsified drug manufacturing is a serious and underreported issue that mainly harms developing countries. The circulation of poor-quality medicines is a critical public health problem in managing different types of communicable and non-communicable diseases (NCDs) common in developing countries (Koczwara and Dressman, 2017); it results in treatment failures with prolonged or more severe sickness with conditions leading to death, development of drug resistance, and adverse drug reactions as well as higher healthcare costs, all of which can negatively affect public trust in the healthcare system (Kovacs et al., 2014).
The use of substandard or falsified medicines causes serious public health issues by increasing the global morbidity and mortality rates (Almuzaini et al., 2013). According to a WHO report, about 10.5% of drugs produced globally are substandard or falsified products. Furthermore, because of inadequate pharmaceutical governance, resources, trained personnel, technological capabilities, and supply-chain management, most of the burden of such products rests on low- and middle-income countries (LMICs) (Rojas-Cortés, 2020). According to the most recent study by the Minimum Development Goal Gap Task Force, up to 80% of mortality from NCDs occurs in LMICs (Yusuf et al., 2014). An assessment of drug quality implemented from 2017 to 2018 in 13 countries of Latin America showed that 236 items were substandard and that 239 drug products were falsified. In sub-Saharan Africa, for example, it is estimated that about 34% of the available drugs are of poor quality with poor pharmacovigilance and drug regulatory structures (Who, 2013). The prevalence of poor-quality drugs is significantly higher for in certain classes of cardiovascular drugs. Around 3,468 cardiovascular drug samples were collected from 10 sub-Saharan countries; out of 1,530 samples, 249 (16.3%) were below the quality standards (Antignac et al., 2017).
According to WHO reports (2017), 42% of the medicines circulating in African countries are either substandard or falsified (World Health Organization, 2017). A study in south Togo showed that the content of APIs in HCT tablets deviated by more than 25% from the declared amounts required by the United States Pharmacopeia (USP) (Antignac et al., 2017). All pharmaceutical products must meet the desired quality standards and must be bioequivalent so that different brands can be prescribed interchangeably. For example, out of five brands of nifedipine marketed in India, one brand failed to meet the specification for uniformity of content and assay (<90%) (Sharma et al., 2006). The factors that critically affect the fabrication, distribution, and use of poor-quality pharmaceuticals as well as severely jeopardize national healthcare systems also impose substantial public health risks with several negative consequences (Schiavetti et al., 2020).
An in vitro quality study on seven metformin hydrochloride tablet brands circulated in Ethiopia showed that four were not bioequivalent. Their difference factor (f1) values were below 50 (19, 41, 37, and 39) and similarity factor (f2) values were above 15 (38, 16, 17, and 17 with respect to the f1 values). Such variations may cause treatment failure or resistance to the medication when used interchangeably (Tesfay et al., 2019). Hence, in sub-Saharan countries like Ethiopia, the quality monitoring of pharmaceutical products is not applied strictly across the board, and the prevalence rates of poor-quality medicines are high. For example, a quality analysis study in Ethiopia revealed that 29.2% of samples among 106 combined samples of albendazole, mebendazole, and tinidazole did not meet the pharmacopeia acceptance specifications for assay and were thus formally grouped under substandard medicines (Wega, 2016). As a result, there may be a chance of access to poor-quality drugs from nearby countries like Djibouti and Somalia in the area of study. The quality of pharmaceuticals supplied in the healthcare system is determined by evaluating the marketed drug product quality. However, there is not enough prior research on the quality of medications in Ethiopia, especially with respect to antihypertensive drugs. In addition, the Ethiopian Food and Drug Administration (EFDA) has recommended researching the quality of select antihypertensive drugs in Ethiopia. Therefore, this study aimed to evaluate the quality of different brands of HCT 25 mg tablets sold in Dessie town, Northeast Ethiopia.
The primary standards for HCT were obtained from Human Well Pharmaceuticals. All reagents and solvents used in the experiments were high-performance liquid chromatography (HPLC) grade. These included acetonitrile (Sisco Research Laboratories Pvt. Ltd., India), methanol (Loba Chemie Pvt. Ltd., India), 98% hydrochloric acid (Loba Chemie Pvt. Ltd., India), 98% monobasic potassium phosphate (Lot. No. L331682003, SCR, China), alcohol, and ultrafiltered water.
The following instruments and apparatus were used for the in vitro quality evaluations of different brands of HCT tablets. These included a HPLC column (H605027, Ultimate 3000, United States) of dimensions 4.6 mm × 25 cm packed with L1 made up of C18 (Agilent, California, United State), a single-beam UV-Visible spectrophotometer (Evolution 201, Thermo Fisher, United States), friability tester (FT-2000SE, Tianda-Tianfa, China), ultrasonic shaking incubator (THZ-300, Shanghai-Yiheng, China), dissolution testing apparatus Ӏ(ZRS-8G, Tianjin Instrument Factory, China), hardness tester (YD-20KZ, Tianda-Tianfa, China), pH meter (FE-28 standard, Metter Toledo, United States), mortar and pestle, analytical balance (MS205DU, Metter Toledo, United States), disintegration time test apparatus (ZB-1E, Tianda-Tianfa, China), digital calipers (Xin Xing, China), and beakers of different sizes as needed.
Nine brands of HCT 25 mg tablets were purchased from a Dessie community pharmacy in Northeast Ethiopia. These brands were coded from NF1 to NF9 for easy identification. All brands were purchased with their original packaging and were within their expiration dates (Table 1). All samples were stored inside a locked cabinet in the quality control laboratory at an ambient temperature of 25°C.
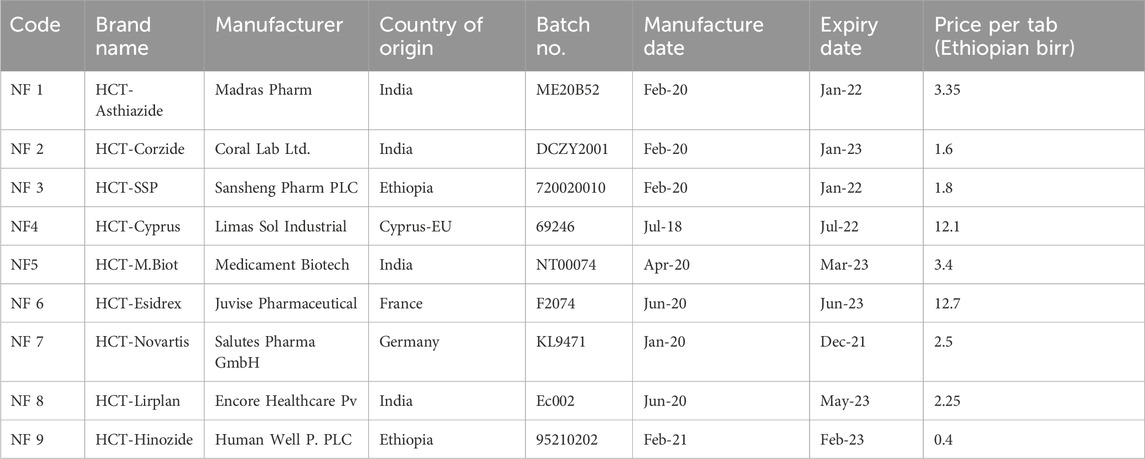
Table 1. General descriptions of the hydrochlorothiazide 25 mg tablet marketed in the community pharmacies of Dessie town, Northeast Ethiopia.
An experimental cross-sectional study was conducted from February 2021 to July 2021 in Dessie town, Northeast Ethiopia. Dessie town is 401 km away from the capital f Ethiopia (Addis Ababa); it has two government and three private hospitals, seven health centers, thirty-six community pharmacies, more than twenty wholesalers, thirty-eight drug stores, and more than twelve specialty clinics. The reason for selecting this study area was the presence of many community pharmacies, wholesalers, and government and private health institutions. The town also serves as a referral point for patients from Afar, North Wollo, Kemissie, Kombolcha, and other nearby areas. Thus, most patients would have had access to both prescription and non-prescription (over the counter (OTC)) drugs.
The sampling design, sampling, and sample size determination were based on a previous study with slight modifications (Singh and Masuku, 2013; Abebe et al., 2020). First, information about the available brands of HCT 25 mg tablets was gathered from different pharmacy professionals working in the community pharmacies of Dessie town. Thus, nine different brands that were marketed to and used by the community were determined. According to information obtained from the Human Resources of Dessie town health offices, 36 community pharmacies (government and private) were registered legally in the town.
All of these community pharmacies were listed alphabetically and coded. Considering that all these pharmacies provide equal service to their clients and to avoid repeated sampling of the brands, nine community pharmacies were randomly selected using a lottery method. Then, nine individual prescriptions were prepared for each randomly selected community pharmacy, where HCT 25 mg was prescribed twice a day (BID-based) for 2 months. Finally, single brands with 120 samples (as tablets) were purchased from each community pharmacy for a total of 1,080 samples for the nine brands; the prescriptions were filled from 01/02/2021 to 30/02/2021 using single prescription papers and were coded according to the place of purchase. This means that a brand that was already purchased from one pharmacy was no longer considered from any of the other pharmacies (one unique brand per community pharmacy). Because the prescription was written with brand names and since these were convenient for the study purposes, all available brands were included in the study (Abebe et al., 2020; Eraga et al., 2015). The samples were collected using well-trained pharmacy personnel acting as simulated caregivers to eliminate any suspicion from the medication vendors that their medicines were being acquired for testing. All samples were evaluated by Human Well Pharmaceuticals PLC (quality control department) in the Amhara region, North Shoa, Ethiopia.
Nine brands of HCT 25 mg tablets collected from the market were tested for identification, uniformity of dosage unit friability, hardness, disintegration time, dissolution, and assay based on specific monographs in the United States and British pharmacopeia (Usp, 2019; Pharmacopeia, 2009). Ethical approval was not required for this study because it is not an in vivo study and does not include living subjects (like animals or human beings) in the study.
Visual inspection is a common in vitro quality control parameter that helps to evaluate the physical appearance of the tablet. Therefore, the product label was determined using the WHO physical inspection checklist model by randomly selecting 20 tablets from each brand (Tesfay et al., 2019).
The authenticity of the product was determined by HPLC (Ultimate 3000, Thermo Fisher, United States) by cross matching the retention time of the major peak of the test sample to the respective chromatogram of the standard solution (Usp, 2019).
Individual tablets (20 numbers) of each brand were measured using an analytical balance as
The formula for percentage deviation is given by
The strengths of the tablets were measured using a hardness tester (YD-20KZ, Tianda-Tianfa, China) by applying machine-driven force on diametrically placed tablets. The instrument provides the hardness value of each tablet in newton, from which their means and standard deviations were calculated (Afifi and Ahmadeen, 2012; Pharmacopeia, 2009).
Twenty tablets were randomly retrieved from each brand and weighed accurately using an electrical beam balance. These tablets were subjected to abrasion using a friability test machine (FT-200SE, Tianda-Tianfa, China) at 25 rpm for 4 min (100 revolutions). After completing the revolutions, the drum was stopped; the tablets were removed from the drum and weighed again. The percentage friability of each brand was calculated based on the following formula (Usp, 2019; Pharmacopeia, 2009).
Six tablets were randomly retrieved from each brand and transferred to the USP disintegration apparatus (ZB-1E, Tianda-Tianfa, China), which consists of a rigid basket rack assembly holding six cylindrical glass tubes. Each tube moves vertically in the disintegration medium. The disintegration medium was 900 mL of water, and the temperature was maintained at 37°C ± 1°C. The time when no particles remained in the basket was considered as the disintegration time. This time was recorded for each tested tablet, and the mean disintegration time was calculated for each brand (Usp, 2019).
In vitro dissolution tests were performed using the USP apparatus-I (basket type) as per the monograph of the USP. The test was conducted on six randomly selected tablets from each brand, and the medium used was 900 mL of 0.1 N HCl at a temperature of 37°C ± 0.5°C. The speed of the apparatus for the experiment was 100 rpm for the individual tests (Usp, 2019).
Preparations of the standard and sample solutions were as follows. First, about 100 mg of the HCT reference standard was accurately weighed and transferred into a 500 mL volumetric flask and dissolved with a medium to a volume limit containing 200 μg/mL. Considering this as the stock solution of the reference standard, six serially diluted standard samples were prepared as described in the procedures. The calibration equation and correlation coefficient were determined by plotting the six serially diluted standard concentrations (6 μg/mL, 9 μg/mL, 12 μg/mL, 15 μg/mL, 18 μg/mL, and 21 μg/mL) on the x-axis and their respective absorbance values on the y-axis (Moosavi and Ghassabian, 2018). The lowest limit of quantification of the prepared diluted standard sample should be greater than five times the absorbance value of the blank solution (Berthier, 2004).
Six tablets were randomly selected from each brand and transferred to the medium. Then, the sample solution was prepared for UV-visible analysis by retrieving 15 mL from each of the six beakers and transferring into six well-cleaned glass beakers using a 0.45 µm pore size filter at 0, 5, 15, 30, 45, and 60 min. Then, 13.5 mL of the sample solution was drawn from each glass beaker and transferred into individual 25 mL volumetric flasks using a volumetric pipette. Thus, it was deemed that suitable dilution was achieved (adding a diluent to a volume of 25 mL) to obtain the accepted sample concentration of 15 μg/mL (125%) (Othman, 2014); this sample was analyzed using UV-Visible spectroscopy (Evolution 201, Thermo Fisher, United States) at the wavelength of 272 nm to obtain the maximum absorbance (Usp, 2019). The absorbance of each sample was measured thus, and a calibration equation was used to determine the rate of drug release (concentration) over time against a standard solution of known concentration (Sultana and Hosen, 2018). The tolerances were computed as the amounts of APIs released from the tablets, which should not be less than 60% of the stated amount dissolved over 60 min.
The resulting dissolution profiles of different brands of HCT products under the test medium were compared using a model-independent approach of difference factor (f1) and similarity factor (f2). A minimum of more than three sampling points over time is required to characterize the dissolution profile (Use, 2006).
The difference factor is used to determine the percentage difference between two dissolution profiles at each time point, and the relative error between the two profiles is measured (Diaz et al., 2016). The similarity factor is used to indicate the average percentage of sameness between two dissolution profiles. According to the guidelines issued by 14 regulatory authorities, f1 values of up to 15 (0–15) and f2 values greater than 50 (50–100) ensure the similarity or bioequivalence of two profiles (Diaz et al., 2016).
where n = number of the dissolution sampling time;
The assay test for HCT tablets was conducted as per the USP, and the limits are usually expressed with regard to the active moiety or label claim (Usp, 2019). The mobile phase was first prepared as follows. First, 0.1 M monobasic sodium phosphate solution was prepared using ultrafiltered water as the dissolving medium. This solution was mixed with acetonitrile in the ratio of 9:1 and degassed. The pH was adjusted using phosphoric acid to 3.0 ± 0.1 and filtered. The chromatographic system involved the HPLC column (Ultimate 3000, Thermo Fisher, United States) equipped with a 254 nm UV-visible detector. The column was 4.6 mm × 25 cm and packed with L1 made comprising C18 to ensure a reverse-phase system. The column temperature was 30°C, and the data analyzer software used was Chromeleon version 7.2.4.8179. The flow rate was about 2 mL/min with an injection volume of 20 μL. Before injecting the standard and test samples into the HPLC, the column was equilibrated by continuously pumping the mobile phase through the system to ensure that the baseline was straight. Then, chromatograph and peak response of the standard solution was recorded. The relative standard deviation for replicate injection was not more than 1.5% from that of the standard solution.
The standard solution preparation involved accurately measuring 15 mg of the HCT reference standard, which was transferred into a 100-mL volumetric flask. Then, it was dissolved to a certain volume with the mobile phase to obtain a solution having a known concentration of 0.15 mg/mL. The sample solution preparation involved first weighing twenty tablets from each brand and finely powdering them to facilitate solubility of the drug. Then, an accurately weighed portion (equivalent of 30 mg) was retrieved from the fine powder and transferred into a 200-mL volumetric flask. Next, about 100 mL of the mobile phase solution was added to the sample and sonicated for 10 min using a mechanical shaker. This was diluted to a certain volume with the mobile solution and mixed well. Finally, the solution was filtered, and the first 10 mL of the filtrate was discarded.
The analysis procedure involved injecting equal volumes (20 μL) of the standard and the sample solutions separately into the HPLC, and the major peak response was measured from the recorded chromatogram. The percentage of the labeled amount of HCT in a portion of a tablet was calculated using the following formula:
where Cs and Cu are the concentrations (in mg/mL) of the reference in the standard preparation and nominal concentration of HCT in the sample solution, respectively; ru and rs are the peak responses of the sample and reference solutions, respectively. For acceptance, the USP asserts that the HCT tablet formulation should contain the API in the range of 90%–110% of the stated amount.
The collected data were evaluated and checked for completeness and consistency before analyses. The data were expressed in terms of mean ± standard deviation (SD). The calibration curve was constructed by plotting the serially diluted standard concentrations along the x-axis and their absorbance values along the y-axis in Microsoft Excel 2010. The interchangeability and/or bioequivalence were confirmed with one-way ANOVA, followed by multiple comparisons of the Dunnett t-test at a 95% confidence interval; p < 0.05 was considered to be statistically significant. In addition, the model-independent approach involving f1 and f2 was used.
Regardless of addressing medical products to the community, there are still unethical commercial practices that influence the service quality, where poor-quality medications are manufactured and distributed in the market (Osei-Asare et al., 2021). Therefore, ensuring the quality of the drugs available in the market is a primary step in controlling disease conditions and decreasing the circulation of poor-quality medications in the supply chain. In addition, encouraging generic medicines from different market sources into the healthcare system regularly reduces healthcare costs, so that patients can easily afford such medications. Of the nine brands of HCT tablets included in this study, two were manufactured locally, while seven were imported from foreign countries. Further, all HCT brands were subjected to several quality control tests to assess their dissolution profiles in line with other quality parameters, including weight variation, friability, hardness, and assay.
Visually inspection of the tablets offered qualitative information regarding the appearances or product labels of the tablets (screening for the presence or absence of visual quality defects). Hence, among the nine brands, eight were white, while brand NF1 had a yellow color. All brands were round, uncoated, and blister packed with all necessary information printed on the packaging. Moreover, the product strengths were well documented on the blisters. The tablets from all brands evaluated had no scratches, cracks, deformations, unusual colors, discolorations, dirt, foreign matter, mislabeled information, or other defects on the product. An assessment of the physical features, packaging, and labeling revealed no evidence of fake, fraudulently labeled, or falsified products.
Unequivocally identifying the API content of different dosage forms is the most important primary test to ensure genuineness of the product before proceeding with further tests (Huang et al., 2020). In this study, the retention time of the HCT standard was 5.783 min, and its peak retention time ranged from 5.658 (NF7) to 5.740 (NF6) min, as shown in Table 2 and Figure 2. All the analyzed samples displayed retention times corresponding to the respective standards; this indicates that all products contained genuine APIs in the dosage forms.
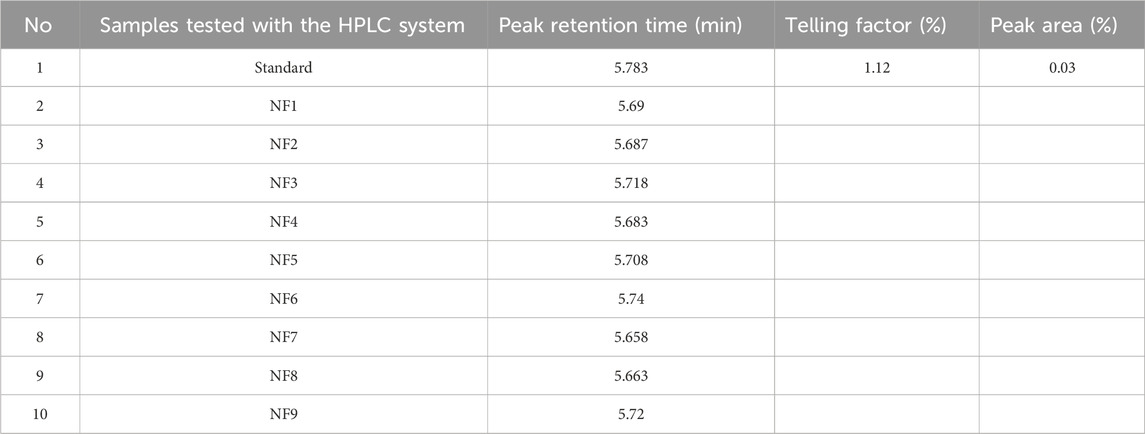
Table 2. Peak retention time results of different brands of hydrochlorothiazide 25 mg tablets and the reference standard.

Figure 2. Representative chromatograms of the standard and nine different brands of hydrochlorothiazide 25 mg.
The weight variation test is a quality parameter that ensure consistency of dose units as per the label claims. The minimum and maximum percentage deviations of the individual brands of HCT 25 mg tablets are shown in Table 3. A negative value indicates that the tablet weight is below the mean (standard) value. The weight variation limits depend on the average weight of the tablets from the corresponding brands. For the individual brands, the mean weights were categorized under ≤130 mg, 130–324 mg, and ≥324 mg, and the percentage deviations of the individual tablets had limits of ±10%, ±7.5%, and ±5%, respectively. It is noted that not more than two tablets were outside these percentage limits, and none of the tablets differed by more than twice their corresponding percentage deviation limits (Usp, 2019). The results from the study showed that the average weights of the brands NF3 and NF4 were less than 130 mg and that none of the tablet percentage deviations were outside the limits of ±10%. The average weights of 20 tablets from the brands NF1, NF2, NF5, NF6, NF8, and NF9 were within the range of 130–324 mg; accordingly, most tablet percentage deviations from the mean values of their corresponding brands were within the limits of ±7.5%. Only one tablet each from the brands NF5 and NF7 had deviations of −13.394% and −11.377%, respectively; however, these values did not exceed twice the corresponding percentage limits (7.5%). Thus, all brands had satisfactory weight uniformity throughout the product. This may be because manufacturing companies strictly adhere to good manufacturing practices during the granulation and compression stages to ensure tablet weight uniformity (Mustapha et al., 2020). This also means that the companies use almost uniform granulation processes and compression forces for tablet production. However, this test is not a confirmatory test for the amount of API and only provides a rough estimation of the formulation.
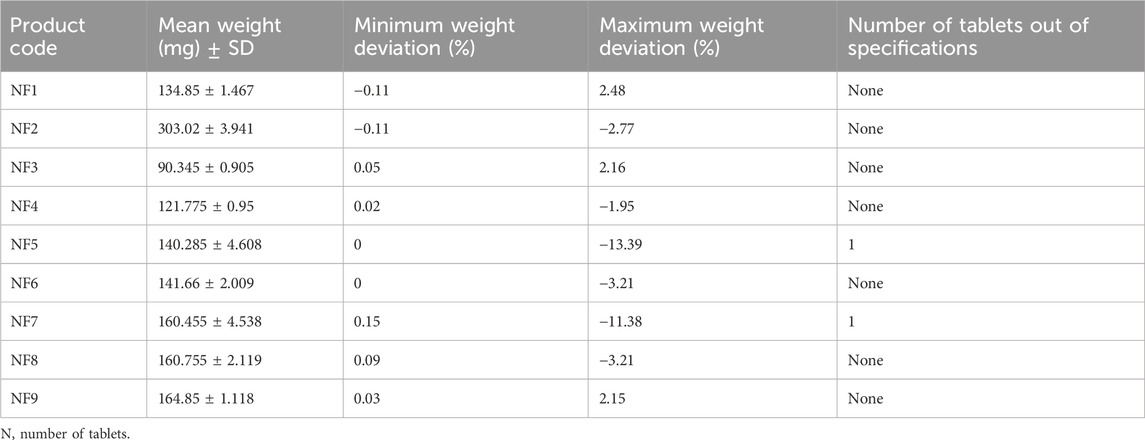
Table 3. Weight variation test results of the hydrochlorothiazide 25 mg tablets (N = 20).
The mean hardness values of the nine different brands of HCT 25 mg tablets ranged from 24.20 ± 7.32 N (NF3) to 62.07 ± 1.69 N (NF4), as shown in Table 4. A tablet must have a minimum crushing strength of 40 N to withstand mechanical stresses (forces) during the manufacturing, packaging, and shipping processes (Kumar et al., 2018; Alnedhary et al., 2021). Correspondingly, the results of brands NF3 (24.20 ± 7.32 N), NF5 (32.19 ± 4.78 N), and NF9 (35.02 ± 3.12 N) were below the minimum hardness requirement; this may be because of the application of minimum compression force, a lower quantity of binders during manufacturing, or the granulation method used during manufacturing. It has been shown that dry (direct) granulation produces less hardness than wet granulation (Mahant et al., 2020). Tablet hardness for a drug product is a critical parameter that directly affects the bioavailability of the drug by altering its disintegration time, friability, and dissolution profile (Alnedhary et al., 2021). If the tablet is less hard, it will be easily friable and lose the APIs from the formulation. Hence, the amounts of APIs that reach systemic circulation will decrease, diminishing the therapeutic effectiveness. Therefore, tablets must have good mechanical strengths to ensure appropriate hardness-related properties (Ali et al., 2018).
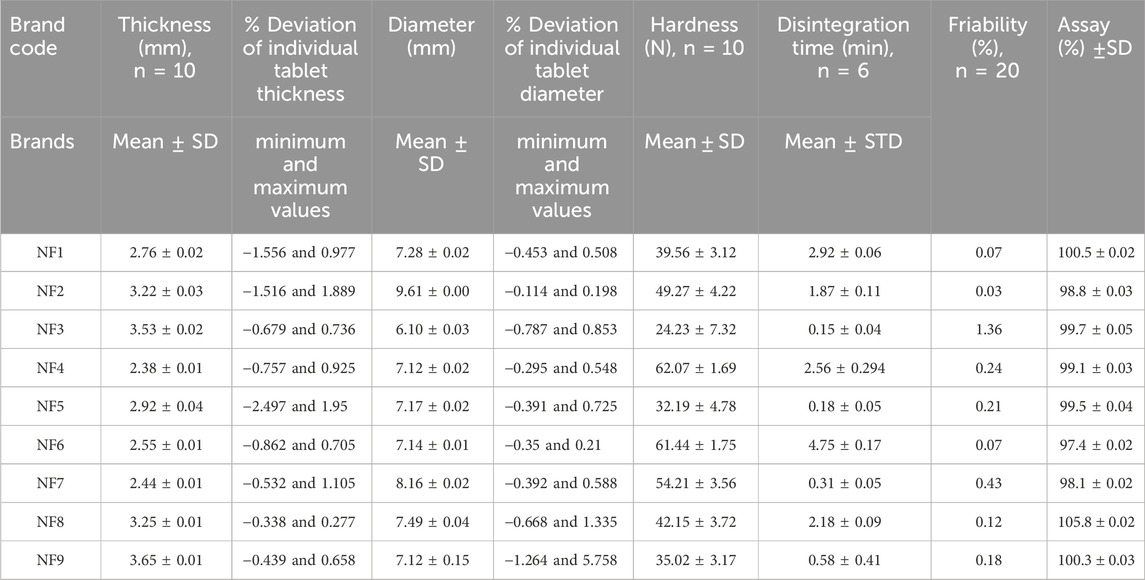
Table 4. Thickness (mm), diameter (mm), hardness (N), disintegration time (min), friability (%), and assay (%) test results.
As shown in Table 4, the lowest and highest percentage friability results among the different brands of HCT tablets were 0.03% (NF2) and 1.36% (NF3). As described in the USP and British pharmacopeia, the percentage friability of a tablet should be less than 1% (Usp, 2019; Pharmacopeia, 2009). Hence, our results showed that only the brand NF3 (1.36%) failed this friability specification limit (<1%), which could be a result of the lower crushing strength of their tablets (24.23 N). The tablet strength is directly related to the amount and nature of the binder, method of tablet production, and applied amount of compression force during manufacturing. We know that adequate friability is a quality requirement for ensuring a tablet’s resistances to abrasion during packaging, handling, and transportation (Onalo et al., 2021). If the tablet is friable, the amount of API present in the formulation will be below the required amount and may cause problems with content uniformity in the product (Othman, 2014). This will also decrease the bioavailability of the drug and customer trust in the product (Isaac et al., 2021). Therefore, the tablet should be manufactured with adequate hardness and reasonable friability to ensure consumer acceptance.
The mean disintegration time results of the HCT tablets were in the range of 0.15 ±0.04 min (NF3) to 4.75 ±0.17 min (NF6), as shown in Table 4. The maximum disintegration time for uncoated and film-coated tablets is up to 30 min based on the USP (Usp, 2019). Overall, the mean disintegration times of all tested brands were within the pharmacopeia specification (30 min). In this study, the brands NF3, NF5, NF7, and NF9 had disintegration times of less than 1 min. According to the study by Nigatu et al. (2019), the types and amounts of excipients used in tablet formulations as well as their manufacturing methods are critical factors influencing tablet disintegration times. Accordingly, brands NF3, NF5, and NF9 that had very short disintegration times may have been manufactured using low compression forces because their hardness values were less than the minimum required value (39.23 N). Mainly, the product by NF3 had the lowest disintegration time (0.15 min), which correlated with its lower hardness and high friability. Brand NF7 also had a short disintegration time possibly owing to the presence of a high amount of disintegrants in the formulation. The disintegration of an orally administered tablet is the primary step through which a physical change occurs after the drug is administered; it helps predict the process of tablet fractionation into smaller pieces and is the rate-determining step in drug dissolution and absorption processes. If the disintegration time is not sufficient, the effectiveness of the drug is not good. The dissolution rate will decrease if the tablet disintegration time is too long; from this, it follows that the expected amount of API will not reach the systemic circulation. Therefore, the type, concentration, and efficiency of the disintegrant affect the dissolution and absorption of orally administered tablet dosage forms to a great extent (Mangal et al., 2012).
Calibration curves were employed to determine the amounts of APIs released from the tablet dosage forms. A calibration curve, also known as a standard curve in analytical chemistry, is a general technique for measuring the concentration of an analyte in an unknown sample through comparison to a series of known concentrations of the standard solution. Using the results in Table 5, the determination coefficient
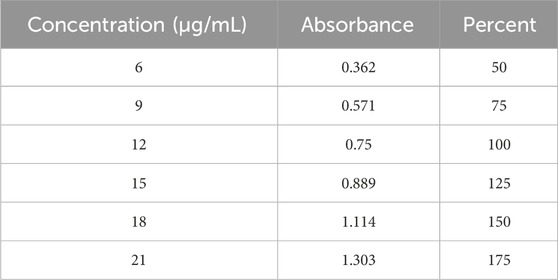
Table 5. Data for the standard calibration curve of hydrochlorothiazide.
The market availability of different brands of medicines can confuse healthcare professionals and patients regarding the choice of brand and possibility of interchangeability among the brands. A bioequivalence study is thus required to ensure that different brands of a drug can be used interchangeably; this was conducted using the model-independent approach based on f1 and f2. The Innovator brand of HCT is not available, so brand NF6 was selected as a comparator according to the principle specified in the decision tree of Annex 11 of WHO 2002 (Preparations, 1999). As shown in Table 6, the f1 and f2 values ranged from 2.4 (NF8) to 8.6 (NF8) and from 56.1 (NF3) to 80.9 (NF8), respectively. In addition, the release patterns of the tablets is expressed graphically in Figure 3, and the findings indicate overlapped dissolution profile curves. The f1 (<15) and f2 (>50) values of all test samples were within the accepted ranges (Diaz et al., 2016). Hence, all test brands were deemed similar or bioequivalent to the comparator drug.
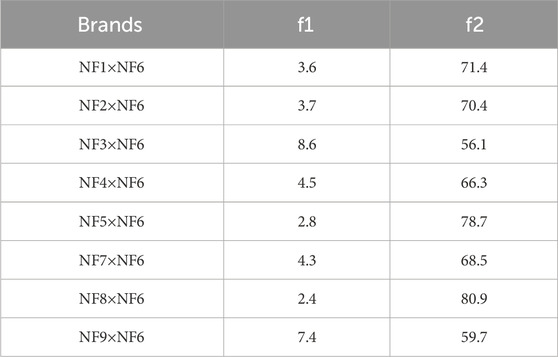
Table 6. f1 and f2 values of different brands of hydrochlorothiazide against the comparator.
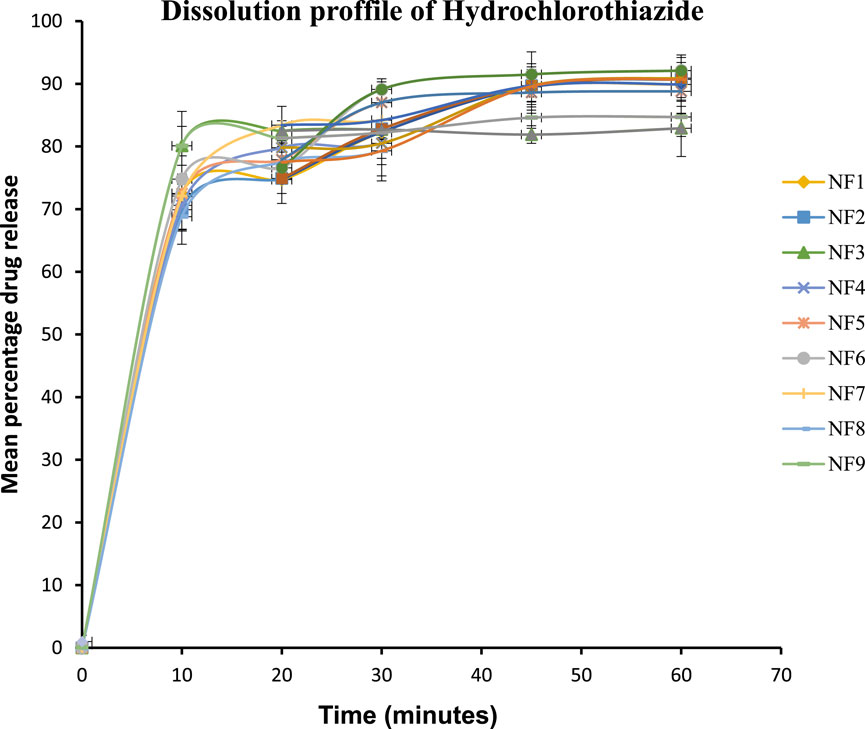
Figure 3. Dissolution profiles of the different brands of hydrochlorothiazide tablets.
The Dunnett t-test statistical analysis results showed that the p-values of all brands against the comparator (NF6) ranged from 0.982 to 1.00, and ANOVA resulted in a p-value of 0.999. Therefore, there were no statistically significant differences in the percentage releases of APIs between all brands of HCT and the comparator because all of their p-values were >0.05. Hence, there is no statistically significant difference in the time-dependent percentage release within and between different brands of HCT products (p-value >0.05).
The dissolution rate of a tablet formulation is affected by several factors like the intrinsic properties of the API in the formulation, manufacturing process, dissolution medium used, formulation composition, and characteristics of the excipients (Diaz et al., 2016). Nevertheless, in our study, none of the brands were greatly affected by these factors because the amounts of APIs released from all the brands were above the minimum limit specified by the USP; this may be related to the rates of disintegration of the tablets. The disintegration time results of all brands were below 5 min; such rapid disintegration of the tablet dosage forms implies rapid breakdown of the tablets into smaller particles that will then enhance the dissolution rates of the medications into systemic circulation (Schittny et al., 2020). Therefore, when the dissolution rate increases, the bioavailability and therapeutic effectiveness of the drug will also increase.
As per the Usp (2019), the suitability results of the percentage relative standard deviations (%RSDs) of the peak area response and tailing factor of HCT obtained using the HPLC system were 0.03% (<5%) and 1.12% (<2%), respectively. Therefore, the HPLC system was suitable for the test. The minimum and maximum API percentages of the HCT tablets were 97.4 ± 0.02 (NF6) and 105.8 ± 0.02 (NF8), respectively. Hence, all brands were within the range of the USP specification limits (90%–110%). The detailed assay results of the different brands of HCT tablets used in this study are shown in Table 4.
An assay test of the API content of a dosage form is a critical parameter for ensuring the quality of the pharmaceutical product. Determining the amount of API present in the formulation helps to ensure the potency and efficacy of the drug against the disease condition (Mangal et al., 2012). This means that high-quality pharmaceutical products for HCT can help control hypertension while reducing the mortality and morbidity rates. However, if the API content of the product is below or above the specification limits, it will increase the prevalence of substandard products in the community. If the amount of API is below the specified limit, it will result in poor control over hypertension; however, if the amount of API is above the stated limit, it may lead to a high incidence of adverse reactions and may even decrease the blood pressure below the desired lower limit (Tesfay et al., 2019; Trevisol et al., 2011). As described by McManus and Naughton (2020), poor-quality drugs can result in treatment failure, mass poisoning, and drug resistance, eventually leading to death. Therefore, all pharmaceutical products must be manufactured using the amended pharmacopeia procedures, and all quality parameters must be evaluated to achieve the desired therapeutic outcomes.
The qualities and physicochemical bioequivalence of nine different brands of HCT tablets were evaluated in this study. The results show that all of the evaluated brands of HCT 25 mg tablets met the quality control parameters as per the pharmacopeia specifications, except for three brands (NF3, NF5, and NF9) that failed the hardness test and one brand that failed the friability test (NF3; 1.36%). The difference factor (f1) and similarity factor (f2) values revealed that all brands were similar to the Innovator brand comparator product. Hence, we showed that these generic brands could be used interchangeably in clinical practice.
The raw data supporting the conclusions of this article will be made available by the authors without undue reservation.
YW: Conceptualization, Data curation, Formal analysis, Investigation, Methodology, Resources, Supervision, Validation, Visualization, Writing–original draft, Writing–review and editing. HD: Conceptualization, Supervision, Visualization, Methodology, Writing–review and editing. YA: Conceptualization, Supervision, Visualization, Data curation, Writing–review and editing. AT: Data curation, Supervision, Visualization, Formal analysis, Investigation, Writing–review and editing. KA: Supervision, Formal analysis, Visualization, Writing - review and editing. BE: Investigation, Supervision, Visualization, Conceptualization, Formal analysis, Methodology, Writing–review and editing. SD: Conceptualization, Data curation, Software, Validation, Visualization, Formal analysis, Writing–review and editing.
The author(s) declare that no financial support was received for the research, authorship, and/or publication of this article.
The authors extend their sincere thanks to Wollo University and Amhara Regional Health Bureau for supporting this study. The authors also thank Human Well Pharmaceutical Ethiopia PLC and the Ethiopian Food and Drug Administration Authority (EFDA) for the reference standards. The authors thank the team at Research Square as this manuscript was presented as a “Preprint” for comments from the scientific community and researchers.
The authors declare that the research was conducted in the absence of any commercial or financial relationships that could be construed as a potential conflict of interest.
All claims expressed in this article are solely those of the authors and do not necessarily represent those of their affiliated organizations or those of the publisher, editors, and reviewers. Any product that may be evaluated in this article or claim that may be made by its manufacturer is not guaranteed or endorsed by the publisher.
Abebe, S., Ketema, G., and Kassahun, H. (2020). In vitro comparative quality assessment of different brands of Furosemide tablets marketed in northwest Ethiopia. Drug Des. Dev. Ther. 14, 5119–5128. doi:10.2147/DDDT.S280203
Afifi, S. A., and Ahmadeen, S. (2012). A comparative study for evaluation of different brands of metformin hydrochloride 500 mg tablets marketed in Saudi Arabia. Life Sci. J. 9 (4), 4260–4266.
Ali, M., et al. (2018). Comparative in vitro evaluation of some commercial brands of valsartan tablets marketed in Bangladesh. Pharma Innovation J. 7 (4), 1068–1072.
Almuzaini, T., Choonara, I., and Sammons, H. (2013). Substandard and counterfeit medicines: a systematic review of the literature. BMJ open 3 (8), e002923. doi:10.1136/bmjopen-2013-002923
Alnedhary, A. A., et al. (2021). A comparative study to assess the quality of different marketed brands of metformin HCl. Biol. Res. 6 (3), 84–95.
Antignac, M., Diop, B. I., Macquart de Terline, D., Bernard, M., Do, B., Ikama, S. M., et al. (2017). Fighting fake medicines: first quality evaluation of cardiac drugs in Africa. Int. J. Cardiol. 243, 523–528. doi:10.1016/j.ijcard.2017.04.099
Bassat, Q., Tanner, M., Guerin, P. J., Stricker, K., and Hamed, K. (2016a). Combating poor-quality anti-malarial medicines: a call to action. Malar. J. 15 (1), 302–312. doi:10.1186/s12936-016-1357-8
Bassat, Q., Tanner, M., Guerin, P. J., Stricker, K., and Hamed, K. (2016b). Combating poor-quality anti-malarial medicines: a call to action. Malar. J. 15 (1), 302–312. doi:10.1186/s12936-016-1357-8
Berthier, S. (2004). Validation of bioanalytical methods. Handb. Anal. Sep. 5, 113–128. doi:10.1016/s1567-7192(04)80006-8
Bigdeli, M., Peters, D. H., and Wagner, A. K.World Health Organization (2014). Medicines in health systems: advancing access, affordability and appropriate use.
Diaz, D. A., Colgan, S. T., Langer, C. S., Bandi, N. T., Likar, M. D., and Van Alstine, L. (2016). Dissolution similarity requirements: how similar or dissimilar are the global regulatory expectations? AAPS J. 18 (1), 15–22. doi:10.1208/s12248-015-9830-9
Dreisbach, A. W., and Batuman, V. (2013). Epidemiology of hypertension. Suppl. JAPI Febr. 61, 12–13.
Eraga, S. O., Arhewoh, M. I., Chibuogwu, R. N., and Iwuagwu, M. A. (2015). A comparative UV− HPLC analysis of ten brands of ibuprofen tablets. Asian Pac. J. Trop. Biomed. 5 (10), 880–884. doi:10.1016/j.apjtb.2015.06.005
Huang, F., Zhang, C., Liu, Q., Zhao, Y., Zhang, Y., Qin, Y., et al. (2020). Identification of amitriptyline HCl, flavin adenine dinucleotide, azacitidine and calcitriol as repurposing drugs for influenza A H5N1 virus-induced lung injury. PLoS Pathog. 16 (3), e1008341. doi:10.1371/journal.ppat.1008341
Isaac, J. A., Hayatu, G. I., John, J. E., Ekere, K. E., Daburi, A., Omachoko, S. O., et al. (2021). Quality assessment of brands of prednisolone (5 Mg) tablets marketed in abuja metropolis of Nigeria. Dissolution Technol. 28 (1), 24–31. doi:10.14227/dt280121p24
Karmoker, J. R., et al. (2017). Comparative in vitro equivalence evaluation of some local Gliclazide brands of Bangladesh. Pharma Innovation 6 (3, Part C), 152.
Koczwara, A., and Dressman, J. (2017). Poor-quality and counterfeit drugs: a systematic assessment of prevalence and risks based on data published from 2007 to 2016. J. Pharm. Sci. 106 (10), 2921–2929. doi:10.1016/j.xphs.2017.05.018
Kovacs, S., Hawes, S. E., Maley, S. N., Mosites, E., Wong, L., and Stergachis, A. (2014). Technologies for detecting falsified and substandard drugs in low and middle-income countries. PloS one 9 (3), e90601. doi:10.1371/journal.pone.0090601
Kumar, M., Tyagi, S., Bhatt, S., Pandurangan, A., Saini, V., Malik, A., et al. (2018). Comparative evaluation of two different marketed brands of enalapril maleate. J. Drug Deliv. Ther. 8 (6-s), 265–268. doi:10.22270/jddt.v8i6-s.2127
Lim, S. S., Vos, T., Flaxman, A. D., Danaei, G., Shibuya, K., Adair-Rohani, H., et al. (2012). A comparative risk assessment of burden of disease and injury attributable to 67 risk factors and risk factor clusters in 21 regions, 1990–2010: a systematic analysis for the Global Burden of Disease Study 2010. lancet 380 (9859), 2224–2260. doi:10.1016/S0140-6736(12)61766-8
Mangal, M., et al. (2012). Comparison study between various reported disintegrating methods for fast dissolving tablets. Afr. J Basic & Appl Sci 4 (4), 106–109.
McManus, D., and Naughton, B. D. (2020). A systematic review of substandard, falsified, unlicensed and unregistered medicine sampling studies: a focus on context, prevalence, and quality. BMJ Glob. health 5 (8), e002393. doi:10.1136/bmjgh-2020-002393
Mills, K. T., Stefanescu, A., and He, J. (2020). The global epidemiology of hypertension. Nat. Rev. Nephrol. 16 (4), 223–237. doi:10.1038/s41581-019-0244-2
Moosavi, S. M., and Ghassabian, S. (2018). “Linearity of calibration curves for analytical methods: a review of criteria for assessment of method reliability,” in Calibration and validation of analytical methods: a sampling of current approaches (London, UK: IntechOpen Limited), 109–127.
Mustapha, K. B., Ekpo, M. D., Galadima, I. H., Kirim, R. A., Odeniran, O. A., and Ache, T. A. (2020). Quality assessment of brands of erythromycin stearate tablets marketed in Abuja, Nigeria. J. Pharm. Bioresour. 17 (1), 29–33. doi:10.4314/jpb.v17i1.6
Nigatu, M., Mohammed, F., and Temesgen, A. (2019). In vitro comparative study of different brands of pantoprazole sodium enteric coated tablets marketed in addis ababa, Ethiopia. Asian J. Pharm. Res. Dev. 7 (1), 13–18. doi:10.22270/ajprd.v7i1.467
Noor, S., et al. (2017). Comparative in-vitro quality evaluation of some brands of metronidazole tablet available in Bangladesh. Int. J. Appl. Res. 3 (7), 753–758.
Onalo, V. D., Abubakar, D., and Monday Chibuyojo, S. (2021). Quality assessment of some brands of levofloxacin 500mg tablets commercially available in gwagwalada, abuja. Sch. Acad. J. Pharm. 3, 43–48. doi:10.36347/sajp.2021.v10i03.002
Osei-Asare, C., Oppong, E. E., Owusu, F. W. A., Apenteng, J. A., Alatu, Y. O., and Sarpong, R. (2021). Comparative quality evaluation of selected brands of cefuroxime axetil tablets marketed in the greater accra region of Ghana. Sci. World J. 2021, 6659995. doi:10.1155/2021/6659995
Othman, G. Q. (2014). Comparative analysis of five brands of lisinopril tablets in Yemeni market. Yemeni J. Med. Sci. 8, 6.
Ozawa, S., Evans, D. R., Bessias, S., Haynie, D. G., Yemeke, T. T., Laing, S. K., et al. (2018). Prevalence and estimated economic burden of substandard and falsified medicines in low-and middle-income countries: a systematic review and meta-analysis. JAMA Netw. open 1 (4), e181662. doi:10.1001/jamanetworkopen.2018.1662
Pareek, A. K., Messerli, F. H., Chandurkar, N. B., Dharmadhikari, S. K., Godbole, A. V., Kshirsagar, P. P., et al. (2016). Efficacy of low-dose chlorthalidone and hydrochlorothiazide as assessed by 24-h ambulatory blood pressure monitoring. J. Am. Coll. Cardiol. 67 (4), 379–389. doi:10.1016/j.jacc.2015.10.083
Pires, M. A. S., Souza dos Santos, R. A., and Sinisterra, R. D. (2011). Pharmaceutical composition of hydrochlorothiazide:β-cyclo-dextrin: preparation by three different methods, physico-chemical characterization and in vivo diuretic activity evaluation. Molecules 16 (6), 4482–4499. doi:10.3390/molecules16064482
Preparations, W. E. C. o. S. f. P. (1999). Annex 11: guidance on the selection of comparator pharmaceutical products for equivalence assessment of interchangeable multisource (generic) products. Thirty-Fourth Rep.
Rojas-Cortés, R. (2020). Substandard, falsified and unregistered medicines in Latin America, 2017-2018. Rev. Panam. Salud Pública 44, e125. doi:10.26633/RPSP.2020.125
Schiavetti, B., Wynendaele, E., Melotte, V., Van der Elst, J., De Spiegeleer, B., and Ravinetto, R. (2020). A simplified checklist for the visual inspection of finished pharmaceutical products: a way to empower frontline health workers in the fight against poor-quality medicines. J. Pharm. Policy Pract. 13 (1), 9–7. doi:10.1186/s40545-020-00211-9
Schittny, A., Huwyler, J., and Puchkov, M. (2020). Mechanisms of increased bioavailability through amorphous solid dispersions: a review. Drug Deliv. 27 (1), 110–127. doi:10.1080/10717544.2019.1704940
Sharma, D., et al. (2006). In vitro comparative evaluation of different brands of nifedipine capsules. Asian J. Exp. Sci. 20 (1), 97–100.
Singh, A. S., and Masuku, M. B. (2013). Fundamentals of applied research and sampling techniques. Int. J. Med. Appl. Sci. 2 (4), 124–132.
Sultana, S., and Hosen, M. S. (2018). In vitro comparative quality evaluation of different brands of esomeprazole tablets available in selected community pharmacies in Dhaka, Bangladesh. BMC Res. notes 11 (1), 1–5.
Tesfay, K., et al. (2019). In vitro quality evaluation of metformin hydrochloride tablets marketed in western and North western tigray, Ethiopia. Austin J. Anal. Pharm. Chem. 6 (2), 1119.
Trevisol, D. J., Moreira, L. B., Kerkhoff, A., Fuchs, S. C., and Fuchs, F. D. (2011). Health-related quality of life and hypertension: a systematic review and meta-analysis of observational studies. J. Hypertens. 29 (2), 179–188. doi:10.1097/HJH.0b013e328340d76f
Use, C. f. M. P. f. H. (2006). European medicines agency committee for medicinal products for human use (CHMP) guideline on the evaluation of anticancer medicinal products in man. London, UK: European Medicines Agency.
Usp, U. (2019). 38—NF 33 the United States pharmacopeia and national formulary 2019: main edition plus supplements 1 and 2. Baltimore, MD, USA: Deutscher Apotheker Verlag.
Wega, S. S. (2016). Quality of selected medicines in Ethiopia: analytical and regulatory contributions. Ghent Univ.
World Health Organization (2017). WHO Global Surveillance and Monitoring System for substandard and falsified medical products.
Keywords: hydrochlorothiazide, in vitro, quality, weight variation, assay, equivalence
Citation: Wondmkun YT, Desta HK, Ali YS, Tsige AW, Ayenew KD, Endalifer BL and Dagnew SB (2024) In vitro comparative quality assessment of different brands of hydrochlorothiazide tablets marketed in Northeast Ethiopia. Front. Anal. Sci. 4:1399843. doi: 10.3389/frans.2024.1399843
Received: 12 March 2024; Accepted: 17 June 2024;
Published: 30 July 2024.
Edited by:
Marianne Fillet, University of Liège, BelgiumReviewed by:
Igor Magalhães, Federal University of Amazonas, BrazilCopyright © 2024 Wondmkun, Desta, Ali, Tsige, Ayenew, Endalifer and Dagnew. This is an open-access article distributed under the terms of the Creative Commons Attribution License (CC BY). The use, distribution or reproduction in other forums is permitted, provided the original author(s) and the copyright owner(s) are credited and that the original publication in this journal is cited, in accordance with accepted academic practice. No use, distribution or reproduction is permitted which does not comply with these terms.
*Correspondence: Yehualashet Teshome Wondmkun, eWVodWFsaWFyc0BnbWFpbC5jb20=
Disclaimer: All claims expressed in this article are solely those of the authors and do not necessarily represent those of their affiliated organizations, or those of the publisher, the editors and the reviewers. Any product that may be evaluated in this article or claim that may be made by its manufacturer is not guaranteed or endorsed by the publisher.
Research integrity at Frontiers
Learn more about the work of our research integrity team to safeguard the quality of each article we publish.