 Michael E. Sigman1,2*
 Mary R. Williams1
- 1National Center for Forensic Science, University of Central Florida, Orlando, FL, United States
- 2Department of Chemistry, University of Central Florida, Orlando, FL, United States
Forensic science standards often require the analyst to report in categorical terms. Categorical reporting without reference to the strength of the evidence, or the strength threshold that must be met to sustain or justify the decision, obscures the decision-making process, and allows for inconsistency and bias. Standards that promote reporting in probabilistic terms require the analyst to report the strength of the evidence without offering a conclusive interpretation of the evidence. Probabilistic reporting is often based on a likelihood ratio which depends on calibrated probabilities. While probabilistic reporting may be more objective and less open to bias than categorical reporting, the report can be difficult for a lay jury to interpret. These reporting methods may appear disparate, but the relationship between the two is easily understood and visualized by a simple decision theory construct known as the receiver operating characteristic (ROC) curve. Implementing ROC-facilitated reporting through an expanded proficiency testing regime may provide transparency in categorical reporting and potentially obviate some of the lay jury interpretation issues associated with probabilistic reporting.
1 Introduction
In 2009 the National Academies of Science (NAS) issued a report entitled “Strengthening Forensic Science in the United States: A Path Forward”. (National Research Council, 2009). The main finding from the report was that “(w)ith the exception of nuclear DNA analysis, … no forensic method has been rigorously shown to have the capacity to consistently, and with a high degree of certainty, demonstrate a connection between evidence and a specific individual or source.” In 2019, the Honorable Harry T. Edwards assessed progress of the forensic science community as “still facing serious problems” in his address to the Innocence Network Annual Conference. (Edwards, 2019). A significant aspect of the problem was summed up by the tautology that forensic practitioners addressing the NAS committee often didn’t know what they didn’t know. This condition becomes especially problematic when the expert is reporting to the court in categorical terms without reference to, and often without quantitative knowledge of, the strength of the evidence. Categorical reporting provides a multitude of terms that are not clearly defined, don’t convey the strength of the evidence nor support more than one interpretation of the evidence (National Research Council, 2009; Cole and Biedermann, 2019). Without information regarding the strength of the evidence, the court cannot integrate the analyst’s testimony into the overall evidence assessment.
The use of statistical data in forensic science can necessitate a move away from categorical statements to evaluative reporting. Under evaluative reporting the expert reports on the strength of the evidence in probabilistic terms and leaves the court to draw its own conclusions. (Martire et al., 2013; Aitken et al., 2015; Champod et al., 2016; Biedermann et al., 2017). However, the court may find probabilistic testimony difficult to interpret without guidance by the expert. The question is whether judges and jurors can interpret probabilistic reporting. (Brun and Teigen, 1988; De Keijser and Elffers, 2012; Friedman and Turri, 2015; Thompson and Newman, 2015; Hans and Saks, 2018; Eldridge, 2019; Melcher, 2022). A visual representation of decision theory provides a direct association between probabilistic statements, their verbal equivalents, and categorical statements. (Fawcett, 2004; Johnson, 2004; Fawcett, 2006).
2 Two current reporting practices
Reporting in categorical terms requires the analyst to make a decision regarding the interpretation of the evidence. If the question is a classification problem, the analyst must decide upon the class membership of the evidence and report their decision accordingly. If the problem is one of identification, then the binary categorical reporting must assign the questioned and controlled sample as coming from a common source. When reporting is done in categorical terms, the expert’s opinion is often dogmatic and carries no indication of evidentiary strength or analyst uncertainty. The opinion can appear totally subjective and open to bias.
When reporting is done in probabilistic terms, the analyst typically reports the strength of the evidence as a likelihood ratio or the logarithm of the likelihood ratio. The likelihood ratio is typically reported in terms of two competing hypotheses. The report provides information to the court regarding the strength of the evidence relative to the two propositions, but a categorical statement is not provided. The court can then interpret the likelihood ratio, in conjunction with the prior odds of the two propositions to evaluate the posterior odds of the two propositions. This Bayesian approach can be argued to suffer from the need to estimate the prior odds and to arrive at a likelihood ratio from well-calibrated probabilities.
2.1 Reporting examples
As an example of categorical reporting, under the ASTM E1618-19 standard, the analyst must report the sample as positive or negative for the presence of ignitable liquid residue. (Materials, 2019). In the case of comparative glass analysis, for example in a hit-and-run case, ASTM E2927-16e1 requires the analyst to report the evidence in a binary fashion as categorically representing an exclusion (different sources of the questioned and control samples) or an inclusion (same source) (Akmeemana et al., 2021). In both fire debris and glass analysis, recent research has focused on evaluation of the strength of evidence as a likelihood ratio that can lead to probabilistic reporting. (Akmeemana et al., 2021; Sigman et al., 2021; Whitehead et al., 2022). DNA evidence, which was recognized as a forensic gold-standard by the 2009 NAS report, has employed likelihood ratios to communicate the strength of the evidence for some time and advances in reporting continue, as reported in a recent review. (National Research Council, 2009; Meakin et al., 2021).
2.2 Errors, probabilities, and decisions
Various approaches have been proposed for data testing and classification, including hypothesis testing by Fisher (circa 1925) and Neyman and Pearson (circa 1928). (Perezgonzalez, 2015). Fisher’s test involves establishing a null hypothesis (H0), typically that the difference in means between two populations or classes is equal to zero. Once the theoretical distribution is established for H0, the probability or p-value for any new data is calculated under H0 and represents a cumulative probability of the observed result or a more extreme result. Results with a low p-value are taken as evidence against H0 explaining the observed results. The Neyman-Pearson approach specifically considers an alternative hypothesis (HA) that represents a population which exists alongside a different population represented by the main hypothesis (HM). The samples in the population corresponding to HM are typically designated as class 0 and those in the adjacent population as class 1. The two populations exist alongside one another in the sense that they are each distributed over a common parameter or score, however the populations differ by some degree. The difference between populations is known as the effect size and could be as simple as the difference between the means of the two. The smaller the effect size, the more difficult it is to determine the difference between the two populations and to correctly predict a new observation’s membership within each population (i.e., correct classification). Binary classifiers (two classes) classically attempt to minimize the expected classification error, defined as the weighted sum of type I and type II errors (defined below). (Tong et al., 2018). The Neyman-Pearson approach recognizes that in real-world cases these two error types may not be equally important, and it strives to limit the size of the more important (higher priority) error. Class labels can be arbitrarily switched so it is customary in the Neyman-Pearson approach to refer to the prioritized (more important) error as type I. Type I error refers to the conditional probability of mistakenly assigning a ground truth class 0 as belonging to class 1. This type I error is known as a false positive. The conditional probability of assigning a class 1 sample to class 0 is a false negative. For example, in fire debris analysis, samples that don’t contain ignitable liquid residue would constitute class 0. The priority error (to be avoided) is to classify a class 0 sample as class 1 (i.e., containing ignitable liquid residue). The probability of committing a type I error is designated as α and the probability of committing a type II error is designated β. The goal in developing a Neyman-Pearson classification system is to keep α below a defined value (typically 0.05 or less) while also keeping β as small as possible. Data analysis methods that take into account type I and II errors are well-known and widely practiced in the analytical sciences. (Ortiz et al., 2010).
An approach to implementing a Neyman-Pearson classification without requiring assumptions regarding the probability distributions of the populations, is the “umbrella” method of Tong which utilizes receiver operating characteristic (ROC) curves. (Tong et al., 2018). The ROC method was developed by electrical engineers during World War II for the purpose of characterizing the abilities of RADAR operators to discern between targets of concern and noise that distracts from detection of the target. (Calì and Longobardi, 2015). The ROC method is especially useful for binary decisions between two competing propositions. This is often the case in forensic science where the propositions of the prosecution, Hp, and the defense, Hd, often fall within a hierarchy of propositions. (Cook et al., 1998; Evett, 1998; Evett et al., 2000a). The propositions Hp and Hd can be defined such that they correspond to HM and HA, as discussed above. Applying the ROC method requires a ground-truth data set that must be evaluated and ranked relative to the two propositions by a score. Higher scores are associated with stronger evidence in support of a positive target detection, typically represented by Hp in forensic science. The scores are sequentially treated as target-detection thresholds, such that any sample with a score equal or exceeding the threshold is assigned as positive for the target. The score-ranked data can be evaluated to determine the true positive rate (TPR) and false positive rate (FPR) of target detection at each threshold. A plot of TPR as a function of FPR, ordered by score, will produce a ROC curve. (Fawcett, 2004; Johnson, 2004; Fawcett, 2006; Fawcett and Niculescu-Mizil, 2007; Calì and Longobardi, 2015). Each point on the ROC curve represents a decision threshold and projection at a right angle onto the respective axes gives the TPR and FPR statistics.
2.3 Relationship between categorical and probabilistic reporting
The ROC curve has several very useful properties. The curve is independent of the ratio of ground-truth positive and negative samples. It is independent of any parametric assumptions. The slope of a tangent to the curve at any point can be interpreted as a likelihood ratio. (Calì and Longobardi, 2015). This later property of the ROC curve establishes the connection between the strengths of evidence (probabilistically reported as likelihood ratios) and a series of decision thresholds (categorically reported).
The ROC curve is typically plotted in a stepwise fashion; however, when the number of points is large, the curve will appear smooth, see Figure 1. Base 10 loglikelihood ratio (LLR) values were used as scores to create the curve in Figure 1. The scores are labeled along the curve at positions corresponding to TPR and FPR resulting from these LLR values as decision thresholds. In other words, the TPR and FPR rates are related to the strength of evidence required to support a decision in favor of Hp. The two dashed lines have slopes of 10 (long dash) and 0.1 (short dash). The lines are tangents to the ROC curve at scores corresponding to their respective slopes (i.e.,

FIGURE 1. An ROC curve (solid black line) demonstrating the relationship between evidential strength and decision thresholds. The scores that serve as decision thresholds are labeled next to their corresponding open circle symbols on the curve. The scores correspond to LLR values calculated from calibrated probabilities. Two blue dashed lines are drawn tangent to the ROC curve and the slope of the lines correspond to the likelihood ratio for the point where the tangent touches the ROC curve. The tangent line with longer dashes has a slope of 10 and corresponds to the slope of the ROC curve at a score (LLR) of 1 (see the text for additional explanation). The shorter dashed line has a slope of 0.1 and is tangent to the ROC curve at a score (LLR) of −1. The inset diagram shows probability distributions for classes 0 and 1. The vertical “optimal decision threshold” corresponds to a LLR score of 1 and the shaded areas for a and b reflect the FPR and FNR (1-TPR) values where the red dashed lines intersect the corresponding axes. The inset diagram demonstrates the essential aspects of a Neyman-Pearson classifier (see text).
The straight lines drawn tangent to the ROC curve are also known as iso-performance lines. The slope of an iso-performance line is equal to the product of two ratios. The first ratio is the relative prior probabilities of Hd divided by Hp. The second ratio is the relative costs of a false positive assignment divided by the cost of a false negative assignment. All points falling on an iso-performance line share the same expected costs. This property allows for the selection of the optimal decision threshold along the ROC curve. An iso-performance slope is determined based on the known base rates (prior probabilities) and the acceptable cost ratio. Under this method, the optimal decision point is the ROC convex hull (CH) point that lies on the iso-performance line tangent to the curve. The ROC CH is composed of a series of straight segments connecting the outermost points on the curve.
The notations A–F in Figure 1 correspond to LLR ranges for which verbal equivalents have been assigned. (Evett, 1998; Evett et al., 2000b; Aitken et al., 2015). New evidence (e.g., from casework) would be scored by the same method used to evaluate the samples that comprise the ROC curve. The evidential strength of new evidence is easily shown by plotting it onto the ROC curve. For example, the filled diamond plotted on the ROC curve in Figure 1 lies in the region of the curve labeled as “B” and provides moderate support for the prosecution’s hypothesis, Hp.
The ROC curve in Figure 1 is idealized and composed of a few thousand likelihood ratios calculated from calibrated probabilities to demonstrate the direct and highly visual relationship between the concepts underlying categorical and probabilistic reporting. In forensic applications, the number of data points would likely be much smaller. The scores should be numeric values that represent the degree of support for a sample belonging to the positive class. A score might not be a calibrated probability. (Whitehead et al., 2022). The ROC curve could more closely resemble Figure 2. In Figure 2, the ROC curve is shown as the solid black line and plotted in stairstep fashion. The dashed gray line connects the points on the ROC CH. The points on the ROC CH are the only points that qualify as optimal operational points for making categorical decisions. (Fawcett, 2004; 2006). Following the Neyman-Pearson approach, the optimal operational threshold can be selected as a point on the ROC CH where the FPR (α) is less than a defined criteria (i.e., α ≤ 0.05). Each segment of the ROC CH represents an iso-performance line on the ROC plot. (Fawcett, 2006). The slope of each segment of the ROC CH is labeled next to the segment in Figure 2. Note that “Inf” is used to note a slope approaching infinity, which is the limit of a positive change in TPR as the change in FPR approaches 0 from the positive side, as required due to the ROC curve existing in the first quadrant (FPR = [0,1], TPR = [0,1]). The slope of a ROC CH where the denominator was equal to 0 is mathematically undefined, and the slope of this ROC CH segment may only be considered in the limit. The probability of Hp given the evidence for scores covered by the ROC CH segment is calculated by Eq. 1, using the slope of the CH segment and the skew. The skew is the ratio of true-Hp to true-Hd case in the training set. (Fawcett and Niculescu-Mizil, 2007).
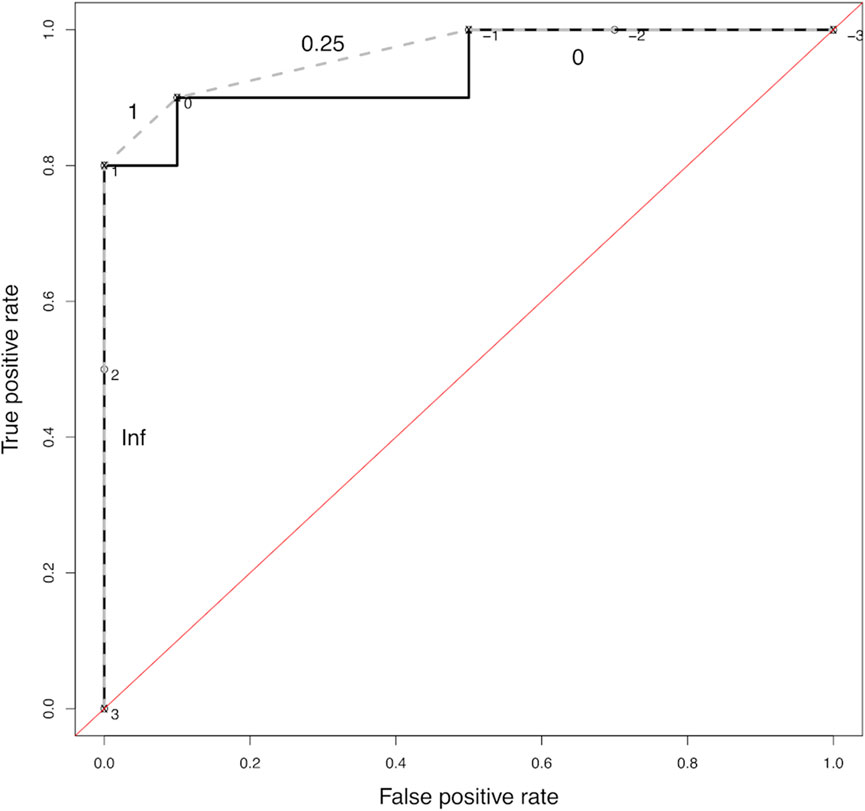
FIGURE 2. An ROC curve (solid black line) comprised of a small number of loglikelihood-like scores (20 scores). The curve is plotted in a stepwise fashion and the scores are placed adjacent to open circle symbols. The dashed gray line connects the points comprising the ROC convex hull (CH). The slope of each segment of the ROC CH is plotted adjacent to the curve. The “Inf” label corresponds to the limiting slope of the ROC CH between scores 3 and 1. The slope of each segment of the ROC CH can be combined with the skew in the data used to generate the curve to calculate the PAV-equivalent probabilities P (Hp|E) using Eq 1 (see text for more details).
In Figure 2,
2.4 Implementing the methodology
Implementing the methodology described here requires a set of ground truth samples to evaluate following an established protocol and utilizing an accepted scoring method. Each analyst must evaluate a number of ground truth samples and use their assigned scores to generate an ROC curve. The scores should be loglikelihood-like and larger values should represent stronger support for Hp (class 1). (Morrison, 2013). The scores can be obtained, for example, from machine learning, instrumental measurements, or subjective opinions representing an expected probability of membership in class 1. (Jøsang, 2016; Tong et al., 2018; Sigman et al., 2021). The number of samples to analyze should be determined within the organization and with the assistance of forensic statisticians. An example of the approach has been demonstrated in fire debris analysis with each of three analysts evaluating 20 ground truth samples each. (Whitehead et al., 2022). The samples must be presented to the analyst as blind or double-blind tests. This could be viewed as an extension of current proficiency exam requirements. After the development of an ROC curve by an analyst, an optimal decision threshold my be established if reporting in categorical terms is required. Casework samples must be analyzed and scored following the same protocols used to develop the ROC curve. The score obtained for the casework sample allows the determination of a PAV calibrated probability based on the covering segment of the ROCCH. Categorical reporting for the case sample would be dictated by the optimal decision threshold. The entire process is easily understood and highly visual.
3 Discussion and conclusion
The relationship between decision-making and evidential strength has been demonstrated. The relationship is based on well-known and practiced engineering methods that provide a highly visual representation of the relationship. Applying these methods in forensic science could provide transparency to categorical reporting and potentially obviate some of the challenges faced by juries when trying to understand and interpret evidential strength and likelihood ratios. The ROC method provides a simple path to obtaining pooled-adjacent-violators (PAV) calibrated probabilities, which are required in forensic science. A decision threshold on an ROC curve defines the TPR and FPR rates for the method. In addition, the ROC curve provides a visualization of the trade-off between the TPR and FPR as the decision threshold is changed.
Data availability statement
The original contributions presented in the study are included in the article/supplementary material, further inquiries can be directed to the corresponding author.
Author contributions
MS: conceptualization, methodology, writing–original draft, review and editing, supervision, project administration, funding acquisition, resources. MW: conceptualization, methodology, writing—review and editing, supervision, funding acquisition, resources.
Funding
This research was supported by the National Center for Forensic Science, a Florida SUS recognized research center at the University of Central Florida.
Conflict of interest
The authors declare that the research was conducted in the absence of any commercial or financial relationships that could be construed as a potential conflict of interest.
Publisher’s note
All claims expressed in this article are solely those of the authors and do not necessarily represent those of their affiliated organizations, or those of the publisher, the editors and the reviewers. Any product that may be evaluated in this article, or claim that may be made by its manufacturer, is not guaranteed or endorsed by the publisher.
References
Aitken, C., Barrett, A., Berger, C., Biedermann, A., Champod, C., Hicks, T., et al. ENFSI guideline for evaluative reporting in forensic science (2015).
Akmeemana, A., Weis, P., Corzo, R., Ramos, D., Zoon, P., Trejos, T., et al. Interpretation of chemical data from glass analysis for forensic purposes. J. Chemom. (2021) 35(1):e3267. doi:10.1002/cem.3267
Biedermann, A., Champod, C., and Willis, S. Development of European standards for evaluative reporting in forensic science: The gap between intentions and perceptions. Int. J. Evid. Proof (2017) 21(1-2):14–29. doi:10.1177/1365712716674796
Brun, W., and Teigen, K. H. Verbal probabilities: Ambiguous, context-dependent, or both? Organ. Behav. Hum. Decis. Process. (1988) 41(3):390–404. doi:10.1016/0749-5978(88)90036-2
Calì, C., and Longobardi, M. Some mathematical properties of the ROC curve and their applications. Ric. Mat. (2015) 64(2):391–402. doi:10.1007/s11587-015-0246-8
Champod, C., Biedermann, A., Vuille, J., Willis, S., and De Kinder, J. ENFSI guideline for evaluative reporting in forensic science: A primer for legal practitioners. Crim. Law Justice Wkly. (2016) 180(10):189–193.
Cole, S. A., and Biedermann, A. How can a forensic result Be a decision: A critical analysis of ongoing reforms of forensic reporting formats for federal examiners. Hous. L. Rev. (2019) 57:551.
Cook, R., Evett, I. W., Jackson, G., Jones, P., and Lambert, J. A hierarchy of propositions: Deciding which level to address in casework. Sci. Justice (1998) 38(4):231–239. doi:10.1016/s1355-0306(98)72117-3
De Keijser, J., and Elffers, H. Understanding of forensic expert reports by judges, defense lawyers and forensic professionals. Psychol. Crime Law (2012) 18(2):191–207. doi:10.1080/10683161003736744
Edwards, H. T. Ten years after the national academy of sciences’ landmark report on strengthening forensic science in the United States: A path forward–where are we? In: NYU school of law, public law research paper (19-23). New York, NY: New York University School of Law (2019).
Eldridge, H. Juror comprehension of forensic expert testimony: A literature review and gap analysis. Forensic Sci. Int. Synergy (2019) 1:24–34. doi:10.1016/j.fsisyn.2019.03.001
Evett, I. W., Jackson, G., and Lambert, J. More on the hierarchy of propositions: Exploring the distinction between explanations and propositions. Sci. justice J. Forensic Sci. Soc. (2000a) 40(1):3–10. doi:10.1016/S1355-0306(00)71926-5
Evett, I. W., Jackson, G., Lambert, J., and McCrossan, S. The impact of the principles of evidence interpretation on the structure and content of statements. Sci. justice J. Forensic Sci. Soc. (2000b) 40(4):233–239. doi:10.1016/S1355-0306(00)71993-9
Evett, I. W. Towards a uniform framework for reporting opinions in forensic science casework. Sci. Justice (1998) 3(38):198–202. doi:10.1016/s1355-0306(98)72105-7
Fawcett, T., and Niculescu-Mizil, A. PAV and the ROC convex hull. Mach. Learn. (2007) 68(1):97–106. doi:10.1007/s10994-007-5011-0
Fawcett, T. ROC graphs: Notes and practical considerations for researchers. Mach. Learn. (2004) 31(1):1–38.
Fawcett, T. An introduction to ROC analysis. Pattern Recognit. Lett. (2006) 27(8):861–874. doi:10.1016/j.patrec.2005.10.010
Friedman, O., and Turri, J. Is probabilistic evidence a source of knowledge? Cognitive Sci. (2015) 39(5):1062–1080. doi:10.1111/cogs.12182
Hans, V. P., and Saks, M. J. Improving judge and jury evaluation of scientific evidence. Daedalus (2018) 147(4):164–180. doi:10.1162/daed_a_00527
Johnson, N. P. Advantages to transforming the receiver operating characteristic (ROC) curve into likelihood ratio co-ordinates. Statistics Med. (2004) 23(14):2257–2266. doi:10.1002/sim.1835
Martire, K. A., Kemp, R. I., Watkins, I., Sayle, M. A., and Newell, B. R. The expression and interpretation of uncertain forensic science evidence: Verbal equivalence, evidence strength, and the weak evidence effect. Law Hum. Behav. (2013) 37(3):197–207. doi:10.1037/lhb0000027
Materials, A. S. f. T. a. Astm E1618–19: Standard test method for ignitable liquid residues in extracts from fire debris samples by gas chromatography-mass spectrometry. Conshohocken, PA, USA: ASTM International West (2019).
Meakin, G. E., Kokshoorn, B., van Oorschot, R. A., and Szkuta, B. Evaluating forensic DNA evidence: Connecting the dots. Wiley Interdiscip. Rev. Forensic Sci. (2021) 3(4):e1404. doi:10.1002/wfs2.1404
Melcher, C. C. Uncovering the secrets of statistics as evidence in business valuations. Ct. Rev. (2022) 58:68.
Morrison, G. S. Tutorial on logistic-regression calibration and fusion: Converting a score to a likelihood ratio. Aust. J. Forensic Sci. (2013) 45(2):173–197. doi:10.1080/00450618.2012.733025
National Research Council. Strengthening forensic science in the United States: A path forward. Washington, DC: National Academies Press (2009).
Ortiz, M., Sarabia, L., and Sánchez, M. Tutorial on evaluation of type I and type II errors in chemical analyses: From the analytical detection to authentication of products and process control. Anal. Chim. Acta (2010) 674(2):123–142. doi:10.1016/j.aca.2010.06.026
Perezgonzalez, J. D. Fisher, neyman-pearson or nhst? A tutorial for teaching data testing. Front. Psychol. (2015) 6:223. doi:10.3389/fpsyg.2015.00223
Sigman, M. E., Williams, M. R., Thurn, N., and Wood, T. Validation of ground truth fire debris classification by supervised machine learning. Forensic Chem. (2021) 26:100358. doi:10.1016/j.forc.2021.100358
Thompson, W. C., and Newman, E. J. Lay understanding of forensic statistics: Evaluation of random match probabilities, likelihood ratios, and verbal equivalents. Law Hum. Behav. (2015) 39(4):332–349. doi:10.1037/lhb0000134
Tong, X., Feng, Y., and Li, J. J. Neyman-Pearson classification algorithms and NP receiver operating characteristics. Sci. Adv. (2018) 4(2):eaao1659. doi:10.1126/sciadv.aao1659
Keywords: Decision Theory, receiver operating characteristics, categorical reporting, evaluative reporting, probabilistic reporting, forensic science, transparency in reporting
Citation: Sigman ME and Williams MR (2023) Promoting transparency in forensic science by integrating categorical and evaluative reporting through decision theory. Front. Anal. Sci. 3:1105642. doi: 10.3389/frans.2023.1105642
Received: 22 November 2022; Accepted: 23 January 2023;
Published: 07 February 2023.
Edited by:
Maurice Aalders, University of Amsterdam, NetherlandsReviewed by:
Luis Sarabia, University of Burgos, SpainCopyright © 2023 Sigman and Williams. This is an open-access article distributed under the terms of the Creative Commons Attribution License (CC BY). The use, distribution or reproduction in other forums is permitted, provided the original author(s) and the copyright owner(s) are credited and that the original publication in this journal is cited, in accordance with accepted academic practice. No use, distribution or reproduction is permitted which does not comply with these terms.
*Correspondence: Michael E. Sigman, bWljaGFlbC5zaWdtYW5AdWNmLmVkdQ==