
95% of researchers rate our articles as excellent or good
Learn more about the work of our research integrity team to safeguard the quality of each article we publish.
Find out more
ORIGINAL RESEARCH article
Front. Anal. Sci. , 22 February 2023
Sec. Pharmaceutical analysis
Volume 3 - 2023 | https://doi.org/10.3389/frans.2023.1066348
 Jacques Mbuyi Kaluka Tshibamba1†
 Jocelyn Mankulu Kakumba2*†
 Timothy Mavanga Mabaya3Roland Marini Djang’ieng’a4Jérémie Mbinze Kindenge2
Livestock breeding plays a key role in sub-Saharan Africa because it is an important source of highly valued protein in the human diet, and because it is an essential driver for socio-economic development. It represents a form of investment and is also important from a socio-cultural point of view (ceremonies, social position, etc.). Livestock is an important source of income, livelihood, nutrition, and food security. However, livestock breeding faces, among other things, major sanitary constraints. Furthermore, the circulation of non-compliant antibiotics on the market constitutes a major threat to animal health, public health, and the environment. This research aims to develop and validate a UV-vis method for quantifying pharmaceutical oxytetracycline. The method developed was validated following the total error strategy as a decision tool in the accuracy profile. After its completion, the method demonstrated good absolute and relative bias and was within a tolerable interval of [−2%, +2%]. The method was also repeatable with intermediate precision, with respectively lower values than 2% and 4%. We also assessed the recovery and accuracy of the method as fitting with the specification limits. After its validation, the method was quantified in 47 oxytetracycline injectable samples, where we obtained 28 samples complying with specifications and 19 that did not. That led us to conclude that the developed method was validated and appropriate for quantification in terms of the routine quality control of oxytetracycline injection. The method needs to be reviewed and revalidated accordingly for other pharmaceutical presentations.
In sub-Saharan Africa, breeding plays a key role because it is an important source of highly valued protein in the human diet, and also because it is an essential driver for socio-economic development in view of its multiple roles (Zongo, 2014). It represents a form of investment and is also important from a socio-cultural point of view (ceremonies, social position, etc.). Livestock is an important source of income, livelihoods, nutrition, and food security (Herrero et al., 2014; World Bank, 2016).
Approximately one billion people in South Asia and sub-Saharan Africa living on less than $2 per day raise animals (Herrero et al., 2014). However, this breeding is confronted, among other things, with major sanitary constraints which limit its effectiveness. Major epizootics in these regions include foot-and-mouth disease, contagious bovine pleuropneumonia, bovine and ovine pasteurellosis, symptomatic anthrax, bovine lumpy skin disease, gastrointestinal parasitosis, and haemoparasitosis, including trypanosomiasis (Kane, 2008). According to the World Organization for Animal Health (OIE), approximately 90% of livestock and poultry diseases on its list are present in Africa (OIE, 2008).
Experts in the sector thus believe that the development of livestock farming in Africa requires the intervention of veterinary programs to protect and fight against the various animal diseases, based on vaccination, treatment, and other prophylactic methods through an effective animal health policy based largely on the use of quality veterinary drugs (Kane, 2008; OIE, 2008). The use of drugs for veterinary use, in particular antibiotics for prophylaxis, metaphylaxis, and therapeutic treatments, has greatly encouraged the intensification of animal production in recent decades (OIE, 2016; Abdouel, 2019). However, some breeders have criticized the quality of veterinary medicines available on the market, arguing that certain medicines, particularly veterinary antibiotics, are less effective or are ineffective, and lead to a residual presence in foodstuffs of animal origin and to the development and transmission of antibiotic resistance from animals to humans (AFSSA, 2006; OIE, 2016; Dognon, 2018).
Studies carried out in Senegal, Benin, Cameroon, Rwanda, Mali, and other West African countries have revealed the circulation of counterfeit veterinary medicines, sub-standard products, and products that would not pass authorization (Teko-agbo, 2008). However, data on the quality of drugs consumed in the animal sector are not very precise or are even non-existent in certain African countries, such as the Democratic Republic of Congo (DRC) (Essene, 2009; Ernesto, 2020; Okombe, 2017; Dognon, 2018).
Since medicinal products for veterinary use are one of the essential tools for safeguarding both public and animal health, it is vital to ensure that these products have a high level of quality, safety, and efficacy (Goose, 2010). This study, therefore, aims to contribute to the physicochemical quality of injectable oxytetracycline for veterinary use marketed in Kinshasa by developing a UV-vis spectrometric method for its quantification. A developed analytical method within well-defined limits will validate the reliability of results (Bipon, 2008; Swiss Accreditation Service, 2017; French Association for Standardization (AFNOR), 2017; International Organization for Standardization, 2017).
We performed spectrophotometric analysis using a GENESYS 10S UV-vis brand single-beam UV-visible spectrometer (Series: 2M1N299002, with a xenon lamp), an Agilent 8453 brand double-beam UV-visible spectrophotometer (2140-0605, with deuterium lamp), and a 1 cm-wide quartz cell. The analytical balance we used for weighing was Gram FV-220C (IPESAGE S.A.S, France). A HANNA brand HI 9126 pH meter was used.
The following chemicals were used as reagents to perform this method: concentrated hydrochloric acid (37%) for analysis of brand univ AR® (SAAR3063054LCA), concentrated sulfuric acid (98%) for analysis from Merck (CAS 7664-93-9/112080), oxytetracycline RS (96%) from VWR Chemicals (CAS 2058-46-0/6153-64-6), and distilled water from the Medicines and Foodstuffs Quality Control Laboratory (LACOMEDA) of the Faculty of Pharmaceutical Sciences of the University of Kinshasa.
The instrumental analysis technique selected for this study was UV-visible spectrophotometry because of its availability in the DRC, its ease of use, the reliability of its results, and the availability of reagents.
We determined the targeted wavelength (268 nm) by scanning a reference solution in the targeted concentration (5 μg/ml) with the DAD and prepared sample solutions at different levels of concentration.
The purpose of method validation is to provide laboratories and competent authorities with sufficient guarantees for each measurement that will subsequently be carried out routinely. Once validated, the method should afford results that will be sufficiently close to the unknown “true value” of the sample or at least within an acceptable limit, depending on the purpose of the procedure (Swiss Accreditation Service, 2017; French Association for Standardization (AFNOR), 2017; International Organization for Standardization, 2017).
The analyte was subjected to identification before the preparation of standards and quantification of the collected samples. This was done by spectrophotometry UV-vis by comparing the oxytetracycline spectrum either for raw material, dedicated for standards preparation, or for samples to the spectrum obtained with the reference oxytetracycline.
Both reference and sample were prepared by dissolving an appropriate quantity of the pharmaceutically active ingredient in aqueous hydrochloride solution 0.1 N. The spectra measurements were performed at a maximum wavelength of 268 nm (by Clarck, 4th edition). To reach a conclusion about the identity between the reference and the sample, both their UV spectra should be stackable; this was the case with ours.
The stock solution was prepared by dissolving, in a 200 mL volumetric flask, 50 mg of oxytetracycline RS powder in 50 mL of 0.01 N HCl; we then brought to volume with the same solvent to have the stock solution concentrated to 250 μg/mL.
From this stock solution, we took three volumes respectively of 1, 3, and 5 mL, which were placed into three 50 mL volumetric flasks. We then brought to volume with 0.01 N HCl to obtain calibration standards of 5, 15, and 25 μg/ml of oxytetracycline.
Independent stock solutions were prepared in the same way as those of the calibration standards, but this time in the matrix (sodium hydroxy methane sulfinate, magnesium oxide, povidone, methyl-1 pyrrolidone, and water for injection). They were successively diluted with 0.01 N HCl to obtain daughter solutions.
This was prepared using a hydrochloride acidic solution at 0.01 N without adding other components.
For each sample, we took a volume of solution containing 50 mg of oxytetracycline powder (pharmaceutical active ingredient) placed in a 200 mL volumetric flask and brought to volume with 0.01 N HCl to obtain solution A (solution A = 0.25 mg/mL). Then from this Solution A, we took 1 mL that we placed in a 50 mL volumetric flask and brought to volume with 0.01 N HCl to obtain the final solution of 5 μg/mL.
All the studied dosage forms were selected based on their composition in active pharmaceutical ingredients on one hand and excipients on the other. Hence, the commonly-used matrix for analyzed samples was described above and the formulation made as follows:
⁃ Dissolve the magnesium oxide and methyl-1 pyrrolidone in the povidone (a).
⁃ Dissolve the sodium hydroxy methane sulfinate in the obtained Solution A to produce I.
⁃ Stir Solution I until the complete dissolution of components.
⁃ Incorporate Solution I under shaking in a quantity of sufficient water for injection to dissolve all components within the solution to produce Mixture B.
⁃ Measure the pH which is to be comprised between 5 and 5.5 before completing the water injection to fill the required volume.
⁃ Filtration of Mixture B on 0.22 μm filter paper under vacuum, using Buchner funnel.
⁃ Filling the sterilized vials with sufficient oxytetracycline volume.
Note that all the formulation steps were conducted under UV light conditions and the tested dosage forms were currently dosed at 20% for 45 oxytetracycline injectable samples and 5% for two oxytetracycline injectable samples.
The following conditions were determined for the analysis of oxytetracycline using a UV spectrophotometer: 0.01 N hydrochloric acid as the dissolution solvent; 268 nm as the working wavelength; 5 μg/ml as the target concentration (after three repeated measurements with precision and specificity to the analyte) and a blank which constituted 0.01 N hydrochloric acid.
In this research, we defined the calibration range from 5 to 25 μg/ml. Over this interval, we evaluated the different validation criteria of the analytical methods. These criteria focused on accuracy, precision in terms of repeatability and inter-series precision, measurement uncertainty, accuracy profile, and linearity (using a range of concentrations with five points). The validation was carried out at three concentration levels, with three repetitions for 3 days.
For the first studied criterion of the validation, we assessed the specificity/selectivity of the developed method by scanning both the standard calibration and the standard of validation solutions prepared at the target concentration level with different wavelengths using the DAD. This was to determine, within the interval of between 200nm and 400 nm, what the maximal absorption wavelength would be when only the analyte could absorb UV. The matrix effect was then suppressed from the whole solution to avoid its impact during measurements. The specific wavelength was established at 268 nm for selective determination without the detection of impurities, matrix, or degradation products.
Based on ICH guidelines Q2, we assessed the interference influence using the matrix components. The validation standard was scanned within the wavelength 200–400 nm and no excipient was absorbed at the targeted wavelength (268 nm). Some of the components showed a significant absorption over the target. Povidone was absorbed at 365 nm, but sodium hydroxy methane sulfinate, magnesium oxide, and methyl-1 pyrrolidone did not show significant absorption. After scanning, all excipients’ influence was suppressed to perform analysis at the analyte's maximal absorption wavelength.
Table 1 illustrates the results of calculated bias at the different concentration levels. Based on these results, we found that the absolute bias at all levels was between −0.0066 and +0.0313, and the relative bias (%) was between −0.0333 and +0.2888. As these results were within specified limits included in the [-2%, +2%] interval, we concluded that the estimated bias at each level of concentration was acceptable.
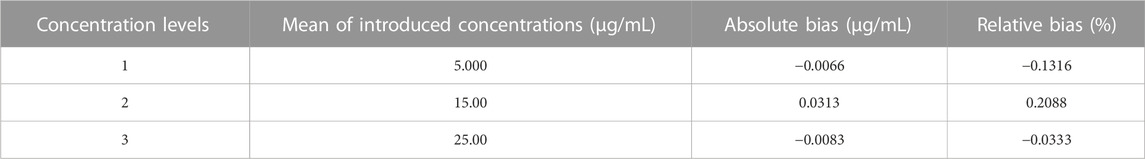
TABLE 1. Absolute and relative bias.
The acceptance limits for the relative bias are ±2% for a drug product assay (International Organization for Standardization, 2017).
Table 2 shows that the recovery rate (%) is 98.09–101.7 using the 95%–105% confidence interval.
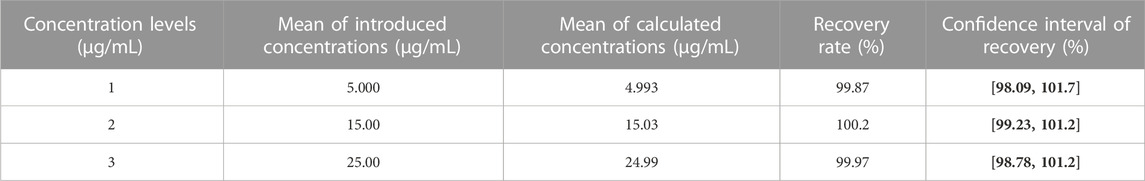
TABLE 2. Recovery rate.
Thus, by observing the results of Tables 1 and 2, we can determine that the developed oxytetracycline assay method is true and can give appropriate results at the proposed concentration levels.
Table 3 groups the method’s precision results in terms of repeatability and intermediate precision. This was assessed by determining the three replicates of the three sample solutions obtained separately at different levels of concentration. Their preparations were made to be close so that the repeatability was constant across the concentration range. The acceptance limits for the relative bias are ±2% for a drug product assay (International Organization for Standardization, 2017; USP XL, 2020). The intermediate precision was also studied to evaluate the effect of random events on the method precision. For this purpose, we considered additional parameters such as performing analysis on different days, the use of a secondary UV-spectrophotometer different from the first, and the method used by different analysts. Additionally, the intermediate precision afforded acceptable values, comprised within [-3%, +3%] as required for the drug product assay (USP XL, 2020).
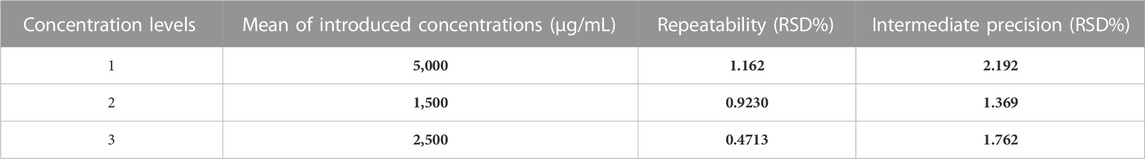
TABLE 3. Precision in terms of repeatability RSD (% and intermediate precision RSD (%).
The relative standard deviation for the repeatability at the different concentration levels was between 0.471 and 1.162. We found that, at all concentration levels, the repeatability RSD was less than 2% (International Organization for Standardization, 2017). This reflects the low intra-day dispersion of the results obtained.
Moreover, the RSD for intermediate precision at the different levels was between 1.762 and 2.192 at all concentration levels, and the intermediate precision RSD was less than 3% (International Organization for Standardization, 2017).
Observing these results, we can therefore determine that the method is acceptable in the dosage range of 5–25 μg/ml according to the precision criterion.
According to the general approach, uncertainty evaluation requires estimating the random and systematic errors of the method. This should provide estimates of the within- and between-lab components of variance combined with an estimate of uncertainty coupled with the method trueness (Bratinova et al., 2009). Therefore, in this research, we determined random error separately using within-laboratory reproducibility and systematic error, and then calculated the uncertainty following the formula given in the literature.
Table 4 presents the results of the measurement uncertainty calculation. The uncertainty of a measurement, is broadly defined, as the area within which the true value is likely to lie. The relative expanded uncertainties (%) observed at the different concentration levels are between +3.041 and +4.961. We found that, at all concentration levels, the relative expanded uncertainty was less than 5% (International Organization for Standardization, 2017).
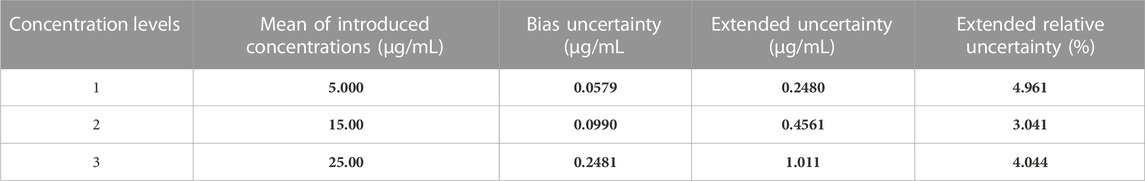
TABLE 4. Uncertainty evaluation.
As presented in the Figure 1 and Table 5, the method accuracy profile was etablished on three concentration levels. This criterion allowed us to assess the difference between each individual result and the accepted reference value from both the random and systematic errors. The calculated results used for calculating beta tolerance were first multiplied by an appropriate factor and then utilized for accuracy determination, as given in the following table.
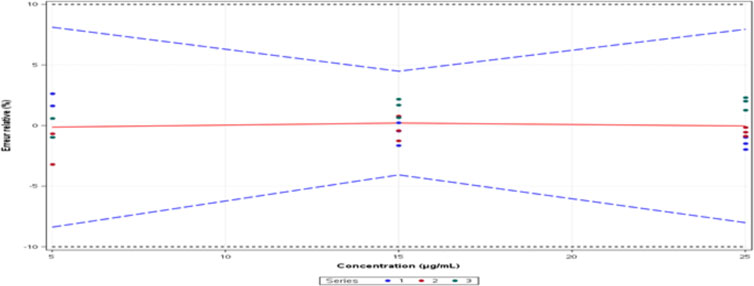
FIGURE 1. Accuracy profile of the developed method.
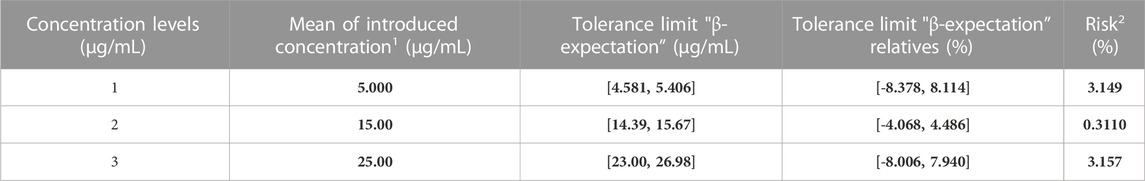
TABLE 5. Method accuracy expressed using beta-tolerance.
The method accuracy was assessed by determining the recovery using well-known analyte concentrations in an appropriate matrix. As we developed a UV-vis method, the assay results obtained were compared with those from an established analytical method for more certainty. For drug product assay, the acceptance criteria are fixed between 95.0% and 105.0% (USP XL, 2020).
The β tolerance intervals were located within the acceptance limits, referring to the linear regression model, the risks of having measurements outside the acceptance limits observed at the different concentration levels were between +0.3110 and +3.157. The literature indicates that the risk that the β tolerance intervals are outside the acceptance limits should not exceed 5% (International Organization for Standardization, 2017).
We found that the risk is less than 5% at all levels of concentration; thus, the developed method is accurate and fits analytical determination at all levels of concentration.
Figure 2 shows the linearity curve of the oxytetracycline assay method by UV-Visible.
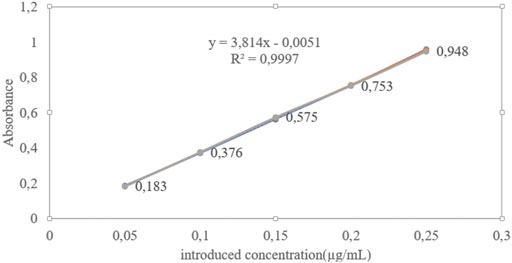
FIGURE 2. Developed method linearity.
In Figure 2, we observe that the determination coefficient (R2) of the developed method is equal to 0.9997. This value is close to the values determined by Prasad (2010), Sebayim and hasson (2019), and Naumoska et al. (20122)—0.9994, 0.9999, and 1, respectively.
Linearity is proven when R2 is greater than 0.99 (International Organization for Standardization, 2017); thus the linearity of our method is proven.
For a better appreciation of this linearity, we used the linearity profile based on the tolerance interval and acceptance limits shown in Figure 3.
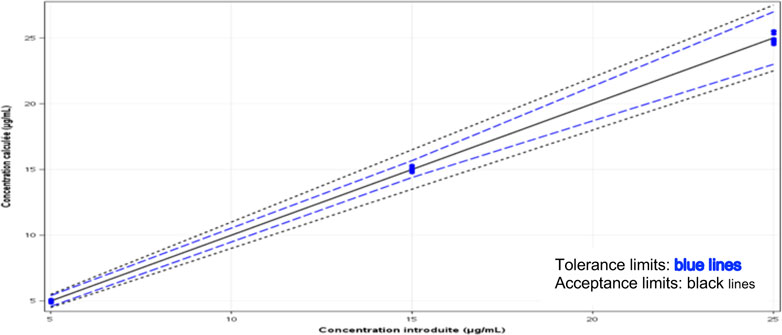
FIGURE 3. The developed method linearity profile.
As can be seen in Figure 3, which presents the linearity profile of the method, the tolerated interval represented by the broken blue lines is inside the acceptance limits defined by the black dotted lines; thus, the linearity of this method is proven.
The validated method was then successfully applied to 47 samples, divided into three doses (50 mg/ml, 100 mg/ml, and 200 mg/ml), 18 batches which were manufactured by eight pharmaceutical companies in five countries.
All the results were calculated following the Beer-Lambert law to express the analyte concentration thus:
where A is the analyte absorbance,
The assay was performed with UV-visible spectrophotometry. However, this method requires precise dilutions and a good cleaning of the cuvette, as well as avoiding any pipetting error. For this study, the acceptable content of oxytetracycline should be between 90% and 110% (Naumoska et al., 2012). Based on these limits, out of the 47 samples analyzed (Table 6), 28 samples were compliant (i.e. 59.57%) against 19 samples non-compliant (i.e. 40.43%).

TABLE 6. Analytical results of 47 monitored samples.
The cases of non-compliance observed after the determination of the active ingredient using the developed and validated method were under-dosing (18 samples, i.e. 38.3%) and over-dosing (01 sample, i.e. 2.13%).
Studies carried out on the quality control of injectable oxytetracycline for veterinary use in Mali revealed a non-compliance rate of 41.86% (15.38% of these non-compliant samples presented a low content of active ingredient) for N'DONG et al. and 10.83% for DICKO Sako A.A., while that carried out in Niamey in Niger on the quality control of antibiotics by Amadou et al. showed a non-compliance rate (under dosage) of 14.28% (Dicko, 2010; USP, 2019).
The objective of this study was to develop and validate a simple method to analyze oxytetracycline used in veterinary medicine in the treatment of microbial diseases of the pulmonary, digestive and genitourinary systems such as pasteurellosis, contagious bovine pleuropneumonia, brucellosis, rickettsioses, in prophylaxis, after local treatment of wounds, and with withers’ disease or foot rot.
The non-separating technique of UV-visible spectrophotometry was chosen in this study due to its accessibility in most quality control laboratories in developing countries.
The obtained results show that the developed method has good reliability (precision, trueness, accuracy, and linearity) in the studied working area.
The validated method was successfully applied to control the quality of 47 samples marketed in Kinshasa. We found that 19 samples were non-compliant (i.e., 40.43%). This situation confirms the problem of the circulation of low-quality veterinary drugs in the city of Kinshasa and in the DRC. This circulation of non-compliant antibiotics on the market constitutes a major threat to animal health, public health, and the environment. These non-compliant antibiotics can slow the normal treatment of an infection, prolong illness, increase mortality, and promote the spread of pathogens, including resistant agents. They do not guarantee the cure of the ailments from which the treated animals suffer. In addition, foodstuffs from these animals can have deleterious effects on consumer health.
The original contributions presented in the study are included in the article/supplementary material; further inquiries can be directed to the corresponding author.
JKT: design, samples collection and application. JK: method development, application, data collection, and paper writing. TM: sample collection, application, and data collection. RD: method validation, data processing, and paper review. JK: statistical analysis of data, method processing, data interpretation, and paper review.
The authors declare that the research was conducted in the absence of any commercial or financial relationships that could be construed as a potential conflict of interest.
All claims expressed in this article are solely those of the authors and do not necessarily represent those of their affiliated organizations, or those of the publisher, the editors, and the reviewers. Any product that may be evaluated in this article, or claim that may be made by its manufacturer, is not guaranteed or endorsed by the publisher.
Abdouel, F. Use of antibiotics in poultry farming and bacterial resistance and its impact on human health. Morocco: Mohammed V University of Rabat (2019).
AFSSA. Veterinary uses of antibiotics, bacterial resistance and consequences for human health (2006). Available at: https://www.who.int/news-room/fact-sheets/detail/antibiotic-resistance#:∼:text=Bacteria%2C%20not%20humans%20or%20animals,hospital%20stays%2C%20and%20increased%20mortality.232
Bipon. Evaluation of measurement data-guide for expression to measurement uncertainty, JCGM 100 (2008). Onlineavailable at: https//www.bipon.org/fr/publications/guides/gum.html (Accessed 09 27, 2020).
Bratinova, S., Raffael, B., and Simoneau, C. Guidelines for performance criteria and validation procedures of analytical methods used in controls of food contact materials. First edition. JRC Scientific and Technical Reports (2009).
Dicko, S. A. A. The quality in 2009 of injectable oxytetracyclines for veterinary use available in Mali. Mali: University of BAMAKO (2010).
Dognon, S. R. (2018). Quality of veterinary antibiotics used in West Africa and methods for detecting their residues in foodstuffs. J. Animal Plant Sci. 36 2. 5858–5877.
Ernesto, P.et al. (2020). Antimicrobial resistance in veterinary medicine: An overview. Int. J. Mol. Sci. 21(6).
Essene, H. Functioning and difficulties of the supply chain of veterinary inputs and services in the savannahs of Central Africa (2009). available at: https://www.hal.cirad.fr%3ecirad-00470998%3edocument (Accessed 03 18, 2021).
French Association for Standardization (AFNOR). NF EN/ISO/CE/17025, General requirements concerning the skills of calibration and test laboratories. France: ISO (2017).
Goose. Medicines and vaccines for veterinary use: Essential tools for any effective animal health and welfare policy. In: World Conference (Paris: IEEE) (2010).
Herrero, M., Havlik, P., Mclntire, J., and Palazzo, A. The future of african livestock: Realizing the potential of livestock for food security. In: Poverty alleviation and environmental protection in sub-saharan Africa. Geneva, Switzerland: UNSIC (2014). p. 118.
International Organization for Standardization (2017). ISO/IEC 17025: General requirements for the competence of testing and calibration laboratories: Chapter: Test and calibration methods and method validation. ISO Online browsing platform: ISO.
Kane, M. Registration, control and harmonization of legislation on medicines for veterinary use in West Africa. In: Proceedings of the OIE Conference on Veterinary Medicines in Africa: Harmonization and Improvement of Registration, Distribution and Quality Control; March 25 to 27. Dakar-Senegal: EISMV (2008).
Naumoska, M., Dimitrieska-Stojkovij, E., and Stojkovic, G. Comparison of spectrophotometric and Complexometric-spectrophotometric assay for determination of oxytetracycline in veterinary drugs (2012). Online Available at https//www.researchgate.net/publications/258696807 (Accessed 11 27, 2021).
OIE. Annual report on the use of antimicrobial agents in animals. Paris: better understanding the global situation (2016). p. 70.
OIE. Harmonization and improvement of the registration, distribution and quality control of veterinary medicinal products in Africa (2008). Online Available at http:/www.oie.int (Accessed 09 20, 2020).
Okombe, E. V. Detection of antibiotic residues in foodstuffs of animal origin marketed in LUBUMBASHI in the Democratic Republic of Congo. Afr. Agron. (2017) 29(3):207–216.
Prasad, A. R. G. Spectrophotometric methods for the microdetermination of oxytetracycline and hostacycline. Sci. world J. (2010) 5. doi:10.4314/swj.v5i1.61477
Sebayim, M., and Hasson, N. S. Developing a highly validated and sensitive HPLC method for simultaneous estimation of oxytetracycline, tinidazole and esomoprazole in their dosage forms. Austin Janal Pharm. Chem. (2019) 6(1):06.
Swiss Accreditation Service. Guide for the validation of chemical-physical test methods and the evaluation of measurement uncertainty (2017). available at https://www.unodc.org/documents/scientific/validation_E.pdf.
Teko-agbo, A. Quality of veterinary drugs in circulation in Cameroon and Senegal. In: Proceedings of the OIE Conference on Veterinary Medicines in Africa: Harmonization and Improvement of Registration, Distribution and Quality Control; March 25 to 27; Dakar (2008).
USP XL. Physical tests, ultraviolet-visible spectroscopy (2020). Available at: https://www.dynalenelabs.com/testing-services/chemical-testing/uv-vis-ultraviolet-visible-spectroscopy/#:∼:text=How%20UV%2DVis%20works,range%20of%20wavelengths%20is%20measured.
World Bank. Investing in the livestock sector: The importance of hard numbers. World Bank. Rep. (2016) 154:1.
Zongo, A. Collection and analysis of the quality of trypanocides commonly used in West Africa in the treatment of African Animal Trypanosomoses (2014). Online Available at: https://www.Beep.ird.fr>index>asso>IDR-2014-ZON-Col (Accessed 02 20, 2021).
Keywords: development, validation, spectrophotometry, quality control, oxytetracycline
Citation: Kaluka Tshibamba JM, Kakumba JM, Mabaya TM, Djang’ieng’a RM and Kindenge JM (2023) Development and validation of an ultraviolet-visible spectrophotometric method for quantifying oxytetracycline for veterinary use. Front. Anal. Sci. 3:1066348. doi: 10.3389/frans.2023.1066348
Received: 10 October 2022; Accepted: 19 January 2023;
Published: 22 February 2023.
Edited by:
Eric Deconinck, Sciensano, BelgiumReviewed by:
Mariangela Raimondo, National Institute of Health (ISS), ItalyCopyright © 2023 Kaluka Tshibamba, Kakumba, Mabaya, Djang’ieng’a and Kindenge. This is an open-access article distributed under the terms of the Creative Commons Attribution License (CC BY). The use, distribution or reproduction in other forums is permitted, provided the original author(s) and the copyright owner(s) are credited and that the original publication in this journal is cited, in accordance with accepted academic practice. No use, distribution or reproduction is permitted which does not comply with these terms.
*Correspondence: Jocelyn Mankulu Kakumba, am9jZWx5bi5tYW5rdWx1QHVuaWtpbi5hYy5jZA==
†These authors have contributed equally to this work and share first authorship
Disclaimer: All claims expressed in this article are solely those of the authors and do not necessarily represent those of their affiliated organizations, or those of the publisher, the editors and the reviewers. Any product that may be evaluated in this article or claim that may be made by its manufacturer is not guaranteed or endorsed by the publisher.
Research integrity at Frontiers
Learn more about the work of our research integrity team to safeguard the quality of each article we publish.