 Yuanchang Liu1*
 Sosuke Akagawa1
 Rui Yatabe1
 Takeshi Onodera1Nobuyuki Fujiwara2Hidekazu Takeda2
 Kiyoshi Toko3,4
- 1Graduate School of Information Science and Electrical Engineering, Kyushu University, Fukuoka, Japan
- 2Meidensha Corporation, Tokyo, Japan
- 3Research and Development Center for Five-Sense Devices, Kyushu University, Fukuoka, Japan
- 4Institute for Advanced Study, Kyushu University, Fukuoka, Japan
The deterioration or oxidation of the mineral oil in transformers poses the risk of short circuits. Convenient and effective methods are expected to be developed. Carbon-based sensor arrays were used in this study to identify the quality variations of mineral oil for oil-filled transformers by odors. The sensitive layers of the odor-sensing system consisted of different types of GC stationary phase materials and carbon black (CB) mixtures. We made a targeted selection of GC materials by utilizing the polarities to make a sensor array based on the distinct components of mineral oil such as alkanes and xylenes by gas chromatography mass spectrometry (GC/MS) analysis. The response characteristics of the sensitive layers were used to recognize the mineral oil odors by machine learning. With laboratory air as the carrier gas, the system could distinguish mineral oil that has been in use for over 20 years from new mineral oil with an accuracy of about 93.8%. The identification accuracy achieved was about 60% for three different concentrations of unused mineral oil and the oxidized mineral oil created by the transformer’s leakage. When detecting the oxidized mineral oil with a concentration of more than 50%, the accuracy rate reached more than 80%. The odor-sensing system in this study will help inspect mineral oils in the transformer and make leakage judgments in a short time.
Introduction
Oil-filled transformers use insulating oil to ensure insulation and cooling. It is known that the insulating oil inside the transformer gradually deteriorates during transformer operation, thus requiring periodic replacement (Karthik and Sree Renga Raja, 2012). Continued operation in a degraded state can cause insulation breakdown (Danikas, 1990). The life of insulating oil is often 10 years or more. The most widely used insulating oil is mineral oil, extracted from petroleum (Kaplan et al., 2010). Replacement of insulating oil is done under circumstances when loss of conductivity or oxidation occurs. Premature replacement is costly and wastes insulating oil. Delayed replacement also increases the risk of transformer failure and accidents. Periodic inspections are usually performed once a year, and their analysis is expensive (Amano, 2002). Regular inspections are also made to check a certain concentration being at a cautionary level of total combustible gases (TCG) or dissolved gases (Suwanasri et al., 2008; Perrier et al., 2012; Mansour, 2015; Loiselle et al., 2020) in the insulating oil. In addition, it is not easy to detect the degradation inside transformers that is not visible. Thus, there is a need for equipment with which we can frequently detect mineral oil conditions in the transformers set in substations and factories.
When an exothermic phenomenon occurs inside a transformer due to insulation breakdown or local heating, the insulating material undergoes a decomposition reaction that generates hydrocarbon gas. The generation of gas due to this abnormal phenomenon has been known for a long time. Since the gas chromatography mass spectrometry (GC/MS) was put to practical use, it has become commonly used as a management tool for transformers (Rouse, 1998; Meshkatodd, 2008). In general, measurement by GC/MS is difficult to perform in the field due to the size and cost of the equipment.
There are some reports of sensor-based detection of volatile gases in mineral oil, such as detection of hydrocarbons by semiconductor gas sensors, solid oxide fuel cell gas sensors, and MEMS hydrogen sensors (Ding et al., 2014; Zhang et al., 2018; Kondalkar et al., 2021). Using a single gas sensor to detect specific components is not easy for detecting the degradation of mineral oils. On the other hand, Gamble and Smith (2009) reported that mice could identify the odor of various mineral oils. The odor-sensing system developed by our group has an array of 16 channel sensors with carbon-based sensitive membranes and evaluates odors by resistance changes (Wyszynski et al., 2017; Yatabe et al., 2021). The sensitive membrane is a mixture of carbon black (CB) and the stationary phase material of the GC column; there is a wide variety of GC materials, and the polarity is determined by the McReynolds constant. GC materials were selected based on properties ranging from low to high polarity. Sensitive membranes can absorb gas and then cause a change in electric resistance due to the swelling effect, which can be used to identify the burning smell of wires (Liu et al., 2021). Studies using quartz crystal microbalance (QCM) sensors, SnO2 gas sensor arrays for odor identification of volatile plant oil (VPO), or vegetable oils such as olive oil have been reported (Matindoust et al., 2016; Okur et al., 2020). However, there are no reports on odor detection and identification of mineral oil using gas sensor arrays.
In this study, we attempted to develop two mineral oil odor identification options. First, to identify degraded mineral oil for real-time monitoring of transformers; second, to detect the odor of oxidized mineral oil for detecting insulating oil leaks. Mineral oil is extracted from petroleum and hence is complex in composition. Consequently, we analyzed the vapor composition of various mineral oils using GC/MS. Degraded and unused mineral oils were then measured with the odor-sensing system with 16 channels. In addition, the possibility of detecting mineral oils with intermediate degrees of degradation was evaluated. Finally, an attempt was made to identify oxidized mineral oil from multiple concentration gradients using the odor sensing system.
Materials and methods
Chemicals and reagents
The unused mineral (UM) oil was a commercially available product. The deteriorated mineral (DM) oil sample was taken from transformers that had been in normal operation for over 20 years. Oxidized mineral (OM) oil was prepared according to the testing methods of electrical insulating oils (JIS C2101). The acid value of the OM oil sample was 0.06 mg KOH/g. O.D.O (Nisshin Oillio Group, Ltd., Japan), tetrahydrofuran (THF, Fujifilm Wako Pure Chemicals), and carbon black (Sigma-Aldrich) were also obtained.
Composition analysis
A PAL auto sampler system was used for sample pre-treatment. The parameters for sample pre-treatment were as follows: sample volume, 100 μl; SPME Fiber, 65 um DVB/PDMS (Sigma-Aldrich, Bellefonte, PA, United States); agitator temperature, 30°C; and extraction time, 20 min. GC/MS QP2010 SE (Shimadzu Corporation, Kyoto, Japan) was used for the composition analysis of oil samples. The parameters for GC/MS operation were as follows: carrier gas, helium; injector temperature, 240°C; sample injection time, 1 min; column, HP-VOC (90 m × 0.25 mm i.d., 0.25 μm film thickness, Agilent Technologies, Inc., Santa Clara, CA, United States); injection mode, splitless; oven temperature, from 40°C (3 min) to 260°C (44 min), with a heating rate of 10°C/min; GC/MS interface temperature, 240°C; and mass spectrometer, quadrupole.
Instrumentation and methodology
The sixteen kinds of GC materials are shown in Table 1. The sensitive layers of the sensing array were made with reference to our previous studies using those 16 kinds of GC materials (Liu et al., 2021). Sensitive layers were made with a 1 to 1 ratio of GC materials to carbon black. The sensor array was annealed by heating at 170°C for one hour under vacuum conditions.
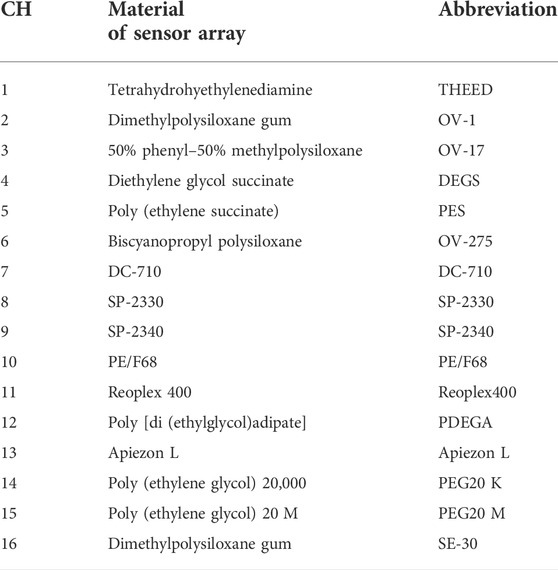
TABLE 1. GC materials for the sensor array of odor-sensing system.
The odor-sensing system used in this study contains several parts, such as analog-to-digita (A/D) converters, sensor chamber, pump, and solenoid valves, shown in Figure 1. The sensor array with 16 channels was mounted in the sensor chamber. The sensor array is connected to A/D converters and controlled by a computer unit. The flow path was switched by solenoid valves, which alternate the flow of reference gas and sample into the sensor chamber during the measurement process. When the odor-sensing system is in standby mode, the flow path is switched to blank (air) and the incoming and outgoing gases of the sensor chamber pass through moisture and VOC (volatile organic compounds) removal filters to speed up the reset of the sensor array. In the measurement, the sample and the reference gases were alternately introduced into the sensor chamber every 60 s as one cycle. Each type of oil sample is measured for 10 cycles, and a total of 3 sets of measurements are performed. Except for the first cycle of each set, the data from the remaining 27 cycles were used as the dataset. The data were recorded at a sampling rate of 100 times/s for data analysis.
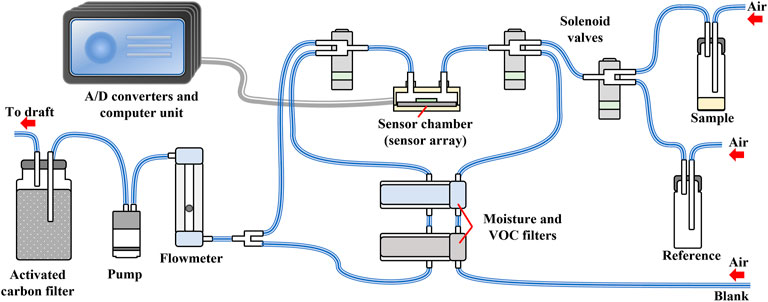
FIGURE 1. Instrumentation of the odor-sensing system.
An average moving method was used for smoothing the raw data before feature selection. We carried out a baseline shift based on the average of the 1 s data before and after each cycle of the measurement. The data at 5-s intervals after the introduction of the sample and the reference gases for 25 s were selected as features. The maximum values of each channel when measuring the samples were also used as features. In this way, 11 features from each channel were selected. Six features were from the sample introduction and five features were from the reintroduction of the reference gas. Each cycle of the measurement with 16 channels has 176 features in total. As shown in Table 2, we prepared two datasets of different samples in this study.
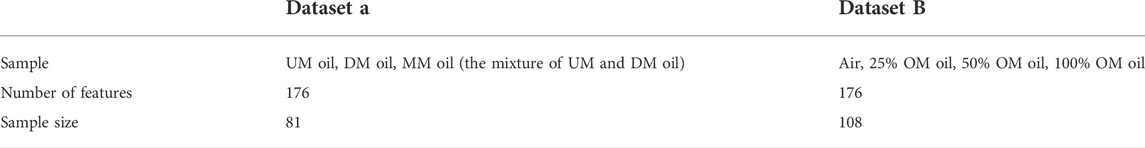
TABLE 2. Datasets of oil samples in this study.
Principal component analysis (PCA) was used to observe the distribution of data in dimensionality reduction. In this study, we used Python (Version 3.7.11) and the open-source Scikit-Learn package (Version 1.0.2, http://scikit-learn.org/) for machine learning. Six classifiers in the Scikit-Learn package were used, including a linear kernel support vector machine (SVM) classifier, a k-nearest neighbors (KNN) classifier, a decision tree classifier, a random forest classifier, a multi-layer perceptron (MLP) classifier, and a logistic regression classifier. The initial parameters of the classifiers were as follows: SVM, C = 1, with the linear kernel; KNN, number of neighbors kN = 5, with distance weight function; decision tree, where the best split at each node was chosen, maximum depth = 5; random forest, number of trees in the forest = 50, maximum depth = 5; MLP, hidden layer = 10, with rectified linear unit (ReLU) transfer function and limited-memory Broyden–Fletcher–Goldfarb–Shanno (L-BFGS) algorithm; and logistic regression, C = 1. Oil samples in all datasets were trained and tested at a ratio of 2:1 for each classifier.
Results and discussion
Composition analysis of mineral oil
Figure 2 shows the composition analysis results of mineral oils using the GC/MS, where the retention time is 1) 4.0–18.0 min and 2) 2.5–35.0 min. Measured mineral oils are the unused mineral oil, the deteriorated mineral oil, and the oxidized mineral oil. Identified chemicals are shown in Figure 2A and Table 3. The results imply that the UM (unused mineral) oil is characterized by a high content of some ketones. The DM (deteriorated mineral) oil shows a higher content of aromatic compounds such as toluene and xylene than the other two oils, whereas the oxidized mineral oil shows a lower content of alcohols and a higher content of acids. All the different types of mineral oil contain significant amounts of carbon-containing compounds, and the content of alkanes does not change significantly in the various oil samples. Many carbonaceous compounds with higher molecular weights appear at the retention time from about 23.0–32.5 min in Figure 2B. Due to the large variety of isomers, it is difficult to accurately speculate on the composition contained. From the GC/MS results in Figure 2A, it is possible to understand the presence of different characteristics in the samples by the content and type of low boiling point components. But all oil samples contain a high number of similar substances that may make identification of the gases difficult.

FIGURE 2. Composition analysis results of mineral oils; the retention time is (A) 4.0–18.0 min and (B) 2.5–35.0 min.

TABLE 3. Components detected by GC/MS.
Basic response of sensor array
Figure 3 shows one example of response of the sensor array to oxidized mineral oil (from 2 to 7 measurement cycles). The vertical and horizontal axes indicate the intensity of each channel response and the number of measurement rounds of the sample (each horizontal cell indicates one test of measurement for 120 s), respectively. When measuring samples, the sample and the reference gases were alternately introduced into the sensor chamber every 60 s. Each sample was measured for 10 cycles, and a total of 3 sets of measurements were performed. Each measurement cycle was preceded by the passage of the sample (from major to minor grid lines) and then the reference gases (from minor to major grid lines). The data in pink are the raw data and the data in blue were smoothed using the moving average method. The responses of channels rose slowly with exposure to the sample gas. The first measurement cycle of each channel was not very stable because the flow path was switched from blank to the sample gas. We omitted the first cycle data when analyzing the sensor response. Therefore, the sample size of each type of oil was 27 in the dataset for further analyses. We found some channels showed responses with triangle waveforms, while other channels hardly showed any response.
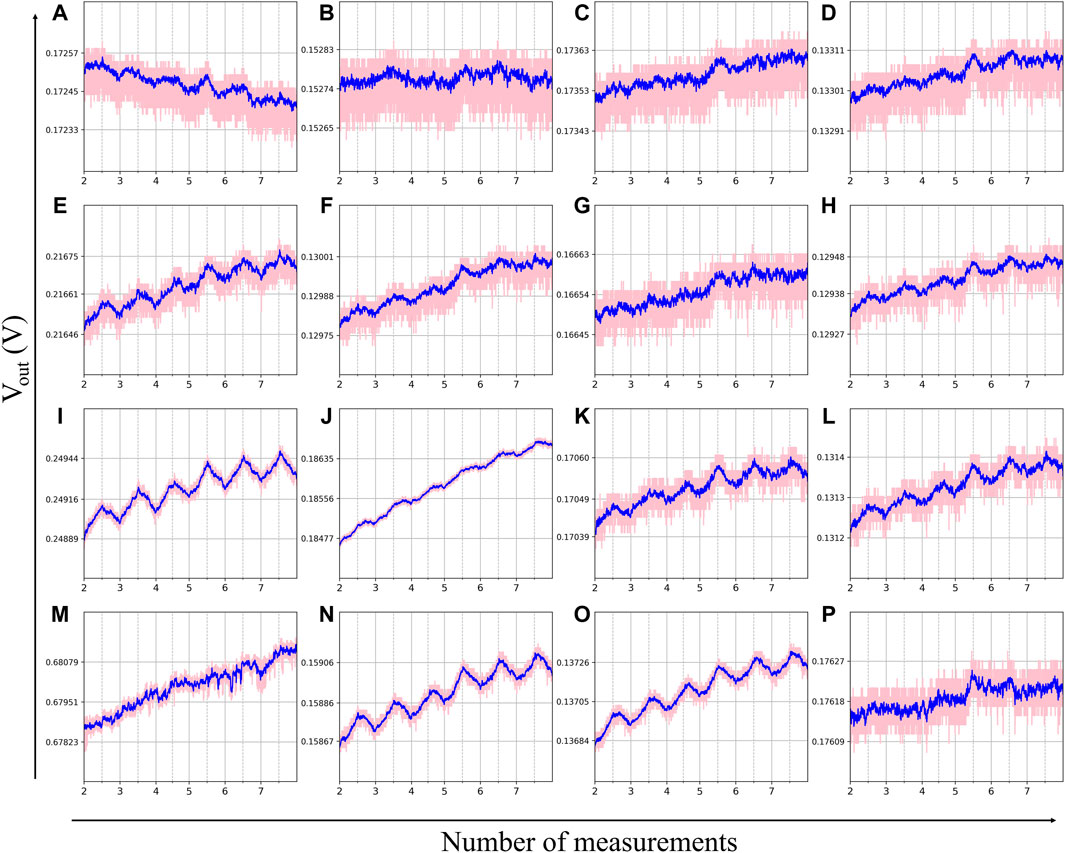
FIGURE 3. Responses of sensors with 16 types of GC materials to oxidized mineral oil. The interval from major grid to minor grid lines indicates that the sample gases were alternately introduced into the sensor chamber. (A) THEED; (B) OV-1; (C) OV-17; (D) DEGS; (E) PES; (F) OV-275; (G) DC-710; (H) SP2330; (I) SP-2340; (J) PE/F68; (K) Reoplex400; (L) PDEGA; (M) Apiezon L; (N) PEG20K; (O) PEG20M; (P) SE-30.
Deterioration evaluation of mineral oil
If it is possible to distinguish between unused and deteriorated mineral oil, we can evaluate the degree of deterioration of the mineral oil. Thus, the identification of unused mineral (UM) oil, deteriorated mineral (DM) oil, and their mixed mineral (MM) oil was carried out.
First, PCA analysis was performed using the standardized obtained dataset in Table 2. Figure 4 shows that there is fair discrimination among these three samples along the PC1 axis. In particular, UM oil and DM oil are clearly separated on the PC1 axis. PC1 and PC2 explain nearly 85% of the variance. As can be seen from the GC/MS results, DM oil contains a higher number of benzene-based compounds such as toluene and xylene than that of UM oil. These differences in characteristics may affect the PCA results.
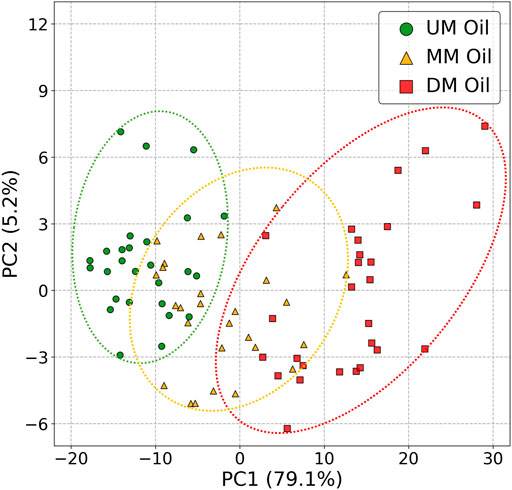
FIGURE 4. PCA results for the unused mineral (UM) oil, the deteriorated mineral (DM) oil, and the mixture of UM and DM mineral (MM) oil.
Next, the classifications of two classes and three classes were carried out using six classifiers. The two classes are UM oil and DM oil. The three classes are UM oil, MM oil, and DM oil. The results are shown in Table 4. In the classification of the two classes, the accuracy was achieved at an average of 93.8%. The PCA results in Figure 4 show that UM oil and DM oil can be clearly separated on the PC1 axis. We consider the separation as the cause for high classification accuracy using these classifiers. In the classification of the three classes, the accuracy was achieved at an average of 74.3%. The addition of MM oil, which is an intermediate state between UM oil and DM oil, made identification difficult and reduced the identification accuracy, but the accuracy was still 70% or more, so the degree of oil deterioration can be evaluated by this method.
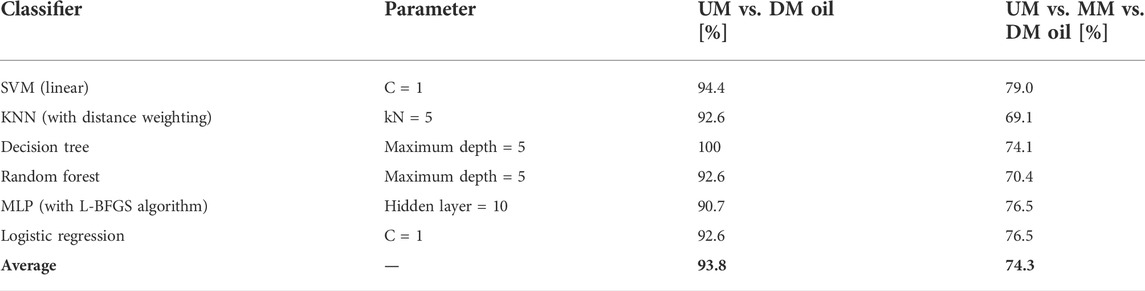
TABLE 4. Accuracy rate of oxidized mineral oil in different concentration percentages.
Detection of oxidized mineral oil
Mineral oil will be oxidized when exposed to air. One indicator to evaluate the degree of oxidation is the oil’s acid value, which is expressed as the amount of KOH needed to neutralize 1 g of oil. The acid value of the oxidized mineral (OM) oil in this experiment was 0.06 mg KOH/g. To detect the oil leaking from the transformer, the OM oil was evaluated in four concentrations of 100%, 50%, 25%, and 0%. The samples were diluted with O.D.O., which is an oil that does not generate VOCs. The sample of 0% was only O.D.O., which is listed with “Air” in the graph legend.
First, PCA was carried out using the standardized obtained dataset in Table 2. Figure 5 shows the PCA results. PC1 (70.1%) and PC2 (4.3%) described previously account for 75% of the total variance of the dataset. The dots of air are clustered in the positive direction of PC1 compared to those of the OM samples, and are clearly distinguishable from the results of OM oils. Furthermore, dots of OM oil with different concentrations are clustered on the left side of PC1 and tend to be distributed along PC2 with the concentrations. However, there are some overlapping areas in the results for the three different concentrations of OM oils. The discrimination of OM oils with the different concentrations was difficult as a result of PCA analysis.
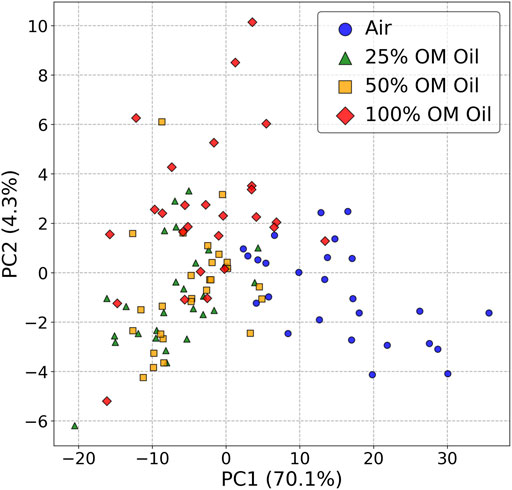
FIGURE 5. PCA results for different concentrations of oxidized mineral (OM) oil.
Next, the discrimination of the samples for the four classes in Table 2 was performed using classifiers. We tried to get better results by using different parameters. The parameters and results of different classifiers are presented in Table 5. The linear SVM classifier obtained the highest classification accuracy rate of about 70% (C = 1 and 100). The accuracy rates of KNN, random forest, MLP classifier, and logistic regression were about 60% for different parameters. The result for the decision tree classifier was only 52% when the maximum depth = 5. As suggested by the results of PCA analysis, it was not possible to obtain high discrimination accuracy in the classification of four classes. Therefore, it is difficult to quantitatively detect the amount of oil leaking at present. The discrimination of air and OM as the classification of two-class was then carried out for the purpose of detecting whether oil is leaking or not. Table 6 shows the results. The accuracy of 25% OM is lower than 70%. However, the accuracy of 50% and 100% is higher than 80%. Thus, it is suggested that if the amount of leaking oil is large to some extent, it can be detected.
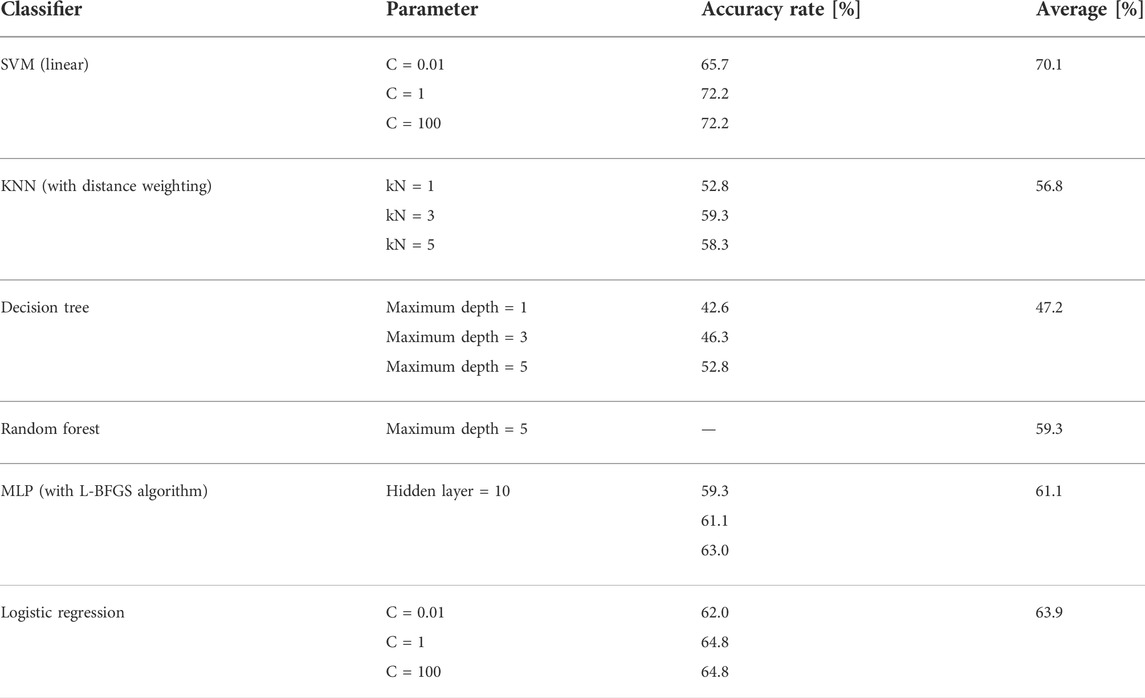
TABLE 5. Accuracy rates by four-class classification of oxidized mineral oil in different concentration percentages (Air vs. 25% vs. 50% vs. 100% OM oil).
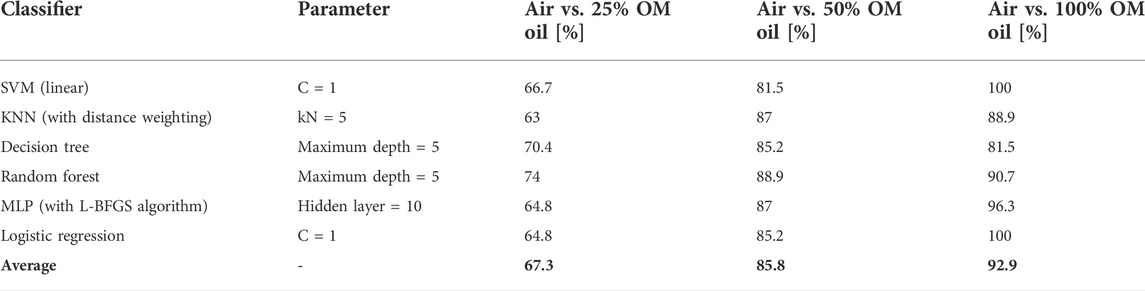
TABLE 6. Accuracy rates by two-class classification of oxidized mineral oil.
Finally, the feature importance values were calculated using the mean decrease impurity in the case of a random forest classifier (Breiman, 2001) to improve the accuracy of the discrimination of the OM oil. Figure 6 shows the results. By knowing the importance of features, we can expect to improve the accuracy by changing the material of the less important channel and developing the material of higher importance channel. To better compare the differences between sensor materials, we selected 11 features of each sensor channel in an unsupervised way. Figure 6A shows the importance values of 11 type features. The error bars were calculated by cross-validating the dataset. The importance of each feature type was obtained by summing 16 channels. S1 to S5 and Max are features from sample measurement, and features R1 to R5 are features from the reference measurement. All features have importance values of more than 6%. Feature S5 has a higher importance value at about 14%. Changes in the sensor array’s response as it absorbs or releases the sample gas all contribute to the classification. As shown in Figure 6B, the feature importance of all channels was more than 3% for the classification of OM oil. There was no channel which has particular low importance. Channels with high-polarity GC materials (CH1:THEED, CH12:PDEGA, and CH15:PEG20 M) and low-polarity GC materials (CH13:Apeizon L and CH16:SE-30) had better performance in this study. But channels with medium-polarity GC materials share less importance values. To improve the accuracy, we will change the material of channels which have lower importance in our future work.
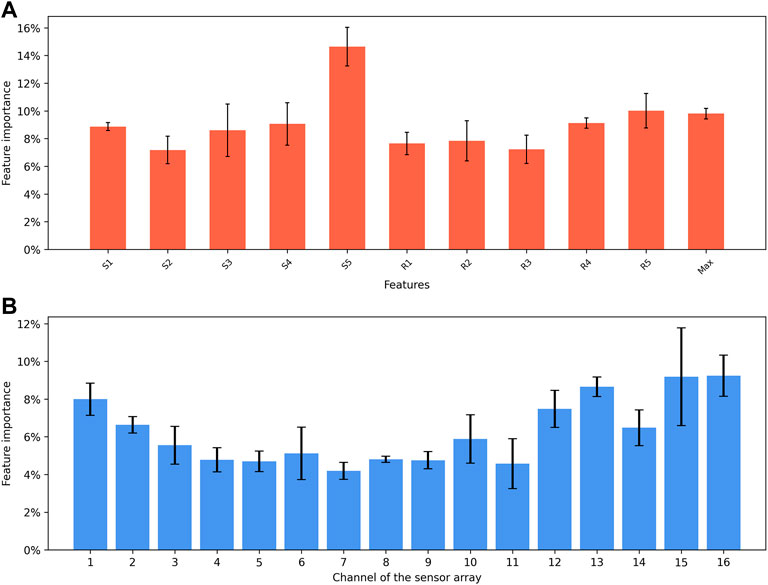
FIGURE 6. Feature importance for different concentrations of oxidized mineral (OM) oil by random forest classifier. (A) Cumulative by feature type. S1–S5 and Max depict features of sampling, R1–R5 depict features of from reference measurement; (B) Cumulative by sensor array channel.
Conclusion
The results imply that the UM (unused mineral) oil is characterized by a high content of some ketones. The DM (deteriorated mineral) oil shows a higher content of aromatic compounds such as toluene and xylene than the other two oils. In contrast, the oxidized mineral oil shows a lower content of alcohols. All the different types of mineral oil contain significant amounts of carbon-containing compounds. Due to the complex composition of mineral oils, odor identification is challenging.
The classification of the two classes of UM oil and DM oil can achieve an accuracy rate of about 93.8%. It is enough to distinguish the DM oil. The accuracy rate decreases to about 75% in the three-class classification of UM oil, MM oil, and DM oil. For mineral oils with intermediate degrees of deterioration, the recognition accuracy can be expected to improve.
The sensor array used in this study can distinguish very accurately between the presence or absence of mineral oil odors. We could find that the accuracies reach more than 80% for concentrations above 50%. The accuracy decreases when distinguishing between different concentrations of OM (oxidized mineral) oil. The average accuracy rate of the classification of three concentration-level mineral oils and the air was nearly 60% by six classifiers. The accuracy rate could reach about 70% when using the linear SVM classifier only. This is probably due to the similarity of the gases playing a dominant role in feature recognition. The PCA shows some overlapping areas when the oil was in low concentrations. The overlapping areas may affect the classification accuracy rates. Moreover, we found little difference in the feature importance of 16 channels for three concentrations of OM oil. The sensor array has a good balance of the types of GC material. To improve the recognition accuracy, the channels with low importance can be replaced in the future.
Data availability statement
The raw data supporting the conclusion of this article will be made available by the authors, without undue reservation.
Author contributions
Conceptualization, KT and NF; methodology, TO, RY, and KT; software, YL and SA; experiments, YL and SA; investigation, NF and HT; resources, KT, NF, and HT; writing—original draft preparation, YL; writing—review and editing, RY, TO, and KT. All authors have read and agreed to the published version of the manuscript.
Funding
This work was supported by JST SPRING, Grant Number JPMJSP2136.
Conflict of interest
Authors NF and HT were employed by Meidensha Corporation.
The remaining authors declare that the research was conducted in the absence of any commercial or financial relationships that could be construed as a potential conflict of interest.
Publisher’s note
All claims expressed in this article are solely those of the authors and do not necessarily represent those of their affiliated organizations, or those of the publisher, the editors, and the reviewers. Any product that may be evaluated in this article, or claim that may be made by its manufacturer, is not guaranteed or endorsed by the publisher.
References
Amano, N. (2002). Improvement in maintenance and inspection of transformers in Japan. Proc. IEEE Power Eng. Soc. Transm. Distrib. Conf. 2, 1500–1505. doi:10.1109/TDC.2002.1177706
Danikas, M. G. (1990). Breakdown of transformer oil. IEEE Electr. Insul. Mag. 6, 27–34. doi:10.1109/57.63080
Ding, J., Li, X., Cao, J., Sheng, L., Yin, L., and Xu, X. (2014). New sensor for gases dissolved in transformer oil based on solid oxide fuel cell. Sensors Actuators B Chem. 202, 232–239. doi:10.1016/j.snb.2014.05.061
Gamble, K. R., and Smith, D. W. (2009). Discrimination of “odorless” mineral oils alone and as diluents by behaviorally trained mice. Chem. Senses 34, 559–563. doi:10.1093/chemse/bjp036
Kaplan, I. R., Rasco, J., and Lu, S. T. (2010). Chemical characterization of transformer mineral-insulating oils. Environ. Forensics 11, 117–145. doi:10.1080/15275920903558760
Karthik, R., and Sree Renga Raja, T. (2012). Investigations of transformer oil characteristics. IEEJ Trans. Elec. Electron. Eng. 7, 369–374. doi:10.1002/TEE.21742
Kondalkar, V. V., Park, J., and Lee, K. (2021). MEMS hydrogen gas sensor for in-situ monitoring of hydrogen gas in transformer oil. Sensors Actuators B Chem. 326, 128989. doi:10.1016/j.snb.2020.128989
Liu, Y., Furuno, S., Akagawa, S., Yatabe, R., Onodera, T., Fujiwara, N., et al. (2021). Odor recognition of thermal decomposition products of electric cables using odor sensing arrays. Chemosensors 9, 261. doi:10.3390/chemosensors9090261
Loiselle, L., Rao, U. M., and Fofana, I. (2020). Gassing tendency of fresh and aged mineral oil and ester fluids under electrical and thermal fault conditions. Energies 13, 3472. doi:10.3390/en13133472
Mansour, D. E. A. (2015). Development of a new graphical technique for dissolved gas analysis in power transformers based on the five combustible gases. IEEE Trans. Dielectr. Electr. Insul. 22, 2507–2512. doi:10.1109/TDEI.2015.004999
Matindoust, S., Baghaei-Nejad, M., Abadi, M. H. S., Zou, Z., and Zheng, L. R. (2016). Food quality and safety monitoring using gas sensor array in intelligent packaging. Sens. Rev. 36, 169–183. doi:10.1108/SR-07-2015-0115
Meshkatodd, M. R. (2008). Aging study and lifetime estimation of transformer mineral oil. Am. J. Eng. Appl. Sci. 1, 384–388. doi:10.3844/ajeassp.2008.384.388
Okur, S., Zhang, Z., Sarheed, M., Nick, P., Lemmer, U., and Heinke, L. (2020). Towards a MOF e-nose: A SURMOF sensor array for detection and discrimination of plant oil scents and their mixtures. Sensors Actuators B Chem. 306, 127502. doi:10.1016/J.SNB.2019.127502
Perrier, C., Marugan, M., and Beroual, A. (2012). DGA comparison between ester and mineral oils. IEEE Trans. Dielectr. Electr. Insul. 19, 1609–1614. doi:10.1109/TDEI.2012.6311507
Rouse, T. O. (1998). Mineral insulating oil in transformers. IEEE Electr. Insul. Mag. 14, 6–16. doi:10.1109/57.675572
Suwanasri, T., Chaidee, E., and Adsoongnoen, C. (2008). Failure statistics and power transformer condition evaluation by dissolved gas analysis technique. Proc. 2008 Int. Conf. Cond. Monit. Diagn. C 2008, 492–496. doi:10.1109/CMD.2008.4580333
Wyszynski, B., Yatabe, R., Nakao, A., Nakatani, M., Oki, A., Oka, H., et al. (2017). Array of chemosensitive resistors with composites of gas chromatography (GC) materials and carbon black for detection and recognition of VOCs: A basic study. Sensors Switz. 17, 1606. doi:10.3390/s17071606
Yatabe, R., Shunori, A., Wyszynski, B., Hanai, Y., Nakao, A., Nakatani, M., et al. (2021). Odor sensor system using chemosensitive resistor array and machine learning. IEEE Sens. J. 21, 2077–2083. doi:10.1109/JSEN.2020.3016678
Keywords: GC materials, carbon black (CB), odor sensor, artificial olfaction, mineral oil (MO), odor discrimination, machine learning, sensor array
Citation: Liu Y, Akagawa S, Yatabe R, Onodera T, Fujiwara N, Takeda H and Toko K (2022) Odor recognition of deteriorated mineral oils using an odor-sensing array. Front. Anal. Sci. 2:896092. doi: 10.3389/frans.2022.896092
Received: 14 March 2022; Accepted: 15 July 2022;
Published: 17 August 2022.
Edited by:
Dmitry Kirsanov, Saint Petersburg State University, RussiaReviewed by:
Larisa Lvova, University of Rome Tor Vergata, ItalyVitaly Panchuk, Saint Petersburg State University, Russia
Copyright © 2022 Liu, Akagawa, Yatabe, Onodera, Fujiwara, Takeda and Toko. This is an open-access article distributed under the terms of the Creative Commons Attribution License (CC BY). The use, distribution or reproduction in other forums is permitted, provided the original author(s) and the copyright owner(s) are credited and that the original publication in this journal is cited, in accordance with accepted academic practice. No use, distribution or reproduction is permitted which does not comply with these terms.
*Correspondence: Yuanchang Liu, bGl1Lnl1YW5jaGFuZy41NTZAcy5reXVzaHUtdS5hYy5qcA==