
95% of researchers rate our articles as excellent or good
Learn more about the work of our research integrity team to safeguard the quality of each article we publish.
Find out more
ORIGINAL RESEARCH article
Front. Anal. Sci. , 04 April 2022
Sec. Chemometrics
Volume 2 - 2022 | https://doi.org/10.3389/frans.2022.867527
This article is part of the Research Topic Variable Selection in Chemometrics View all 5 articles
 Lorraine Latchoumane1,2,3,4*
 Karine Alary2
 Jérôme Minier1,2Fabrice Davrieux1,2,3
 Raphaël Lugan2
 Marc Chillet1,2
 Jean-Michel Roger3,5
Internal disorder is a major problem in fruit production and is responsible for considerable economical losses. Symptoms are not externally visible, making it difficult to assess the problem. In recent years, 3D fluorescence spectroscopy has been used to reveal features of interest in agronomical field, such as plant stress and plant infection. Such technique could provide useful information regarding changes that occur at the tissue level, in order to distinguish spectral differences between healthy and disordered fruits. This paper introduces the use of the new three-way feature extraction N-CovSel method, compared to the commonly used N-PLS-DA method. These approaches were used upon front-face fluorescence spectra of 27 fruit pulp and skin samples, by analysing excitation wavelengths ranging from 250 to 650 nm, and emission wavelengths varying from 290 to 800 nm. N-CovSel method was applied to identify the most relevant features on: 1) excitation-emission wavelength couples, 2) excitation wavelengths whatever the emission wavelengths and 3) emission wavelengths whatever the excitation wavelengths. Discriminant analysis of the selected features were performed across classes. The constructed models provided key features to differentiate healthy fruits from disordered ones. These results highlighted the capability of N-CovSel method to extract the most fitted features for enhanced fruit classification using front-face fluorescence spectroscopy. They revealed characteristic fluorophores involved in the structural modifications generated by the physiological disorder studied. This paper provides preliminary results concerning the suitability of N-CovSel method for the desired application. Further investigations could be performed on intact fresh fruits in a non-destructive way, allowing an earlier and faster detection of the internal disorder for in-field or industrial applications.
Quality control of food products represents an important issue for industrial application all along the food chain process in order to furnish high quality products to consumers. In fruit industries, quality traits can be determined by physical properties such as color, texture and size, as well as biological properties such as cultivar, geographical origin, fruit maturity and physiological disorders (Bai et al., 2019). This last attribute represents a main challenge since it may affect both external and internal qualities, thereby decreasing considerably consumers acceptance. Internal disorders are more difficult to detect, resulting in changes within the tissue due to physiological decay, mechanical injury, microorganism infection and pest or insect attack. A rapid characterization of fruit quality is needed in order to provide best products on the market and prevent economical losses.
In recent years, multivariate sensors coupled with analytical chemistry has been involved in quality survey in various domains, like agricultural, industrial and pharmaceutical applications. In such purpose, there indeed is a growing need for spectrometers based on ultraviolet (UV), visible (VIS) and infrared (IR). Those rapid, cost-efficient and non-destructive techniques represent potential methods for internal fruit quality determination. Amongst spectroscopic methods, fluorescence spectroscopy allows the analysis of numerous compounds identified as naturally occurring fluorophores. This technique is becoming increasingly developed, especially with the introduction of front-face fluorescence spectroscopy, which allows spectra recording on the surface of turbid or solid intact samples (Airado-Rodríguez et al., 2011). It is now possible to detect fluorophores sensitive to their surrounding environment on such matrices, while circumventing inner-filter effects caused by spectral distortions (Santos et al., 2022). Even though fluorescence appears as one of the oldest analytical methods, it has proven to be useful for quality traits evaluation, classification, authentication or chemical characterization of food matrices (Christensen et al., 2006). For example, Cabrera-Bañegil et al. (2019) analyzed grape front-face fluorescence and classified samples based on their phenolic composition when submitted to stress or not, while Tan et al. (2017) used the same technique for the discrimination of used frying oil from edible vegetable oil. Previous studies detected natural fluorescent compounds in food, fruits, and vegetables, such as flour (Xue et al., 2021), cheese (Andersen et al., 2005), meat (Sahar et al., 2009), wine (Azcarate et al., 2015; Elcoroaristizabal et al., 2016), beer (Tan et al., 2015), vegetable oil (Ali et al., 2020; Botosoa and Karoui, 2022), honey (Lenhardt et al., 2015; Hao et al., 2021), wheat (Bauriegel and Herppich, 2014), coffee (Robert et al., 2022), tea (Bose, 2016), apple (Codrea et al., 2004), strawberry (Huang et al., 2022), citrus (Momin et al., 2010), bell pepper (Kasampalis et al., 2021), and potato leaves (Zhao et al., 2021). Fluorescence spectroscopy provides structural information on diverse fluorophores, including phenolic compounds (Sergiel et al., 2014; Bose, 2016; Cabrera-Bañegil et al., 2017), aromatic amino acids (Prendergast, 1991; Sahar et al., 2009), vitamins (Zandomeneghi et al., 2005; Sikorska et al., 2019), and pigments like chlorophylls, pheophitins, and carotenoids (Sikorska et al., 2008; Lleó et al., 2016). Combined with chemometrics (multivariate statistical analysis), it makes it possible to analyze complex data sets in a reduced amount of time (Kassouf et al., 2014; Azcarate et al., 2015; Saad et al., 2016; Sahar et al., 2016; Hernández-Sánchez et al., 2021). Considering the massive datasets generated by such spectroscopy, using an efficient variable selection would make it possible to assess internal fruit quality more efficiently. Several feature selection methods have been proposed to optimize model by reducing dimensionality and processing time, while identifying most relevant variables (Li et al., 2009; Mehmood et al., 2012; Favilla et al., 2013; Soares et al., 2013; Pistore et al., 2019; Lei and Sun, 2020). Filter methods select variables of a fitted model by fixing a threshold on a specific measure, such as loading weights, regression coefficients and variable importance in projection (VIP). Wrapper methods iteratively apply the variable selection algorithm, such as genetic algorithm (GA), stepwise selection, simulated annealing (SA), ant colony optimization (AOC), competitive adaptive reweighted sampling (CARS), Monte Carlo uninformative variable elimination (MC-UVE), iteratively retaining informative variables (IRIV) and interval selection, over the refitted model obtained after feature extraction. Embedded methods search for best variables while fitting the model, using, for example, interactive variable selection (IVS), sparse algorithm, or successive projection algorithm (SPA). Some methods provide a parsimonious selection of individual variables considering a chosen performance measure, whereas others select variable ranges as subset of the dataset. Each approach holds strengths and weaknesses, and their use is dependent from the dataset (Yun et al., 2019). CARS is very cost-effective for removing irrelevant variables but often selects too few features and is not stable. IRIV is relatively stable and has good prediction performance, but possesses high computation cost and is time-consuming. GA has widely been used due to its performance, but is subject to overfitting when too many variables are analyzed. Also, combination of feature selection methods were studied to further highlight important variables. Fatemi et al. (2022) evaluated VIP combined with GA of a PLS to identify the most informative spectral regions to predict corn constituents using NIR spectroscopy. Allegrini and Olivieri (2013) simultaneously applied AOC and GA for variable selection while implementing sample selection with a Monte Carlo approach to optimize PLS model based on NIR spectra. Zhu et al. (2007) assessed stepwise algorithm and GA for wavelengths selection of a SVR model built from NIR spectra. Amongst the afford-mentioned variable extraction approaches, N-CovSel is an embedded method that acts as a particular case of PLS. It parsimoniously selects original features presenting highest covariance between descriptors and response variables, and deflates remaining variables with respect to the selected variable. Doing that, N-CovSel method allows selecting best features amongst highly correlated continuous variables using the covariance criterion, contrarily to SPA that only considers variance within descriptors. It also has the capability of fixing an a priori number of variables to select, thus optimizing the processing time of the constructed model.
The aim of this study was to investigate the use of front-face fluorescence spectroscopy on ground fruit samples to identify specific fluorophores related to an internal disorder. We tested the potential of the new multi-way feature extraction N-CovSel method on fluorescence spectroscopy measurements, as compared to the commonly used N-PLS method. Both methods were applied to sample classification of healthy and disordered fruits using discriminant analysis. This approach appeared to be the best suited considering the dataset configuration, i.e. the number of samples and the unbalanced class samples. According to their relevance as discriminant variables, features could be identified for interpretative purposes or for feature selection. The first aim improves understanding of the acquired data, the second one minimizes irrelevant information such as noise and redundancy. Both of the above-mentioned aspects will be discussed in the following sections.
This study was designed using pineapple fruits (Ananas comosus (L.) Merr.) cultivated according to the same technical itinerary and collected the same day, from the same field, at the same maturity stage. Fruit sample classification relied on visual characterization to determine the presence or absence of internal disorder. Samples were categorized in two classes: healthy fruits or disordered fruits. In each case, sections of approximately 1.5 cm2 of the skin and the pulp located just beneath it were sampled separately and immersed in liquid nitrogen. For healthy fruits, six sections of the fruit were randomly collected. For disordered fruits, six sections presenting the internal disorder were collected. All sections of one fruit were pulled together, leading to one pulp and one skin sample per fruit. Samples were ground using an IKA A11 grinder (IKA, China) after freeze-drying, and stored at −20°C before analysis. Pulp and skin of 27 fruits, 7 healthy, and 20 disordered, were obtained and analyzed.
Fluorescence spectra were acquired with front-face fluorescence spectroscopy using a Fluorolog®FL-3-22 spectrometer (HORIBA Instruments Incorporated, United States) at room temperature of 21°C to minimize instrumental fluctuations during spectra acquisitions. Measurements were carried out using a solid sample-cell holder accessory with variable angle. The powdery sample was deposited into the sample block rest and closed using a quartz plate. The optimal incidence angle of excitation radiation on the sample was determined as 45°. 3D spectra were obtained in the excitation range from 250 to 650 nm at 5 nm intervals and in the emission range from 290 to 800 nm at 2 nm intervals. The slit width was set to 2 nm for both excitation and emission. The integration time was maintained at 0.1 s. The FluorEssence™ version 3.8 software (HORIBA Instruments Incorporated, United States) was used for data acquisition.
The excitation-emission matrix (EEM) yielded in a data cube X (N, I, J) of N = 27 samples by I = 81 excitation wavelengths (λex) by J = 256 emission wavelengths (λem) for both skin and pulp samples. The three-way arrangements X (27, 81, 256) for both parts of the fruit were analyzed independently. The class membership of the samples was encoded in a dummy Y matrix (N, Q), with Q = 2, the number of classes in Y. A median filter was applied on spectra as each i value was replaced by the calculated median on (i−1, i, i+1). As described by Airado-Rodríguez et al. (2011), first and second order Rayleigh scatter were removed by excluding the excitation peaks on the identity line λex = λem and at 2λex = λem, respectively. The spectral regions below the identity line (λex > λem and 2λex < λem) was set to zero. No preprocessing methods were applied on fluorescence spectra. Matlab version R2015a software (The Mathworks Inc., MA, United States) was used for data processing and analyses.
Partial least squares (PLS) is a dimension-reduction algorithm that focuses on calculating the so-called latent variables by maximizing the covariance between a matrix X (descriptor variables) and a matrix Y (response variables). The PLS model is defined as:
where T and U are score matrices (factorial coordinates) of the latent variables, P and Q represent the loadings (factorial contributions) and R contains the residuals of the models (Rutledge et al., 2021). Matrices PT and QT are the transpositions of P and Q, respectively. The exact criterion used by PLS is to calculate the latent variables (LVs) as linear combinations of X in such a way that they well approximate X and Y while maximizing the square covariance between them (Phatak and Jong, 1997). When Y relates quantitative response variables, the final PLS model is completed by estimating a linear regression model (PLSR) between T and Y.
When Y refers to a qualitative response variable, a dummy response variable Y is used. A PLS is calculated between X and Y, and the scores are inputted in linear discriminant analysis (LDA). Since front-face fluorescence spectroscopy resulted in 3D datasets, analysis in the form of N-PLS-DA was investigated in a three-way array, as N-PLS is the extension of PLS method for multi-way data (Bro, 1996).
In order to discriminate samples with respect to their fluorescence spectra and class of belonging, a new three-way feature selection method was applied (Biancolillo et al., Forthcoming 2022). This variable selection approach relies on CovSel algorithm that aims at identifying the k most relevant features in X to predict the response Y (Roger et al., 2011). N-CovSel iterates the following steps:
(1) define the number k of original variables (OVs) to be selected.
(2) calculate the square covariance between each X feature and Y, defined by:
For a 1D-feature u:
For a 2D-feature U:
as defined in (El Ghaziri and Qannari, 2015).
(3) the feature possessing the higher covariance is retained
(4) the remaining variables of both X and Y are deflated by orthogonalization according to this feature:
For a 1D-feature u (Nx1):
For a 2D-feature U, e.g., (N, I), U is unfolded into a vector (NxI, 1), X is reshaped into (NxI, J), the same formulae are applied and finally, X is reshaped into (N, I, J).
(5) Go to 2, until k iterations.
Considering the multi-way design of the X (N, I, J) matrices, N-CovSel method was applied on X to determine the best 1D-features or 2D-features. The first option selected couples of indexes in the two variable dimension of X. The second option selected a variable in one dimension while keeping all variables in the other dimension (Biancolillo et al., Forthcoming 2022). In this study, it led to the selection of the following features: 1) excitation-emission wavelength (λEx+Em) couples, 2) excitation wavelengths (λEx) whatever the emission wavelengths and 3) emission wavelengths (λEm) whatever the excitation wavelengths. Discriminant analysis (DA) were then performed on the selected X features to classify samples in accordance with Y. According to the dimension of the selected features, different discriminant analysis methods were used, yielding in N-CovSelEx+Em-PLS-DA, N-CovSelEx-N-PLS-DA, and N-CovSelEm-N-PLS-DA.
Models were evaluated using a double cross-validation, consisting in randomly splitting dataset into two sets. The first one (training set) was used to build and calibrate the model, whereas the second one (test set) served to evaluate the created model. Because of the small number of samples, random affectation of sample to one or the other set may have a considerable influence on the model outcomes. The double cross-validation prevented this adverse effect by repeating a certain amount of time the random split for each cross-validation to obtain a better estimation of the calibration and prediction model accuracies (Filzmoser et al., 2009; Hernández-Sánchez et al., 2021). Due to outnumbered disordered samples compared to healthy samples, the number of disordered and healthy samples collected for the training set (n = 20) were fixed to 15 and 5, respectively. Remaining samples were used for the test set (n = 7). Taking this into account, samples were randomly selected for each 1,000 iterations of the double cross-validation in two blocks. Models were built from the training set using the two-fold cross-validation with k variables (LV or OV) depending on the model. The maximal number of variables to be selected was fixed at k = 12 (N-PLS-DA, N-CovSelEx-N-PLS-DA, and N-CovSelEm-N-PLS-DA models) or k = 9 (N-CovSelEx+Em-PLS-DA model). In the first model, latent variables (LVs) were constructed in order to highlight a subspace of interest based on linear combinations of the original variables. In the other three models, original variables (OVs) possessing higher covariance between descriptors and response were selected using N-CovSel approach. According to the covariance criterion and considering that the first LV or OV explains most of the variance of the X and Y matrices, an optimal k number of LV or OV to keep was determined using the average classification accuracy obtained in cross-validation (ACACV), which were calculated as the average of correct classification rates for each class. The calibrated model obtained with this LVopt or OVopt value was then applied on the test set, providing the average classification accuracy of prediction (ACAPred).
The successive double cross-validation approach resulted in 1,000 values of ACACV, ACAPred, LVopt or OVopt, and the list of OVs used for models when needed. Based on confusion matrices, sensitivity and specificity of each model were calculated using formula:
Sensitivity represents the ability of the model to correctly classify healthy fruits (true positives), whereas specificity give the rate of disordered fruits correctly classified (true negatives) by the model. Boxplots of ACACV, ACAPred, LVopt values, as well as graphics illustrating the occurrence of OVs values employed by models were used to compare and explain model performances and complexities. Mood’s median test combined with pairwise median post-hoc test were used to compare models and highlight significant difference defined as p-value < 0.01.
Mean fluorescence spectra were processed for pulp and skin of healthy and disordered fruits (Figure 1). Fluorescence landscapes obtained in Figure 1 correspond to different signals emitted by natural compounds frequently found in fruit samples (Christensen et al., 2006). It revealed the fluorescent characteristics of fluorophores existing in the samples, such as polyphenols, amino acids, vitamins or pigments.
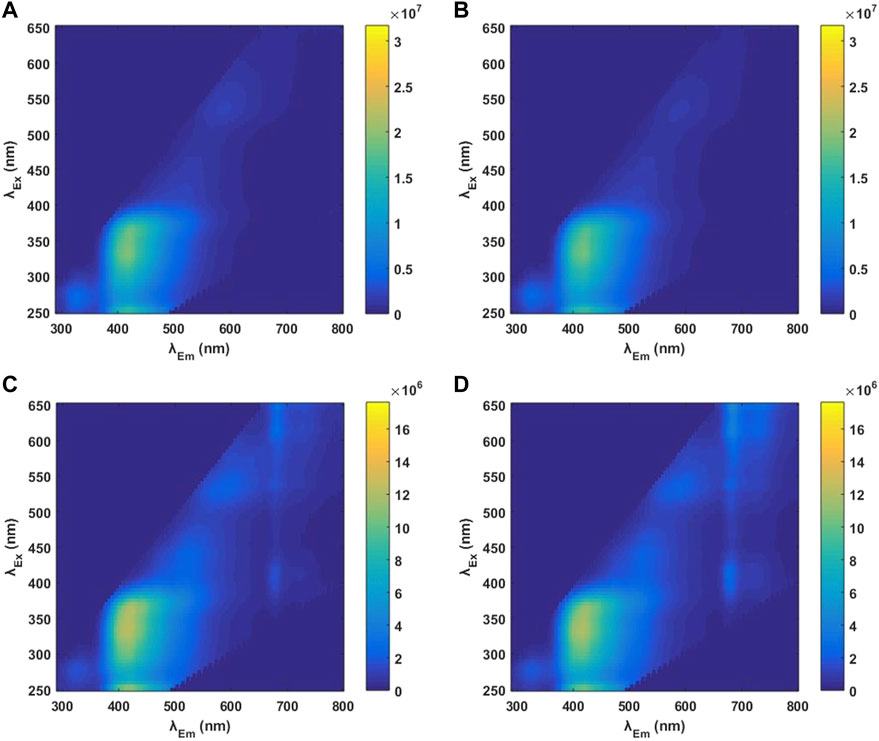
FIGURE 1. Mean front-face fluorescence spectra of pulp (A,B) and skin (C,D) samples measured with the 250–650 nm excitation wavelength (λEx) and 290–800 nm emission wavelength (λEm) ranges. Dark blue regions indicate no fluorescence; yellow regions reflect the presence of fluorophores. (A) healthy pulp (n = 7); (B) disordered pulp (n = 20); (C) healthy skin (n = 7); (D) disordered skin (n = 20).
When comparing fluorescence spectra of fruit pulp samples (Figures 1A,B), no significant difference was observed between the fluorescence patterns of healthy and disordered fruits. Three areas of interest exhibited fluorescent properties. The region of highest emission intensity appeared approximately from 380 to 550 nm, resulted from an excitation between 270 and 400 nm. Another important area of emission ranged approximately from 380 to 500 nm, corresponding to an excitation between 250 and 260 nm. The third fluorescent area emitted approximately within wavelength range from 290 to 360 nm when excited between 250 and 300 nm. Two minor fluorescence profiles were noticed for emission between 490 and 580 nm, corresponding to excitation from 400 to 480 nm, and excitation at wavelengths above 500 nm gave an emission signal between 550 and 700 nm.
When focusing on fruit skin samples, similar but more intense fluorescent schemes were noticeable, with an additional emission area between 680 and 780 nm when the excitation wavelength range varied from 350 to 650 nm. Moreover, small differences appeared between classes regarding fluorescence intensity. Indeed, disordered skin samples exhibited lower fluorescence intensity than healthy samples at emission wavelengths from 380 to 600 nm, whereas they displayed more fluorescence intensity above the 680 nm emission wavelength.
Discriminant analyses were performed in order to differentiate pulp and skin from healthy or disordered fruits. Results of optimal variables and prediction models are summarized on Figures 2, 3 for pulp and skin samples, respectively. Comparative evaluation of all models assessing the main trends are illustrated in Figures 2, 3. Mood’s median test revealed significant difference (p-value < 0.01) between median models for every parameter studied. Pairwise comparison of median values was assessed in each case, and characterized by letters suggesting median difference or similarity. Medians sharing an identical letter are not significantly different, whereas dissimilar letters indicate significant difference between medians.
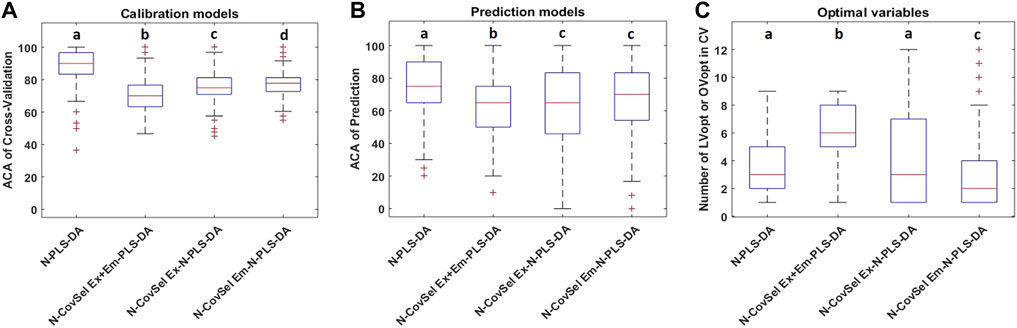
FIGURE 2. Model performances for fruit pulp samples. ACACV (A), ACAPred (B), and number of LVopt or OVopt (C) are obtained for each model realized with 1,000 iterations of a 2-fold double cross-validation from pulp samples. Bottom and top edges of the blue box are the 25th and 75th percentiles, respectively; the central mark is the median; whiskers extend to the most extreme data points not considered outliers; the “+” symbol plots outliers, letters indicate significant difference between models defined as p-value < 0.01 using Mood’s median test and pairwise median test.
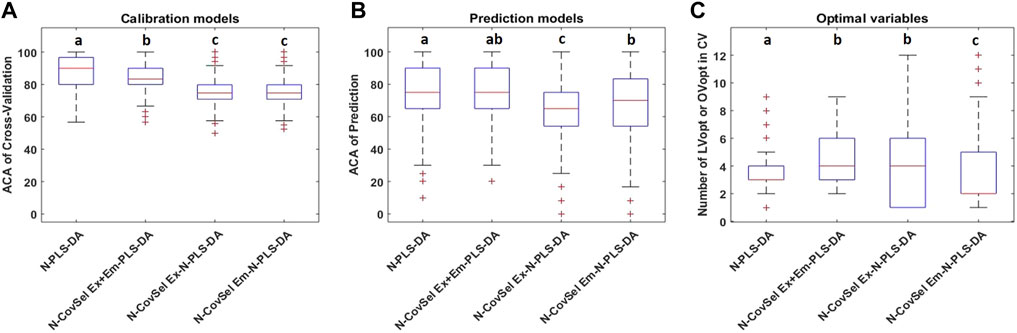
FIGURE 3. Model performances for fruit skin samples. ACACV (A), ACAPred (B), and number of LVopt or OVopt (C) are obtained for each model realized with 1,000 iterations of a 2-fold double cross-validation from skin samples. Bottom and top edges of the blue box are the 25th and 75th percentiles, respectively; the central mark is the median; whiskers extend to the most extreme data points not considered outliers; the “+” symbol plots outliers, letters indicate significant difference between models defined as p-value < 0.01 using Mood’s median test and pairwise median test.
When comparing the performance of models built with pulp samples (Figure 2), it appeared that N-PLS-DA model performed better in classification than the other three models using variable selection. Indeed, medians of ACACV and ACAPred for N-PLS-DA model outperformed other models, reaching 90 and 75%, respectively, with a median LV value of three. This result is relevant because the higher the number of variable, the more descriptive is the model, since it contains more information and emphasis correlation between matrices. Conversely, selecting few variables ensues loss of performance since there is a lack of relevant information (Rutledge et al., 2021). However, a significant variability was found in both ACAPred and optimal number of variables within each model. The variation of the number of LVs or OVs required illustrated the instability of models. This may be due to the relatively low number of samples available for the double cross-validation, but also the disproportioned number of healthy samples compared to disordered ones.
Variability amongst performance parameters was especially noticed for N-CovSelEx-N-PLS-DA model for which both ACAPred and OVopt ranged from minimal to maximal values. Thus, selecting specific excitation wavelengths while keeping the entire emission range allowed to achieve moderate performance model with instability. Using N-CovSelEx+Em-PLS-DA model provided similar performance than N-CovSelEx-N-PLS-DA model, as median ACACV and ACAPred values were comprised between 70 and 75% for both models. Therefore, even if the selection of some excitation-emission wavelength couples brought less variability than selecting only few excitation wavelengths, it also led to more complexity since the highest OVopt median value was attained, i.e. six OVs. N-CovSelEm-N-PLS-DA model reached best performances of models built with variable selection, as ACACV and ACAPred median values were 78 and 70%, respectively. Notwithstanding, median value of the optimal number of variables was only two OVs for N-CovSelEm-N-PLS-DA model while it was four LVs for N-PLS-DA.
Skin samples models (Figure 3) exhibited less internal variations than pulp samples models. Indeed, ACAPred median values varied from 65 to 75%, and the median number of LVopt or OVopt was comprised between two and four. Once again, N-PLS-DA was the best model since good performance and low complexity was illustrated by median ACACV, ACAPred, and LVopt values of 90%, 75% and three, respectively. A comparable performance was obtained for N-CovSelEx+Em-PLS-DA model but with an increased complexity as the median number of OVopt was four and the variability was wider. Using four well selected excitation-emission wavelengths could lead to discriminate properly sample classes. Likewise, N-CovSelEm-N-PLS-DA model achieved good performance while reducing even more the model complexity. As a matter of fact, the median ACAPred value obtained was close to that of N-PLS-DA and the median OVopt value was only two. Again, N-CovSelEx-N-PLS-DA model had the highest variability concerning the OVopt number to consider. This model also demonstrated the lowest performance rate of ACAPred, making it the least relevant model for discriminant analysis of skin samples.
A more detailed comparison is assessed for each model using the median dimension value as above-mentioned (Figures 2C, 3C). The model iterations built with the median LVopt or OVopt value were kept, i.e., n out of 1,000. Mean classification performance for both training and test sets were evaluated based on mean ACACV and ACAPred for these n models, resulting in Mean Calibration (%) and Mean Prediction (%), respectively. Correctly classified samples for each class, i.e., Sensitivity (SENS) for healthy fruits and Specificity (SPEC) for disordered fruits were deducted using confusion matrices. Results for every pulp and skin models are summarized in Table 1.
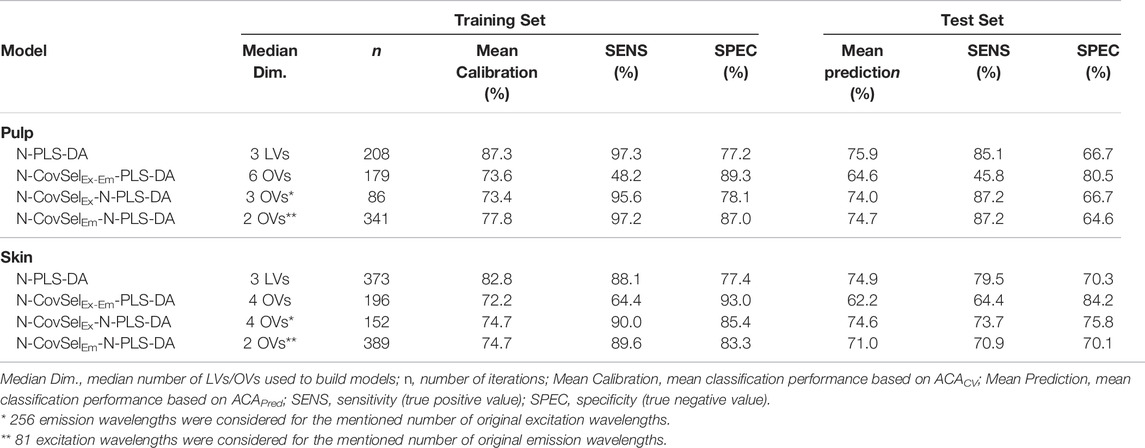
TABLE 1. Performance model obtained for each discriminant analysis built from training set and applied on test set of pulp and skin samples, using the median LVopt or OVopt value.
As earlier reported, N-PLS-DA models gave better mean calibration and mean prediction percentages for both pulp and skin samples. More than 87 and 82% of mean calibration were achieved for pulp and skin, respectively, and mean predictions were near 75% each. Focusing on the class attribution of pulp and skin samples, it appeared that disordered fruits were more likely to be misclassified compared to healthy fruits. There was a 9–18% difference of good classification depending on the nature of samples. In fact, healthy fruits class was correctly predicted at 85% for pulp samples, and at 79% for skin samples.
Best discriminant analyses using N-CovSel approach were obtained with N-CovSelEx-N-PLS-DA and N-CovSelEm-N-PLS-DA, either for pulp or for skin samples. For example, selecting three pulp OVs or four skin OVs in excitation range while measuring the 256 emission wavelengths achieved mean prediction of 74 and 74.6%, respectively. Complementarily, selecting only two OVs in emission range after exciting the 81 excitation wavelengths allowed predicting accurately skin and pulp class samples with respectively 71 and 74.7% success rate. Although, healthy fruits were better classified than disordered fruits for pulp samples, with a sensitivity of 87.2% and a specificity around 65%. Such distinction was less obvious concerning skin samples since there was at most 2.1% difference between sensitivity and specificity in both models. For pulp as well as for skin samples, the least performant model was using four or six excitation-emission wavelength couples. Indeed, even if the mean calibration rate was approaching 73%, the maximum value of mean prediction was 64.6%. N-CovSelEx-Em-DA could be time-saving because only few wavelengths are needed, but on the other hand, performance model was clearly diminished. Contrarily to the other three models, N-CovSelEx-Em-DA was better at classifying disordered fruits rather than healthy ones.
Applying N-CovSel in order to find best 1D-features, i.e. most relevant excitation-emission couples, resulted in poor performance for both pulp and skin samples. Nevertheless, it was possible to identify features that occurred the most throughout the 20,736 possibilities (
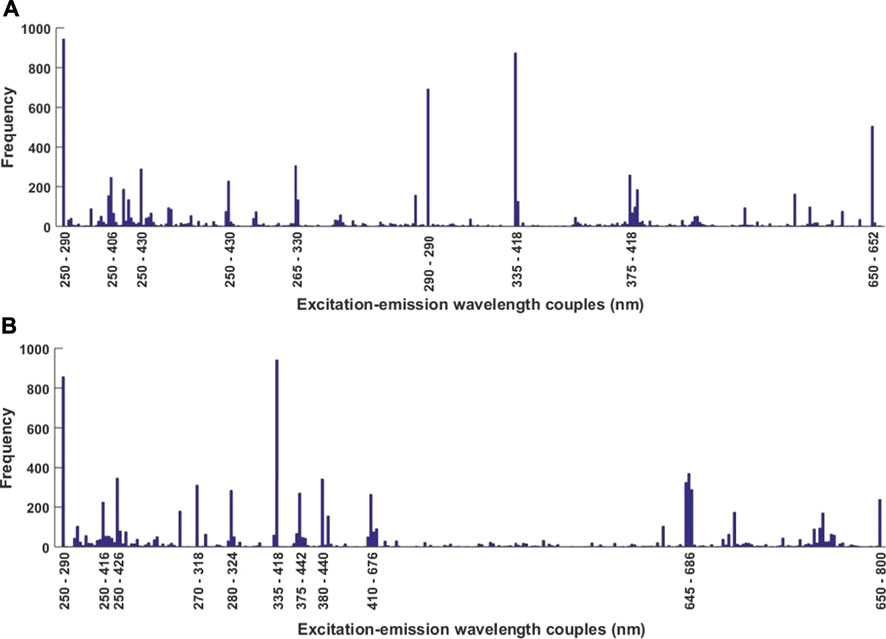
FIGURE 4. Frequency of appearance of excitation-emission wavelength couples selected by N-CovSel for pulp samples (A) and skin samples (B) prior to discriminant analysis.
Figure 5 represents mean fluorescence spectra of pulp and skin samples with their respective most selected features by N-CovSel. Globally, OVs selected by models highlighted different regions of the fluorescence domain. Most important features extracted were distributed across three or four major regions for pulp and skin samples, respectively. Additionally, other features of importance were extracted by N-CovSel. Indeed, for both pulp and skin samples, OVs of interest were comprised within the three ranges: 1) λEx = 250–290 nm and λEm = 290–330 nm, 2) λEx = 250 and λEm = 406–430 nm, 3) λEx = 335 to 380 and λEm = 418–442 nm, and a supplementary area 4) λEx = 645 and λEm = 684–688 nm only for skin samples.
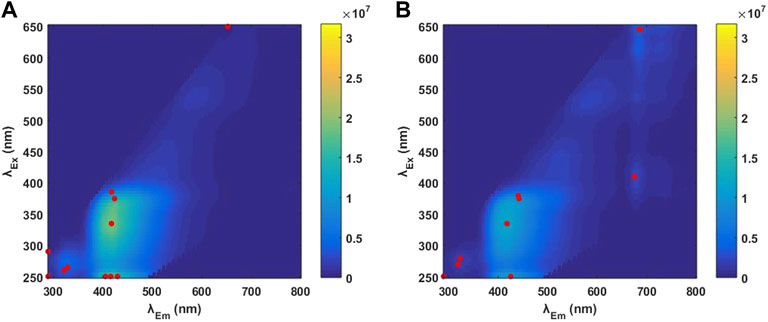
FIGURE 5. 3D font-face mean spectrum of pulp (A) and skin (B) samples measured with the 250–650 nm excitation wavelength (λEx) and 290–800 nm emission wavelength (λEm) ranges. Dark blue regions indicate no fluorescence; yellow regions reflect the presence of fluorophores. Best OVs (λEx+Em couples) selected by N-CovSel are represented by red dots.
Discriminant analyses performed using N-CovSelEx-N-PLS-DA allowed to optimize variable selection focusing on 2D-features characterized by excitation wavelengths. In this section, an OV is a 2D-feature corresponding to a slice of the cube constructed with one excitation wavelength and the entire emission wavelengths range. Thus, N-CovSelEx-N-PLS-DA approach is a combination of several slices extracted on the basis of OVs possessing the highest covariance, leading to a reduced dimension of the original X matrices. Taking into account the 1,000 iterations of N-CovSelEx-N-PLS-DA model, a total of 47 and 45 differents OVs were used for pulp and skin model, respectively. Figure 6 represents the frequency of appearance of these selected features.
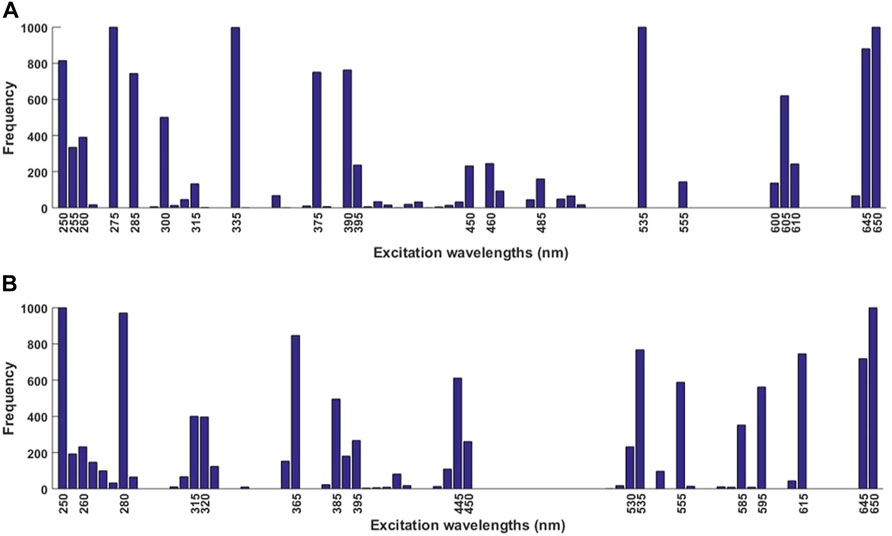
FIGURE 6. Frequency of appearance of excitation wavelengths selected by N-CovSel for pulp samples (A) and skin samples (B) prior to discriminant analysis.
Most frequently selected OVs for pulp samples were 275, 335, 535, and 650 nm, which came out for each iteration. Other important OVs that outcompeted others are 250, 285, 375, 390, and 645 nm, since they were extracted in 70–90% of cases. Likewise, for skin samples, OVs 250 and 650 nm were selected 1,000 times, 280 nm appeared 971 times, and 365, 535, 615, and 645 nm exceeded 70% of occurrence. As previously, performant N-CovSelEx-N-PLS-DA models were obtained using an optimal number of three and four OVs for pulp and skin samples, respectively. Using three of the most frequently selected excitation wavelengths for pulp discriminant analysis would result in even more performant model. The same applies using four of the best OVs above-mentioned extracted from skin samples models. Fluorescence intensity corresponding to the best selected features are shown in Figure 7A for pulp samples and Figure 7B for skin samples.
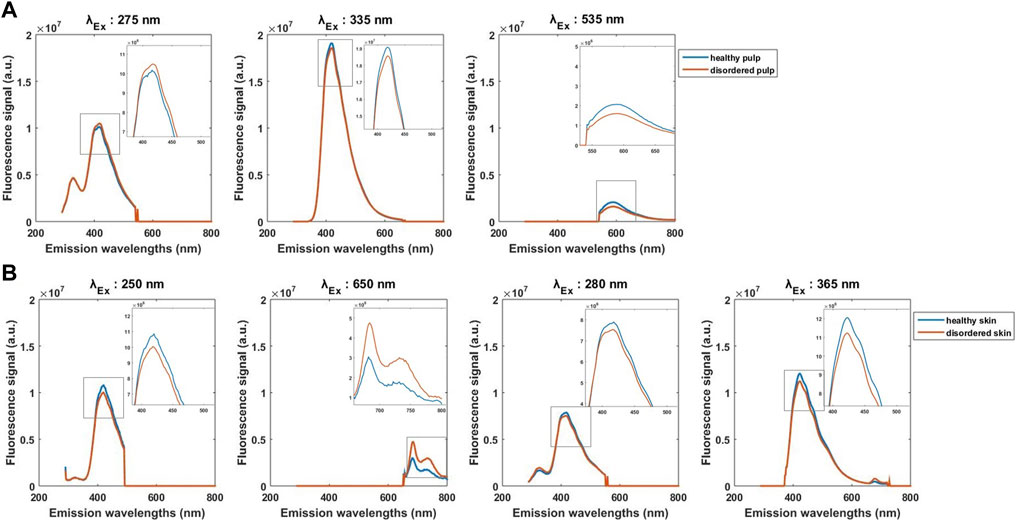
FIGURE 7. Mean fluorescence emission spectra of pulp (A) and skin (B) samples at excitation wavelength (λEx) corresponding to the best OVs selected by N-CovSel. Blue line represents healthy fruits; red line represents disordered fruits. The right upper part of each graph is a close-up view of the spectra defined by the rectangular shape.
N-CovSelEm-N-PLS-DA model allowed to extract the best 2D-features in emission mode while keeping the whole excitation range. The selection performed on emission wavelengths concerned 72 OVs for pulp samples whereas 48 were used for skin samples. Selected OVs and their respective frequency of occurrence are illustrated in Figure 8. Concerning pulp samples, features 502, 518, 576, 682, and 800 nm happened to be selected between 73 and 97% of iterations. However, three OVs were systematically selected by N-CovSel, i.e., emission wavelengths 328, 422, and 656 nm. Amongst them, only two OVs implemented in N-CovSelEm-N-PLS-DA model would be sufficient to correctly classify samples since this was the optimal number of features determined through multiple double cross-validation. In the same way, two OVs would be enough to discriminate healthy fruits from disordered ones using skin samples. Indeed, features 422 and 682 nm appeared to be the most appropriate OVs, closely followed by features 384, 502, 558, 324, and 652 nm. Fluorescence signals obtained with the best OVs are shown in Figure 9.
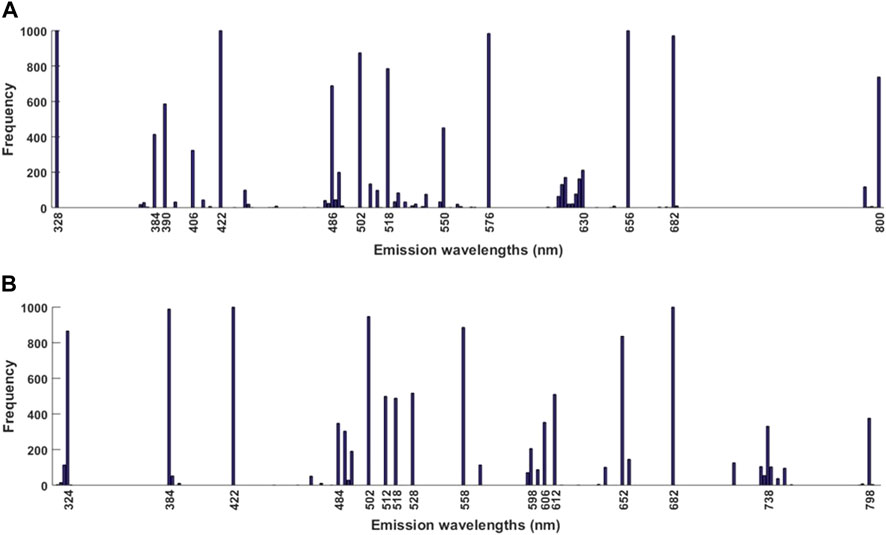
FIGURE 8. Frequency of appearance of emission wavelengths selected by N-CovSel for pulp samples (A) and skin samples (B) prior to discriminant analysis.
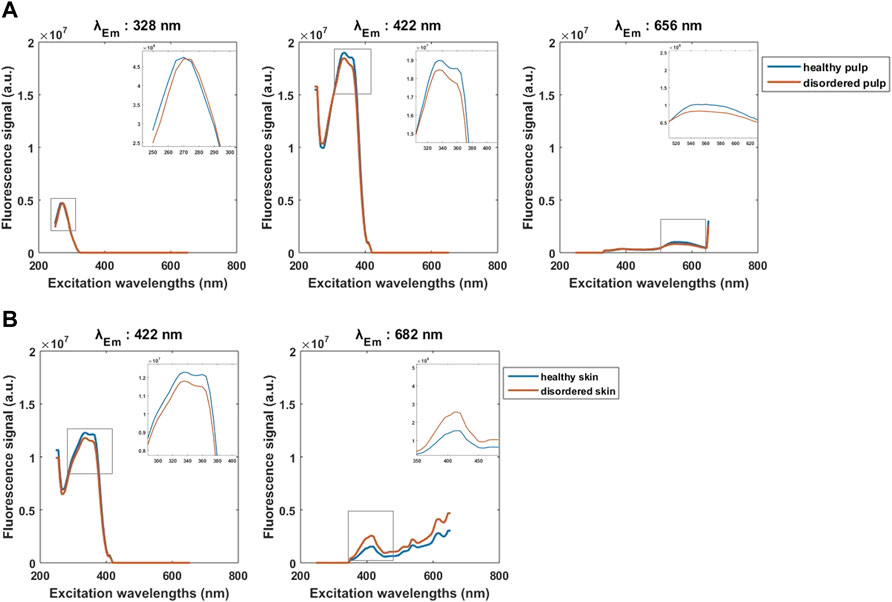
FIGURE 9. Mean fluorescence excitation spectra of pulp (A) and skin (B) samples at emission wavelength (λEm) corresponding to the best OVs selected by N-CovSel. Blue line represents healthy fruits; red line represents disordered fruits. The right upper part of each graph is a close-up view of the spectra defined by the rectangular shape.
At first sight, fluorescence spectra revealed no significant difference between healthy or disordered fruits, for both pulp or skin samples, even though fluorescent schemes outlined the presence of fluorophores. However, discriminant analysis showed that it was actually possible to distinguish one class from the other and to predict class membership to some extent. It highlighted inherent differences regarding fluorescence pattern between the two classes.
N-PLS-DA achieved best performance using the whole wavelength ranges of fluorescence spectra. This effective method relies on numerous variables and is therefore time-consuming and less adaptable to fast-analyzing environments. N-CovSel method made it possible to circumvent this bias. Indeed, besides correct prediction of class samples, models were capable to select the most relevant variables encountered amongst excitation wavelengths, emission wavelengths, or both modes simultaneously based on N-CovSel method. The diverse models built were not complex and exhibited moderate or good performance. Classification models built from skin samples achieved slightly less satisfying performance than models built from pulp samples data. For both datasets, albeit each discriminant analysis constructed with N-CovSel method provided accurate prediction rates, the one relying on emission wavelengths selection outperformed the others. When confronted, this model attained better performance by using only two emission wavelengths regardless the excitation range, for either pulp or skin samples. However, in the case of skin, best results were achieved using excitation wavelengths selection, when considering the mean of n iterations for models built with the median OV values. Employing the same parameters of this study, it would take 16.2 s just to acquire fluorescence spectra with 81 λEx and 2 λEm for N-CovSelEm-N-PLS-DA model. Selecting relevant wavelength couples would drastically decrease acquisition time since only 0.8 or 1.2 s would be needed to analyze samples using 4 or 6 λEx-Em couples for N-CovSelEx-Em-PLS-DA model, respectively. This last model needs improvements before use in routine controls, because its performance are still insufficient. Moreover, two of the most frequently selected OVs by N-CovSelEx+Em-PLS-DA model built from pulp data, i.e., 290-290 and 650–652 nm, corresponded to noise. Those λEx-Em couples were located in the first order Rayleigh spectra region, which exhibited high intensity caused by light diffraction. Although, no relevant information of X could be correlated to Y based upon this spectral area. However, if the primary Rayleigh scatter overlapped with a peak of fluorescence, the total signal would be more important than if no fluorophore was measured. This could explain why these wavelength couples were chosen by the feature selection, since it was capable to bring out relevant information through noise. As mentioned by Murphy et al. (2013), one way to handle fluorescence signal hidden by scatters is to interpolate over the excised area. In the present study, one pulp sample displayed such noise and negatively influenced the feature selection. The low number of samples implemented in model construction emphasized this result since one sample outcompeted all the others. As described before, N-CovSelEx+Em-PLS-DA model selected at most six 1D-features amongst thousands. Such large dimension resulted in model performance reduction by selecting irrelevant features. This phenomenon was less important for N-CovSel models elaborated from 2D-features selection. Indeed, in those cases, the dimension was reduced to 81 or 256 feature slices for models built using excitation or emission wavelengths selection, respectively. For example, all 256 λEm were considered when extracting one λEx (290 or 650 nm), resulting in minimizing noise importance. The findings highlighted the limitations of N-CovSel method when extracting 1D-features when a limited number of samples are available, whereas its suitability was demonstrated when extracting 2D-features.
These promising results may be enhanced with further investigation to develop more robust and reliable models, starting with enlarging the number of samples and ensuring the balanced number of samples between classes. Also, data pretreatment could bring forward the most important information while minimizing noise and artefacts. Application of independent components analysis (ICA) or parallel factor analysis (PARAFAC) could be intended to detect underlying discriminant features (Ammari et al., 2015; Botelho et al., 2017). Other chemometric analyses, such as support vector machine (SVM), artificial neural network (ANN), extreme gradient boosting (XGBoost), or random forest (RF) could be good options for building even more efficient discriminant models. The use of such artificial intelligence approaches have proven to outperform traditional statistical techniques (Bae et al., 2021). Evenly, combining front-face fluorescence spectroscopy technique with another approach and using multivariate analysis methods could strengthen model performance. Absorption spectra coupled with fluorescence measurements allowed efficient classification of wines depending on their variety (Carbonaro et al., 2019). Multiblock chemometric approaches are also appropriate for such purpose. A study was conducted by Hernández-Sánchez et al. (2021) to characterize polyphenol content in virgin olive oil, upon analysis of front-face fluorescence spectroscopy and absorbance spectroscopy with the multiblock sequential and orthogonalized partial least squares (SO-PLS) method. This latter chemometric method also provided sensory poles classification of chocolate and cocoa beans by combining proton transfer reaction-time of flight-mass spectrometry (PTR-ToF-MS), near infrared spectroscopy (NIRS) and front-face fluorescence spectroscopy (Biancolillo et al., 2021). Feature selection in multi-way datasets was investigated to reduce the high amount of variables involved when combining different analytical techniques. Indeed, Biancolillo et al. (2020) developed sequential and orthogonalized covariance selection (SO-CovSel) method and proved its suitability for prediction models.
Amongst selected features that came out, hypotheses can be stated concerning the fluorescent compounds related to them. Figure 10 and Table 2 summarize fluorescent properties of product possibly corresponding to fluorescent patterns of our fruit samples. It is based on the previous work realized by Christensen et al. (2006) and completed with other studies, as mentioned below.
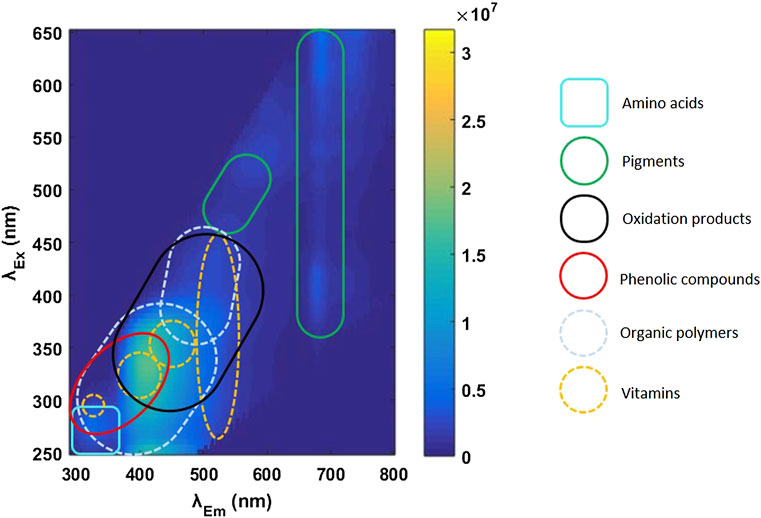
FIGURE 10. Mapping of potential fluorophores found in fruit samples. As an example, the current map is designed from a front-face fluorescence spectrum of fruit skin samples measured with the 250–650 nm excitation wavelength (λEx) and 290–800 nm emission wavelength (λEm) ranges. Dark blue regions indicate no fluorescence; yellow regions reflect the presence of fluorophores.
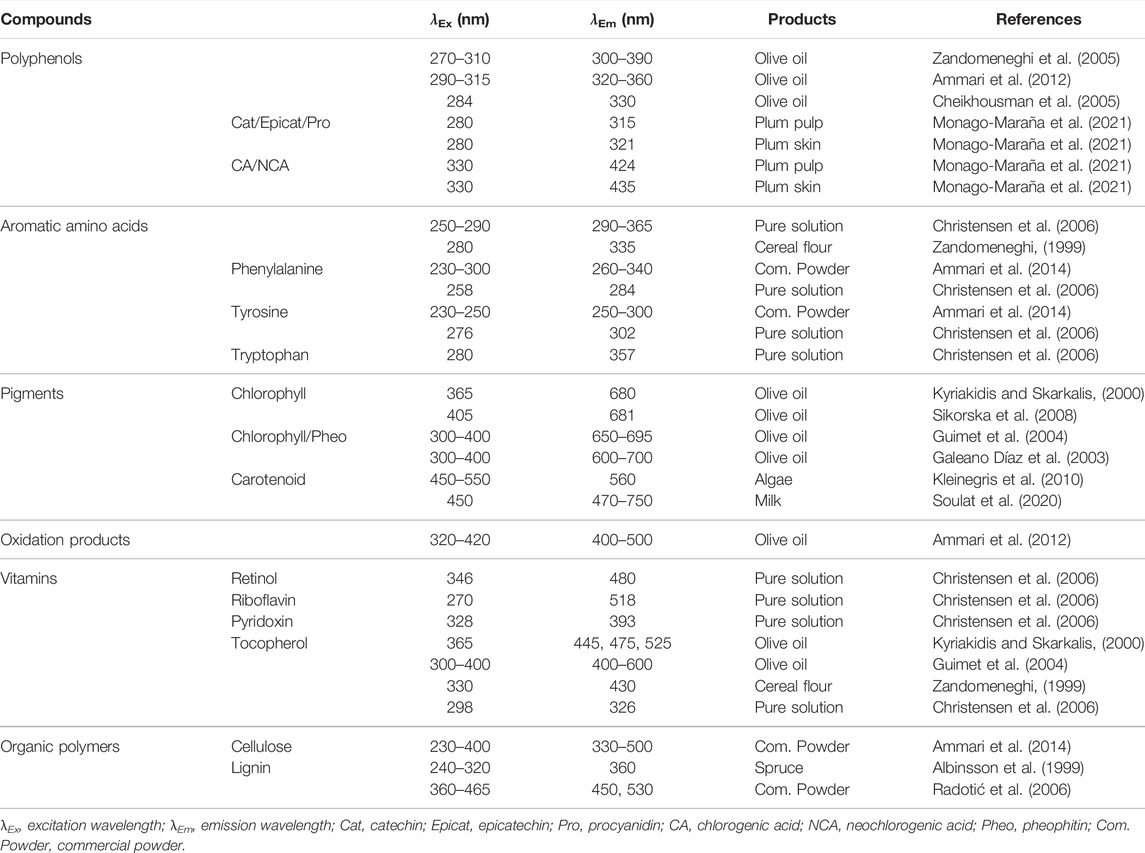
TABLE 2. Fluorescent properties of compounds possibly detected in fruit sample.
As described by Airado-Rodríguez et al. (2011), phenolic compounds have typical excitation and emission wavelengths. Many phenolic compounds, such as chlorogenic, caffeic, ferulic and coumaric acids, are known to accumulate in plants as a defense against pathogens (Lattanzio et al., 2006; Quideau et al., 2011; Barral et al., 2017). We can thus assume that some fluorescent regions may result from an increasing biosynthesis of phenolic compounds. Monago-Maraña et al. (2021) investigated fluorescence spectra obtained from pulp and skin extract of plum samples. They found maximum fluorescence intensity at 321 nm for skin samples and 315 nm for pulp samples upon 280 nm excitation. This area is typical of catechin, epicatechin and procyanidin, which are main plum polyphenols. When excitation wavelength was 330 nm, maximum fluorescence emission corresponding to chlorogenic and neochlorogenic acids were observed at 424 and 435 nm for skin and pulp samples, respectively. This is in accordance with studies that described polyphenols of olive oil measured within excitation range 270–310 nm and emission range 300–390 nm (Cheikhousman et al., 2005; Zandomeneghi et al., 2005). However, Ammari et al. (2012) associated olive oil polyphenols to excitation range 290–315 nm and emission ranges 320–360 nm. Similar fluorescent regions were observed in fruit pulp and skin samples in the present study, suggesting an increased in polyphenol content induced by fruit internal disorder, e.g., catechin, epicatechin, procyanidin, chlorogenic, and neochlorogenic acids.
Amino acids fluorescence has been broadly investigated in food samples. Excitation wavelengths varying from 250 to 290 nm resulted in emission between 290 and 365 nm. For example, Zandomeneghi (1999) described excitation and emission maxima for cereal flour at 280 and 335 nm, respectively. More specifically, pure solutions of aromatic amino acids tyrosine, tryptophan and phenylalanine had excitation-emission maxima at 276–302 nm, 280–357 nm and 258–284 nm, respectively, (Christensen et al., 2006). This is in accordance with results found by Ammari et al. (2014). Phenylalanine acts as a precursor for the synthesis of many phenolic compounds. In the present study, emission range started from 290 nm, but the residual fluorescence band measured around 250–290 nm could be due to phenylalanine presence.
Fluorescent properties of pigments have also been discussed, notably chlorophylls which possess emission fluorescence above 570 nm (Kyriakidis and Skarkalis, 2000). Carotenoids have been measured between 450 and 550 nm as excitation range, and emitted fluorescence around 560 nm (Kleinegris et al., 2010; Soulat et al., 2020). When excited between 300 and 450 nm, olive oil exhibited fluorescence in the 600–700 nm range corresponding to chlorophylls and pheophitins (Galeano Díaz et al., 2003; Guimet et al., 2004; Sikorska et al., 2008). In the same excitation wavelengths, olive oil oxidation products fluoresce between 400 and 500 nm (Ammari et al., 2012), whereas emission peaks at 445, 475, and 525 nm are attributed to vitamin E (Kyriakidis and Skarkalis, 2000; Guimet et al., 2004). Similar observations were made by Zandomeneghi (1999) concerning excitation and emission maxima of vitamin E (tocopherols) in cereal flour at 330 and 430 nm, respectively. However, Christensen et al. (2006) cited 298 nm as maximum excitation and 326 nm as maximum emission values of pure solution of vitamin E. Likewise, vitamin A (retinol), vitamin B2 (riboflavin) and vitamin B6 (pyridoxin) had excitation-emission maxima of 346–480, 270–518, and 328–393 nm, respectively. Therefore, in the present study, it can be hypothesized that the fluorescent area observed between the 350–650 nm excitation and 680–780 nm emission ranges correspond to pigments, whereas fluorophores characterized in the 270–400 nm excitation and 380–550 nm emission wavelengths could be associated to vitamins.
Finally, cellulose, the main constituent of plant cell wall, is an organic polymer with fluorescent properties. Commercial powder of cellulose gave fluorescence emission divided in three signals from 330 to 500 nm, resulting from an excitation between 230 and 400 nm (Ammari et al., 2014). In the same study, no fluorescence was determined for lignin, another organic compound. Although, previous studies showed that lignin fluoresces. Albinsson et al. (1999) described a maximum fluorescence emission at 360 nm corresponding to excitation range from 240 to 320 nm. Radotić et al. (2006) indicated maxima of peak emission at 450 and 530 nm when excitation wavelengths varied from 360 to 465 nm, explained by the presence of two different fluorophores originating from lignin fluorescence. In the present work, the main emitting fluorescence could originate from organic polymers, i.e., excitation and emission ranges comprised between 270–400 and 380–550 nm, respectively. This is in accordance with fruit composition since cellulose and lignin are major fruit skin components (Campos et al., 2020; Mamat et al., 2021).
For accurate identification of compounds corresponding to the diverse variables selected by N-CovSel models, analytical methods must be conducted. Metabolomic analysis, such as mass spectrometry coupled with gas chromatography (GC-MS) or liquid chromatography (LC-MS), would help to characterize and quantify compounds that may play a role in class sample separation due to fruit disorder (Ibáñez et al., 2014; Oak et al., 2019; Wang et al., 2021).
Fluorescence spectroscopy offers promising results in fruit internal disorder detection since this rapid, non-destructive, cost-effective and highly sensitive technique demonstrated its efficiency in classification coupled to multivariate analysis. The present study opens possibilities regarding sample classification using only few specific and well-selected features from front-face fluorescence spectra. It appeared that the most relevant features extracted with N-CovSel method were those in the 250–450 and 600–700 nm parts of both excitation-emission spectra. The formers are probably correlated to amino acids, phenolic compounds and oxidation products, whereas the latters are more likely related to pigments. These encouraging results obtained on ground freeze-dried fruit samples should be assessed on fresh fruit samples to test the reliability of models in a real agricultural or industrial context, where reliable results are expected instantly. Research capabilities are propelling us into a daily life fulfilled of advancements, such as portable smartphone based spectrometer (Mai and Le, 2020), which enable applications of spectroscopy in even more numerous fields.
The datasets presented in this article are not readily available because of confidentiality restrictions. Requests to access the datasets should be directed to bG9ycmFpbmUubGF0Y2hvdW1hbmVAY2lyYWQuZnI=.
LL designed and performed the experiment, collected the data, analyzed the results and wrote the manuscript. J-MR conceptualized, supervized and revized chemometric analysis and interpretation of the results. KA helped with spectral data acquisition and supervized spectral analysis. JM helped performing the experiment. All authors reviewed the manuscript.
The authors declare that the research was conducted in the absence of any commercial or financial relationships that could be construed as a potential conflict of interest.
All claims expressed in this article are solely those of the authors and do not necessarily represent those of their affiliated organizations, or those of the publisher, the editors, and the reviewers. Any product that may be evaluated in this article, or claim that may be made by its manufacturer, is not guaranteed or endorsed by the publisher.
Authors thank Exotic Boyer Réunion for providing fruits and ChemHouse Research Group for hosting during chemometric analysis and providing useful discussions. Association National Recherche Technologie (ANRT) and Exotic Boyer Réunion are thanked for the funding.
Airado-Rodríguez, D., Durán-Merás, I., Galeano-Díaz, T., and Wold, J. P. (2011). Front-face Fluorescence Spectroscopy: A New Tool for Control in the Wine Industry. J. Food Compost. Anal. 24, 257–264. doi:10.1016/j.jfca.2010.10.005
Albinsson, B., Li, S., Lundquist, K., and Stomberg, R. (1999). The Origin of Lignin Fluorescence. J. Mol. Struct. 508, 19–27. doi:10.1016/S0022-2860(98)00913-2
Ali, H., Iqbal, M. A., Atta, B. M., Ullah, R., and Khan, M. B. (2020). Phenolic Profile and Thermal Stability of Monovarietal Extra Virgin Olive Oils Based on Synchronous Fluorescence Spectroscopy. J. Fluoresc 30, 939–947. doi:10.1007/s10895-020-02538-7
Allegrini, F., and Olivieri, A. C. (2013). An Integrated Approach to the Simultaneous Selection of Variables, Mathematical Pre-processing and Calibration Samples in Partial Least-Squares Multivariate Calibration. Talanta 115, 755–760. doi:10.1016/j.talanta.2013.06.051
Ammari, F., Bendoula, R., Jouan-Rimbaud Bouveresse, D., Rutledge, D. N., and Roger, J.-M. (2014). 3D Front Face Solid-phase Fluorescence Spectroscopy Combined with Independent Components Analysis to Characterize Organic Matter in Model Soils. Talanta 125, 146–152. doi:10.1016/j.talanta.2014.02.049
Ammari, F., Cordella, C. B. Y., Boughanmi, N., and Rutledge, D. N. (2012). Independent Components Analysis Applied to 3D-Front-Face Fluorescence Spectra of Edible Oils to Study the Antioxidant Effect of Nigella Sativa L. Extract on the thermal Stability of Heated Oils. Chemom. Intell. Lab. Syst. 113, 32–42. doi:10.1016/j.chemolab.2011.06.005
Ammari, F., Redjdal, L., and Rutledge, D. N. (2015). Detection of orange Juice Frauds Using Front-Face Fluorescence Spectroscopy and Independent Components Analysis. Food Chem. 168, 211–217. doi:10.1016/j.foodchem.2014.06.110
Andersen, C. M., Vishart, M., and Holm, V. K. (2005). Application of Fluorescence Spectroscopy in the Evaluation of Light-Induced Oxidation in Cheese. J. Agric. Food Chem. 53, 9985–9992. doi:10.1021/jf051143d
Azcarate, S. M., de Araújo Gomes, A., Alcaraz, M. R., Ugulino de Araújo, M. C., Camiña, J. M., and Goicoechea, H. C. (2015). Modeling Excitation-Emission Fluorescence Matrices with Pattern Recognition Algorithms for Classification of Argentine white Wines According Grape Variety. Food Chem. 184, 214–219. doi:10.1016/j.foodchem.2015.03.081
Bae, C.-Y., Im, Y., Lee, J., Park, C.-S., Kim, M., Kwon, H., et al. (2021). Comparison of Biological Age Prediction Models Using Clinical Biomarkers Commonly Measured in Clinical Practice Settings: AI Techniques vs. Traditional Statistical Methods. Front. Anal. Sci. 1, 8. doi:10.3389/frans.2021.709589
Bai, Y., Xiong, Y., Huang, J., Zhou, J., and Zhang, B. (2019). Accurate Prediction of Soluble Solid Content of Apples from Multiple Geographical Regions by Combining Deep Learning with Spectral Fingerprint Features. Postharvest Biol. Technol. 156, 110943. doi:10.1016/j.postharvbio.2019.110943
Barral, B., Chillet, M., Minier, J., Léchaudel, M., and Schorr-Galindo, S. (2017). Evaluating the Response to Fusarium Ananatum Inoculation and Antifungal Activity of Phenolic Acids in Pineapple. Fungal Biol. 121, 1045–1053. doi:10.1016/j.funbio.2017.09.002
Bauriegel, E., and Herppich, W. (2014). Hyperspectral and Chlorophyll Fluorescence Imaging for Early Detection of Plant Diseases, with Special Reference to Fusarium Spec. Infections on Wheat. Agriculture 4, 32–57. doi:10.3390/agriculture4010032
Biancolillo, A., Marini, F., and Roger, J.-M. (Forthcoming 2022). N-CovSel, a New Strategy for Feature Selection in N-Way Data. Subm. Anal. Chim. Acta.
Biancolillo, A., Marini, F., and Roger, J. M. (2020). SO‐CovSel: A Novel Method for Variable Selection in a Multiblock Framework. J. Chemom. 34, e3120. doi:10.1002/cem.3120
Biancolillo, A., Preys, S., Gaci, B., Le-Quere, J.-L., Laboure, H., Deuscher, Z., et al. (2021). Multi-block Classification of Chocolate and cocoa Samples into Sensory Poles. Food Chem. 340, 127904. doi:10.1016/j.foodchem.2020.127904
Bose, A. (2016). Interaction of tea Polyphenols with Serum Albumins: A Fluorescence Spectroscopic Analysis. J. Lumin. 169, 220–226. doi:10.1016/j.jlumin.2015.09.018
Botelho, B. G., Oliveira, L. S., and Franca, A. S. (2017). Fluorescence Spectroscopy as Tool for the Geographical Discrimination of Coffees Produced in Different Regions of Minas Gerais State in Brazil. Food Control 77, 25–31. doi:10.1016/j.foodcont.2017.01.020
Botosoa, E. P., and Karoui, R. (2022). 3D Front Face Fluorescence Spectroscopy as a Tool for Monitoring the Oxidation Level of Edible Vegetable Oil during Storage at 60 °C. LWT 154, 112659. doi:10.1016/j.lwt.2021.112659
Bro, R. (1996). Multiway Calibration. Multilinear PLS. J. Chemometrics 10, 47–61. doi:10.1002/(sici)1099-128x(199601)10:1<47::aid-cem400>3.0.co;2-c
Cabrera-Bañegil, M., Hurtado-Sánchezdel, M. d. C. C., Galeano-Díaz, T., and Durán-Merás, I. (2017). Front-face Fluorescence Spectroscopy Combined with Second-Order Multivariate Algorithms for the Quantification of Polyphenols in Red Wine Samples. Food Chem. 220, 168–176. doi:10.1016/j.foodchem.2016.09.152
Cabrera-Bañegil, M., Valdés-Sánchez, E., Moreno, D., Airado-Rodríguez, D., and Durán-Merás, I. (2019). Front-face Fluorescence Excitation-Emission Matrices in Combination with Three-Way Chemometrics for the Discrimination and Prediction of Phenolic Response to Vineyard Agronomic Practices. Food Chem. 270, 162–172. doi:10.1016/j.foodchem.2018.07.071
Campos, D. A., Ribeiro, T. B., Teixeira, J. A., Pastrana, L., and Pintado, M. M. (2020). Integral Valorization of Pineapple (Ananas Comosus L.) By-Products through a Green Chemistry Approach towards Added Value Ingredients. Foods 9, 60. doi:10.3390/foods9010060
Carbonaro, C. M., Corpino, R., Chiriu, D., Ricci, P. C., Rivano, S., Salis, M., et al. (2019). Exploiting Combined Absorption and Front Face Fluorescence Spectroscopy to chase Classification: A Proof of Concept in the Case of Sardinian Red Wines. Spectrochim. Acta A: Mol. Biomol. Spectrosc. 214, 378–383. doi:10.1016/j.saa.2019.02.041
Cheikhousman, R., Zude, M., Bouveresse, D. J.-R., Léger, C. L., Rutledge, D. N., and Birlouez-Aragon, I. (2005). Fluorescence Spectroscopy for Monitoring Deterioration of Extra virgin Olive Oil during Heating. Anal. Bioanal. Chem. 382, 1438–1443. doi:10.1007/s00216-005-3286-1
Christensen, J., Nørgaard, L., Bro, R., and Engelsen, S. B. (2006). Multivariate Autofluorescence of Intact Food Systems. Chem. Rev. 106, 1979–1994. doi:10.1021/cr050019q
Codrea, M. C., Nevalainen, O. S., Tyystjärvi, E., Vandeven, M., and Valcke, R. (2004). Classifying Apples by the Means of Fluorescence Imaging. Int. J. Patt. Recogn. Artif. Intell. 18, 157–174. doi:10.1142/S0218001404003150
El Ghaziri, A., and Qannari, E. M. (2015). Measures of Association between Two Datasets; Application to Sensory Data. Food Qual. Prefer. 40, 116–124. doi:10.1016/j.foodqual.2014.09.010
Elcoroaristizabal, S., Callejón, R. M., Amigo, J. M., Ocaña-González, J. A., Morales, M. L., and Ubeda, C. (2016). Fluorescence Excitation-Emission Matrix Spectroscopy as a Tool for Determining Quality of Sparkling Wines. Food Chem. 206, 284–290. doi:10.1016/j.foodchem.2016.03.037
Fatemi, A., Singh, V., and Kamruzzaman, M. (2022). Identification of Informative Spectral Ranges for Predicting Major Chemical Constituents in Corn Using NIR Spectroscopy. Food Chem. 383, 132442. doi:10.1016/j.foodchem.2022.132442
Favilla, S., Durante, C., Vigni, M. L., and Cocchi, M. (2013). Assessing Feature Relevance in NPLS Models by VIP. Chemom. Intell. Lab. Syst. 129, 76–86. doi:10.1016/j.chemolab.2013.05.013
Filzmoser, P., Liebmann, B., and Varmuza, K. (2009). Repeated Double Cross Validation. J. Chemom. 23, 160–171. doi:10.1002/cem.1225
Galeano Díaz, T., Durán Merás, I., Correa, C. A., Roldán, B., and Rodríguez Cáceres, M. I. (2003). Simultaneous Fluorometric Determination of Chlorophylls a and B and Pheophytins a and B in Olive Oil by Partial Least-Squares Calibration. J. Agric. Food Chem. 51, 6934–6940. doi:10.1021/jf034456m
Guimet, F., Ferré, J., Boqué, R., and Rius, F. X. (2004). Application of Unfold Principal Component Analysis and Parallel Factor Analysis to the Exploratory Analysis of Olive Oils by Means of Excitation-Emission Matrix Fluorescence Spectroscopy. Anal. Chim. Acta 515, 75–85. doi:10.1016/j.aca.2004.01.008
Hao, S., Li, J., Liu, X., Yuan, J., Yuan, W., Tian, Y., et al. (2021). Authentication of acacia Honey Using Fluorescence Spectroscopy. Food Control 130, 108327. doi:10.1016/j.foodcont.2021.108327
Hernández-Sánchez, N., Lleó, L., Diezma, B., Correa, E. C., Sastre, B., and Roger, J.-M. (2021). Multiblock Analysis Applied to Fluorescence and Absorbance Spectra to Estimate Total Polyphenol Content in Extra Virgin Olive Oil. Foods 10, 2556. doi:10.3390/foods10112556
Huang, Z., Omwange, K. A., Tsay, L. W. J., Saito, Y., Maai, E., Yamazaki, A., et al. (2022). UV Excited Fluorescence Image-Based Non-destructive Method for Early Detection of Strawberry (Fragaria × Ananassa) Spoilage. Food Chem. 368, 130776. doi:10.1016/j.foodchem.2021.130776
Ibáñez, A. M., Martinelli, F., Reagan, R. L., Uratsu, S. L., Vo, A., Tinoco, M. A., et al. (2014). Transcriptome and Metabolome Analysis of Citrus Fruit to Elucidate Puffing Disorder. Plant Sci. 217-218, 87–98. doi:10.1016/j.plantsci.2013.12.003
Kasampalis, D. S., Tsouvaltzis, P., Ntouros, K., Gertsis, A., Gitas, I., and Siomos, A. S. (2021). The Use of Digital Imaging, Chlorophyll Fluorescence and Vis/NIR Spectroscopy in Assessing the Ripening Stage and Freshness Status of bell Pepper Fruit. Comput. Electron. Agric. 187, 106265. doi:10.1016/j.compag.2021.106265
Kassouf, A., El Rakwe, M., Chebib, H., Ducruet, V., Rutledge, D. N., and Maalouly, J. (2014). Independent Components Analysis Coupled with 3D-Front-Face Fluorescence Spectroscopy to Study the Interaction between Plastic Food Packaging and Olive Oil. Anal. Chim. Acta 839, 14–25. doi:10.1016/j.aca.2014.06.035
Kleinegris, D. M. M., van Es, M. A., Janssen, M., Brandenburg, W. A., and Wijffels, R. H. (2010). Carotenoid Fluorescence in Dunaliella salina. J. Appl. Phycol 22, 645–649. doi:10.1007/s10811-010-9505-y
Kyriakidis, N. B., and Skarkalis, P. (2000). Fluorescence Spectra Measurement of Olive Oil and Other Vegetable Oils. J. AOAC Int. 83, 1435–1439. doi:10.1093/jaoac/83.6.1435
Lattanzio, V., Lattanzio, V. M. T., and Cardinali, A. (2006). Role of Phenolics in the Resistance Mechanisms of Plants against Fungal Pathogens and Insects. Phytochem. Adv. Res., 23–67.
Lei, T., and Sun, D.-W. (2020). A Novel NIR Spectral Calibration Method: Sparse Coefficients Wavelength Selection and Regression (SCWR). Analytica Chim. Acta 1110, 169–180. doi:10.1016/j.aca.2020.03.007
Lenhardt, L., Bro, R., Zeković, I., Dramićanin, T., and Dramićanin, M. D. (2015). Fluorescence Spectroscopy Coupled with PARAFAC and PLS DA for Characterization and Classification of Honey. Food Chem. 175, 284–291. doi:10.1016/j.foodchem.2014.11.162
Li, H., Liang, Y., Xu, Q., and Cao, D. (2009). Key Wavelengths Screening Using Competitive Adaptive Reweighted Sampling Method for Multivariate Calibration. Anal. Chim. Acta 648, 77–84. doi:10.1016/j.aca.2009.06.046
Lleó, L., Hernández-Sánchez, N., Ammari, F., and Roger, J.-M. (2016). 3D Front-Face Fluorescence Spectroscopy for Characterization of Extra virgin Olive Oil and Olive Oil According to the Spectral Pattern. Agric. Eng. Int. CIGR J. 18, 190.
Mai, H. H., and Le, T. T. (2020). Testing Edible Oil Authenticity by Using Smartphone Based Spectrometer. Comput. Opt. 44, 189–194. doi:10.18287/2412-6179-CO-604
Mamat, A., Tusong, K., and Xu, J. (2021). Identification of Metabolic Pathways Related to Rough-Skinned Fruit Formation in Korla Pear. Sci. Horticult. 288, 110414. doi:10.1016/j.scienta.2021.110414
Mehmood, T., Liland, K. H., Snipen, L., and Sæbø, S. (2012). A Review of Variable Selection Methods in Partial Least Squares Regression. Chemometrics Intell. Lab. Syst. 118, 62–69. doi:10.1016/j.chemolab.2012.07.010
Momin, M., Kondo, N., Ogawa, Y., Shiigi, T., Kurita, M., and Ninomiya, K. (2010). Machine Vision System for Detecting Fluorescent Area of Citrus Using Fluorescence Image. IFAC Proc. Vol. 43 (26), 241–244. doi:10.3182/20101206-3-jp-3009.00042
Monago-Maraña, O., Cabrera-Bañegil, M., Rodas, N. L., Muñoz de la Peña, A., and Durán-Merás, I. (2021). First-order Discrimination of Methanolic Extracts from Plums According to Harvesting Date Using Fluorescence Spectra. Quantification of Polyphenols. Microchem. J. 169, 106533. doi:10.1016/j.microc.2021.106533
Murphy, K. R., Stedmon, C. A., Graeber, D., and Bro, R. (2013). Fluorescence Spectroscopy and Multi-Way Techniques. PARAFAC. Anal. Methods 5, 6557. doi:10.1039/c3ay41160e
Oak, P., Deshpande, A., Giri, A., and Gupta, V. (2019). Metabolomic Dynamics Reveals Oxidative Stress in Spongy Tissue Disorder during Ripening of Mangifera Indica L. Fruit. Metabolites 9, 255. doi:10.3390/metabo9110255
Phatak, A., and Jong, S. D. (1997). The Geometry of Partial Least Squares. J. Chemom. 11, 28. doi:10.1002/(sici)1099-128x(199707)11:4<311::aid-cem478>3.0.co;2-4
Pistore, L., Pernigotto, G., Cappelletti, F., Gasparella, A., and Romagnoni, P. (2019). A Stepwise Approach Integrating Feature Selection, Regression Techniques and Cluster Analysis to Identify Primary Retrofit Interventions on Large Stocks of Buildings. Sustain. Cities Soc. 47, 101438. doi:10.1016/j.scs.2019.101438
Prendergast, F. G. (1991). Time-resolved Fluorescence Techniques: Methods and Applications in Biology. Curr. Opin. Struct. Biol. 1, 1054–1059. doi:10.1016/0959-440X(91)90105-3
Quideau, S., Deffieux, D., Douat-Casassus, C., and Pouységu, L. (2011). Plant Polyphenols: Chemical Properties, Biological Activities, and Synthesis. Angew. Chem. Int. Ed. 50, 586–621. doi:10.1002/anie.201000044
Radotić, K., Kalauzi, A., Djikanović, D., Jeremić, M., Leblanc, R. M., and Cerović, Z. G. (2006). Component Analysis of the Fluorescence Spectra of a Lignin Model Compound. J. Photochem. Photobiol. B: Biol. 83, 1–10. doi:10.1016/j.jphotobiol.2005.12.001
Robert, J. V., de Gois, J. S., Rocha, R. B., and Luna, A. S. (2022). Direct Solid Sample Analysis Using Synchronous Fluorescence Spectroscopy Coupled with Chemometric Tools for the Geographical Discrimination of Coffee Samples. Food Chem. 371, 131063. doi:10.1016/j.foodchem.2021.131063
Roger, J. M., Palagos, B., Bertrand, D., and Fernandez-Ahumada, E. (2011). CovSel: Variable Selection for Highly Multivariate and Multi-Response Calibration. Chemom. Intell. Lab. Syst. 106, 216–223. doi:10.1016/j.chemolab.2010.10.003
Rutledge, D. N., Roger, J.-M., and Lesnoff, M. (2021). Different Methods for Determining the Dimensionality of Multivariate Models. Front. Anal. Sci. 1, 754447. doi:10.3389/frans.2021.754447
Saad, R., Bouveresse, D. J.-R., Locquet, N., and Rutledge, D. N. (2016). Using pH Variations to Improve the Discrimination of Wines by 3D Front Face Fluorescence Spectroscopy Associated to Independent Components Analysis. Talanta 153, 278–284. doi:10.1016/j.talanta.2016.03.023
Sahar, A., Boubellouta, T., Portanguen, S. p., Kondjoyan, A., and Dufour, r. (2009). Synchronous Front-Face Fluorescence Spectroscopy Coupled with Parallel Factors (PARAFAC) Analysis to Study the Effects of Cooking Time on Meat. J. Food Sci. 74, E534–E539. doi:10.1111/j.1750-3841.2009.01365.x
Sahar, A., Rahman, U. u., Kondjoyan, A., Portanguen, S., and Dufour, E. (2016). Monitoring of thermal Changes in Meat by Synchronous Fluorescence Spectroscopy. J. Food Eng. 168, 160–165. doi:10.1016/j.jfoodeng.2015.07.038
Santos, I. d., Bosman, G., Aleixandre-Tudo, J. L., and du Toit, W. (2022). Direct Quantification of Red Wine Phenolics Using Fluorescence Spectroscopy with Chemometrics. Talanta 236, 122857. doi:10.1016/j.talanta.2021.122857
Sergiel, I., Pohl, P., Biesaga, M., and Mironczyk, A. (2014). Suitability of Three-Dimensional Synchronous Fluorescence Spectroscopy for Fingerprint Analysis of Honey Samples with Reference to Their Phenolic Profiles. Food Chem. 145, 319–326. doi:10.1016/j.foodchem.2013.08.069
Sikorska, E., Khmelinskii, I. V., Sikorski, M., Caponio, F., Bilancia, M. T., Pasqualone, A., et al. (2008). Fluorescence Spectroscopy in Monitoring of Extra virgin Olive Oil during Storage. Int. J. Food Sci. Technol. 43, 52–61. doi:10.1111/j.1365-2621.2006.01384.x
Sikorska, E., Wójcicki, K., Kozak, W., Gliszczyńska-Świgło, A., Khmelinskii, I., Górecki, T., et al. (2019). Front-Face Fluorescence Spectroscopy and Chemometrics for Quality Control of Cold-Pressed Rapeseed Oil during Storage. Foods 8, 665. doi:10.3390/foods8120665
Soares, S. F. C., Gomes, A. A., Araujo, M. C. U., Filho, A. R. G., and Galvão, R. K. H. (2013). The Successive Projections Algorithm. Trac Trends Anal. Chem. 42, 84–98. doi:10.1016/j.trac.2012.09.006
Soulat, J., Andueza, D., Graulet, B., Girard, C. L., Labonne, C., Aït-Kaddour, A., et al. (2020). Comparison of the Potential Abilities of Three Spectroscopy Methods: Near-Infrared, Mid-infrared, and Molecular Fluorescence, to Predict Carotenoid, Vitamin and Fatty Acid Contents in Cow Milk. Foods 9, 592. doi:10.3390/foods9050592
Tan, J., Li, R., and Jiang, Z.-T. (2015). Chemometric Classification of Chinese Lager Beers According to Manufacturer Based on Data Fusion of Fluorescence, UV and Visible Spectroscopies. Food Chem. 184, 30–36. doi:10.1016/j.foodchem.2015.03.085
Tan, J., Li, R., Jiang, Z.-T., Tang, S.-H., Wang, Y., Shi, M., et al. (2017). Synchronous Front-Face Fluorescence Spectroscopy for Authentication of the Adulteration of Edible Vegetable Oil with Refined Used Frying Oil. Food Chem. 217, 274–280. doi:10.1016/j.foodchem.2016.08.053
Wang, H., Wang, S., Fan, M.-M., Zhang, S.-H., Sun, L.-L., and Zhao, Z.-Y. (2021). Metabolomic Insights into the browning of the Peel of Bagging 'Rui Xue' Apple Fruit. BMC Plant Biol. 21, 209. doi:10.1186/s12870-021-02974-y
Xue, S.-S., Tan, J., Xie, J.-Y., and Li, M.-F. (2021). Rapid, Simultaneous and Non-destructive Determination of maize Flour and Soybean Flour Adulterated in Quinoa Flour by Front-Face Synchronous Fluorescence Spectroscopy. Food Control 130, 108329. doi:10.1016/j.foodcont.2021.108329
Yun, Y.-H., Bin, J., Liu, D.-L., Xu, L., Yan, T.-L., Cao, D.-S., et al. (2019). A Hybrid Variable Selection Strategy Based on Continuous Shrinkage of Variable Space in Multivariate Calibration. Anal. Chim. Acta 1058, 58–69. doi:10.1016/j.aca.2019.01.022
Zandomeneghi, M., Carbonaro, L., and Caffarata, C. (2005). Fluorescence of Vegetable Oils: Olive Oils. J. Agric. Food Chem. 53, 759–766. doi:10.1021/jf048742p
Zandomeneghi, M. (1999). Fluorescence of Cereal Flours. J. Agric. Food Chem. 47, 878–882. doi:10.1021/jf981047v
Zhao, R., An, L., Song, D., Li, M., Qiao, L., Liu, N., et al. (2021). Detection of Chlorophyll Fluorescence Parameters of Potato Leaves Based on Continuous Wavelet Transform and Spectral Analysis. Spectrochim. Acta Part A: Mol. Biomol. Spectrosc. 259, 119768. doi:10.1016/j.saa.2021.119768
Keywords: variable selection, N-CovSel, PLS, chemometrics, fluorescence spectroscopy, internal disorder detection
Citation: Latchoumane L, Alary K, Minier J, Davrieux F, Lugan R, Chillet M and Roger J-M (2022) Front-Face Fluorescence Spectroscopy and Feature Selection for Fruit Classification Based on N-CovSel Method. Front. Anal. Sci. 2:867527. doi: 10.3389/frans.2022.867527
Received: 01 February 2022; Accepted: 09 March 2022;
Published: 04 April 2022.
Edited by:
M. C. Ortiz, Universidad de Burgos, SpainReviewed by:
Luis Sarabia, University of Burgos, SpainCopyright © 2022 Latchoumane, Alary, Minier, Davrieux, Lugan, Chillet and Roger. This is an open-access article distributed under the terms of the Creative Commons Attribution License (CC BY). The use, distribution or reproduction in other forums is permitted, provided the original author(s) and the copyright owner(s) are credited and that the original publication in this journal is cited, in accordance with accepted academic practice. No use, distribution or reproduction is permitted which does not comply with these terms.
*Correspondence: Lorraine Latchoumane, bG9ycmFpbmUubGF0Y2hvdW1hbmVAY2lyYWQuZnI=
Disclaimer: All claims expressed in this article are solely those of the authors and do not necessarily represent those of their affiliated organizations, or those of the publisher, the editors and the reviewers. Any product that may be evaluated in this article or claim that may be made by its manufacturer is not guaranteed or endorsed by the publisher.
Research integrity at Frontiers
Learn more about the work of our research integrity team to safeguard the quality of each article we publish.