- 1Pharmaceutical Analysis, Department of Pharmaceutical and Pharmacological Sciences, KU Leuven—University of Leuven, Leuven, Belgium
- 2Sterigenics NV, A Sotera Health Division, Oak Brook, IL, United States
- 3Drug Delivery and Disposition, Department of Pharmaceutical and Pharmacological Sciences, KU Leuven—University of Leuven, Leuven, Belgium
Sterilization is a pivotal topic in the pharmaceutical industry, whereby the nomenclature of “sterile” refers to the absence of viable microorganisms. Since microorganisms can reproduce in the body and cause potentially fatal infections, it is critical to sterilize parenteral products to prevent this. In recent years, 70%–90% of potential drugs and 40% of marketed drugs have demonstrated a low solubility. Micronization is a widely spread approach to increase the dissolution rate. A subset of micronized products require sterilization, but published studies on the effects of sterilization on micronized products are currently lacking. The effect of sterilization on the micronized active pharmaceutical ingredient indomethacin was explored in this study. The sterilization methods in scope were one photon-based method using gamma irradiation and one gas-based method with nitrogen dioxide gas. Indomethacin was micronized using two micronization techniques, cryomilling and spray drying. Different conditions were used for cryomilling where the number of grinding balls in the ball mill and the degree of filling were varied. The solid state of all samples was evaluated after micronization, and only the effectively micronized samples were selected for sterilization with gamma rays and nitrogen dioxide. Gamma irradiation was performed with the active pharmaceutical ingredient stored at −80°C at a commonly used industry standard target dose of 25 kGy. Nitrogen dioxide sterilization took place at 21°C, a concentration of 10 mg/L, a relative humidity of 30% and using two NO2 pulses. Before and after sterilization, all samples were analyzed by high performance liquid chromatography with UV detection, whereby the assay of indomethacin was examined as well as the peak purity and the formation of impurities. In comparison to the non-micronized reference, both sterilization methods demonstrate a significant decrease of content of micronized samples and an increase of the impurity profile. The non-micronized sample showed no significant difference after sterilization. It could be observed that micronized indomethacin samples demonstrate more degradation and are subsequently more susceptible to degradation upon sterilization with gamma rays and nitrogen dioxide gas, driving towards the need for assessment of the micronization impact combined with sterilization approach.
1 Introduction
In recent years, 70%–90% of potential drugs and 40% of marketed drugs belong to biopharmaceutical classification system (BCS) class II or class IV (Moschwitzer, 2006; Di et al., 2012; Williams et al., 2013; Vandana et al., 2014; Nikolakakis and Partheniadis, 2017). Class II drugs display high permeability but low solubility, while class IV drugs have both low permeability and solubility (Fda, 2021). Due to these properties, the oral bioavailability is low and variable, which means that potential drugs are lost during pharmacological screening and pharmacokinetic studies (Chaumeil, 1998; Vandana et al., 2014; Dhiman and Prabhakar, 2021). However, this problem can be solved by various strategies including micronization, a process which reduces the particle size of a product to less than 10 μm (Vandana et al., 2014). It enhances the dissolution rate which improves the oral bioavailability (Chaumeil, 1998; Vandana et al., 2014). Various micronization techniques are available such as spray drying, ball milling and the use of supercritical fluids (Vandana et al., 2014).
Some of these micronized products are utilized in parenteral preparations and therefore they must be sterilized (Rutala and Weber, 2013). Sterile means free from viable micro-organisms (Croonenborghs, 2019). Because absolute sterility is impossible to achieve without sterility testing of all products, a degree of sterility is commonly used to assess whether the drug product is sterile, as defined by European standards (Croonenborghs, 2019). The sterility assurance level (SAL) describes the degree of sterility assurance. A SAL of 10–6 is frequently used, which implies that after sterilization, the acceptable risk is that on average one product in 1,000 000 may include a viable microorganism (Croonenborghs, 2019). These microorganisms have the potential to multiply in the body and induce infection, which can be fatal (Rutala and Weber, 2013; Croonenborghs, 2019). It is therefore of utmost importance to prevent the latter by sterilizing products or, where terminal sterilization is not possible, by aseptic manufacturing. Many sterilization techniques are available to obtain sterile products including steam sterilization, dry heat sterilization, ionization radiation sterilization, gas sterilization, sterile filtration and aseptic processing (European Medicines Agency, 2019).
Since published studies on the effects of sterilization on micronized products are currently lacking, it was decided to explore the effect of sterilization on the micronized active pharmaceutical ingredient (API) indomethacin. There are three reasons why indomethacin was selected for this study. It is readily available, its micronization process is well understood and it is a Class II drug with a low solubility. Indomethacin is a non-steroidal anti-inflammatory drug (NSAID) (Katz, 1981; Indometacin, 2021). In general, indomethacin powder is stable for at least 5 years at room temperature (O’Brien et al., 1984). In solution, it is stable in neutral and slightly acidic media. Exposure to strong direct sunlight induces an increase in the color of indomethacin (O’Brien et al., 1984).
This study focusses on gamma irradiation sterilization and nitrogen dioxide sterilization. Gamma irradiation sterilization is a sterilization technique in which gamma rays provide the sterilizing effect. Gamma rays are electromagnetic waves with a short wavelength and therefore a high energy, that can be formed by the radioactive decay of atomic nuclei of Cobalt-60 (60Co) (da Silva Aquino and Adrovic, 2012; Bürkle GmbH, 2021; Tuttnauer. Sterilization by Gamma Irradiation, 2021; Trends in radiation sterilization, 2008; Silindir and Özer, 2009; Ast, 2021). The unstable core of 60Co emits photons of 1.17 and 1.33 MeV while it decays to stable 60Ni (da Silva Aquino and Adrovic, 2012; Trends in radiation sterilization, 2008). The absorbed dose is expressed in kiloGray (kGy), the absorbed energy per unit mass (J/kg = Gy) (da Silva Aquino and Adrovic, 2012; Bürkle GmbH, 2021; Ast, 2021). This dose is determined not only by the mass density and package size of the product, but also by the dose rate, exposure time and facility design (da Silva Aquino and Adrovic, 2012; Bürkle GmbH, 2021; Ast, 2021). To obtain a sterile product, a minimum dose of 25 kGy is often used to sterilize pharmaceutical products (da Silva Aquino and Adrovic, 2012; Trends in radiation sterilization, 2008; Silindir and Özer, 2009; Merkli et al., 1994; Hasanain et al., 2014). Gamma rays consist of high-energy photons that can form free radicals and cleave chemical bonds (da Silva Aquino and Adrovic, 2012; Bürkle GmbH, 2021; Hasanain et al., 2014; Harrell et al., 2018). The RNA or DNA of the microorganism is affected directly (by the rays) or indirectly (by the formed radicals), which causes a single or double strand break (da Silva Aquino and Adrovic, 2012; Bürkle GmbH, 2021; Tuttnauer. Sterilization by Gamma Irradiation, 2021; Hasanain et al., 2014; Harrell et al., 2018).
Nitrogen dioxide sterilization involves the use of nitrogen dioxide (NO2) gas, a strong oxidizer which eliminates microorganisms (Villamena, 2016). NO2 and N2O4 are in equilibrium in the gaseous form (Overview of the Nitrogen Dioxide, 2022). In the presence of water, N2O4 undergoes a series of chemical reactions that result in the formation of NO•. The interaction between NO• and NO2• produces N2O3, which ensures the deamination of RNA or DNA nucleotides. Subsequently, the primary amine functionalities are nitrosated resulting in an RNA or DNA single or double strand break (Görsdorf et al., 1990; Caulfield et al., 1998; Bermúdez et al., 1999; McDonnell and Hansen, 2020; Noxilizer 2022; Overview of the Nitrogen Dioxide, 2022). The sterilization process with NO2 gas depends on the NO2 concentration, relative humidity, temperature and exposure time. The concentration might range from 1 to 20 mg/L, with a standard operating concentration at 10 mg/L. The relative humidity usually spans from 40% to 80%, but when the humidity is low, the sterilizing process requires a longer exposure time. The temperature can range from 10°C to 30°C, where the standard working temperature is 21°C. The exposure period can vary from 3h to 12h, including aeration (Noxilizer, 2022).
This research used two different micronization techniques. Cryomilling is a ball mill micronization process that is carried out at a low temperature (RETSCH, 2021). The grinding jar is cooled to ca. −196°C by liquid nitrogen supplied continuously before and during the micronization (Junghare et al., 2017; RETSCH, 2021). This process is mainly used for heat sensitive, elastic and plastic deforming substances (Junghare et al., 2017; RETSCH, 2021). Micronization occurs when the grinding jar of the cryomill performs a radial oscillation in horizontal position (Junghare et al., 2017; RETSCH, 2021). The grinding jar contains one or more grinding balls that move and collide with the sample with high energy, causing the sample to pulverize (RETSCH, 2021). The second micronization technique is spray drying. During this process, micronized powder is produced by quickly drying a nebulized solution of the drug with heated gas (Verma and Singh, 2015; Santos et al., 2018; Freund, 2021). The gas may be air but if the solvent of the solution is flammable, an inert gas such as nitrogen may be used (Freund, 2021).
The aim of this study was to investigate the effect of sterilization on different micronized indomethacin samples. This was achieved by performing high performance liquid chromatography (HPLC) analyses with Ultraviolet detection to examine the content of indomethacin in accordance with the monograph of the European Pharmacopoeia (Ph. Eur.). (Indometacin, 2021). The content of micronized/micronized and sterilized indomethacin was statistically compared with the reference indomethacin which was neither micronized nor sterilized. Additionally, the peak purity was investigated using the Ph. Eur. Method supplemented with a diode array detector, and a number of indomethacin impurities were visually checked with yet another HPLC method.
2 Materials and methods
2.1 Chemical products, reagents and samples
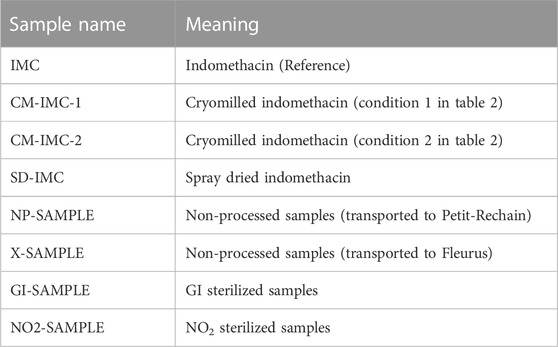
Indomethacin of Ph. Eur. Quality from Fagron (Nazareth, Belgium, 98.8% m/m) was used for this project. Table 1 lists the different indomethacin samples that were examined.
The mobile phase for assay determination and peak purity contained acetonitrile (ACN) from Thermo Fisher Scientific (Shanghai, China, 99.9%), Milli-Q water prepared by Milli-Q Gradient Q-Gard one Purification Pack from Merck Millipore (Darmstadt, Germany) and glacial acetic acid from VWR Chemicals (Fontenay-sous-Bois, France, 99.8%). The mobile phase for impurities consisted of methanol from Acros Organics (Trinidad and Tobago, 99.8%), Milli-Q water stated earlier and phosphoric acid from Acros Organics (Geel, Belgium, 85%).
Dichloromethane from Fisher chemical (Schwerte, Germany, 99.8%) was used to nebulize the indomethacin solution during spray drying.
Indomethacin impurities B, F, G, H, I and J from Simsom Pharma Limited (Mumbai, India) were used to identify the impurities in the samples.
2.2 Equipment, experimental conditions and methods
2.2.1 Micronization
Two techniques were used to micronize indomethacin (Vandana et al., 2014). Cryomilling was performed using a Cryogenic Mixer Mill CryoMill from Retsch Gmbh (Haan, Germany). Initially four different conditions were used (see Table 2). The number of grinding balls and degree of filling were varied while the time, frequency and size of grinding balls remained constant. After micronization, indomethacin was stored at −80°C in the presence of silicagel as drying agent (Moschwitzer, 2006). Spray drying was carried out using a B-290 Mini Spray Dryer from BÜCHI Labortechnik AG (Flawil, Switzerland). The conditions are shown in Table 3. About 5 g of indomethacin was dissolved in 175 mL of dichloromethane to form the nebulized solution. Micronized indomethacin was stored at −80°C.
After micronization, scanning electron microscopy (SEM), differential scanning calorimetry (DSC) and X-ray powder diffraction (XRPD) were performed on all micronized samples to determine whether the samples were indeed micronized and to determine the solid state properties.
The SEM imaging was performed using an XL30 ESEM-FEG from Philips (Eindhoven, Netherlands) equipped with a Schottky field emission electron gun and a conventional Everhart-Thornley secondary electron detector. The software used was XL Electron Microscopes Version 7.0 from FEI Company (Eindhoven, Netherlands). The acceleration voltage varied from 5 kV to 12 kV and the spot size was set at 3. Prior to analyses, samples have been gold coated with a SCD-030 Balzers Union sputtercoater from Oerlikon Balzers (Balzers, Liechtenstein).
The DSC analysis was carried out using a Q2000 Differential Scanning Calorimeter equipped with Universal Analysis 2000 version 4.5 A software, both from TA Instruments (Brussels, Belgium). Samples were heated in standard aluminum pans using an underlying heating rate of 2°C/min from 10°C to 180°C in combination with a modulation period of 40 s and amplitude of .212°C under a nitrogen flow of 50 mL/min.
The XRPD analysis was performed using an X′-Pert Pro X-ray Diffractometer and X’Pert HighScore Plus version 2.2a software, both from Malvern Panalytical B.V. (Almelo, Netherlands) with Cu Kα radiation (λ = 1.54 Å). The acceleration voltage and current were 45 kV and 40 mA, respectively. Samples were analyzed in transmission mode between 4° and 40° 2θ applying a step size of .0167°/s and 400 s counting time.
2.2.2 Packaging
Prior to sterilization, the samples were packed in special pouches that are NO2 permeable. Indomethacin was packaged in Tyvek ® pouches with dimensions 11.9 × 9 cm from DuPont. The weight filled in the pouches varied between 110.7 mg and 553.0 mg. Subsequently, the pouches were closed with a rotary sealer HM 780 DC-V from Hawo Gerätebau GmbH (Mosbach, Germany) and stored at −80°C.
2.2.3 Sterilization
Before sterilization, all indomethacin samples were transported and stored at −20°C (NO2, Sterigenics Petit-Rechain) or −80°C (GI, Sterigenics Fleurus). After sterilization, everything was stored and transported to the analytical laboratory at 2°C–8°C. A non-processed sample of unmicronized and micronized indomethacin were sent to each facility to account for the effect of transport.
Sterilization with GI was performed at Sterigenics’ sterilization site in Fleurus (Belgium) on 17 December 2021. All samples were stored at -80 °C and irradiated at a radiation dose of 25 kGy.
Sterilization with NO2 was performed at Sterigenics’ sterilization site in Petit-Rechain (Belgium) on 15 April 2022. All samples were stored at −20°C. The sterilization was performed at 21 °C, with an NO2 concentration of 10 mg/L, a relative humidity of 30% and two NO2 pulses.
2.2.4 HPLC apparatus
All weighing was performed on a Secura 225D-1S analytical balance from Sartorius (Göttingen, Germany). A Bransonic 2,510 ultrasonic cleaner from Branson Ultrasonics Corporation (Danbury, United States) was used to dissolve indomethacin more quickly. An Eppendorf Research plus micropipette (100–1,000 μL) from Eppendorf (Hamburg, Germany) was used.
The analyses were performed on two HPLC devices with different detector types (UV-detector and diode array detector). To determine the content and impurities, HPLC device nr. 1 consisting of a P680 HPLC pump, an ASI-100 autosampler and UVD170U UV-detector all from Dionex (Sunnyvale, United States), was used. Chromeleon software version 6.60 from Dionex (Sunnyvale, United States) was used to collect chromatographic data. To determine the peak purity, HPLC device nr. 2 consisting of a L-2130 HPLC pump, a L-2200 autosampler and a L-2450 diode array detector, all from Hitachi Lachrom Elite (Tokyo, Japan), was used. EZChrom Elite software version 3.1.6. From VWR International (Radnor, United States) was used to collect chromatographic data. For the assay, the column was thermostated with an SC 100 heating immersion circulator in an S 21 P water bath from Thermo Fisher Scientific (Waltham, United States).
HPLC separation was achieved on a Kinetex C18 column 100 Å (4.6 × 100 mm, 2.6 μm particles) from Phenomenex (Torrance, United States) for content determination, a Kinetex Polar C18 column 100 Å (4.6 × 100 mm, 2.6 μm particles) from Phenomenex (Torrance, United States) for peak purity and a Nucleosil 100–5 C18 HD column (4.6 × 250 mm, 5 μm particles) from Macherey-Nagel (Düren, Germany) for impurities, respectively.
Microsoft’s Excel data analysis tool package was used to conduct the data analysis (Redmond, United States).
2.2.5 HPLC conditions
The indomethacin assay was used to investigate the effect of micronization and sterilization. The approach is based on the indomethacin assay described in the Ph. Eur. Monograph (Indometacin, 2021). The sample preparation was not altered, but the HPLC method, including the gradient mode and mobile phase, were slightly adjusted. Due to these adjustments, it was decided to verify the linearity and repeatability of the method. Supplementary Table S1 describes all HPLC conditions for assay determination. Additionally, the peak purity was checked with a slightly modified HPLC method on HPLC device nr. 2. Supplementary Table S2 describes these adjusted HPLC conditions. Finally, a third HPLC method found in the literature was used to visually check the impurities with the use of HPLC device nr. 1 (Hess et al., 2001). Supplementary Table S3 describes the HPLC conditions of the latter HPLC method.
2.2.5.1 Linearity and repeatability
For the linearity, five solutions of 25%, 50%, 75%, 100%, and 125% indomethacin were prepared from a 1,000% solution. The 100% solution is equivalent to .1 mg/mL indomethacin, which is also the concentration used for the assay determination. Each solution was injected in triplicate to determine linearity. With the obtained data, a calibration curve was drawn up in which the area under the peak was plotted as a function of the concentration. Linearity was evaluated based on three parameters. First, the determination coefficient (R2) was determined and this value requires to be greater than 0.999 to demonstrate linearity. Secondly, the 95% confidence interval (CI) of the intercept was determined, which should include zero. Thirdly, the residuals that should have a random distribution (Harris, 2016). If all requirements were met, a one-point calibration could be used. However, if the 95% CI of the intercept did not include zero, a two-point calibration curve would have to be constructed.
The repeatability of the instrument was verified by injecting the 100% solution six times and analyzing the area under the curve. To prove repeatability, the relative standard deviation (RSD) had to be less than 1% (Harris, 2016).
2.2.5.2 Assay
For each sample, two solutions were prepared with a concentration of 0.1 mg/mL. Each solution was injected 3 times. Thus, a total of six injections were performed per sample. The sample preparations of the reference and test samples were performed on the same day and analyzed in one sequence. This resulted in multiple reference solutions. After the HPLC analysis on device nr. 1, the peak areas were corrected for the weighed mass. The mean of six injections was always compared with the mean of the reference indomethacin. RSDs of up to 2% were achieved for all the samples.
2.2.5.3 Peak purity
The analyzed concentration was changed to 0.02 mg/mL. Peak purity was checked visually by generating, with HPLC device nr. 2, five overlaid spectra (200–400 nm) taken at different retention times for each condition.
2.2.5.4 Impurities
For each sample, two solutions were made with a concentration of 1 mg/mL. Each solution was injected twice on HPLC device nr. 1. Thus, a total of four injections were performed per sample. Visually, it was checked whether new peaks appeared that were not present in the blank or reference indomethacin sample.
In addition, a few impurities mentioned in the Ph. Eur. Indomethacin monograph (impurities B, F, G, H, I, and J) were injected separately in order to match them with the unidentified peaks in the samples. The most relevant impurities B, F and H were also spiked.
2.2.5.5 Statistical analysis
A t-test was used to look for statistically significant differences between the samples and the reference. Comparisons were performed pairwise. A 5% threshold of significance was used. Only the assay determination was subjected to statistical analysis. As an initial step, the equality of variances was investigated via an F-test. Then, the appropriate t-test was performed.
3 Results
3.1 Micronization
A color change was observed after micronization; the micronized samples all turned yellow, even though they started out as white non-micronized indomethacin. After micronization, the micronized samples became electrostatically charged, making weighing the powders difficult, especially the spray dried sample, which adhered to the Tyvec® pouches a lot.
SEM imaging (Figure 1) showed that the spray dried sample and cryomilling condition 1 and 2 samples were micronized, but cryomilling condition 3 and 4 samples were poorly micronized. Condition 3 has a few large particles, whereas condition 4 is almost non-micronized. It was decided that the samples cryomilled under conditions 3 and 4 will not be used. It is noteworthy that the particles are more spherical in the spray dried sample than in the cryomilled sample.
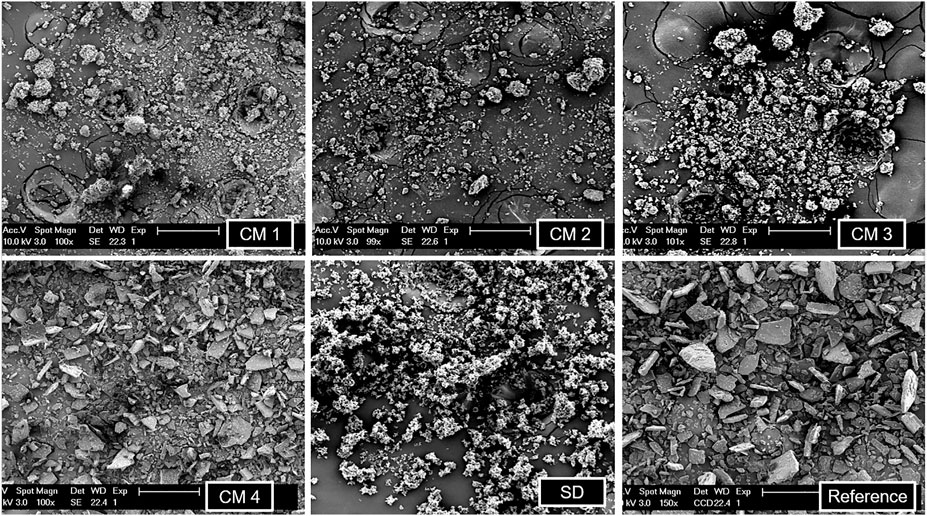
FIGURE 1. SEM imaging of all the cryomilled samples (CM 1, CM 2, CM 3, CM 4), spray dried sample (SD) and reference indomethacin.
In the DSC analysis (graphs not shown), the spray dried sample had the smallest melting enthalpy while the cryomilled condition 3 had the largest melting enthalpy of all micronized samples. This indicates that the spray dried sample was less crystalline than the other samples. Cryomilling conditions 1, 2 and 3 have melting enthalpies that are relatively near to each other. All the melting enthalpies of the micronized samples are smaller than for the reference indomethacin. The smaller the melting enthalpy, the smaller the degree of crystallinity. Table 4 summarizes the melting temperature and melting enthalpy of all the micronized samples and reference indomethacin.

TABLE 4. Melting temperature Tm and melting enthalpy ΔHm of all the cryomilled samples (CM 1, CM 2, CM 3, CM 4), spray dried sample (SD) and reference indomethacin.
XRPD diffractograms of all micronized samples are shown in Figure 2. The Bragg peaks show the highest intensity at cryomilled condition 1, while the spray dried sample shows no Bragg peaks. The smaller the crystals are in size, the lower and wider the Bragg peaks become, but this will only become obvious in case of nano-sized crystals. If there are no Bragg peaks at all, the product is X-ray amorphous. Since the mass was not taken into consideration in this XRPD analysis, the degree of crystallinity could not be determined quantitatively.
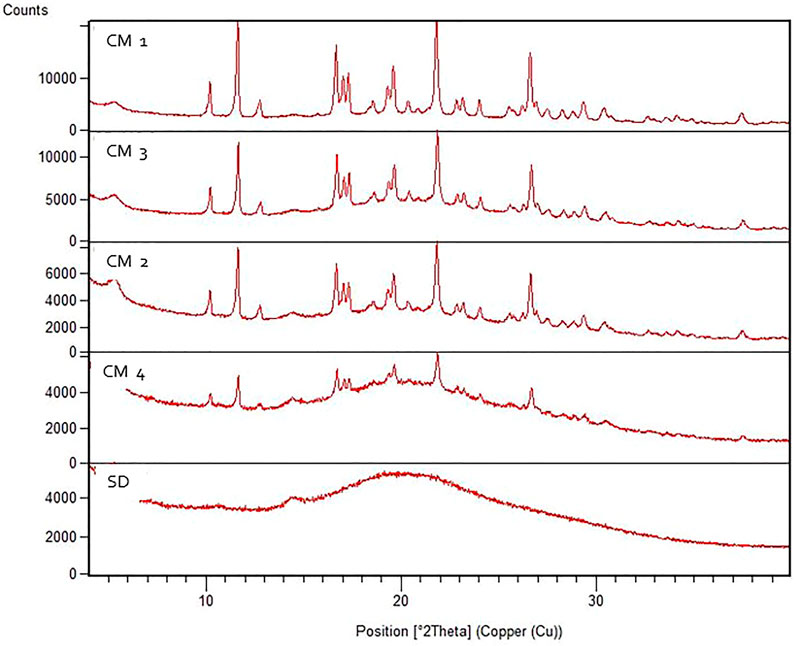
FIGURE 2. XRPD diffractograms of all the cryomilled samples (CM 1, CM 2, CM 3, CM 4) and spray dried sample (SD).
The spray dried sample and cryomilling condition 1 and 2 samples were selected for further analysis because, as mentioned above, SEM revealed that other samples were not well micronized.
3.2 HPLC
3.2.1 Linearity and repeatability
The linearity and repeatability of the adjusted method were determined as indicated in 2.2.5.1. Due to changes in the assay determination described in the monograph.
Linearity was evaluated based on three parameters, yielding an R2 of .9995 (Supplementary Figure S1), a 95% CI of [‒0.331038492; 0.873038492], and a residuals plot with random distribution (data not shown). All three requirements were met, proving the method’s linearity in the examined range, hence allowing the use of a one-point calibration.
The RSD of six injections was 0.25%, proving repeatability.
3.2.2 Gamma irradiation sterilization
3.2.2.1 Assay
The method specified in 2.2.5. was used to perform the assay. The changes introduced compared to the Ph. Eur. Method (Indometacin, 2021) were minor. In order to adapt to the used instrument, the gradient was slightly modified as well as the composition of mobile phases A and B. Due to a scarcity of sample X-CM-IMC-1, only one weighing and consequently three injections were performed. The results presented below are summarized in Table 5. The micronized samples show a decrease in content. The content of CM-IMC-1 shows a non-significant decrease, whereas CM-IMC-2 and SD-IMC show a significant decrease.
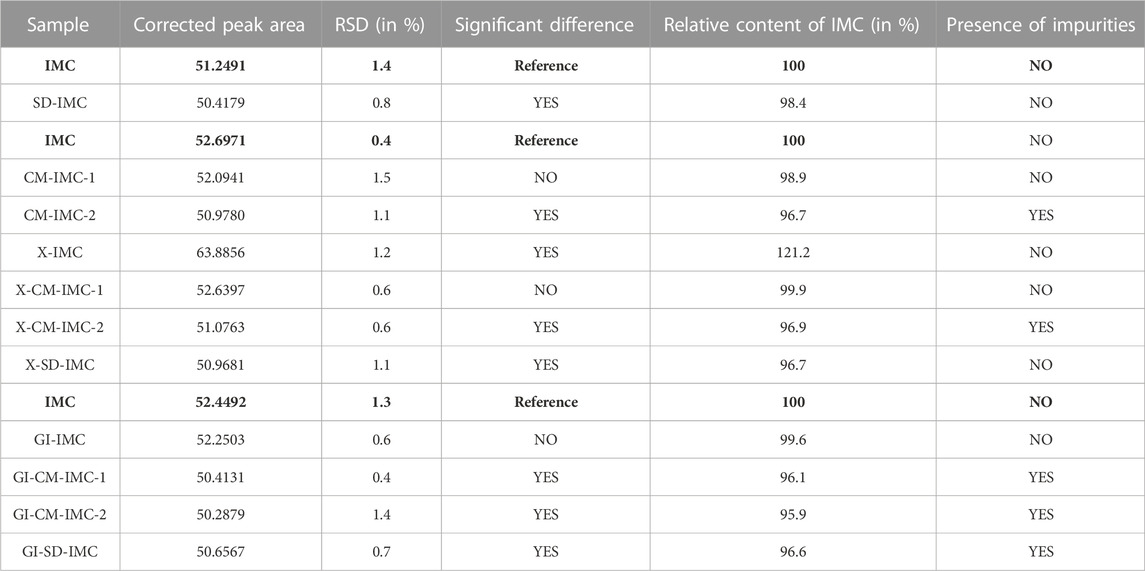
TABLE 5. Overview of the results of non-sterilized samples, transported samples (Fleurus) and GI sterilized samples. The reference was always freshly prepared per sequence. The samples were compared to the above-mentioned reference indomethacin, which is indicated in bold.
After transport to and from the sterilization site in Fleurus, samples X-CM-IMC-1, X-CM-IMC-2 and X-SD-IMC show the same results as CM-IMC-1, CM-IMC-2 and SD-IMC, respectively. Inexplicably, the content of sample X-IMC has significantly increased.
Following GI sterilization, sample GI-IMC shows a non-significant decrease in content, whereas all other irradiated samples show a significant decrease.
Supplementary Figure S2 shows an example chromatogram of indomethacin, recorded for sample GI-CM-IMC-2.
3.2.2.2 Peak purity
According to the approach given in 2.2.5.3, the peak purity of all samples was visually examined. To verify peak purity, the previous HPLC method was slightly modified. A similar column was used, the column was no longer heated, a diode array detector was used, and the analyzed concentration was changed to .02 mg/mL. The five spectra overlays for each sample were well aligned between 230 and 400 nm. All samples obtained were subjected to the same approach and showed identical spectra overlays. The spectrum overlay of indomethacin sample GI-CM-IMC-2 is depicted in Supplementary Figure S3 as an example.
3.2.2.3 Impurities
The presence of impurities was determined using the HPLC method described in 2.2.5. While looking for an HPLC method that could be performed quickly and easily, the method described by Hess et al. to determine impurities of indomethacin, was selected because it could detect more impurities (Hess et al., 2001). For all micronized samples, transported to Fleurus, and GI sterilized or not, results are shown in Table 5. Impurities are visibly present in samples CM-IMC-2, X-CM-IMC-2, GI-CM-IMC-1, GI-CM-IMC-2 and GI-SD-IMC. Other samples do not show any impurities in the chromatograms. The peaks of the impurities are higher in sample GI-CM-IMC-2 than in samples CM-IMC-2 and X-CM-IMC-2. The chromatogram of sample GI-CM-IMC-2 is shown in Figure 3, in comparison with reference indomethacin.
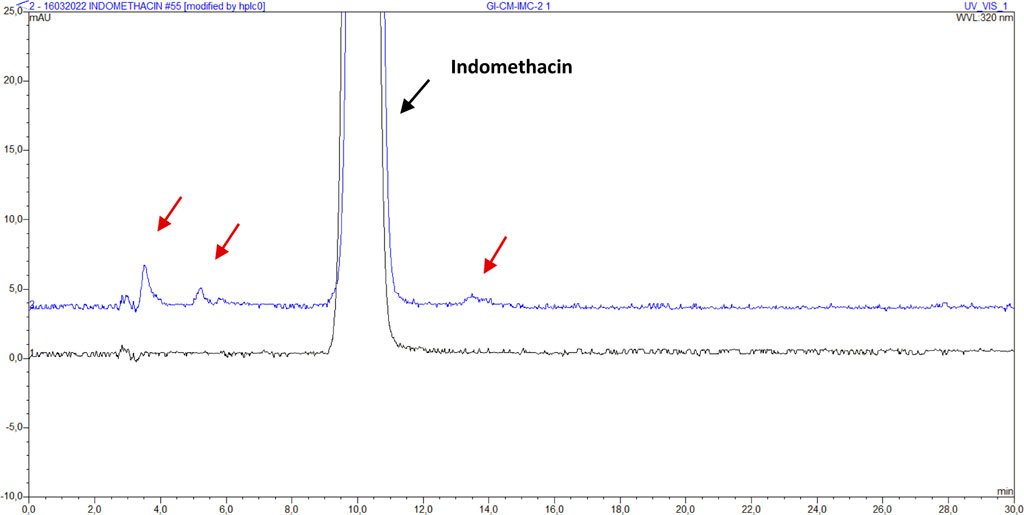
FIGURE 3. Chromatogram of indomethacin sample IMC (bottom, black) and GI-CM-IMC-2 (top, blue) with impurities. The red arrows indicate the visible impurities.
3.2.3 Nitrogen dioxide sterilization
All micronized samples changed color after being sterilized with NO2 gas. Although all samples darkened, the cryomilled samples darkened more than the spray dried sample. Three weeks after sterilization, the color had not changed.
3.2.3.1 Assay
The method specified in 2.2.5. Was used to perform the assay. The results presented below are summarized in Table 6. After transport to and from the sterilization site in Petit-Rechain, samples NP-CM-IMC-1 and NP-SD-IMC show a non-significant increase in content. The content of NP-IMC shows a non-significant decrease, whereas NP-CM-IMC-2 shows a significant decrease.
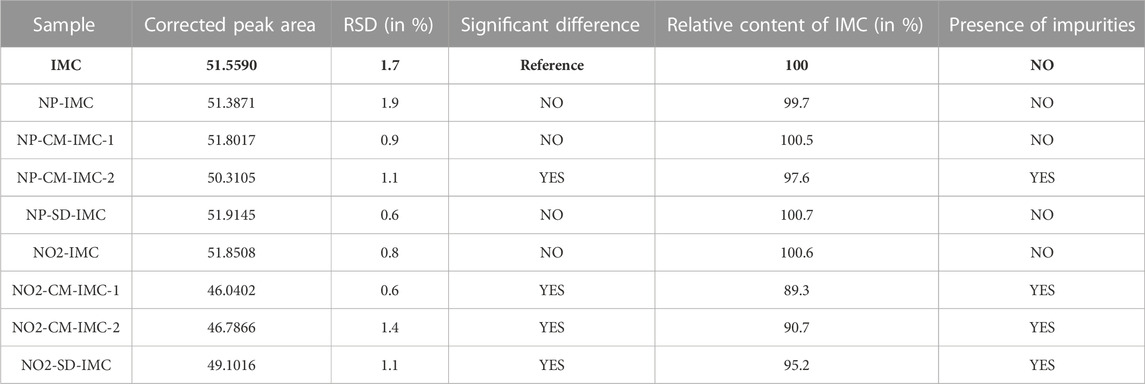
TABLE 6. Overview of the results of transported samples (Petit-Rechain) and NO2 sterilized samples. The reference was always freshly prepared per sequence. The samples were compared to the above-mentioned reference indomethacin, which is indicated in bold.
Following NO2 sterilization, sample NO2-IMC shows a non-significant increase in content, whereas all other sterilized samples show a significant decrease. Impurities in the micronized samples can be noticed on the chromatograms for content determination after sterilizing with NO2. Figure 4 shows the chromatogram of indomethacin sample NO2-CM-IMC-2 in comparison with reference indomethacin.
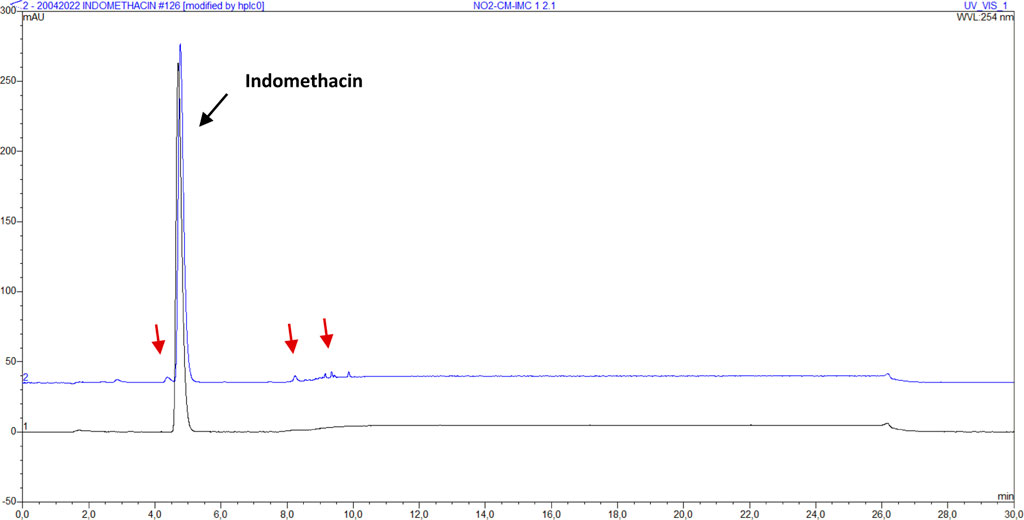
FIGURE 4. Assay chromatogram of indomethacin sample IMC (bottom, black) and NO2-CM-IMC-2 (top, blue). The red arrows indicate the visible impurities.
3.2.3.2 Peak purity
According to the approach given in 2.2.5.3, the peak purity of all samples was visually examined. The five spectra overlays for each sample are perfectly aligned between 230 and 400 nm. All samples obtained using the same approach have similar spectra overlays. The spectrum of indomethacin sample NO2-CM-IMC-2 is depicted in Supplementary Figure S4 as an example.
3.2.3.3 Impurities
The presence of impurities was determined using the HPLC method described in 2.2.5. The presence of impurities per sample for transported (Petit-Rechain) and NO2 sterilized samples is shown in Table 6. Impurities are visible in the chromatograms of samples NP-CM-IMC-2, NO2-CM-IMC-1, NO2-CM-IMC-2 and NO2-SD-IMC. Other samples show no visual impurities. The peaks of the impurities are higher in sample NO2-CM-IMC-2 than in sample NP-CM-IMC-2. After NO2 sterilization, there are more and higher impurity peaks than after gamma irradiation. The chromatogram of sample GI-CM-IMC-2 is shown in Figure 5, in comparison with reference indomethacin.
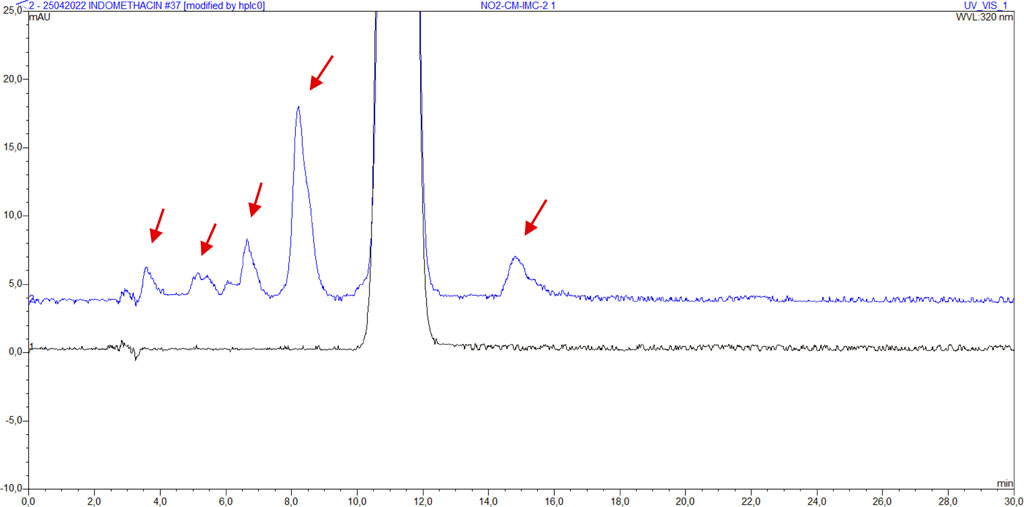
FIGURE 5. Chromatogram of indomethacin sample IMC (bottom, black) and NO2-CM-IMC-2 (top, blue) with impurities. The red arrows indicate the visible impurities.
Following injection of indomethacin impurities B, F, G, H, I and J, it was discovered that impurities B, F and H seem to share the same retention times as some of the unidentified impurities in sample NO2-CM-IMC-2 (Figure 6). Therefore, they were spiked into the sample. Only impurities B and F co-eluted with the respective impurities present in the sample.
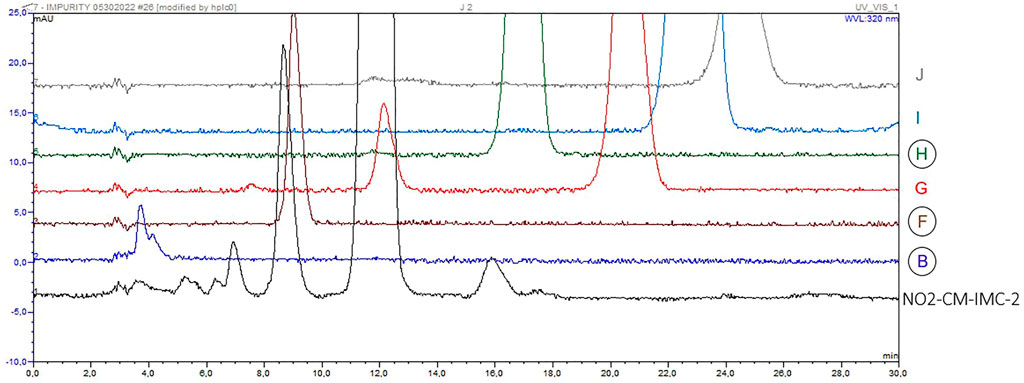
FIGURE 6. Chromatograms of indomethacin sample NO2-CM-IMC-2 (black) with unidentified impurities and (from bottom to top) impurities B (blue), F (brown), G (red), H (green), I (light blue) and J (grey).
4 Discussion
4.1 Experimental findings
All peaks of the assay can be considered to be pure based on the results of the HPLC method for peak purity, and so conclusions can be drawn from the obtained chromatograms for content.
After micronization with a cryomill, a drop in content was noted before the samples were sterilized (Table 5). In sample CM-IMC-2, there was a considerable drop in content. It can therefore be assumed that cryomilling causes indomethacin to break down. The observed impurities in the chromatogram of sample CM-IMC-2 confirm this. The content of the spray dried sample has decreased significantly (Table 5); however the impurities chromatogram shows no visible impurities, which is contradictory.
After transport to and from the sterilization site in Fleurus, samples X-CM-IMC-1, X-CM-IMC-2 and X-SD-IMC show the same results as CM-IMC-1, CM-IMC-2 and SD-IMC, respectively (Table 5). This demonstrates that no changes to the content occurred during transport. A strange occurrence is that the content of sample X-IMC has significantly increased. This cannot be explained by sample transportation, storage, or preparation because all samples were transported, stored, and processed at the same time and in the same manner. However, during the optimization of the analytical method, sample X-IMC always showed a slight drop in content. It may thus be assumed that the increase in X-IMC content is most likely due to chance.
Following GI sterilization, sample GI-IMC shows a non-significant decrease in content, whereas all other irradiated samples show a significant decrease (Table 5). As a result, it can be stated that GI sterilization affects micronized samples differently. The impurity chromatograms also support this statement, as impurities can be seen in all micronized samples but not in the non-micronized sample.
After transport to and from the sterilization site in Petit-Rechain, samples NP-CM-IMC-1 and NP-SD-IMC show a non-significant increase in content (Table 6). The content of NP-IMC shows a non-significant decrease, whereas NP-CM-IMC-2 shows a significant decrease. It may be inferred that the contents of all samples NP-IMC, NP-CM-IMC-1, and NP-SD-IMC did not alter during transport based on the results.
Following NO2 sterilization, sample NO2-IMC shows a non-significant increase in content, whereas all other sterilized samples show a significant decrease (Table 6). As a result, it may be concluded that NO2 sterilization affects micronized samples differently. This is confirmed by the impurities which were found in all micronized samples but not in the non-micronized sample, as seen on the impurity chromatograms. Following NO2 sterilization, the impurity peaks on the impurity chromatogram were larger than after GI sterilization. Impurity peaks were even visible on the chromatogram of the assay. Since NO2 gas is a strong oxidizer, the impurities could have arisen after oxidation of indomethacin.
After spiking indomethacin impurities B and F, it was shown that the respective peak heights increased. It may tentatively be concluded that impurities B and F were formed by NO2 treatment. Impurity B is formed by a cleavage of the amide bond in indomethacin. The latter was also put forth as a possible degradation pathway in a study on the E-beam irradiation of indomethacin in solution (Duan et al., 2022). Impurity F is a newly formed hydrazide (4-chloro-N’-(4-chlorobenzoyl)-N-(4-methoxyphenyl)-benzohydrazide). The retention time of spiked impurity H slightly differed from the observed sample impurity. Impurity H is the methyl ester of indomethacin.
4.2 Implications for future research
The findings show that micronized indomethacin samples are more susceptible to sterilization degradation than non-micronized samples. This could be further investigated and tentatively explained by looking at the presence of radicals in the various sterilization conditions. It has already been demonstrated that certain types of radicals formed during E-beam irradiation of indomethacin in aqueous solution could degrade indomethacin in the frame of pharmaceutical wastewater treatment (Duan et al., 2022).
In addition, we believe that dissipation measurements by atomic force microscopy could give more insight into the surface amorphicity of micronized samples. There could appear to be a relationship between the surface structure of a sample and its behavior upon sterilization (BadalTejedor et al., 2018).
The obtained results also imply that the micronization techniques might need to be adapted, since some samples already showed significant content decreases before sterilization.
5 Conclusion
It can be concluded that micronized indomethacin samples show more degradation and are thus more susceptible to degradation after sterilization with gamma rays and nitrogen dioxide gas. Nitrogen dioxide gas degrades micronized indomethacin more than gamma rays. This project seems to be a good starting point for a more in-depth study of the effects of sterilization on micronized APIs, thus paving the way towards their successful and tailored sterilization.
Data availability statement
The raw data supporting the conclusion of this article will be made available by the authors, without undue reservation.
Author contributions
Conceptualization AD, GV, AV, and EH; Data curation KK and AM; Formal analysis KK, BA, and AM; Funding acquisition AD, AV, and EH; Investigation KK, BC, AG, BA, and AM; Methodology KK, BC, AG, BA, and AM; Project administration AV and EH; Resources AD, GV, AV, and EH; Supervision GV, AV, and EH; Validation GV, AV, and EH; Visualization KK; Roles/Writing—original draft KK; Writing—review and editing BC, AG, BA, AM, AD, GV, AV, and EH.
Conflict of interest
The authors declare that the research was conducted in the absence of any commercial or financial relationships that could be construed as a potential conflict of interest.
Publisher’s note
All claims expressed in this article are solely those of the authors and do not necessarily represent those of their affiliated organizations, or those of the publisher, the editors and the reviewers. Any product that may be evaluated in this article, or claim that may be made by its manufacturer, is not guaranteed or endorsed by the publisher.
Supplementary material
The Supplementary Material for this article can be found online at: https://www.frontiersin.org/articles/10.3389/frans.2022.1028752/full#supplementary-material
References
Ast, Steris. Gamma irradiation sterilization process & services. [cited 2021 Nov 22]. Available from: https://www.steris-ast.com/services/gamma-irradiation 2021, [accessed November 22, 2021].
Badal Tejedor, M., Pazesh, S., Nordgren, N., Schuleit, M., Rutland, M. W., Alderborn, G., et al. (2018). Milling induced amorphisation and recrystallization of α-lactose monohydrate. Int. J. Pharm. 537, 140–147. doi:10.1016/j.ijpharm.2017.12.021
Bermúdez, E., Ferng, S. F., Castro, C. E., and Mustafa, M. G. (1999). DNA strand breaks caused by exposure to ozone and nitrogen dioxide. Environ. Res. 81 (1), 72–80. doi:10.1006/enrs.1999.3955
Bürkle GmbH (2021). What is gamma ray sterilisation? https://www.buerkle.de/en/knowhow/productinformation/samplers/gamma-ray-sterilisation (accessed November 22, 2021).
Caulfield, J. L., Wishnok, J. S., and Tannenbaum, S. R. (1998). Nitric oxide-induced deamination of cytosine and guanine in deoxynucleosides and oligonucleotides. J. Biol. Chem. 273 (21), 12689–12695. doi:10.1074/jbc.273.21.12689
Chaumeil, J. C. (1998). Micronization: A method of improving the bioavailability of poorly soluble drugs. Methods Find. Exp. Clin. Pharmacol. 20 (3), 211–215.
da Silva Aquino, K. A. (2012). “Sterilization by gamma irradiation,” in Gamma radiation. Editor F. Adrovic (Jakarta Selatan: InTech), 171–206. doi:10.5772/34901
Dhiman, A., and Prabhakar, P. K. (2021). Micronization in food processing: A comprehensive review of mechanistic approach, physicochemical, functional properties and self-stability of micronized food materials. J. Food Eng. 292, 110248. doi:10.1016/j.jfoodeng.2020.110248
Di, L., Fish, P. V., and Mano, T. (2012). Bridging solubility between drug discovery and development. Drug Discov. Today 17 (9–10), 486–495. doi:10.1016/j.drudis.2011.11.007
Duan, Y., Zhou, W., Shao, H., Zhang, Z., Shi, W., and Xu, G. (2022). Electron beam induced degradation of indomethacin in aqueous solution: Kinetics, degradation mechanism, and toxicity assessment. Envir Sci. Poll. Res. 29, 19283–19294. doi:10.1007/s11356-021-16348-2
European Medicines Agency (2019). Guideline on the sterilisation of the medicinal product, active substance. excipient Prim. Contain. 31, 1–25. https://www.ema.europa.eu/en/documents/scientific-guideline/guideline-sterilisation-medicinal-product-active-substance-excipient-primary-container_en.pdf (accessed October 18, 2021).
Fda, (2021). Center for Drug Evaluation and Research. M9 BIOPHARMACEUTICS CLASSIFICATION SYSTEM-BASED BIOWAIVERS.
Freund, Vector (2021). Spray drying. https://www.freund-vector.com/technology/spray-drying (accessed November 22, 2021).
Görsdorf, S., Appel, K. E., Engeholm, C., and Obe, G. (1990). Nitrogen dioxide induces DNA single-strand breaks in cultured Chinese hamster cells. Carcinogenesis 11 (1), 37–41. doi:10.1093/carcin/11.1.37
Harrell, C. R., Djonov, V., Fellabaum, C., and Volarevic, V. (2018). Risks of using sterilization by gamma radiation: The other side of the coin. Int. J. Med. Sci. 15 (3), 274–279. doi:10.7150/ijms.22644
Harris, D. C. (2016). Quantitative chemical analysis. 9th. NY, USA: United States of America: W.H. Freeman and Company, 101–102.
Hasanain, F., Guenther, K., Mullett, W. M., and Craven, E. (2014). Gamma sterilization of pharmaceuticals--a review of the irradiation of excipients, active pharmaceutical ingredients, and final drug product formulations. PDA J. Pharm. Sci. Technol. 68 (2), 113–137. doi:10.5731/pdajpst.2014.00955
Hess, S., Teubert, U., Ortwein, J., and Eger, K. (2001). Profiling indomethacin impurities using high-performance liquid chromatography and nuclear magnetic resonance. Eur. J. Pharm. Sci. 14 (4), 301–311. doi:10.1016/S0928-0987(01)00198-1
Indometacin - European Pharmacopoeia 10.5. Strasbourg: European Directorate for the Quality of Medicines & HealthCare (2021) monograph 04/2019:0092.
Junghare, H., Hamjade, M., Patil, C. K., Girase, S. B., and Lele, M. M. (2017). A review on cryogenic grinding. Int. J. Curr. Eng. Technol. 7, 420–423.
McDonnell, G., and Hansen, J. M. (2020). Block’s disinfection, sterilization, and preservation. Philadelphia: Lippincott Williams & Wilkins, 1500.
Merkli, A., Heller, J., Tabatabay, C., and Gurny, R. (1994). Gamma sterilization of a semi-solid poly(ortho ester) designed for controlled drug delivery--validation and radiation effects. Pharm. Res. 11 (10), 1485–1491. doi:10.1023/A:1018964511053
Moschwitzer, J. Method for producing ultrafine submicronic suspensions (2006). www.pharmtech.com [accessed November 22, 2021].
Nikolakakis, I., and Partheniadis, I. (2017). Self-Emulsifying granules and pellets: Composition and formation mechanisms for instant or controlled release. Pharmaceutics 9 (4), 50. doi:10.3390/pharmaceutics9040050
Noxilizer, Inc. (2022). Low temperature sterilization: Current methods including nitrogen dioxide. acessed https://www.youtube.com/watch?v=ytjIdlHtYeU February 17, 2022).
Noxilizer, Inc. (2022). Nitrogen dioxide sterilization. https://www.noxilizer.com (accessed February 17, 2022).
O’Brien, M., McCauley, J., and Cohen, E. (1984). “Indomethacin,” in Analytical profiles of drug substances. Editor K. Florey (Orlando, FL: Academic Press), 13, 211–238.
Overview of the nitrogen dioxide sterilization process. https://cdn.thomasnet.com/ccp/30718984/166233.pdf 2022, [Accessed February 17, 2022].
RETSCH (2021). Cryomill - the perfect mill for cryogenic grinding. https://www.retsch.com/products/milling/ball-mills/mixer-mill-cryomill/function-features (accessed November 22, 2021).
Rutala, W. A., and Weber, D. J. (2013). Disinfection and sterilization: An overview. Am. J. Infect. Control 41 (5 Suppl. l), S2–S5. doi:10.1016/j.ajic.2012.11.005
Santos, D., Maurício, A. C., Sencadas, V., Santos, J. D., Fernandes, M. H., and Gomes, P. S. Spray drying: An Overview. Biomater - Phys Chem - Washington, DC, USA, New Ed. (2018). doi:doi:10.5772/intechopen.72247
Silindir, M., and Özer, A. Y. (2009). Sterilization methods and the comparison of E-beam sterilization with gamma radiation sterilization. Fabad J. Pharm. Sci. 34, 43–53.
Trends in radiation sterilization of health care products. Vienna: International Atomic Energy Agency (2008). 261 p.
Tuttnauer. Sterilization by gamma irradiation. https://tuttnauer.com/blog/sterilization-by-gamma-irradiation 2021, [accessed November 22, 2021].
Vandana, K. R., Prasanna Raju, Y., Harini Chowdary, V., Sushma, M., and Vijay Kumar, N. (2014). An overview on in situ micronization technique - an emerging novel concept in advanced drug delivery. Saudi Pharm. J. 22 (4), 283–289. doi:10.1016/j.jsps.2013.05.004
Verma, A., and Singh, S. V. (2015). Spray drying of fruit and vegetable juices—a review. Crit. Rev. Food Sci. Nutr. 55 (5), 701–719. doi:10.1080/10408398.2012.672939
Villamena, F. A. (2016). “Chemistry of reactive species,” in Reactive species detection biology (New York: Elsevier), 13–64.
Keywords: micronization, sterilization, gamma irradiation sterilization, nitrogen dioxide sterilization, HPLC (high-performance/pressure liquid chromatography), indomethacin
Citation: Krupianskaya K, Croonenborghs B, Gillet A, Appeltans B, Meyers A, DeMent A, Van den Mooter G, Van Schepdael A and Haghedooren E (2023) Sterilization of micronized indomethacin. Front. Anal. Sci. 2:1028752. doi: 10.3389/frans.2022.1028752
Received: 26 August 2022; Accepted: 22 December 2022;
Published: 06 January 2023.
Edited by:
Eric Deconinck, Sciensano, BelgiumReviewed by:
Leandro Augusto Calixto, Federal University of São Paulo, BrazilTomasz Baczek, Medical University of Gdansk, Poland
Copyright © 2023 Krupianskaya, Croonenborghs, Gillet, Appeltans, Meyers, DeMent, Van den Mooter, Van Schepdael and Haghedooren. This is an open-access article distributed under the terms of the Creative Commons Attribution License (CC BY). The use, distribution or reproduction in other forums is permitted, provided the original author(s) and the copyright owner(s) are credited and that the original publication in this journal is cited, in accordance with accepted academic practice. No use, distribution or reproduction is permitted which does not comply with these terms.
*Correspondence: Ann Van Schepdael, YW5uLnZhbnNjaGVwZGFlbEBrdWxldXZlbi5iZQ==
 Karyna Krupianskaya
 Bart Croonenborghs2
 Anke Meyers
 Aaron DeMent
 Ann Van Schepdael